fertility levels and trends as assessed in the 2012 revision of
TRANSCRIPT
E c o n o m i c &
Fertility Levels and Trends as Assessed in the 2012 Revision of World Population Prospects
S o
c i a
l A f f a
i r s

ST/ESA/SER.A/349
December 2013
Department of Economic and Social Affairs Population Division
Fertility Levels and Trends as Assessed in the 2012 Revision of World Population Prospects
United Nations New York, 2013

DESA The Department of Economic and Social Affairs of the United Nations Secretariat is a vital interface between global policies in the economic, social and environmental spheres and national action. The Department works in three main interlinked areas: (i) it compiles, generates and analyses a wide range of economic, social and environmental data and information on which States Members of the United Nations draw to review common problems and take stock of policy options; (ii) it facilitates the negotiations of Member States in many intergovernmental bodies on joint courses of action to address ongoing or emerging global challenges; and (iii) it advises interested Governments on the ways and means of translating policy frameworks developed in United Nations conferences and summits into programmes at the country level and, through technical assistance, helps build national capacities.
Note The designations employed in this report and the material presented in it do not imply the expression of any opinion whatsoever on the part of the Secretariat of the United Nations concerning the legal status of any country, territory, city or area or of its authorities, or concerning the delimitation of its frontiers or boundaries. This publication has been issued without formal editing.
Suggested citation: United Nations, Department of Economic and Social Affairs, Population Division (2013). Fertility Levels and Trends as Assessed in the 2012 Revision of World Population Prospects (United Nations publication). ST/ESA/SER.A/349 UNITED NATIONS PUBLICATION Copyright © United Nations 2013 All rights reserved

iii
PREFACE The Population Division of the Department of Economic and Social Affairs of the United Nations Secretariat is responsible for providing the international community with up-to-date and scientifically objective information on population and development. The Population Division provides guidance on population and development issues to the United Nations General Assembly, the Economic and Social Council and the Commission on Population and Development and undertakes regular studies on population levels and trends, including trends of fertility, marriage and union formation, and family planning, changes in population policies and the interrelationships between population and development. As part of its work on fertility, the Population Division estimates and projects levels and trends in total fertility and the timing of childbearing for all countries and areas of the world. This report is a concise analysis of fertility levels and trends in World Population Prospects: The 2012 Revision (http://esa.un.org/unpd/wpp/index.htm), the official United Nations publication of population estimates and projections. The population estimates, which are prepared biennially by the Population Division of the Department of Economic and Social Affairs of the United Nations Secretariat, provide the standard and consistent set of population figures that are used throughout the United Nations system as the basis for activities requiring population information. This report was written by Ms. Vladimíra Kantorová with inputs from Ms. Ann Biddlecom and Ms. Petra Nahmias, all of whom are in the Fertility and Family Planning Section of the Population Division.
This report is available on the Population Division’s website at www.unpopulation.org. For further information about this report, please contact the office of the Director, Population Division, Department of Economic and Social Affairs, United Nations, New York, 10017, by telephone (+1 212) 963-3179 or email [email protected].

This page is intentionally left blank
v
CONTENTS Page
PREFACE ........................................................................................................................................................ iii EXPLANATORY NOTES .................................................................................................................................... vi EXECUTIVE SUMMARY ............... ................................................................................................................... vii Chapter I. FERTILITY ESTIMATES FROM 1950 TO 2010 .................................................................................. 1
A. Total fertility ............................................................................................................................. 1 B. Timing of childbearing ............................................................................................................. 12 C. Total fertility and the net reproduction rate ............................................................................. 15 II. FERTILITY PROJECTIONS FROM 2010 TO 2100 ................................................................................. 16 A. Total fertility ............................................................................................................................. 16 B. Fertility as a demographic component of future population growth ......................................... 19
CONCLUSION .................................................................................................................................................. 20 REFERENCES .................................................................................................................................................. 21
TEXT TABLES
I.1. Total fertility for the world, development groups and major areas, by selected time periods ............... 2 I.2. Distribution of the world’s population and countries or areas according to the level of total fertility in selected periods (medium variant). ................................................................................................... 3 II.1. Projected total fertility for the world, development groups and major areas, by selected variants, 2045-2050 and 2095-2100 ................................................................................................................... 16
TEXT FIGURES
I.1. Total fertility trajectories for the world and major areas, 1950-2100 (medium variant) ........................ 2 I.2. Total fertility, 1950-1955 and 1970-1975 .............................................................................................. 4 I.3. Proportion of the world’s population living in countries with total fertility below a specific level, by selected time periods. ....................................................................................................................... 5 I.4. Total fertility for countries by major area, 1950-1955 and 1970-1975 .................................................. 6 I.5. Total fertility for countries by major area, 1970-1975 and 1990-1995 .................................................. 7 I.6. Total fertility, 1990-1995 and 2010-2015 .............................................................................................. 9 I.7. Total fertility for countries by major area, 1990-1995 and 2010-2015 .................................................. 10 I.8. Mean age at childbearing (years), world and major areas, 1990-1995 to 2010-2015 ............................ 12 I.9. Adolescent birth rate for countries by major area, 1990-1995 and 2010-2015 ...................................... 13 I.10. Age-specific fertility rate for women aged 20-24 for countries by major area, 1990-1995 and 2010-2015 ................................................................................................................... 14 I.11. Total fertility and the net reproduction rate, countries and areas, 1970-1975 and 2010-2015 ............. 15 II.1. Total fertility for countries by major area, 2010-2015 and 2030-2035 ................................................. 17 II.2. Contribution of total fertility to population growth as a proportion of total population in 2010, 2010-2100 (per cent) ............................................................................................................................ 18
EXPLANATORY NOTES The following symbols have been used in the tables throughout this report:
Two dots (..) indicate that data are not available or are not reported separately. A hyphen (-) indicates that the item is not applicable. A minus sign (-) before a figure indicates a decrease. A full stop (.) is used to indicate decimals. Use of a hyphen (-) between years, for example, 1995-2000, signifies the full period involved. Numbers and percentages in tables do not necessarily add to totals because of rounding.
References to countries, territories and areas: The designations employed and the material in this publication do not imply the expression of any opinion whatsoever on the part of the Secretariat of the United Nations concerning the legal status of any country, territory or area or its authorities, or concerning the delimitation of its frontiers or boundaries. The designations “developed” and “developing” regions are intended for statistical convenience and do not necessarily express a judgement about the stage reached by a particular country or area in the development process. The term “country” as used in this publication also refers, as appropriate, to territories or areas. Developed regions comprise all regions of Europe plus Northern America, Australia/New Zealand and Japan. The term “developed countries” is used to designate countries in the developed regions.
Developing regions comprise all regions of Africa, Asia (excluding Japan) and Latin America and the Caribbean, as well as Melanesia, Micronesia and Polynesia. The developing regions are further divided into least developing countries and other developing countries. The term “developing countries” is used to designate countries in the developing regions. As of June 2013, the group of least developed countries or areas comprised 49 countries: Afghanistan, Angola, Bangladesh, Benin, Bhutan, Burkina Faso, Burundi, Cambodia, Central African Republic, Chad, Comoros, Democratic Republic of the Congo, Djibouti, Equatorial Guinea, Eritrea, Ethiopia, Gambia, Guinea, Guinea-Bissau, Haiti, Kiribati, Lao People's Democratic Republic, Lesotho, Liberia, Madagascar, Malawi, Mali, Mauritania, Mozambique, Myanmar, Nepal, Niger, Rwanda, Samoa, São Tomé and Príncipe, Senegal, Sierra Leone, Solomon Islands, Somalia, South Sudan, Sudan, Timor-Leste, Togo, Tuvalu, Uganda, United Republic of Tanzania, Vanuatu, Yemen and Zambia. These countries or areas are also included in the developing regions. Names and compositions of geographical areas follow those of “Standard country or area codes for statistical use” (ST/ESA/STAT/SER.M/49/Rev.3), available at http://unstats.un.org/unsd/methods/m49/m49.htm.
vii
EXECUTIVE SUMMARY
Since the 1950s the world has experienced profound declines in fertility and an increased postponement of the start of childbearing, though the level and pace of change in fertility have varied markedly among countries and areas. Historical trends in the timing and pace of fertility decline inform projections of future fertility levels, and the path that fertility is projected to take will have crucial implications for sustainable development and the health and well-being of individuals. The report Fertility Levels and Trends as Assessed in the 2012 Revision of World Population Prospects, prepared by the Population Division of the Department of Economic and Social Affairs of the United Nations Secretariat, presents a concise description of current fertility levels around the world, historical trends in the level and timing of fertility and projections of fertility to 2100, including the relative impact of fertility on population growth. The key findings of this report are: 1. Total fertility worldwide is currently about 2.5 children per woman but this masks considerable diversity, with 12 countries or areas with total fertility above six children per women while 75 have below-replacement level fertility. The least developed countries have the highest total fertility at above 4.5 children per woman. 2. Fertility has declined worldwide to unprecedented levels, from 5.0 children per woman in 1950-1955 to 2.5 children per woman in 2005-2010. The pace of change was particularly rapid from 1970-1975 to 1990-1995 when total fertility fell from 4.4 to 3.0 children per woman. 3. Fertility declines were significant in all regions with substantial and sustained fertility declines in Asia and Latin America and the Caribbean in particular, where total fertility declined from 5.8 and 5.9 children per woman, respectively, in 1950-1955 to about 2.3 children per woman in 2005-2010. The decline in fertility in Africa has been less rapid, declining from 6.6 children per woman in 1950-1955 to 4.9 children per woman in 2005-2010. 4. Nearly half of the world’s population currently lives in countries or areas with below-replacement level fertility, with some countries reaching historically unprecedented low fertility levels below a total fertility of 1.3 children per woman. Conversely, nearly thirteen per cent of the world’s population currently lives in countries or areas with total fertility four or more children per woman. 5. Childbearing is being increasingly postponed to older ages and the adolescent birth rate has declined in all regions. Postponement of childbearing has become a feature of Europe, Northern America and parts of Asia with an increasing mean age of childbearing. In Africa and Latin America and the Caribbean, there has been little change in the mean age of childbearing and the adolescent birth rate has also remained high in both these regions. 6. The total fertility of the world is projected to decrease to 2.2 children per woman by 2045-2050 and further decrease to 2.0 children per woman by 2095-2100 under the medium variant fertility projection. Europe is the only region where fertility is projected to increase (to 1.8 children per woman in 2045-2050) whereas all the other regions are projected to see further declines in fertility. Total fertility in Africa is projected to decline to 3.1 children per woman by 2045-2050 while all other regions are projected to have below-replacement total fertility by that time. 7. Fertility is a major contributor to population growth in many countries with projected fast population growth. In other countries, with projected total fertility below replacement, the fertility component will have a negative impact on population size over the period 2010-2100. In absolute terms, the impact of the fertility component by 2100 varies from an additional 647 million people in Nigeria to a decline of 425 million people in China.

This page is intentionally left blank
United Nations Department of Economic and Social Affairs/Population Division Fertility Levels and Trends as Assessed in the 2012 Revision of World Population Prospects 1
I. FERTILITY ESTIMATES FROM 1950 TO 2010
The fertility estimates produced by the Population Division in the 2012 Revision of World Population Prospects (United Nations, 2013a) cover the period from 1950 to the most current estimates. The period 2005-2010 is the most recent period for which the majority of countries had fertility data available and thus is used to describe current levels of fertility around the world. For the period 2010-2015, only a limited number of countries, usually those with vital registration systems, had data for 2010 and 2011. Hence, total fertility for the period 2010-2015 is a projection for many countries. Methodological information on the analytical approach, assumptions and data used to produce the fertility estimates and projections in the 2012 Revision of World Population Prospects are described in a separate report (see United Nations, 2013b).
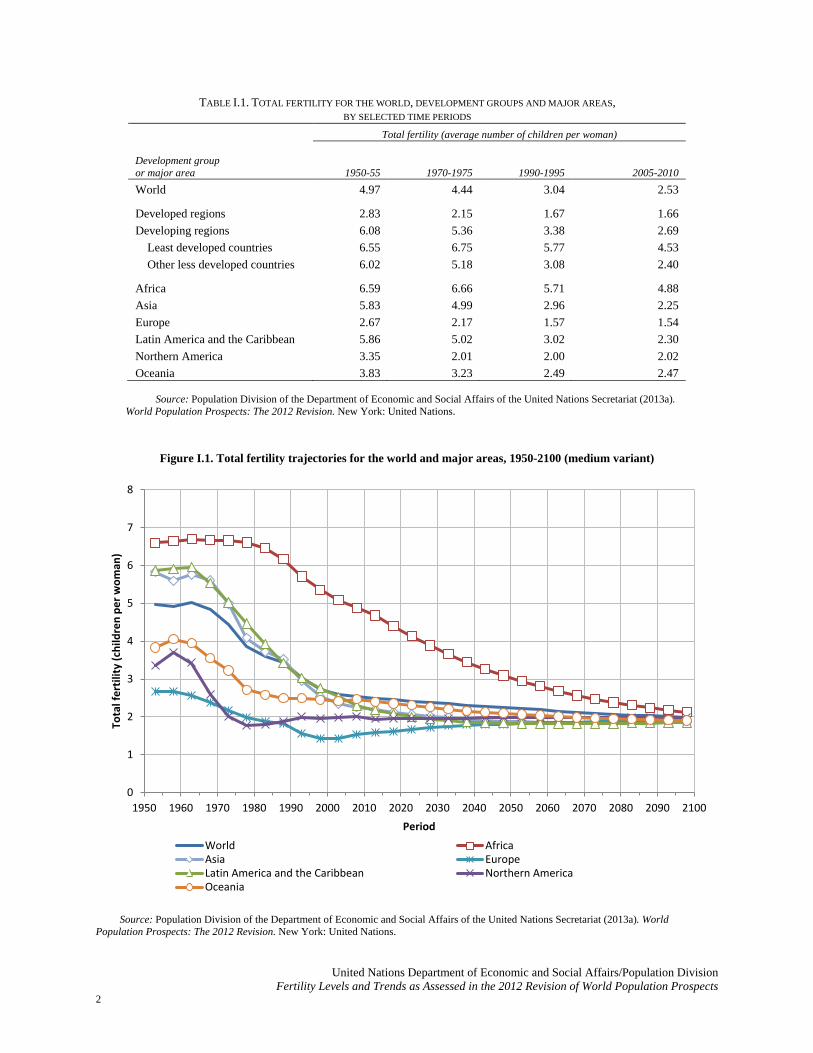
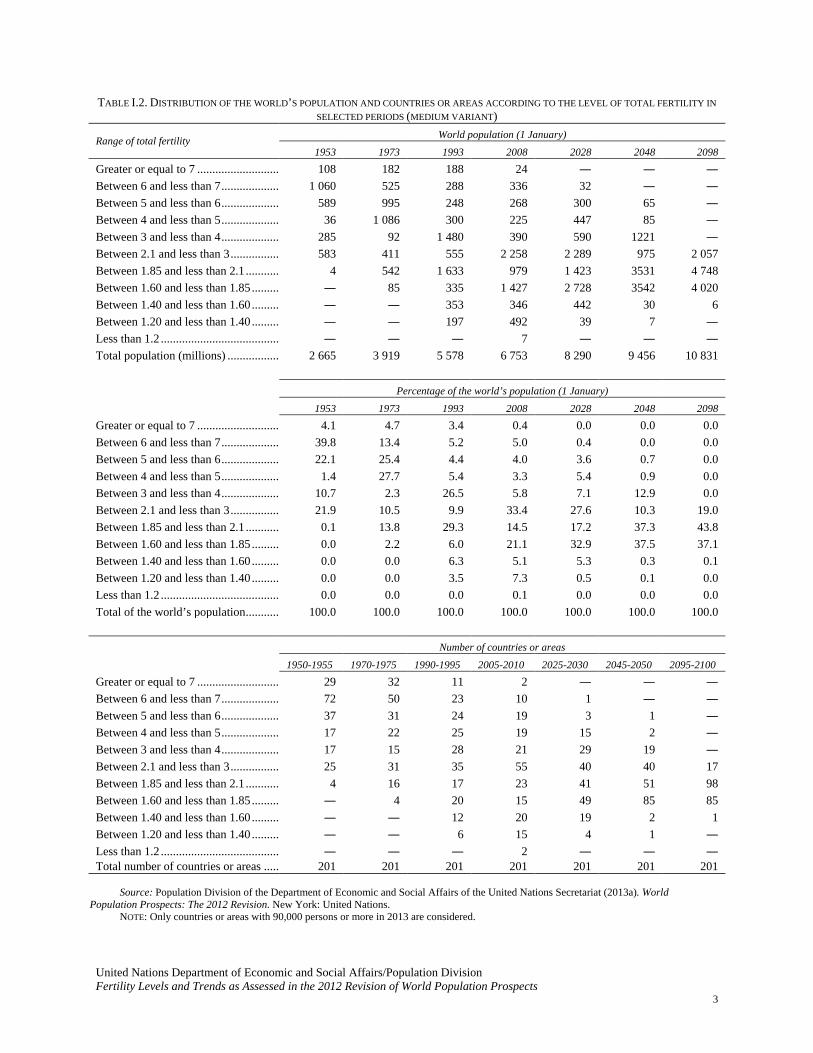
A. TOTAL FERTILITY Total fertility—that is, the average number of children a woman would bear if fertility rates remained unchanged during her lifetime—was 2.5 children per woman in 2005-2010 at the world level (table I.1). This average masks the heterogeneity of fertility levels among countries and regions (figure I.1 and table I.1). In 2005-2010, 75 countries or areas (39 in Europe, 19 in Asia, 12 in Latin America and the Caribbean, 2 in Africa and Northern America and 1 in Oceania) had fertility levels below 2.1 children per woman, that is, below replacement level,1 whereas 126 countries or areas had total fertility levels at or above 2.1 children per woman. Among these 126 countries, 50 had total fertility levels at or above four children per woman, 31 had fertility levels at or above five children per woman, and 12 countries still had fertility levels of six children per woman or higher, including Niger and Somalia where total fertility was greater than seven children per woman. Among the 50 countries or areas with total fertility levels at or above four children per woman, 37 were categorized as least developed countries. With the exception of Nigeria, all countries with total fertility at or above six children per woman were least developed countries: Afghanistan, Angola, Burkina Faso, Burundi, Chad, the Democratic Republic of the Congo, Mali, Niger, Somalia, Timor-Leste and Uganda. Several of these countries with high fertility levels were affected by generalized HIV epidemics. Moreover, a number of these countries have been experiencing civil strife and political instability in recent years, factors that impeded the provision of basic public services. The continuation of rapid population growth that is fuelled by high fertility poses serious challenges for social and economic development. However, several of the least developed countries were at an advanced stage of the transition from high to low fertility; four countries— Bangladesh, Bhutan, Myanmar and Nepal—had total fertility levels in 2005-2010 below three children per woman. The 75 countries or areas where total fertility was below replacement level in 2005-2010 accounted for 48 per cent of the world’s population (or approximately 3.3 billion people). Countries with total fertility from four to less than six children per woman accounted for just 7 per cent of the world’s population. Despite their significant contribution to population growth, countries with the highest fertility (those with a total fertility at or above six children per woman) accounted for about 5 per cent of the world’s population in 2005-2010 (table I.2). 1 Replacement-level fertility is the level that needs to be sustained over the long run to ensure that a population replaces itself. To achieve replacement-level fertility, each woman needs, on average, to have one surviving daughter. In a population in which all females survive through the reproductive years and the probability of having a daughter at each pregnancy is 50 per cent, total fertility at replacement level will be 2.0 children per woman. In reality, replacement-level fertility is slightly higher than 2.0 children per woman because the chance of survival from birth to the reproductive ages is less than 100 per cent and more boys are born than girls (i.e., the sex ratio at birth is greater than 100). For most countries with low or moderate mortality levels and a sex ratio at birth around 105 boys per 100 girls, replacement level is approximately 2.1 children per woman.
United Nations Department of Economic and Social Affairs/Population Division
Fertility Levels and Trends as Assessed in the 2012 Revision of World Population Prospects 2
TABLE I.1. TOTAL FERTILITY FOR THE WORLD, DEVELOPMENT GROUPS AND MAJOR AREAS, BY SELECTED TIME PERIODS
Total fertility (average number of children per woman)
Development group or major area
1950-55 1970-1975 1990-1995 2005-2010 World 4.97 4.44 3.04 2.53
Developed regions 2.83 2.15 1.67 1.66 Developing regions 6.08 5.36 3.38 2.69
Least developed countries 6.55 6.75 5.77 4.53 Other less developed countries 6.02 5.18 3.08 2.40
Africa 6.59 6.66 5.71 4.88 Asia 5.83 4.99 2.96 2.25 Europe 2.67 2.17 1.57 1.54 Latin America and the Caribbean 5.86 5.02 3.02 2.30 Northern America 3.35 2.01 2.00 2.02 Oceania 3.83 3.23 2.49 2.47
Source: Population Division of the Department of Economic and Social Affairs of the United Nations Secretariat (2013a). World Population Prospects: The 2012 Revision. New York: United Nations.
Figure I.1. Total fertility trajectories for the world and major areas, 1950-2100 (medium variant)
Source: Population Division of the Department of Economic and Social Affairs of the United Nations Secretariat (2013a). World
Population Prospects: The 2012 Revision. New York: United Nations.
0
1
2
3
4
5
6
7
8
1950 1960 1970 1980 1990 2000 2010 2020 2030 2040 2050 2060 2070 2080 2090 2100
Tota
l fer
tility
(chi
ldre
n pe
r wom
an)
Period
World AfricaAsia EuropeLatin America and the Caribbean Northern AmericaOceania
United Nations Department of Economic and Social Affairs/Population Division Fertility Levels and Trends as Assessed in the 2012 Revision of World Population Prospects 3
TABLE I.2. DISTRIBUTION OF THE WORLD’S POPULATION AND COUNTRIES OR AREAS ACCORDING TO THE LEVEL OF TOTAL FERTILITY IN SELECTED PERIODS (MEDIUM VARIANT)
Range of total fertility World population (1 January)
1953 1973 1993 2008 2028 2048 2098 Greater or equal to 7 ........................... 108 182 188 24 ― ― ― Between 6 and less than 7 ................... 1 060 525 288 336 32 ― ― Between 5 and less than 6 ................... 589 995 248 268 300 65 ― Between 4 and less than 5 ................... 36 1 086 300 225 447 85 ― Between 3 and less than 4 ................... 285 92 1 480 390 590 1221 ― Between 2.1 and less than 3 ................ 583 411 555 2 258 2 289 975 2 057 Between 1.85 and less than 2.1 ........... 4 542 1 633 979 1 423 3531 4 748 Between 1.60 and less than 1.85 ......... ― 85 335 1 427 2 728 3542 4 020 Between 1.40 and less than 1.60 ......... ― ― 353 346 442 30 6 Between 1.20 and less than 1.40 ......... ― ― 197 492 39 7 ― Less than 1.2 ....................................... ― ― ― 7 ― ― ― Total population (millions) ................. 2 665 3 919 5 578 6 753 8 290 9 456 10 831 Percentage of the world’s population (1 January) 1953 1973 1993 2008 2028 2048 2098 Greater or equal to 7 ........................... 4.1 4.7 3.4 0.4 0.0 0.0 0.0 Between 6 and less than 7 ................... 39.8 13.4 5.2 5.0 0.4 0.0 0.0 Between 5 and less than 6 ................... 22.1 25.4 4.4 4.0 3.6 0.7 0.0 Between 4 and less than 5 ................... 1.4 27.7 5.4 3.3 5.4 0.9 0.0 Between 3 and less than 4 ................... 10.7 2.3 26.5 5.8 7.1 12.9 0.0 Between 2.1 and less than 3 ................ 21.9 10.5 9.9 33.4 27.6 10.3 19.0 Between 1.85 and less than 2.1 ........... 0.1 13.8 29.3 14.5 17.2 37.3 43.8 Between 1.60 and less than 1.85 ......... 0.0 2.2 6.0 21.1 32.9 37.5 37.1 Between 1.40 and less than 1.60 ......... 0.0 0.0 6.3 5.1 5.3 0.3 0.1 Between 1.20 and less than 1.40 ......... 0.0 0.0 3.5 7.3 0.5 0.1 0.0 Less than 1.2 ....................................... 0.0 0.0 0.0 0.1 0.0 0.0 0.0 Total of the world’s population ........... 100.0 100.0 100.0 100.0 100.0 100.0 100.0
Number of countries or areas 1950-1955 1970-1975 1990-1995 2005-2010 2025-2030 2045-2050 2095-2100 Greater or equal to 7 ........................... 29 32 11 2 ― ― ― Between 6 and less than 7 ................... 72 50 23 10 1 ― ― Between 5 and less than 6 ................... 37 31 24 19 3 1 ― Between 4 and less than 5 ................... 17 22 25 19 15 2 ― Between 3 and less than 4 ................... 17 15 28 21 29 19 ― Between 2.1 and less than 3 ................ 25 31 35 55 40 40 17 Between 1.85 and less than 2.1 ........... 4 16 17 23 41 51 98 Between 1.60 and less than 1.85 ......... ― 4 20 15 49 85 85 Between 1.40 and less than 1.60 ......... ― ― 12 20 19 2 1 Between 1.20 and less than 1.40 ......... ― ― 6 15 4 1 ― Less than 1.2 ....................................... ― ― ― 2 ― ― ― Total number of countries or areas ..... 201 201 201 201 201 201 201
Source: Population Division of the Department of Economic and Social Affairs of the United Nations Secretariat (2013a). World Population Prospects: The 2012 Revision. New York: United Nations.
NOTE: Only countries or areas with 90,000 persons or more in 2013 are considered.
United Nations Department of Economic and Social Affairs/Population Division
Fertility Levels and Trends as Assessed in the 2012 Revision of World Population Prospects 4
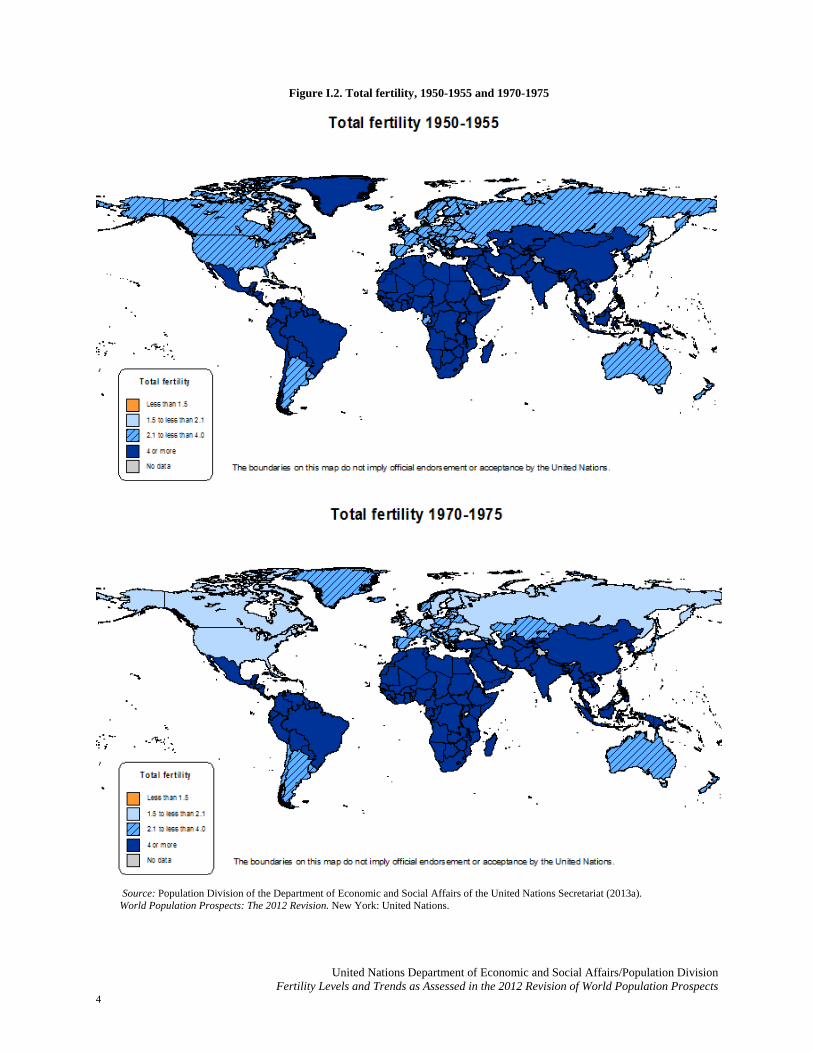
Figure I.2. Total fertility, 1950-1955 and 1970-1975
Source: Population Division of the Department of Economic and Social Affairs of the United Nations Secretariat (2013a). World Population Prospects: The 2012 Revision. New York: United Nations.
United Nations Department of Economic and Social Affairs/Population Division Fertility Levels and Trends as Assessed in the 2012 Revision of World Population Prospects 5
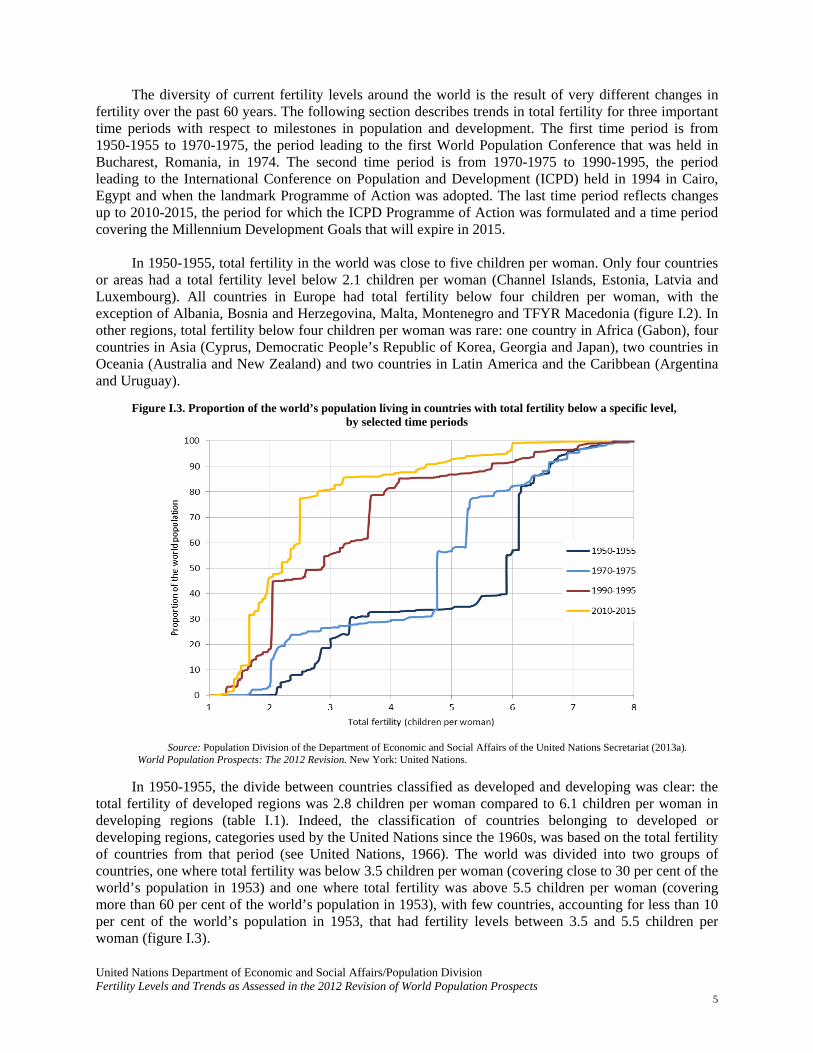
The diversity of current fertility levels around the world is the result of very different changes in fertility over the past 60 years. The following section describes trends in total fertility for three important time periods with respect to milestones in population and development. The first time period is from 1950-1955 to 1970-1975, the period leading to the first World Population Conference that was held in Bucharest, Romania, in 1974. The second time period is from 1970-1975 to 1990-1995, the period leading to the International Conference on Population and Development (ICPD) held in 1994 in Cairo, Egypt and when the landmark Programme of Action was adopted. The last time period reflects changes up to 2010-2015, the period for which the ICPD Programme of Action was formulated and a time period covering the Millennium Development Goals that will expire in 2015. In 1950-1955, total fertility in the world was close to five children per woman. Only four countries or areas had a total fertility level below 2.1 children per woman (Channel Islands, Estonia, Latvia and Luxembourg). All countries in Europe had total fertility below four children per woman, with the exception of Albania, Bosnia and Herzegovina, Malta, Montenegro and TFYR Macedonia (figure I.2). In other regions, total fertility below four children per woman was rare: one country in Africa (Gabon), four countries in Asia (Cyprus, Democratic People’s Republic of Korea, Georgia and Japan), two countries in Oceania (Australia and New Zealand) and two countries in Latin America and the Caribbean (Argentina and Uruguay). Figure I.3. Proportion of the world’s population living in countries with total fertility below a specific level,
by selected time periods
Source: Population Division of the Department of Economic and Social Affairs of the United Nations Secretariat (2013a). World Population Prospects: The 2012 Revision. New York: United Nations.
In 1950-1955, the divide between countries classified as developed and developing was clear: the total fertility of developed regions was 2.8 children per woman compared to 6.1 children per woman in developing regions (table I.1). Indeed, the classification of countries belonging to developed or developing regions, categories used by the United Nations since the 1960s, was based on the total fertility of countries from that period (see United Nations, 1966). The world was divided into two groups of countries, one where total fertility was below 3.5 children per woman (covering close to 30 per cent of the world’s population in 1953) and one where total fertility was above 5.5 children per woman (covering more than 60 per cent of the world’s population in 1953), with few countries, accounting for less than 10 per cent of the world’s population in 1953, that had fertility levels between 3.5 and 5.5 children per woman (figure I.3).
United Nations Department of Economic and Social Affairs/Population Division
Fertility Levels and Trends as Assessed in the 2012 Revision of World Population Prospects 6
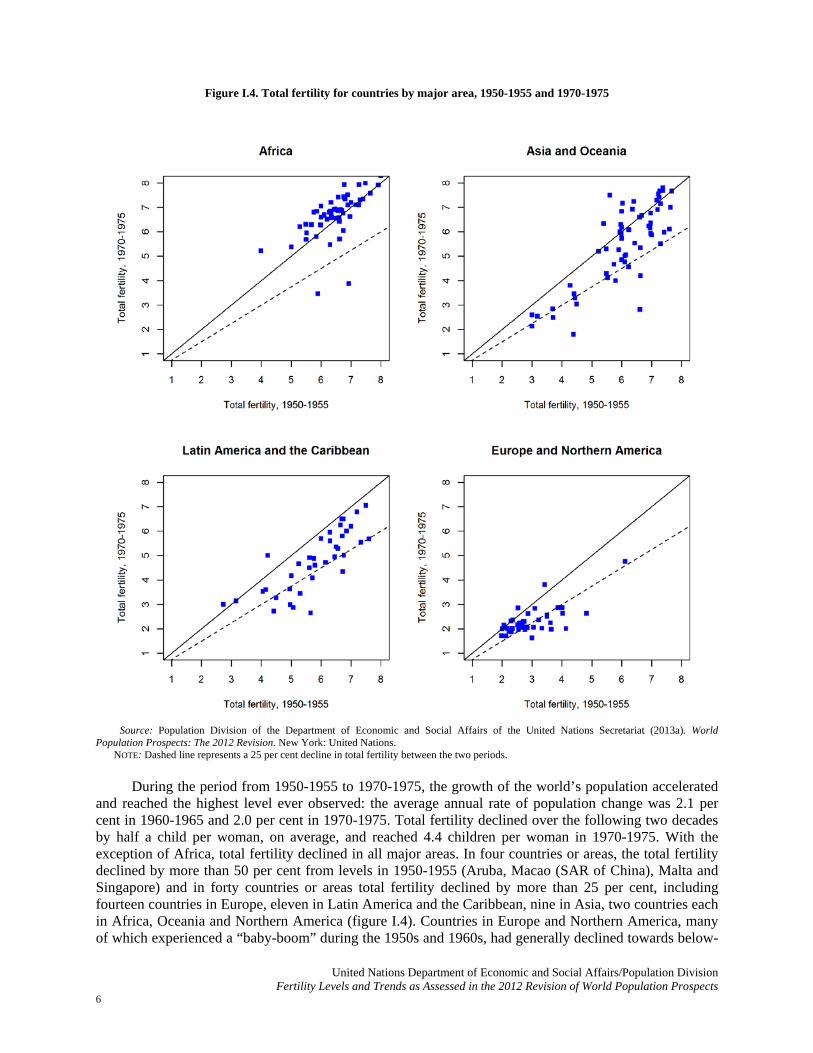
Figure I.4. Total fertility for countries by major area, 1950-1955 and 1970-1975
Source: Population Division of the Department of Economic and Social Affairs of the United Nations Secretariat (2013a). World
Population Prospects: The 2012 Revision. New York: United Nations. NOTE: Dashed line represents a 25 per cent decline in total fertility between the two periods.
During the period from 1950-1955 to 1970-1975, the growth of the world’s population accelerated and reached the highest level ever observed: the average annual rate of population change was 2.1 per cent in 1960-1965 and 2.0 per cent in 1970-1975. Total fertility declined over the following two decades by half a child per woman, on average, and reached 4.4 children per woman in 1970-1975. With the exception of Africa, total fertility declined in all major areas. In four countries or areas, the total fertility declined by more than 50 per cent from levels in 1950-1955 (Aruba, Macao (SAR of China), Malta and Singapore) and in forty countries or areas total fertility declined by more than 25 per cent, including fourteen countries in Europe, eleven in Latin America and the Caribbean, nine in Asia, two countries each in Africa, Oceania and Northern America (figure I.4). Countries in Europe and Northern America, many of which experienced a “baby-boom” during the 1950s and 1960s, had generally declined towards below-
United Nations Department of Economic and Social Affairs/Population Division Fertility Levels and Trends as Assessed in the 2012 Revision of World Population Prospects 7
replacement fertility. The fertility declines in most countries in Asia and Latin America and the Caribbean started in 1950-1955 from levels above five children per woman. Still, in half of the countries in Asia and Oceania there was either no decline or a small fertility decline. In African countries, total fertility did not decline over this period, with the exception of Mauritius and Reunion which reached levels below four children per woman in 1970-1975 (figure I.4).
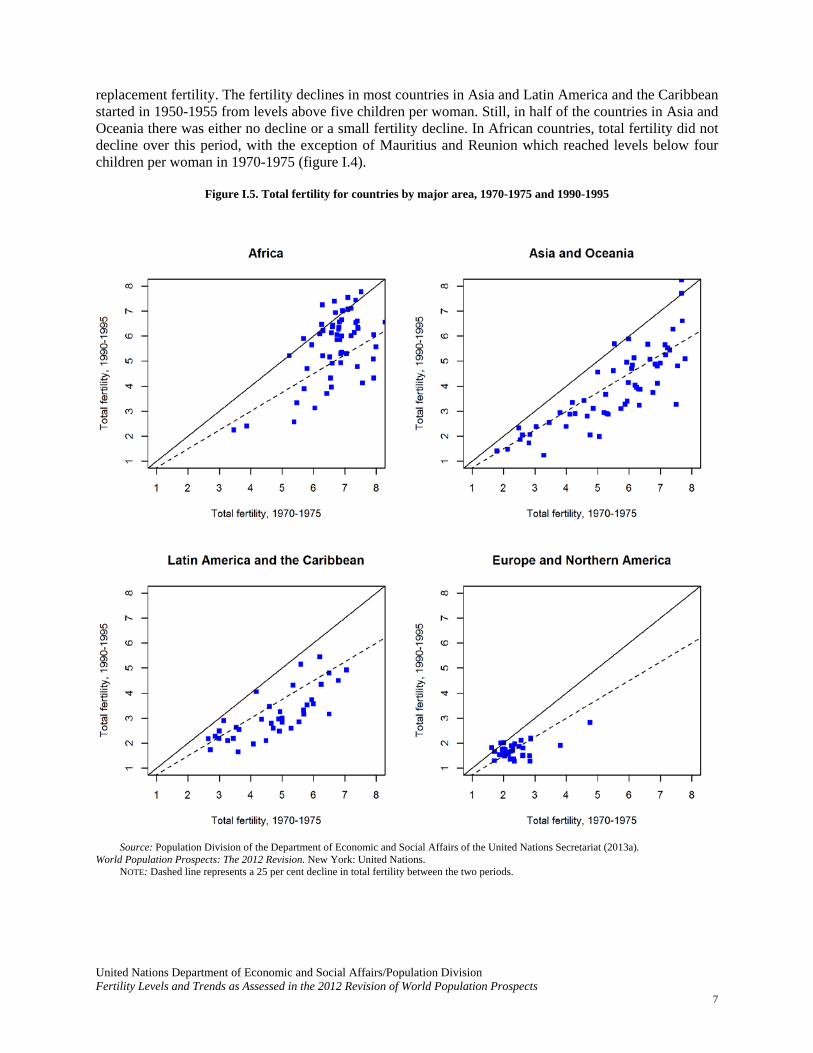
Figure I.5. Total fertility for countries by major area, 1970-1975 and 1990-1995
Source: Population Division of the Department of Economic and Social Affairs of the United Nations Secretariat (2013a).
World Population Prospects: The 2012 Revision. New York: United Nations. NOTE: Dashed line represents a 25 per cent decline in total fertility between the two periods.
United Nations Department of Economic and Social Affairs/Population Division
Fertility Levels and Trends as Assessed in the 2012 Revision of World Population Prospects 8
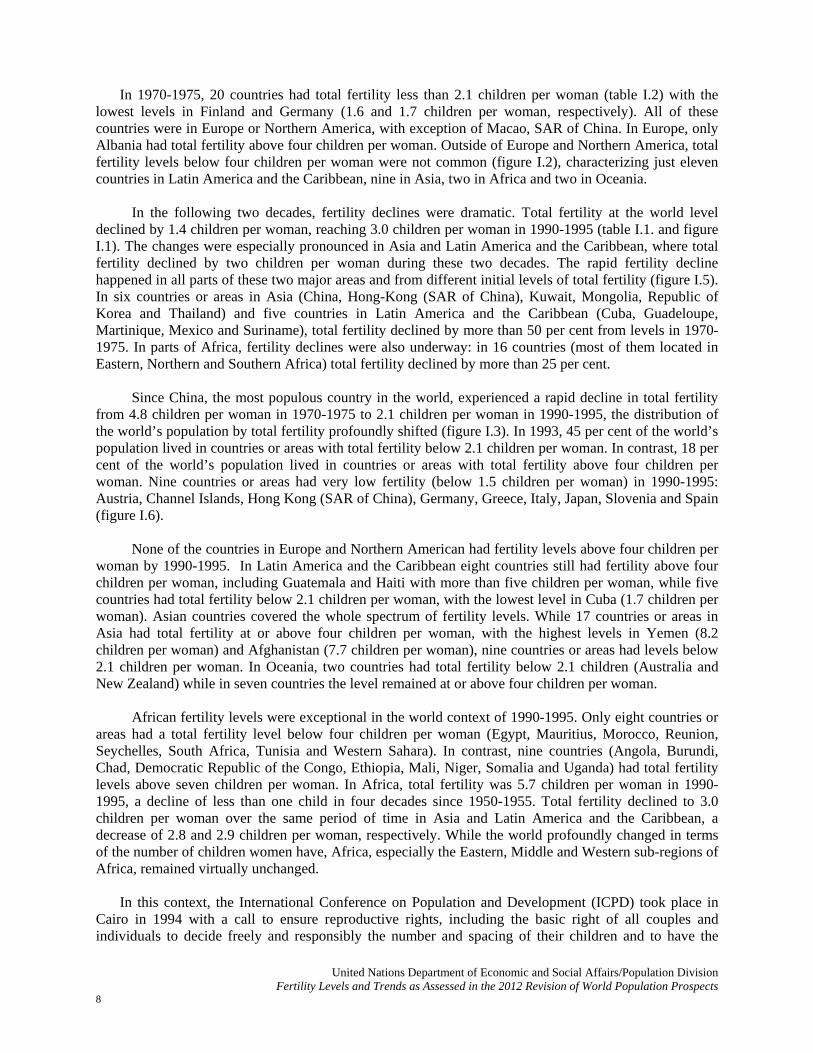
In 1970-1975, 20 countries had total fertility less than 2.1 children per woman (table I.2) with the lowest levels in Finland and Germany (1.6 and 1.7 children per woman, respectively). All of these countries were in Europe or Northern America, with exception of Macao, SAR of China. In Europe, only Albania had total fertility above four children per woman. Outside of Europe and Northern America, total fertility levels below four children per woman were not common (figure I.2), characterizing just eleven countries in Latin America and the Caribbean, nine in Asia, two in Africa and two in Oceania. In the following two decades, fertility declines were dramatic. Total fertility at the world level declined by 1.4 children per woman, reaching 3.0 children per woman in 1990-1995 (table I.1. and figure I.1). The changes were especially pronounced in Asia and Latin America and the Caribbean, where total fertility declined by two children per woman during these two decades. The rapid fertility decline happened in all parts of these two major areas and from different initial levels of total fertility (figure I.5). In six countries or areas in Asia (China, Hong-Kong (SAR of China), Kuwait, Mongolia, Republic of Korea and Thailand) and five countries in Latin America and the Caribbean (Cuba, Guadeloupe, Martinique, Mexico and Suriname), total fertility declined by more than 50 per cent from levels in 1970-1975. In parts of Africa, fertility declines were also underway: in 16 countries (most of them located in Eastern, Northern and Southern Africa) total fertility declined by more than 25 per cent. Since China, the most populous country in the world, experienced a rapid decline in total fertility from 4.8 children per woman in 1970-1975 to 2.1 children per woman in 1990-1995, the distribution of the world’s population by total fertility profoundly shifted (figure I.3). In 1993, 45 per cent of the world’s population lived in countries or areas with total fertility below 2.1 children per woman. In contrast, 18 per cent of the world’s population lived in countries or areas with total fertility above four children per woman. Nine countries or areas had very low fertility (below 1.5 children per woman) in 1990-1995: Austria, Channel Islands, Hong Kong (SAR of China), Germany, Greece, Italy, Japan, Slovenia and Spain (figure I.6).
None of the countries in Europe and Northern American had fertility levels above four children per woman by 1990-1995. In Latin America and the Caribbean eight countries still had fertility above four children per woman, including Guatemala and Haiti with more than five children per woman, while five countries had total fertility below 2.1 children per woman, with the lowest level in Cuba (1.7 children per woman). Asian countries covered the whole spectrum of fertility levels. While 17 countries or areas in Asia had total fertility at or above four children per woman, with the highest levels in Yemen (8.2 children per woman) and Afghanistan (7.7 children per woman), nine countries or areas had levels below 2.1 children per woman. In Oceania, two countries had total fertility below 2.1 children (Australia and New Zealand) while in seven countries the level remained at or above four children per woman.
African fertility levels were exceptional in the world context of 1990-1995. Only eight countries or areas had a total fertility level below four children per woman (Egypt, Mauritius, Morocco, Reunion, Seychelles, South Africa, Tunisia and Western Sahara). In contrast, nine countries (Angola, Burundi, Chad, Democratic Republic of the Congo, Ethiopia, Mali, Niger, Somalia and Uganda) had total fertility levels above seven children per woman. In Africa, total fertility was 5.7 children per woman in 1990-1995, a decline of less than one child in four decades since 1950-1955. Total fertility declined to 3.0 children per woman over the same period of time in Asia and Latin America and the Caribbean, a decrease of 2.8 and 2.9 children per woman, respectively. While the world profoundly changed in terms of the number of children women have, Africa, especially the Eastern, Middle and Western sub-regions of Africa, remained virtually unchanged.
In this context, the International Conference on Population and Development (ICPD) took place in
Cairo in 1994 with a call to ensure reproductive rights, including the basic right of all couples and individuals to decide freely and responsibly the number and spacing of their children and to have the
United Nations Department of Economic and Social Affairs/Population Division Fertility Levels and Trends as Assessed in the 2012 Revision of World Population Prospects 9
information, education and means to do so. Because of high levels of unmet need for family planning, signifying the gap between childbearing desires and use of contraceptives in countries with high and medium fertility levels, ensuring these rights was likely to lead to further fertility declines.
Figure I.6. Total fertility, 1990-1995 and 2010-2015
Source: Population Division of the Department of Economic and Social Affairs of the United Nations Secretariat (2013a). World Population Prospects: The 2012 Revision. New York: United Nations.
United Nations Department of Economic and Social Affairs/Population Division
Fertility Levels and Trends as Assessed in the 2012 Revision of World Population Prospects 10
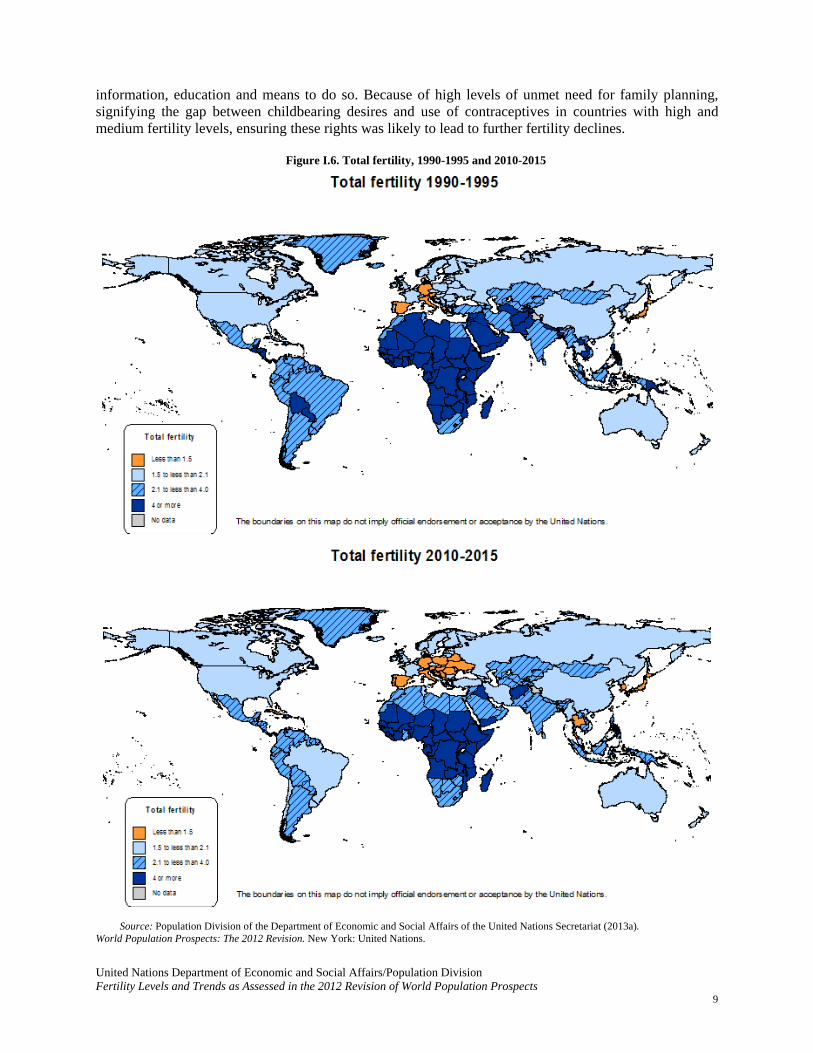
Over the two decades that followed the ICPD Programme of Action, the total fertility of the world decreased by 0.5 children per woman and is projected to be around 2.5 children per woman in 2010-2015 (figure I.1). Africa had the largest decline during this period in absolute terms: a decline of one child in two decades, projected to reach 4.7 children per woman in 2010-2015. In one country in Africa (Cabo Verde) and seven countries in Asia (Bhutan, Iran, Maldives, Nepal, Oman, Saudi Arabia and United Arab Emirates), total fertility is projected to decline by more than 50 per cent (figure I.7). In 20 African countries, total fertility is projected to decline by more than 25 per cent since 1990-1995. Still, overall fertility decline in African countries has been far slower compared to the profound changes that occurred in prior decades in countries of Asia and Latin American and the Caribbean, which started from similar levels of total fertility. Further fertility declines continued in Asia and Latin American and the Caribbean, with 34 and 17 countries, respectively, projected to have fertility declines of more than 25 per cent.
Figure I.7. Total fertility for countries by major area, 1990-1995 and 2010-2015
Source: Population Division of the Department of Economic and Social Affairs of the United Nations Secretariat (2013a). World Population Prospects: The 2012 Revision. New York: United Nations. NOTE: Dashed line represents a 25 per cent decline in total fertility between the two periods.

United Nations Department of Economic and Social Affairs/Population Division Fertility Levels and Trends as Assessed in the 2012 Revision of World Population Prospects 11
Somewhat unexpected were continuing fertility declines in Europe, especially Eastern and Southern Europe, and several countries have reached historically unprecedented low fertility levels. In 2010-2015, all countries in Europe and Northern America are projected to have fertility levels below 2.1 children per woman. Among them, 19 countries or areas (all from Eastern and Southern Europe, with the exception of Austria, Germany and Channel Islands) are expected to have total fertility below 1.5 children per woman (figure I.6), despite a limited fertility recuperation from even lower total fertility in previous periods. But the top three countries or areas projected to experience the lowest fertility levels (below 1.3 children per woman) in 2010-2015 are Macao and Hong Kong (SARs of China) and Singapore. Another four countries in Asia (Cyprus, Japan, Republic of Korea and Thailand) are projected to have total fertility below 1.5 children per woman (figure I.6). By 2010-2015, the difference in total fertility between developed and developing regions is expected to be relatively small: 1.7 children per woman compared to 2.6 children per woman. The least developed countries, in contrast, which are defined as the poorest countries of the world, retain a distinct pattern in terms of fertility. Total fertility is projected to be 4.2 children per woman in 2010-2015, though at the country level total fertility ranges from 7.6 children per woman in Niger to 2.0 children per woman in Myanmar.
At the time of the twentieth anniversary of the ICPD Programme of Action in 2014, 48 per cent of the world’s population is projected to live in countries with below-replacement level fertility while only 13 per cent of the world’s population is projected to live in countries with total fertility above four children per woman (figure I.3). The future fertility trajectories in high-fertility countries, however, will have a profound impact on the future population growth of their countries and that of the world.
B. TIMING OF CHILDBEARING
The decline in fertility experienced by most countries over the past six decades has been accompanied by shifts in the timing of childbearing. During the early stages of the fertility transition, there is a decline in higher order births and the mean age at childbearing tends to fall (assuming there is not an offsetting increase in the age at first birth, which tends to happen more slowly). In countries where total fertility is low, changes in the mean age at childbearing are more influenced by the changes in the age at first birth.
There have been large differences in the timing of childbearing across major areas (figure I.8). In Africa, the mean age at childbearing has remained high over time, above 29 years. With the early onset of childbearing in many countries of Africa, fertility rates are high across all reproductive age groups, and declines in fertility rates in the past generally happened across all age groups. In low fertility settings, childbearing is often concentrated in a shorter span of reproductive ages. Fertility declines in Asia and Latin America and the Caribbean have retained the pattern of early childbearing; the mean age at childbearing did not change from 1990-1995 to 2010-2015 and remains just above 27 years. In contrast, the fertility declines in Europe were accompanied by the postponement of childbearing. Over the past two decades, the mean age at childbearing in Europe increased by 2.5 years. Similarly, the mean age at childbearing increased in Northern America and Oceania. The ICPD Programme of Action and the Millennium Development Goals include a focus on reducing early childbearing. They also seek to expand access to reproductive health and increase investment in the human capital of youth, especially girls. These related efforts have also increased the postponement of childbearing at young ages (United Nations, 2013c). During the period from 1990-1995 to 2010-2015, age-specific fertility rates declined substantially in the age groups 15 to 19 and 20 to 24 years.

United Nations Department of Economic and Social Affairs/Population Division
Fertility Levels and Trends as Assessed in the 2012 Revision of World Population Prospects 12
Figure I.8. Mean age at childbearing (years), world and major areas, 1990-1995 to 2010-2015
Source: Population Division of the Department of Economic and Social Affairs of the United Nations Secretariat (2013a).
World Population Prospects: The 2012 Revision. New York: United Nations.
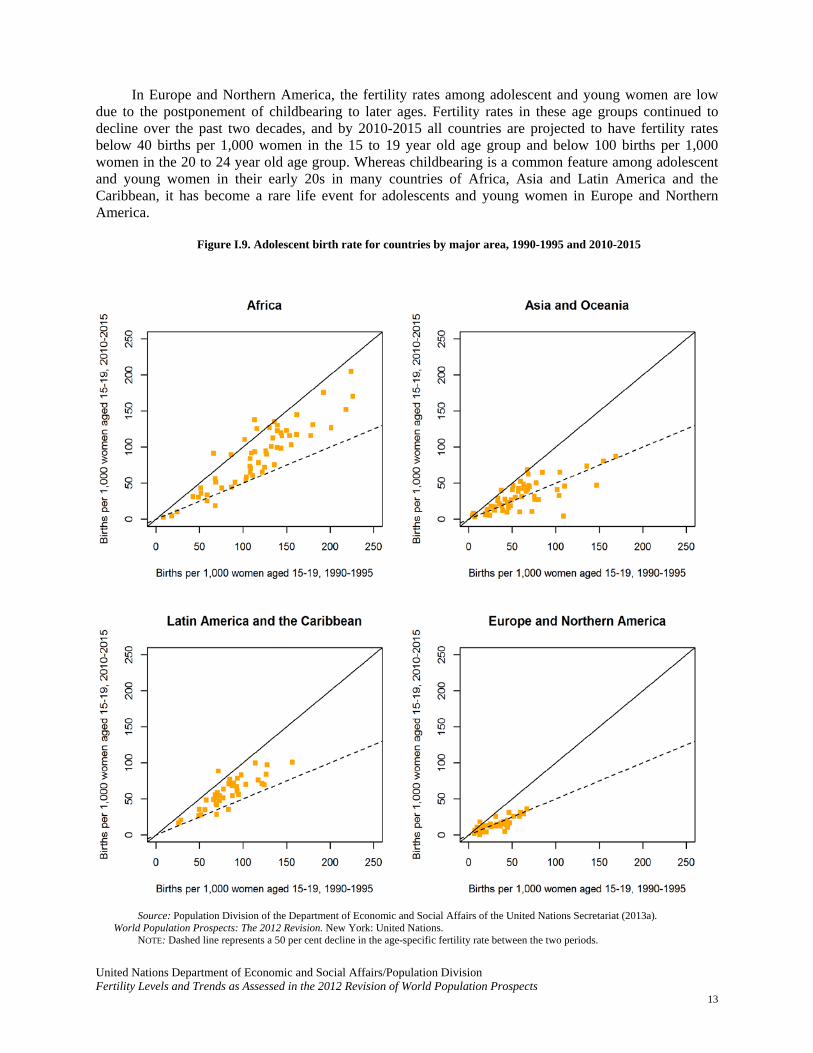
In Africa, while the adolescent birth rate declined in many countries and areas, the changes were relatively small from 1990-1995 to 2010-2015. Only Algeria, Djibouti, Libya, Tunisia and Western Sahara are projected to reduce their adolescent birth rate by more than 50 per cent by 2010-2015, starting from relatively low levels of less than 70 births per 1,000 women aged 15 to 19 in 1990-1995 (figure I.9). Progress among countries with high adolescent childbearing in Africa has been slow, and by 2010-2015 there will still be more than 100 births per 1,000 women aged 15 to 19 years every year in 23 countries and areas, including Angola, Chad, Mali and Niger with levels above 150 births per 1,000 women aged 15 to 19. Such fertility rates are higher than the rates in peak childbearing years in all countries in Europe and Northern America.
Childbearing among 20 to 24 year olds is common in Africa (figure I.10); in 32 countries the level is above 200 births per 1,000 women aged 20 to 24, meaning that this age group contributes on average more than 1.0 child per woman to total fertility. In Africa, the patterns of early childbearing are associated with continued childbearing throughout a woman’s reproductive period. By contrast, in Latin America and the Caribbean fertility rates in the age groups 15 to 19 and 20 to 24 years remain high despite declines in total fertility. Childbearing is concentrated in a woman’s younger reproductive ages and there have been only small changes over time. Asia is diverse regarding the timing of childbearing. In 20 countries the adolescent birth rate is projected to decline by more than 50 per cent by 2010-2015, starting from very different levels in 1990-1995 (including Bhutan, India, Maldives, State of Palestine and Yemen that all had more than 100 births per 1,000 women aged 15-19 in 1990-1995). In many Asian countries, fertility rates among 20 to 24 year olds are high, and in Afghanistan, India, Tajikistan and Timor-Leste are projected to be above 200 births per 1,000 women in 2010-2015. Asia, however, also has countries with very low levels of childbearing among adolescents and young women. In 12 countries and areas in Asia, the adolescent birth rate is projected to be below 10 births per 1,000 women in 2010-2015.
26.5
27
27.5
28
28.5
29
29.5
30
1990 1995 2000 2005 2010 2015
Mea
n ag
e at
chi
ldbe
arin
g (y
ears
)
World AfricaLatin America and the Caribbean Northern AmericaEurope OceaniaAsia
United Nations Department of Economic and Social Affairs/Population Division Fertility Levels and Trends as Assessed in the 2012 Revision of World Population Prospects 13
In Europe and Northern America, the fertility rates among adolescent and young women are low due to the postponement of childbearing to later ages. Fertility rates in these age groups continued to decline over the past two decades, and by 2010-2015 all countries are projected to have fertility rates below 40 births per 1,000 women in the 15 to 19 year old age group and below 100 births per 1,000 women in the 20 to 24 year old age group. Whereas childbearing is a common feature among adolescent and young women in their early 20s in many countries of Africa, Asia and Latin America and the Caribbean, it has become a rare life event for adolescents and young women in Europe and Northern America.
Figure I.9. Adolescent birth rate for countries by major area, 1990-1995 and 2010-2015
Source: Population Division of the Department of Economic and Social Affairs of the United Nations Secretariat (2013a). World Population Prospects: The 2012 Revision. New York: United Nations. NOTE: Dashed line represents a 50 per cent decline in the age-specific fertility rate between the two periods.

United Nations Department of Economic and Social Affairs/Population Division
Fertility Levels and Trends as Assessed in the 2012 Revision of World Population Prospects 14
Figure I.10. Age-specific fertility rate for women aged 20-24 for countries by major area, 1990-1995 and 2010-2015
Source: Population Division of the Department of Economic and Social Affairs of the United Nations Secretariat (2013a). World Population Prospects: The 2012 Revision. New York: United Nations. NOTE: Dashed line represents a 50 per cent decline in age-specific fertility rate between the two periods.
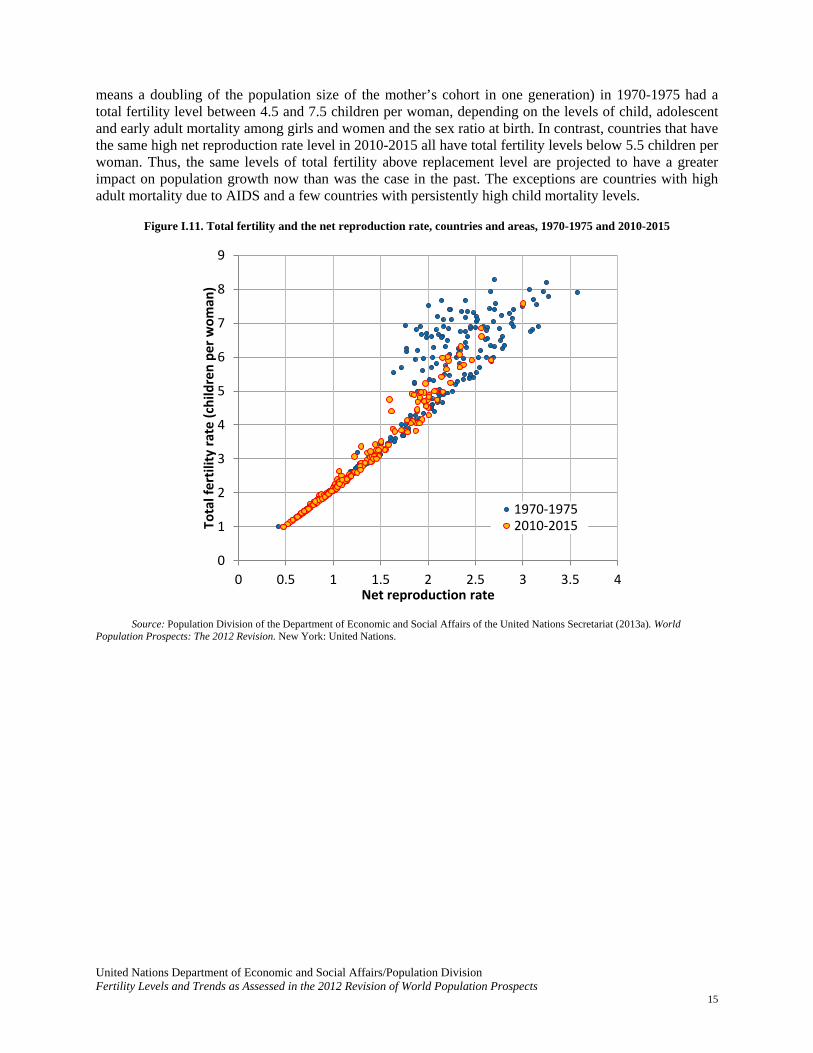
C. TOTAL FERTILITY AND THE NET REPRODUCTION RATE
An important milestone in the fertility transition is when replacement-level fertility is reached, that is, when fertility reaches the level that needs to be sustained over the long run to ensure that a population exactly replaces itself. The relationship between total fertility and the net reproduction rate has been changing over time (figure I.11). Countries with a net reproduction rate of 2.0 daughters per woman (that
United Nations Department of Economic and Social Affairs/Population Division Fertility Levels and Trends as Assessed in the 2012 Revision of World Population Prospects 15
means a doubling of the population size of the mother’s cohort in one generation) in 1970-1975 had a total fertility level between 4.5 and 7.5 children per woman, depending on the levels of child, adolescent and early adult mortality among girls and women and the sex ratio at birth. In contrast, countries that have the same high net reproduction rate level in 2010-2015 all have total fertility levels below 5.5 children per woman. Thus, the same levels of total fertility above replacement level are projected to have a greater impact on population growth now than was the case in the past. The exceptions are countries with high adult mortality due to AIDS and a few countries with persistently high child mortality levels.
Figure I.11. Total fertility and the net reproduction rate, countries and areas, 1970-1975 and 2010-2015
Source: Population Division of the Department of Economic and Social Affairs of the United Nations Secretariat (2013a). World Population Prospects: The 2012 Revision. New York: United Nations.
0
1
2
3
4
5
6
7
8
9
0 0.5 1 1.5 2 2.5 3 3.5 4
Tota
l fer
tility
rate
(chi
ldre
n pe
r wom
an)
Net reproduction rate
1970-19752010-2015
United Nations Department of Economic and Social Affairs/Population Division
Fertility Levels and Trends as Assessed in the 2012 Revision of World Population Prospects 16
II. FERTILITY PROJECTIONS FROM 2010 TO 2100
A. TOTAL FERTILITY
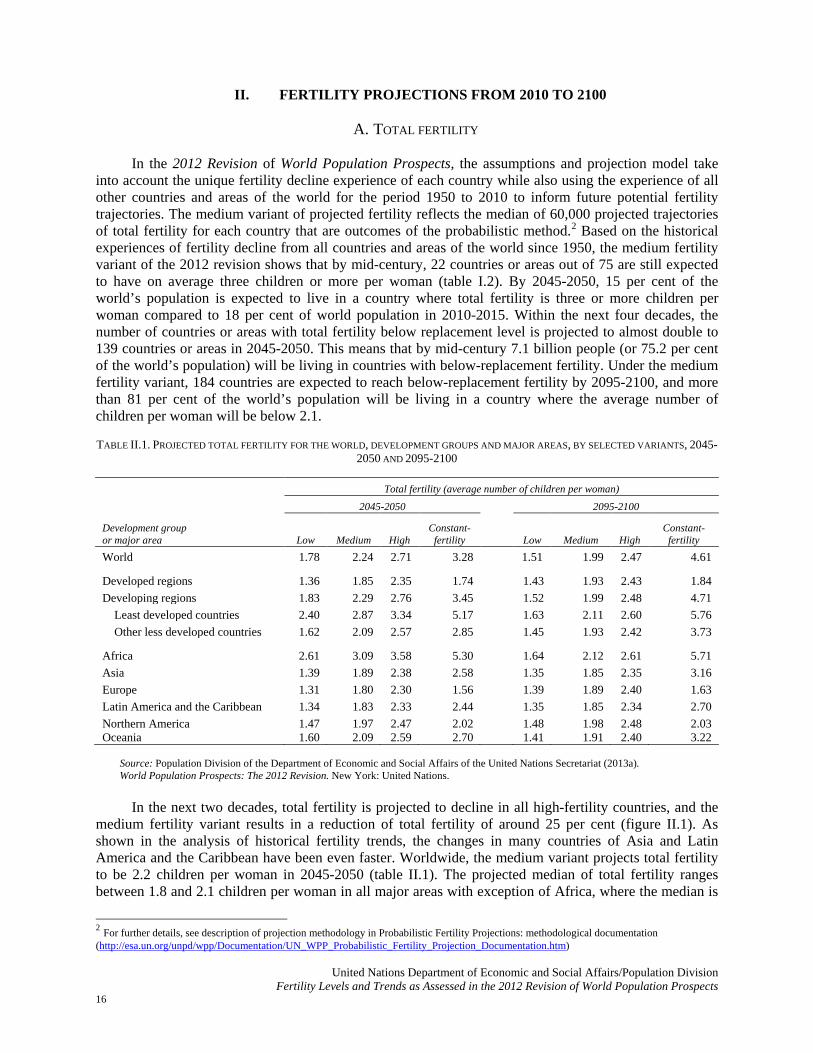
In the 2012 Revision of World Population Prospects, the assumptions and projection model take into account the unique fertility decline experience of each country while also using the experience of all other countries and areas of the world for the period 1950 to 2010 to inform future potential fertility trajectories. The medium variant of projected fertility reflects the median of 60,000 projected trajectories of total fertility for each country that are outcomes of the probabilistic method.2 Based on the historical experiences of fertility decline from all countries and areas of the world since 1950, the medium fertility variant of the 2012 revision shows that by mid-century, 22 countries or areas out of 75 are still expected to have on average three children or more per woman (table I.2). By 2045-2050, 15 per cent of the world’s population is expected to live in a country where total fertility is three or more children per woman compared to 18 per cent of world population in 2010-2015. Within the next four decades, the number of countries or areas with total fertility below replacement level is projected to almost double to 139 countries or areas in 2045-2050. This means that by mid-century 7.1 billion people (or 75.2 per cent of the world’s population) will be living in countries with below-replacement fertility. Under the medium fertility variant, 184 countries are expected to reach below-replacement fertility by 2095-2100, and more than 81 per cent of the world’s population will be living in a country where the average number of children per woman will be below 2.1. TABLE II.1. PROJECTED TOTAL FERTILITY FOR THE WORLD, DEVELOPMENT GROUPS AND MAJOR AREAS, BY SELECTED VARIANTS, 2045-
2050 AND 2095-2100
Total fertility (average number of children per woman)
Development group or major area
2045-2050 2095-2100
Low Medium High Constant-
fertility Low Medium High Constant-
fertility World 1.78 2.24 2.71 3.28
1.51 1.99 2.47 4.61
Developed regions 1.36 1.85 2.35 1.74
1.43 1.93 2.43 1.84 Developing regions 1.83 2.29 2.76 3.45
1.52 1.99 2.48 4.71
Least developed countries 2.40 2.87 3.34 5.17
1.63 2.11 2.60 5.76 Other less developed countries 1.62 2.09 2.57 2.85
1.45 1.93 2.42 3.73
Africa 2.61 3.09 3.58 5.30
1.64 2.12 2.61 5.71 Asia 1.39 1.89 2.38 2.58
1.35 1.85 2.35 3.16
Europe 1.31 1.80 2.30 1.56
1.39 1.89 2.40 1.63 Latin America and the Caribbean 1.34 1.83 2.33 2.44
1.35 1.85 2.34 2.70
Northern America 1.47 1.97 2.47 2.02
1.48 1.98 2.48 2.03 Oceania 1.60 2.09 2.59 2.70 1.41 1.91 2.40 3.22
Source: Population Division of the Department of Economic and Social Affairs of the United Nations Secretariat (2013a). World Population Prospects: The 2012 Revision. New York: United Nations.
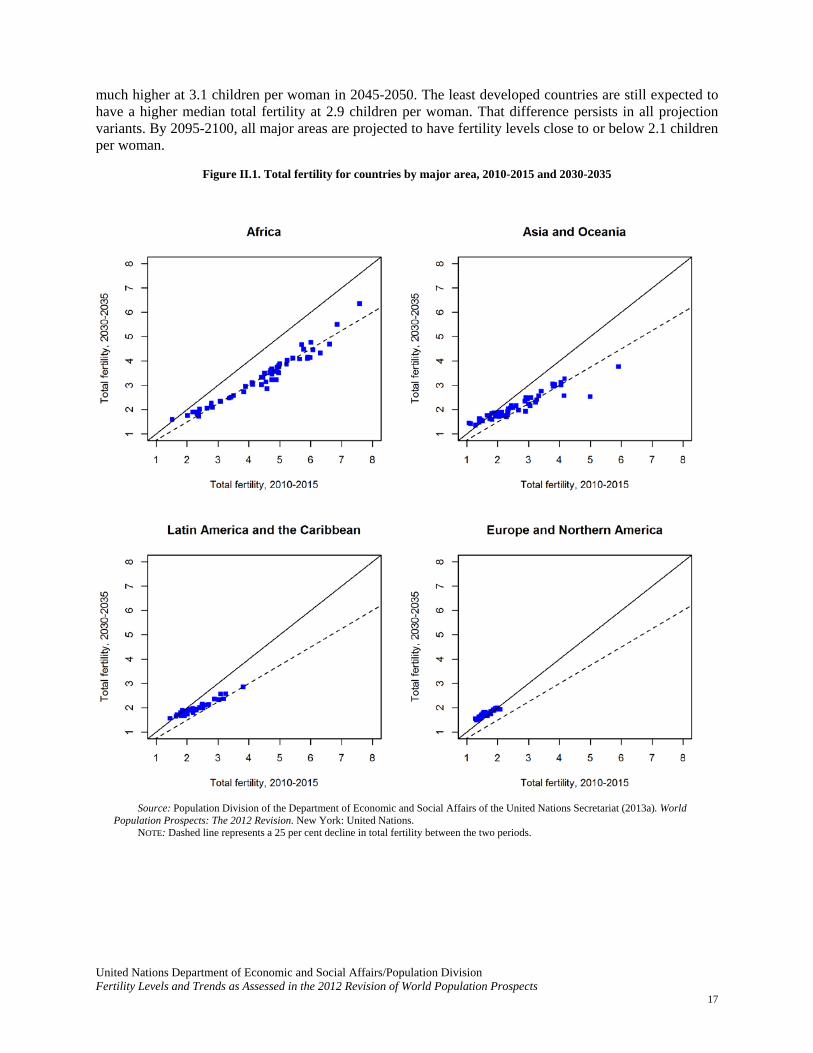
In the next two decades, total fertility is projected to decline in all high-fertility countries, and the medium fertility variant results in a reduction of total fertility of around 25 per cent (figure II.1). As shown in the analysis of historical fertility trends, the changes in many countries of Asia and Latin America and the Caribbean have been even faster. Worldwide, the medium variant projects total fertility to be 2.2 children per woman in 2045-2050 (table II.1). The projected median of total fertility ranges between 1.8 and 2.1 children per woman in all major areas with exception of Africa, where the median is
2 For further details, see description of projection methodology in Probabilistic Fertility Projections: methodological documentation (http://esa.un.org/unpd/wpp/Documentation/UN_WPP_Probabilistic_Fertility_Projection_Documentation.htm)
United Nations Department of Economic and Social Affairs/Population Division Fertility Levels and Trends as Assessed in the 2012 Revision of World Population Prospects 17
much higher at 3.1 children per woman in 2045-2050. The least developed countries are still expected to have a higher median total fertility at 2.9 children per woman. That difference persists in all projection variants. By 2095-2100, all major areas are projected to have fertility levels close to or below 2.1 children per woman.
Figure II.1. Total fertility for countries by major area, 2010-2015 and 2030-2035
Source: Population Division of the Department of Economic and Social Affairs of the United Nations Secretariat (2013a). World Population Prospects: The 2012 Revision. New York: United Nations. NOTE: Dashed line represents a 25 per cent decline in total fertility between the two periods.

United Nations Department of Economic and Social Affairs/Population Division
Fertility Levels and Trends as Assessed in the 2012 Revision of World Population Prospects 18
B. FERTILITY AS A DEMOGRAPHIC COMPONENT OF FUTURE POPULATION GROWTH
Fertility provides a positive contribution to population growth if fertility is above replacement level and a negative contribution to population growth if fertility is below replacement. An analysis of regional and country projections shows that fertility is the most influential component in causing differences in growth trajectories between populations from 2010 to 2100. The contribution of fertility to future population growth ranges from 235 per cent (of the 2010 population) in Africa to -28.8 per cent in Europe.3
Figure II.2. Contribution of total fertility to population growth as a proportion of total population in 2010, 2010-2100 (per cent)
Source: Andreev, et al. (2013: p. 13).
Across countries, differences in the impact on population growth are large for the fertility component (figure II.2). In Africa, the fertility component has a large impact on the projected population increase. Nigeria’s future fertility trends are expected to have the highest absolute contribution to population growth of any country and any demographic component: the fertility component alone is estimated to account for 647 million people by 2100 (or four times Nigeria’s population in 2010). In other populous African countries with high total fertility in 2010, such as the Democratic Republic of the Congo, Niger, Uganda, United Republic of Tanzania and Zambia, the fertility component accounts for population growth of more than 100 million people by 2100. In 77 countries or areas, continuing trends in total fertility above replacement level will make positive contributions to population growth, including 44 countries where the size of the fertility component’s contribution to projected population growth is larger than the country’s total population size in 2010. For the period 2010 to 2100, the fertility component alone would is expected to multiply the population of Niger 11 times compared to its 2010 population size. Large relative effects of the fertility component are also projected for Mali (5.9 times its 2010 population) and Zambia (7.6 times its 2010 population). 3 Analysis of the demographic components of population growth described in Andreev, et al. (2013c) are based on projections from World Population Prospects: The 2012 Revision (United Nations, 2013a).
United Nations Department of Economic and Social Affairs/Population Division Fertility Levels and Trends as Assessed in the 2012 Revision of World Population Prospects 19
In other countries the effect of fertility on population growth is small or negative. Due to future fertility trends alone, the populations of many countries in Asia, Europe, and Latin America and the Caribbean would decline between 2010 and 2100 (figure II.2). The largest negative contribution in absolute terms will be in China with a decline of 425 million people by 2100 (or 38 per cent of China’s 2010 population). Other countries with the fertility component accounting for a population decline of 50 million or more people by 2100 compared to the 2010 population are Bangladesh, Brazil and India. In terms of the largest impact relative to population size, Lebanon and Singapore would see their populations decline by 63 per cent by 2100 due to below-replacement fertility.
CONCLUSION
Fertility has undergone a remarkable and unprecedented decline worldwide since the 1950s such that nearly half of the world’s population now lives in countries or areas with below-replacement fertility. The worldwide trends mask considerable diversity across countries and areas and raise questions about the future course that fertility may take. In 2010-2015, total fertility in Africa is projected to reach 4.7 children per woman. The fertility transition in countries in sub-Saharan Africa has been exceptional in that it has been slower, later, and at a lower level of development than countries in Asia and Latin America and the Caribbean (Bongaarts, 2013). The projections of fertility for countries in this region thus may, in fact, be too optimistic with respect to the pace of fertility decline, and this distinct regional experience should be taken into account in the next revision of fertility projections (United Nations, 2013d). Even a slight change in estimated total fertility can have a large impact on the projected population size. For example, an upward adjustment in the total fertility of Africa in 2005-2010 in the 2012 Revision of World Population Prospects, based on recent data showing higher fertility for the recent period than had previously been estimated, led, in part, to a projected additional 0.6 billion people in the region by 2100 compared to projections in the 2010 Revision (United Nations, 2013e).
Fertility trends in countries that have experienced very low levels of fertility, mainly countries in Europe and Eastern Asia, also present new questions about the path that future fertility is likely to take. Many countries in Europe have experienced an increase in fertility from the very low levels seen previously that resulted mainly from the postponement of births to older ages (Sobotka, 2013). However, questions remain over the extent to which period total fertility will increase from unprecedented low levels and in what ways fertility trajectories in Eastern Asian countries with very low fertility will match those of different European sub-regions. In Latin America and the Caribbean, childbearing at young ages persists despite the decline in total fertility to low levels in many countries, reflecting in part inequalities in schooling. Countries in Latin America and the Caribbean are also showing signs of a growing, voluntary retreat from childbearing (Cavenaghi, 2013). The age pattern of childbearing is growing in importance for fertility projections since changes in the age of childbearing can have a significant impact on both period and completed fertility. Lastly, the fertility decline (medium variant) projected for the group of 49 least developed countries is steep: from 4.5 children per woman in 2005-2010 to 2.9 children per woman in 2045-2050 and 2.1 in 2095-2100. To realize such reductions, it is essential that access to family planning expands. In 2013, the use of modern contraceptive methods in the least developed countries is estimated at around 31 per cent among women of reproductive age who are married or in union, and an additional 23 per cent of women have an unmet need for family planning (United Nations, 2013f). Expanded access to contraception could thus not only meet current demand for contraception but also ensure that women and men are enabled to exercise their right to determine if, when and how many children they have.
United Nations Department of Economic and Social Affairs/Population Division
Fertility Levels and Trends as Assessed in the 2012 Revision of World Population Prospects 20
REFERENCES
Andreev, Kirill, Vladimíra Kantorová and John Bongaarts (2013). Demographic Components of Future Population Growth. Technical Paper No. 2013/3. New York: United Nations. Available from http://www.un.org/en/development/desa/population/publications/pdf/technical/TP2013-3.pdf. Bongaarts, John (2013). How Exceptional is the Pattern of Fertility Decline in Sub-Saharan Africa? Expert Paper No. 2013/4. New York: United Nations. Available from http://www.un.org/en/development/desa/population/publications/pdf/expert/2013-4_Bongaarts_Expert-Paper.pdf Cavenaghi, Suzana (2013). Fertility Decline and Public Policies to Address Population Rights: Perspective from Latin America. Expert Paper No. 2013/5. New York: United Nations. Available from http://www.un.org/en/development/desa/population/publications/pdf/expert/2013-5_Cavenaghi_Expert-Paper.pdf Sobotka, Tomáš (2013). Pathways to Low Fertility: European Perspectives. Expert Paper No. 2013/8. New York: United Nations. Available from http://www.un.org/en/development/desa/population/publications/pdf/expert/2013-8_Sobotka_Expert-Paper.pdf United Nations, Department of Economic and Social Affairs (1966). World Population Prospects as Assessed in 1963. Population Studies, No. 41. New York: United Nations. United Nations, Department of Economic and Social Affairs, Population Division (2013a). World Population Prospects: The 2012 Revision. New York: United Nations. Available from http://esa.un.org/unpd/wpp/index.htm. ____________, Department of Economic and Social Affairs, Population Division (2013b). World Population Prospects: The 2012 Revision, Methodology of the United Nations Population Estimates and Projections. Working Paper No. ESA/P/WP.235. New York: United Nations. ____________, Department of Economic and Social Affairs, Population Division (2013c). Adolescent Fertility since the International Conference on Population and Development (ICPD) in Cairo. New York: United Nations. Available from http://www.un.org/en/development/desa/population/publications/pdf/fertility/Report_Adolescent-Fertility-since-ICPD.pdf. ____________, Department of Economic and Social Affairs, Population Division (2013d). United Nations Expert Group Meeting on Fertility, Changing Population Trends and Development: Challenges and Opportunities for the Future. Report of the Meeting. New York: United Nations. Available from http://www.un.org/en/development/desa/population/events/pdf/expert/21/Report-of-the-Meeting.pdf ____________, Department of Economic and Social Affairs, Population Division (2013e). Explaining differences in the projected populations between the 2012 and 2010 Revisions of World Population Prospects: The role of fertility in Africa. Population Facts No. 2013/10. New York: United Nations. Available from http://www.un.org/en/development/desa/population/publications/pdf/popfacts/popfacts_2013-10.pdf ____________, Department of Economic and Social Affairs, Population Division (2013f). Model-based Estimates and Projections of Family Planning Indicators: 2013 Revision. New York: United Nations. Available from http://www.un.org/en/development/desa/population/theme/family-planning/cp_model.shtml