ferry fact file - wordpress.com
TRANSCRIPT

FerryFactFile
July 2018Gabriola Ferry Advisory Committee

ContentsPage
Governance & Regulation 3
Ferry Fares and the Price Capping Process 5
The Fuel Deferral Account 8
Government funding for ferry services 10
Delivering a reliable and efficient ferry service 12
Financial Information 14
Who pays for Gabriola’s ferry service? 16
Route 19 : Operational Information 17
Route 19 : Passenger fares by tariff type 18
Route 19 : Vehicle fares by tariff type 19
Route 19 : Passenger Traffic Analysis 20
Route 19 : Vehicle Traffic Analysis 24
Route 19 : Overloaded sailings 33
Route 19 : On-time performance 34
Route 19 : Customer satisfaction reports 35
Where to find more information 37
Gabriola Ferry Advisory Committee 38

BC Ferries
Governanceand
RegulationDonald P Hayes
Chair of the Board of Directors, BC Ferries
British Columbia Ferry Services Inc. (BC Ferries) is one of the largestferry operators in the world, providing year-round vehicle andpassenger service on 24 routes to 47 terminals, with a fleet of35 vessels. In April 2003, the Coastal Ferry Act transformed BC Ferriesfrom a Crown corporation into an independent, commercialorganization under the Company Act, with the BC Government as thesole shareholder. The Company is governed by an independent Boardof Directors appointed by the B.C. Ferry Authority.
The BC Ferry Authority is a non-share capital corporation whosepurpose is to hold, administer and sell a voting share in BC Ferries, electdirectors to the board of BC Ferries and to approve compensation plansfor the directors and executives of BC Ferries. The nine-member boardof the BC Ferry Authority comprises four directors representing thecoastal regional districts, one representing the BC Ferry and MarineWorkers Union and four other suitably qualified candidates.
BC Ferries is the operating subsidiary of the BC Ferry Authority.In addition to the creation of BC Ferries as a wholly-owned subsidiary ofthe Authority, the Province established the initial capital structure of BCFerries though the issuance of preferred shares. The Province owns theterminal lands and leases them on a long-term exclusive basis to BCFerries.

A 60-year Coastal Ferry Services Contract exists between the Provinceand BC Ferries. The contract specifies service levels and transportationfees (financial support) for 20 out of the 24 coastal ferry routes. Thecontract is framed around four-yearly performance terms and is subjectto amendments for each new performance term coinciding with pricecap reviews conducted by the BC Ferry Commissioner prior to the startof each performance term. Performance Term 4 (PT4) runs from April 1,2016 to March 31, 2020.
Within this framework, BC Ferries has direct access to capital marketsand carries responsibility for raising the funds necessary to maintainand replace its assets; the company’s borrowing is therefore not treatedas a government debt.
The BC Ferry Commission is a quasi-judicial regulatory agency operatingunder the Coastal Ferry Act. The commission regulates the ferryoperator on its 24 saltwater routes. The Commission is independent ofboth the provincial government and of BC Ferries.
The primary responsibility of the Ferry Commissioner is to regulateferry fares. The commissioner sets a ceiling or “price cap” on theaverage level of fares which BC Ferries can charge. The goal in settingthe price cap is to balance the interests of ferry users with the interestsof taxpayers while protecting the financial sustainability of the ferryoperator.
Sheldon Stoilen was appointed BC Ferry Commissioner from March 1,2018 replacing Gord Macatee.
GovernanceandRegulationSheldon StoilenBC Ferry Commissioner

Ferry Faresand the
PriceCappingprocess
Ferry fares are regulated by the Ferry Commissioner, who is responsiblefor setting a Price Cap on the average fares paid by ferry users. Theprocess is conducted along the following lines:
• BC Ferries presents to the Ferry Commission their forecast ofexpenses, traffic and revenue for the upcoming performanceterm, assuming the same service level;
• The Commission reviews the BC Ferries submission, trims itwhere deemed appropriate, and assuming existing service levelsand government service fees, arrives at a preliminary price cap;
• Government reviews the preliminary price cap, existing servicelevels and existing contribution, and determines what (if any)adjustments to the service fee and service levels are necessary toarrive at a final price cap;
• The Commission factors in any adjustments to the service leveland service fee, along with any recommended BC Ferriesefficiencies, and calculates a final price cap.
The Price Cap represents the maximum permitted increase onthe average fare paid across the whole ferry system. The average iscalculated from a basket of vehicle and passenger fares, so fares onindividual routes may, at times, increase above or below the level of theprice cap.

RegulatoryAccounts
Compliancewith thePrice Cap
The BC Ferry Commission oversees two Regulatory Accounts held by BCFerries. The purpose of these Accounts is to regulate how BC Ferriesresponds to external factors that may not have been foreseen at thestart of a four-year Performance Term.
The Commission directs BC Ferries on the raw data, formulas andassumptions that it must use and computes a maximum permittedlevel of average ferry fares for each year. The Annual Price Cap isdetermined at the start of each Performance term and is phased in overthe four quarters of each year.
The first Regulatory Account measures the fares income received by BCFerries (expressed as a weighted average fare) against the Price Cap.Every quarter, BC Ferries must report to the Commission the averagelevel of fares paid by its customers. (see next page)
Should BC Ferries’ average fare exceed the level permitted under theprice capping process for 3 consecutive quarters, the company isrequired to adjust the level of fares charged to bring the average backto the level determined by the price cap.
In December 2013, the BC Ferries proposed that a regulatory policy beestablished that would enable it to transfer price cap regulatoryaccount balances to or from the Fuel Deferral Account to balance asurplus in one account with a deficit in the other. The Commissionrejected the proposal but granted BC Ferries the authority to transferrevenue earned in excess of the price cap to offset future deficits in thefuel deferral account, with the wider aim of stabilising fare levels.

Source : BC Ferry CommissionQuarterly Reports for Period Ended March 31, 2018

RegulatoryAccounts
The FuelDeferralaccount
A second key element in the process of determining the Price Cap is amechanism designed to deal with fluctuations in fuel prices over theperformance term. At the start of 4-year term, a set price for marine diesel(and LNG) is built into the formula by which the price cap is determined.Provision is made for standard annual inflation in the set price but with thevolatility of the fuel market, the actual price paid by BC Ferries can varysignificantly from the set price.
Such fluctuations can have unexpected impacts on the viability of BC Ferries,so the Commission requires that the actual cost of fuel purchased in eachquarter is offset against the set price and any surplus or deficit is transferredto a regulatory account known as the Fuel Deferral Account which is zeroedat the start of a PT and must return to zero at least once during the PT. FuelRebates or Fuel Surcharges are applied to fares as a means of ensuring thatferry users contribute to balancing the account.
However, since 2016, fuel rebates have been used not only to balance thefuel deferral account, but as a means of avoiding the perceived impact offare increases. In April 2016, the fuel rebate was increased from 1% to 2.9%,entirely offsetting the 1.9% increase in fares in the year leading up to theprovincial elections. The April 2017 increase (also 1.9%) was cancelledaltogether but the 2.9% rebate continued, resulting in a revenue gap thatwidened each quarter and reached over $13 million.
On April 1, 2018 the fuel deferral account was reset to zero but the 2.9% fuelrebate continued until June 2018, when it was removed by BC Ferries in theface of continuing high fuel prices and a failure to secure alternative fundingfrom government .

Fuel Deferral Account balances 2014-2018
Source : BC Ferries / FAC Chairs Group

Financial support for BC’s coastal ferry services comprises two distinct elements:• A Federal/Provincial Subsidy Agreement, currently $29.2 million
per annum• Ferry Transportation Fees payable by the Province of British Columbia
($155.4 million in 2016/17), of which $96.2 million underwrites theoperation of the 18 minor routes, with the remainder allocated tomaintaining the northern ferry routes. No support is payable for the fourmajor routes serving the lower mainland (routes 1, 2, 3 and 30)
• In 2016/17, Route 19 (Gabriola – Nanaimo) received $3 million intransportation fees from the Province and $0.7 million through theFederal/Provincial Subsidy Agreement.
Although the Federal/Provincial subsidy increases annually with inflation,payments from the Province were set in 2003 with no automatic indexation.By 2012, the gap between Provincial support and operating costs was becomingunsustainable, and the Province was forced to inject an additional $79.5 millionfunding for the remainder of PT3 and to initiate service reductions on thenorthern and minor routes to close the funding gap. Payments into PT4 havefluctuated with the progressive transfer of funding for concessionary travel bySeniors from the Social Program into general Transportation Fees and in February2018 the government announced an additional $27 million support in 2018/19($33 million in 2019/20 and 2020/21) to stabilize ferry fares and restore freetravel for BC Seniors on Mondays to Thursdays.
The Province maintains the Social Program to provide free travel for Students,Disabled people and their escorts, and for travel for approved medicalappointments. In 2016/17, Social Program Fees amounted to $16.9 million, ofwhich Route 19 received $0.6 million.
BC FerriesGovernmentfunding forferryservicesHon. Claire TrevenaMinister of Transportation andInfrastructure

Provincial support for minor ferry routes 2004-2017
Source : BC Ferries Annual Reports toThe BC Ferries Commission

BC FerriesDelivering asafe, reliableand efficientferry serviceMark CollinsPresident & Chief Executive Officer, BC Ferries
BC Ferries is responsible for delivering a safe, reliable and efficientservice within the parameters of the Coastal Ferry Services Act.
BC Ferries owns and operates a fleet of 35 vessels, ranging from thesmallest (MV Nimpkish) with a capacity of 12 vehicles and 95passengers and crew, up to the largest (MV Spirit of Vancouver Island)which carries 358 vehicles and 2,100 passengers and crew. The onepassenger-only ferry in the system is operated by Kona Winds Charterson behalf of BC Ferries between Langdale, Keats and Gambier Islands.
BC Ferries leases its terminals from the Province of British Columbia andtakes responsibility for their day-to-day operation as well as anymaintenance, terminal upgrades or improvements that are required.However, in locations (such as Gabriola) where ferry traffic lines up onthe highway, the Ministry of Transportation is responsible for trafficmanagement.
BC Ferries operates and maintains its fleet in accordance with therequirements of Transport Canada who set safety standards for allmarine operations. Each vessel in the BC Ferries fleet is regularlyinspected to ensure compliance with Transport Canada regulations andTransport Canada determines the number of crew members required tosafely operate each vessel, according to the number of passengers onboard. MV Quinsam is licensed to carry up to 392 passengers with 8crew, though she normally operates with 7 crew and a maximum of 293passengers.

Financial Performanceacross the network
The table below compares the financial performance of Route 19 withother BC Ferries routes, highlighting what proportion of the totaloperating costs for each route is covered by fares income (includingfares paid by government through social program reimbursements).
Source : BC Ferries Annual Reports toThe BC Ferries Commission

Route 19Financial information
Headline financial information is published for each route in BC Ferries’Annual Report to the Ferries Commissioner. Detailed analysis of
expenditure items is not published, owing to commercial sensitivity.Note that the $400k service reduction in 2014 reduced the operatingdeficit by almost $1million, well in excess of the $400k savings target.
Source : BC Ferries Annual Reports to the BC Ferries Commission
Financial Performance route 19 per roundtrip
route 19 per roundtrip
route 19 per roundtrip
route 19 per roundtrip
route 19 per roundtrip
Round trips operated 5,730 4,963 4,915 4,922 4,929
Tariff revenue from vehicle fares ($) 2,895,948 505 2,886,918 582 3,133,430 638 3,249,930 660 3,563,689 723Tariff Revenue from passenger fares ($) 2,012,557 351 2,263,367 456 2,381,668 485 2,479,321 504 2,631,110 534Total tariff revenue ($) 4,908,505 857 5,150,285 1,038 5,515,098 1,122 5,729,251 1,164 6,194,799 1,257
Ancillary revenue ($) 77,000 13 89,000 18 89,000 18 83,000 17 -Social Program Fees ($) 957,000 167 836,000 168 873,000 178 588,000 119 -Total operating revenue ($) 5,942,505 1,037 6,075,285 1,224 6,477,098 1,318 6,400,251 1,300 0
Total operating Expenses ($) 7,399,000 1,291 6,607,000 1,331 6,856,000 1,395 7,144,000 1,451 0
Operating Deficit ($) -1,456,495 -254 -531,715 -107 -378,902 -77 -743,749 -151 0 0
Amortization ($) -2,437,000 -425 -2,204,000 -444 -2,157,000 -439 -2,143,000 -435 0Financing expense ($) -1,071,000 -187 -937,000 -189 -809,000 -165 -712,000 -145 0Total Capital cost ($) -3,508,000 -612 -3,141,000 -633 -2,966,000 -603 -2,855,000 -580 0 0
Gain (loss) on disposal of capital assets ($) -3,000 -89,000 0 0 0
Route deficit before service fees ($) -4,967,495 -867 -3,761,715 -758 -3,344,902 -681 -3,598,749 -731 0 0
Ferry Transportation Fees ($) 2,740,000 478 2,852,000 575 2,778,000 565 3,003,000 610 0Federal-Provincial subsidy agreement ($) 668,000 117 668,000 135 677,000 138 687,000 140 0
Net route surplus / deficit ($) -1,559,495 -272 -241,715 -49 110,098 22 91,251 19 0 0
fiscal year 2013/14 fiscal year 2017/18fiscal year 2014/15 fiscal year 2015/16 fiscal year 2016/17

BC Ferries
What isincluded in
operatingcosts?
Source : BC Ferries Annual Report 2017

BC Ferries
Who paysforGabriola’sferryservice?
24%
32%6%
1%
30%
7%
Route 19 : Revenue sources 2016/17
Passenger fares Vehicle fares
Social Program Fees Ancillary Revenue
Provincial Transportation Support Federal/Provincial SubsidySource : BC Ferries Annual Report toThe BC Ferries Commission 2017

Route 19Operational Information
Each year, BC Ferries presents its annual operating statistics as part ofits Annual Report to the BC Ferries Commission. Key performanceindicators include the numbers of vehicles and passengers carried, the% of vehicle deck space utilised, the number of overloads reported andthe % of sailings that operated on time.
Source : BC Ferries Annual Reports to the BC Ferries Commission

BC Ferries
Route 19passengerfares bytariff type
Source : BC Ferries data supplied to FAC

BC Ferries
Route 19Vehicle faresby tariff type
Source : BC Ferries data supplied to FAC

Route 19Passengers per dayquarterly averages2014-2018
Passenger numbers are reported quarterly to the Ferries Commissioner– though each quarter has a different number of operating days, so in
order to monitor trends more accurately, the FAC publishes data basedon the average number of passengers carried each operational day.
The reduction in passenger traffic on Route 19 since 2013 followed theservice cuts and the introduction of a 50% charge for Seniors.
By the end of 2017, passenger traffic had recovered to levels last seenin 2011, despite the loss of two round-trip sailings each day and that
recovery shows all the signs of continuing through 2018.
Source : BC Ferries Quarterly Operations Reports to the BC Ferries Commission

Route 19Passenger traffic bymonth since 2013
BC Ferries’ traffic statistics are expressed in terms of passengers percalendar month, making month-by-month comparisons difficultbecause of the varying number of days in each month. To addressthis, the FAC publishes average daily passenger data each month.
Source : BC Ferries Monthly Traffic Statistics

Route 19 Passenger traffic on sailingsfrom Gabriola Island
Note : The 1350 departure from Gabriola on Saturdaysand Sundays operated only during July and August
Source : BC Ferries data supplied to the FAC

Route 19Passenger traffic on sailingsfrom Nanaimo Harbour
Note : The 1425 departure from Nanaimo on Saturdaysand Sundays operated only during July and August
Source : BC Ferries data supplied to the FAC
Route 19Quarterly vehiclecapacity utilisation2014-2018
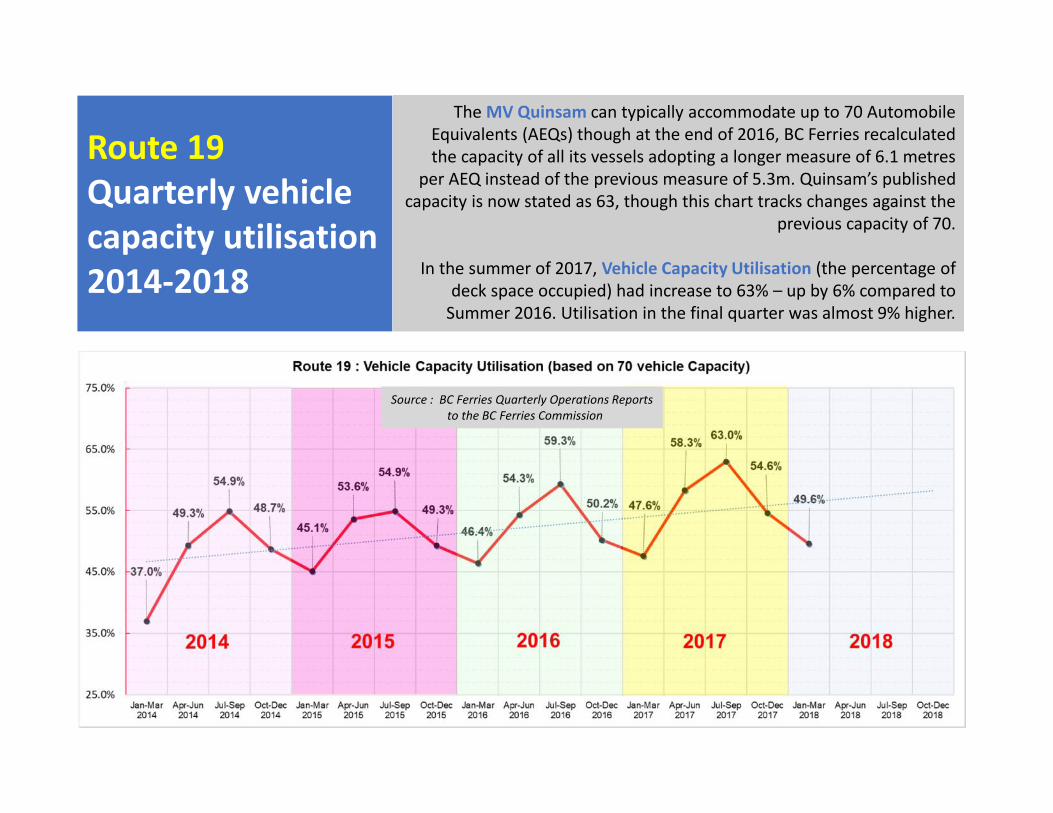
The MV Quinsam can typically accommodate up to 70 AutomobileEquivalents (AEQs) though at the end of 2016, BC Ferries recalculatedthe capacity of all its vessels adopting a longer measure of 6.1 metres
per AEQ instead of the previous measure of 5.3m. Quinsam’s publishedcapacity is now stated as 63, though this chart tracks changes against the
previous capacity of 70.
In the summer of 2017, Vehicle Capacity Utilisation (the percentage ofdeck space occupied) had increase to 63% – up by 6% compared to
Summer 2016. Utilisation in the final quarter was almost 9% higher.
Source : BC Ferries Quarterly Operations Reportsto the BC Ferries Commission

Route 19Vehicles per day
quarterly averages2014-2018
Source : BC Ferries Quarterly Operations Reportsto the BC Ferries Commission
Vehicle numbers are reported quarterly to the Ferries Commissioner –though each quarter has a different number of operating days, so inorder to monitor trends more accurately, the FAC publishes data basedon the average number of vehicles carried each operational day.Note the reduction in vehicle traffic on Route 19 in 2014 followed theservice cuts, and the progressive recovery each subsequent quarter.By the end of 2017, vehicle traffic had recovered to pre-2011 levels,despite the loss of two round-trip sailings leading inevitably to moreoverloads.
Source : BC Ferries Quarterly Operations Reports to the BC Ferries Commission

Route 19Vehicle traffic bymonth since 2013
BC Ferries’ traffic statistics are expressed in terms of vehicles carried percalendar month, making month-by-month comparisons difficult becauseof the varying number of days in each month. To address this, the FACpublishes average daily vehicle traffic data each month.
Source : BC Ferries Monthly Traffic Statistics

Route 19Vehicle
capacityutilisation
(2017)
Typically less than half full
Typically 50% to 75% full
Typically almost full (over 75%)
Typically full with overloads
Source : BC Ferries data supplied to the FAC
Sun Mon-Fri Sat Sun Mon-Fri Sat Sun Mon-Fri Sat0615 0615 0615 0615 0615 0615 0615 0615 0615
0735 0735 0735 0735 0735 07350850 0850 0850 0850 0850 0850 0850 0850 08501005 1005 1005 1005 1005 1005 1005 1005 10051120 1120 1120 1120 1120 1120 1120 1120 11201235 1235 1235 1235 1235 1235 1235 1235 1235
1350 1350 13501505 1505 1505 1505 1505 1505 1505 1505 15051620 1620 1620 1620 1620 1620 1620 1620 16201735 1735 1735 1735 1735 1735 1735 1735 17351840 1840 1840 1840 1840 1840 1840 1840 18402025 2025 2025 2025 2025 2025 2025 2025 20252130 2130 2130 2130 2130 2130 2130 2130 21302230 2230 2230 2230 2230 2230 2230 2230 2230
January - February March - April May - Junefrom Gabriola from Gabriola from Gabriola
Sun Mon-Fri Sat Sun Mon-Fri Sat Sun Mon-Fri Sat0615 0615 0615 0615 0615 0615 0615 0615 0615
0735 0735 0735 0735 0735 07350850 0850 0850 0850 0850 0850 0850 0850 08501005 1005 1005 1005 1005 1005 1005 1005 10051120 1120 1120 1120 1120 1120 1120 1120 11201235 1235 1235 1235 1235 1235 1235 1235 12351350 1350 1350 1350 13501505 1505 1505 1505 1505 1505 1505 1505 15051620 1620 1620 1620 1620 1620 1620 1620 16201735 1735 1735 1735 1735 1735 1735 1735 17351840 1840 1840 1840 1840 1840 1840 1840 18402025 2025 2025 2025 2025 2025 2025 2025 20252130 2130 2130 2130 2130 2130 2130 2130 21302230 2230 2230 2230 2230 2230 2230 2230 2230
from Gabriola from Gabriola from GabriolaJuly - August September - October November - December
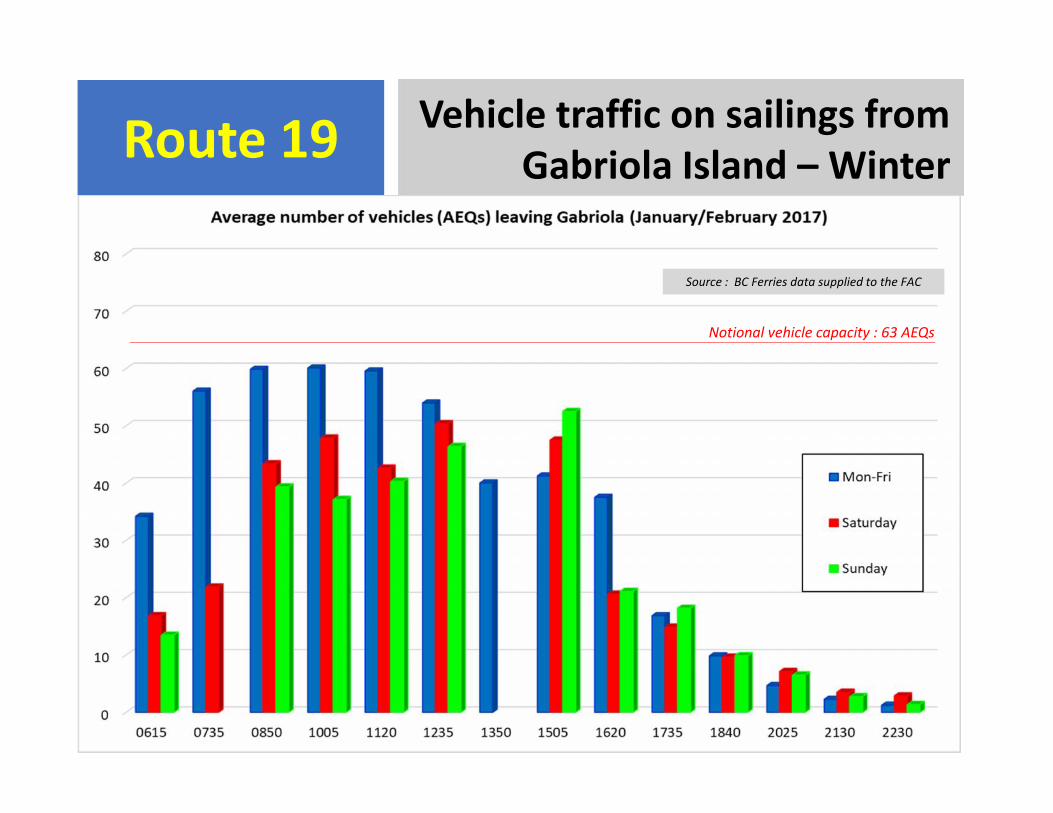
Route 19 Vehicle traffic on sailings fromGabriola Island – Winter
Notional vehicle capacity : 63 AEQs
Source : BC Ferries data supplied to the FAC

Route 19Vehicle traffic on sailings fromGabriola Island – Summer
Notional vehicle capacity : 63 AEQs
Source : BC Ferries data supplied to the FAC

Typically less than half full
Typically 50% to 75% full
Typically almost full (over 75%)
Typically full with overloads
Route 19Vehiclecapacityutilisation(2016/17)
Source : BC Ferries data supplied to the FAC
Sun Mon-Fri Sat Sun Mon-Fri Sat Sun Mon-Fri Sat0655 0655 0655 0655 0655 0655
0810 0810 0810 0810 0810 0810 0810 0810 08100925 0925 0925 0925 0925 0925 0925 0925 09251040 1040 1040 1040 1040 1040 1040 1040 10401155 1155 1155 1155 1155 1155 1155 1155 11551310 1310 1310 1310 1310 1310 1310 1310 1310
1425 1425 14251545 1545 1545 1545 1545 1545 1545 1545 15451700 1700 1700 1700 1700 1700 1700 1700 17001810 1810 1810 1810 1810 1810 1810 1810 18101915 1915 1915 1915 1915 1915 1915 1915 19152100 2100 2100 2100 2100 2100 2100 2100 21002200 2200 2200 2200 2200 2200 2200 2200 22002300 2300 2300 2300 2300 2300 2300 2300 2300
from Nanaimo from Nanaimo from NanaimoJanuary - February March - April May - June
Sun Mon-Fri Sat Sun Mon-Fri Sat Sun Mon-Fri Sat0655 0655 0655 0655 0655 0655
0810 0810 0810 0810 0810 0810 0810 0810 08100925 0925 0925 0925 0925 0925 0925 0925 09251040 1040 1040 1040 1040 1040 1040 1040 10401155 1155 1155 1155 1155 1155 1155 1155 11551310 1310 1310 1310 1310 1310 1310 1310 13101425 1425 1425 1425 14251545 1545 1545 1545 1545 1545 1545 1545 15451700 1700 1700 1700 1700 1700 1700 1700 17001810 1810 1810 1810 1810 1810 1810 1810 18101915 1915 1915 1915 1915 1915 1915 1915 19152100 2100 2100 2100 2100 2100 2100 2100 21002200 2200 2200 2200 2200 2200 2200 2200 22002300 2300 2300 2300 2300 2300 2300 2300 2300
from Nanaimo from Nanaimo from NanaimoJuly - August September - October November - December

Route 19Vehicle traffic on sailings fromNanaimo Harbour - Winter
Notional vehicle capacity : 63 AEQs
Source : BC Ferries data supplied to the FAC

Route 19 Vehicle traffic on sailings fromNanaimo Harbour - Summer
Notional vehicle capacity : 63 AEQs
Source : BC Ferries data supplied to the FAC

Route 19Quarterly vehicleoverloads report
2014-2018
Source : BC Ferries Quarterly Operations Reportsto the BC Ferries Commission
BC Ferries reports quarterly on the percentage of sailings with vehicleoverloads. Note the significant increase in overloads after the servicecuts in April 2014 and the improvement achieved in 2015 following therecasting of the ferry schedule. However, as vehicle traffic has increased,the number of overloads on Route 19 is increasing once more andbetween April and December 2017 have remained at levels onlypreviously experienced in peak summer, with Summer 2017 peaking at15.5% of all sailings overloaded – the highest ever recorded.Overloads will typically occur on successive sailings during the morningfrom Gabriola and from mid-afternoon onwards leaving Nanaimo.

Route 19Quarterly on-timeperformance2014-2018
As the volume of vehicle traffic increases on a route, it becomes moredifficult to maintain on-time performance and as this chart shows, thepercentage of “on-time” departures in the Summer 2017 quarterplummeted to just 76.9%, down from 86.4% in Summer 2016 and 90.6%in Summer 2015. (A ferry departing within 10 minutes of its scheduledtime is considered to be ‘on time’)On-time performance at this low level is unprecedented on Route 19,having dropped even below the standard achieved in 2014, the year ofthe service cuts, and it is evident that traffic has reached a criticalvolume that is now seriously impacting on-time performance year round.
Source : BC Ferries Quarterly Operations Reportsto the BC Ferries Commission

Route 19Customer satisfaction with theservice provided to Gabriola
Source : BC Ferries Commission Annual Customer SatisfactionSurveys conducted by the Mustel Group

Route 19 Customer satisfaction withthe ferry journey

Where tofind more
information
Government of BC – Coastal Ferry Acthttp://www.bclaws.ca/civix/document/id/lc/statreg/03014_01
Coastal Ferry Services Contract (consolidated version)https://www.bcferries.com/files/AboutBCF/CFSC_-_Unofficial_Consolidation_Contract.pdf
BC Ferries – Corporate informationhttps://www.bcferries.com/about/More_Information.html
BC Ferries – Monthly Traffic Statisticshttps://www.bcferries.com/about/traffic.html
BC Ferries Commission – Annual Reports from BC Ferrieshttp://www.bcferrycommission.ca/reports-press/annual-report/
BC Ferries Commission – Quarterly Reports from BCFerrieshttp://www.bcferrycommission.ca/reports-press/quarterly-reports/
Gabriola Ferry Advisory Committeehttps://gabriolafac.com/

Gabriola Ferry Advisory CommitteeJuly 2018
Steven Earle (Chair)Heather O’Sullivan (Island Trustee)
Jane McCall WoodsPeggy Richardson
Howard Houle (RDN Director)Jim Ramsay
Paul O’SullivanDavid Prevost (SD68)