fem analysis of bulging between rolls in continuous...
TRANSCRIPT

University of Illinois at Urbana-Champaign Metals Processing Simulation Lab Lan Yu
FEM Analysis of Bulging between Rollsin Continuous Casting
Lan Yu
Department of Mechanical & Industrial Engineering
University of Illinois at Urbana-Champaign
March 17, 2000

University of Illinois at Urbana-Champaign Metals Processing Simulation Lab Lan Yu
Introduction
l Bulging of continuously cast steel slabs between supporting rolls is
caused by internal ferrostatic pressure acting on the solidifying strand shell
due to the weight of liquid steel and the height from the meniscus.
– Bulging is directly responsible for internal cracks, centerline segregation, and
permanent deformation, which lead to poor quality of the continuously cast products.
– The bulging of slabs can also cause an increase of the load transmitted to the rolls and enhance their rate of wear.
l In practice, it is important to estimate bulging quantitatively in continuous caster design and set-up of secondary cooling conditions, especially in high-speed casting.
University of Illinois at Urbana-Champaign Metals Processing Simulation Lab Lan Yu
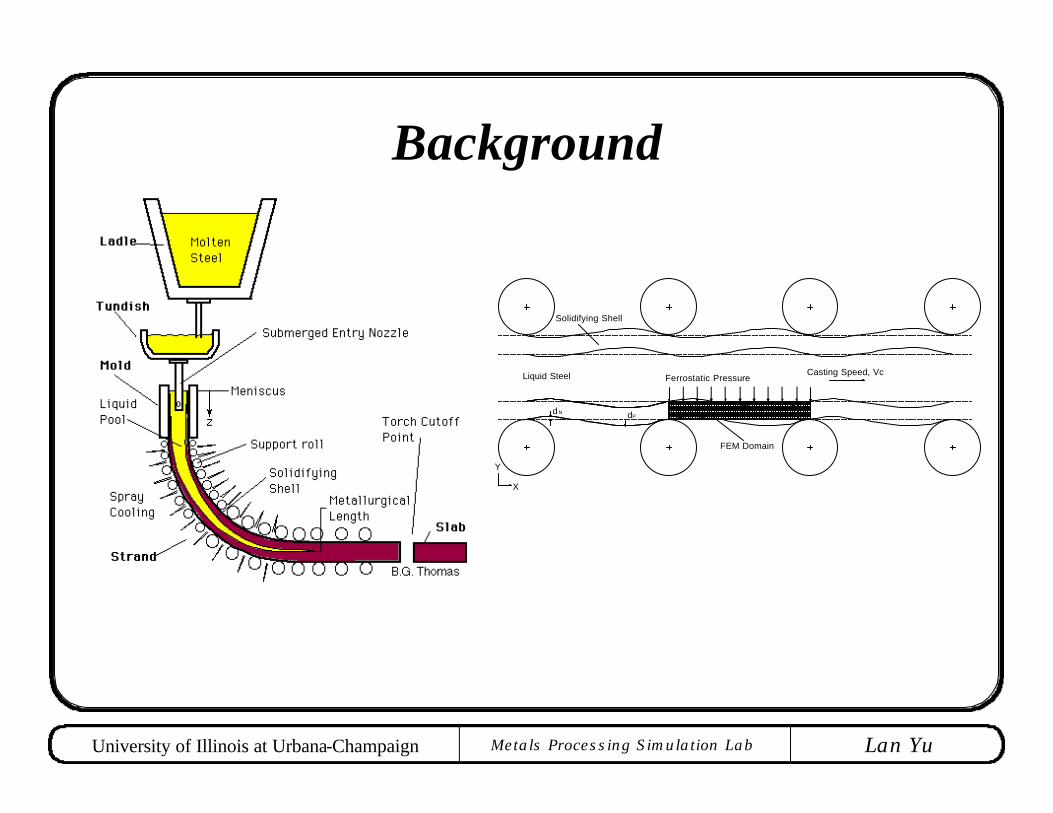
Background
The Continuous Casting Process
(Acknowledgement to Prof. Brian G. Thomas)
2D FEM single roll pitch model for bulging
• FEM Domain with 60x16 mesh
• Periodic B.C. on two ends(coupled X & Y displacement)
Ferrostatic PressureCasting Speed, Vc Liquid Steel
Solidifying Shell
FEM Domain
d N dP
X
Y

University of Illinois at Urbana-Champaign Metals Processing Simulation Lab Lan Yu
Define the Problem
Objectives:
1. Suddenly drop one roll and keep other rolls moving as usual, what is the difference from uniform roll pitch model?
2. Reproduce the simulation done by Gancarz,Lamant et al. Is their simulation correct?
3. What is the effect of misalignment on bulging?
Ferrostatic Pressure
Casting Speed, Vc
Liquid Steel
Solidifying Shell
FEM Domain
Multiple roll pitch bulging model (with at least 4 roll pitches)
Experimental bulging profile on Sumitomo and
Calculations over 9 rolls done by Gancarz, Lamant, et al.
University of Illinois at Urbana-Champaign Metals Processing Simulation Lab Lan Yu
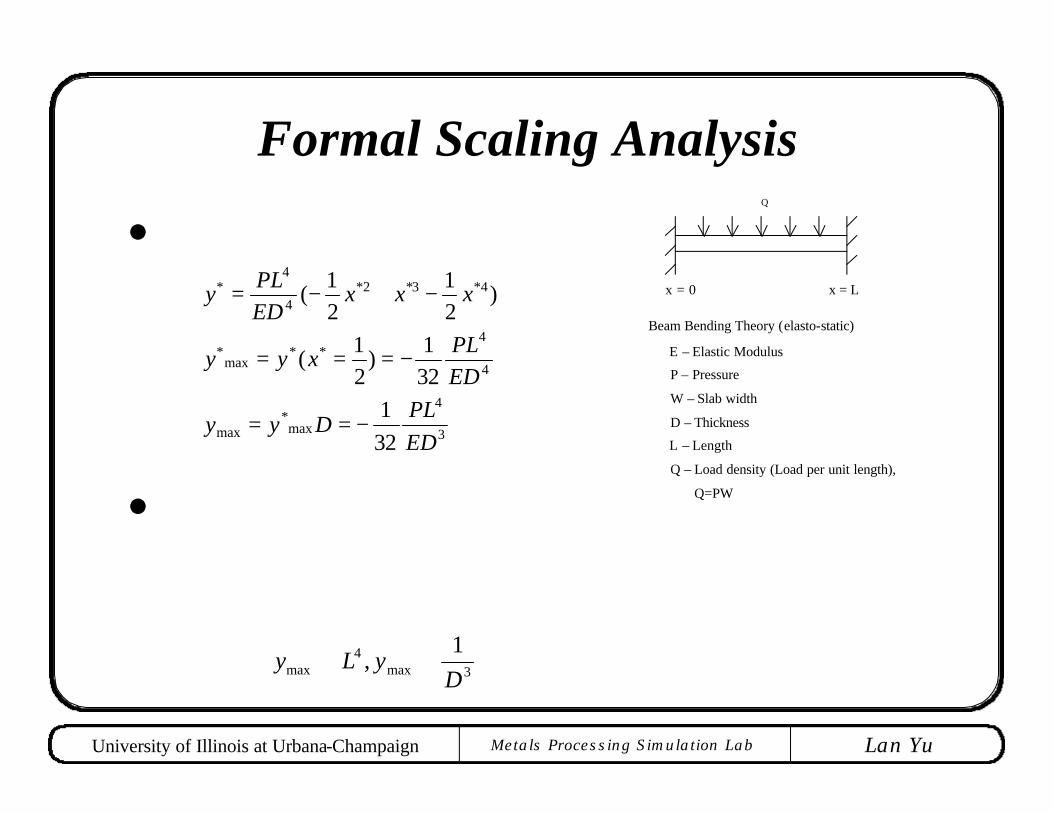
Formal Scaling Analysis
l After formal scaling,
l Conclusions:– Slab width (W) is cancelled during formal scaling, so it is justification for making a 2D assumption.
Although narrow face will provide extra support to the slab, that effect will be taken into account by a function of aspect ratio of slab width to roll pitch.
– Roll pitch (L) and shell thickness (D) play an important role on bulging:
x = 0 x = L
Q
Beam Bending Theory (elasto-static)
E – Elastic Modulus
P – Pressure
W – Slab width
D – Thickness
L – Length
Q – Load density (Load per unit length),
Q=PW
3
4
max*
max
4
4**
max*
4*3*2*4
4*
32
1
32
1)
2
1(
)2
1
2
1(
ED
PLDyy
EDPL
xyy
xxxEDPL
y
−==
−===
−+−=
3max4
max
1,
DyLy ∝∝

University of Illinois at Urbana-Champaign Metals Processing Simulation Lab Lan Yu
Key Phenomena
l Roll pitch and shell thickness have a paramount effect on bulging
l Negative bulging
l Slab movement
l Transient behavior due to roll pitch changes
l Effect of temperature profile on bulging
l Material property at high temperature
l Creep behavior

University of Illinois at Urbana-Champaign Metals Processing Simulation Lab Lan Yu
Modeling Methodology
l 2-D Finite Element Method thermal stress model with
Lagrangian approach is developed using commercial FEM
package ABAQUS.
– Stress analysis
– Nonlinear problem
l Simplifying Assumptions:
– 2-D elastic-plastic model with plane stress assumption
– Constant solidified shell thickness – Uniform ferrostatic pressure along x– Constant temperature gradient across the shell thickness with
uniform temperature profile along x
University of Illinois at Urbana-Champaign Metals Processing Simulation Lab Lan Yu
Wunnenberg Conditions for Bulging Calculation
l Wunnenberg ConditionsSlab width = 1350 mm Roll pitch = 860 mmShell thickness = 79 mm
T Liquidus = 1500 T Surface = 1000Liquid steel density = 7000Distance from meniscus = 3.9 mFerrostatic pressure = 0.26 MPaCasting speed = 0.85 m/min ( 14.2 mm/s )
l Wunnenberg Measurements - The bulging profile is asymmetric with
maximum deflection of 6.5mm at 75% from upstream roll.
Distance from upstream roll @25% @50% @75%
Displacement (mm) 3.0 5.7 6.5(max)
°C °Ckg / m3

ABAQUS
1
2
3 1
2
3
E11 VALUE-9.99E-03
-7.95E-03
-5.90E-03
-3.86E-03
-1.82E-03
+2.20E-04
+2.26E-03
+4.30E-03
+6.34E-03
+8.39E-03
+1.04E-02
+1.25E-02
+1.45E-02
+1.66E-02
DISPLACEMENT MAGNIFICATION FACTOR = 10.0
RESTART FILE = continue_5 STEP 601 INCREMENT 7
TIME COMPLETED IN THIS STEP 0.505 TOTAL ACCUMULATED TIME 304.
ABAQUS VERSION: 5.8-1 DATE: 29-MAY-1999 TIME: 15:14:40
Strain (mesh 120x16)
ABAQUS
1
2
3 1
2
3
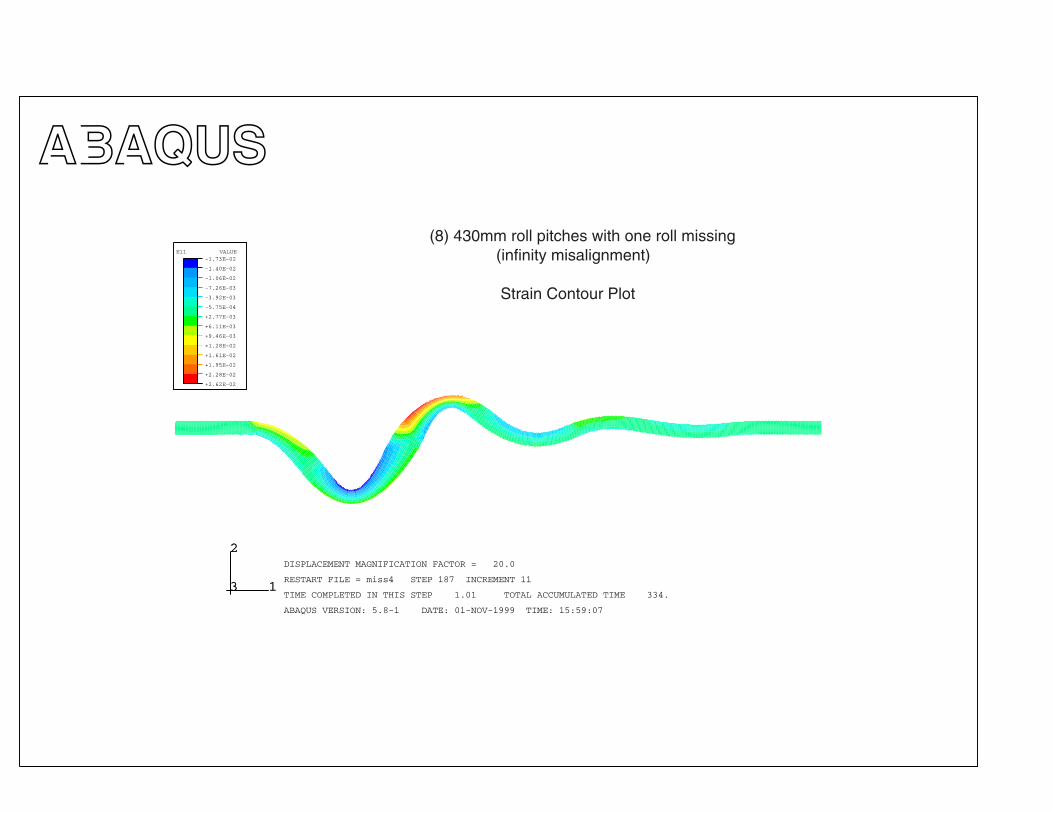
E11 VALUE-1.73E-02
-1.40E-02
-1.06E-02
-7.26E-03
-3.92E-03
-5.75E-04
+2.77E-03
+6.11E-03
+9.46E-03
+1.28E-02
+1.61E-02
+1.95E-02
+2.28E-02
+2.62E-02
DISPLACEMENT MAGNIFICATION FACTOR = 20.0
RESTART FILE = miss4 STEP 187 INCREMENT 11
TIME COMPLETED IN THIS STEP 1.01 TOTAL ACCUMULATED TIME 334.
ABAQUS VERSION: 5.8-1 DATE: 01-NOV-1999 TIME: 15:59:07
(8) 430mm roll pitches with one roll missing (infinity misalignment)
Strain Contour Plot

University of Illinois at Urbana-Champaign Metals Processing Simulation Lab Lan Yu
-20
-15
-10
-5
0
5
10
-8
-6
-4
-2
0
2
4
0 4 3 0 8 6 0 1290 1720 2150 2580 3010 3440
Bulging Profile on Surface and Strain Profile on Solidification Front
Sur face d i sp lacemen t
Stra in on sol id i f icat ion f ront(+ tens ion, - compress ion)
Sur
face
Dis
plac
emen
t (m
m)
Strain on S
olidification Front (%
)
X (mm)
430mm ro l l p i tch wi th one ro l l miss ing( inf in i ty misal ignment)+
++
+
-
--
• Negative bulge is important to tensile strain on solidification front, which is responsible for internal crack.
• Maximum tensile strain is located between maximum bulge and negative bulge, but not on maximum negative bulge point.

University of Illinois at Urbana-Champaign Metals Processing Simulation Lab Lan Yu
- 2 0
- 1 5
- 1 0
-5
0
5
1 0
0 4 3 0 8 6 0 1 2 9 0 1 7 2 0 2 1 5 0 2 5 8 0 3 0 1 0 3 4 4 0
Comparison of Bulging Profilebetween uniform roll pitch and sudden roll pitch change
U n i f o r m 8 6 0 m m r o l l p i t c h4 3 0 m m r o l l p i t c h w i t h o n e r o l l m i s s i n g
Sur
face
Dis
plac
emen
t (m
m)
X ( m m )
D i f f e r e n c e4 3 0 m m r o l l p i t c h
w i t h o n e r o l l m i s s i n gU n i f o r m
8 6 0 m m r o l l p i t c h
7 5 %1 8 . 5 7 m m1 0 . 6 1 m mM a x i m u m b u l g e
1 5 2 %7 . 3 0 m m2 . 9 0 m mN e g a t i v e b u l g e
1 2 . 9 %2 . 6 2 %2 . 3 2 %M a x s t r a i n o n s o l . f r o n t
6 4 . 2 %
5 9 . 2 %
• Sudden roll pitch change leads to larger Max bulge and much larger Negative bulge, but the change in Max tensile strain on solidification front is not as significant as that of Max bulge and Neg bulge.
• Maximum bulge is at about 60% of the roll pitch from the upstream roll. • Transient effect of sudden roll pitch change settles down in the following 4~5 roll pitches.

University of Illinois at Urbana-Champaign Metals Processing Simulation Lab Lan Yu
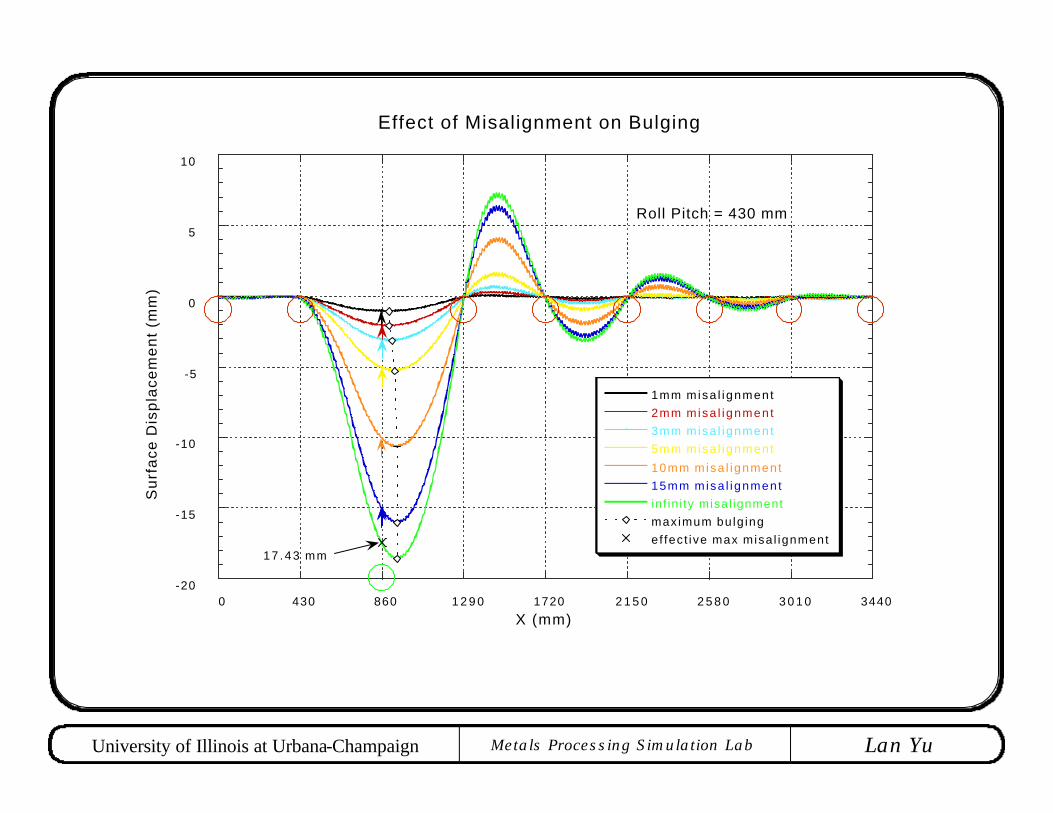
Effect of Misalignment on Bulging
Misalignment(mm)
Maximumbulge(mm)
Position fromupstream roll
Negativebulge(mm)
Ratio of neg. bulge tomax bulge
Max strain onsolidification front (%)
0(Roll spacing 430mm)
0.11 51.6% 0 0 0.046
1 1.05 54.2% 0.09 0.085 0.131
2 2.08 54.2% 0.34 0.163 0.249
3 3.12 55.8% 0.71 0.227 0.360
5 5.26 57.5% 1.64 0.312 0.686
10 10.65 59.2% 4.13 0.388 1.49
15 16.03 59.2% 6.38 0.398 2.28
∞(One roll missing)
18.57 59.2% 7.30 0.393 2.62
Double roll spacing860mm
10.61 64.2% 2.90 0.273 2.32
University of Illinois at Urbana-Champaign Metals Processing Simulation Lab Lan Yu
-20
-15
-10
-5
0
5
10
0 430 860 1 2 9 0 1720 2 1 5 0 2 5 8 0 3 0 1 0 3440
Effect of Misalignment on Bulging
1mm misa l ignment2mm misa l ignment3mm misa l ignment5mm misa l ignment10mm misa l ignment15mm misa l ignmentinf in i ty misal ignmentmaximum bu lg ingef fec t ive max misa l ignment
Sur
face
Dis
plac
emen
t (m
m)
X (mm)
Roll Pitch = 430 mm
17 .43 mm
Effective Maximum Misalignment = 17.43 mm

University of Illinois at Urbana-Champaign Metals Processing Simulation Lab Lan Yu
- 1 0
-5
0
5
1 0
1 5
2 0
-2
-1
0
1
2
3
4
0 5 1 0 1 5 2 0 2 5
Effect of Misalignment on Bulge and Max Strain on Solidification Front
Max bu lge f o r 860mm ro l l p i t ch
Neg bu lge f o r 860mm ro l l p i t ch
Max bu lge f o r 430mm ro l l p i t ch w i t h m i sa l i gnmen t
Neg bu lge f o r 430mm ro l l p i t ch w i t h m i sa l i gnmen t
Max s t ra i n f o r 860mm ro l l p i t ch
Max s t ra in on so l id i f i ca t ion f ron t fo r 4 3 0 m m r o l l p i t c h w i t h m i s a l i g n m e n t
Bul
ge (
mm
)M
ax Strain on S
olidification Front (%
)
Misa l i gnmen t (mm)S m a l l r o l l s p a c i n g 4 3 0 m m
( n o m i s a l i g n m e n t )D o u b l e r o l l s p a c i n g 8 6 0 m m
( i n f i n i t y m i sa l i gnmen t )1 7 . 4 3 m m
E f f e c t i v e m a x m i s a l i g n m e n t
• Max bulge, Negative bulge and Max strain on solidification front are almost linear functions of misalignment till effective maximum misalignment (17.43mm).
• When actual misalignment is larger than effective maximum misalignment, it behaves like one rollis missing.

University of Illinois at Urbana-Champaign Metals Processing Simulation Lab Lan Yu
Sumitomo ConditionPilot caster at Sumitomo Metals in Japan
400 x 100 mm2 slab
Casting Speed = 1.65 m/min
Caster Radius (R) = 3 m
Mold Length = 0.7 m
Roll Pitch (L) = 310 mm
Height from Meniscus (H) = 2.65 m
Ferrostatic pressure = 0.18 MPa
=> Distance from Meniscus = 3.25 m
# of rolls , the point of interest is around 8-9 rolls down the mold.
Measurement:
1. Maximum bulging of 3.2 mm is at 60~65% of the roll pitch from the upstream roll.
2. There is a negative bulging at the vicinity of the supporting rolls.
3. The ratio between negative bulging and positive bulging is around 0.4.
2.65
mR=3m
28°
Cutoff
Point
831.0
7.025.3≈
−=
ABAQUS
1
2
3 1
2
3
E11 VALUE-1.33E-02
-1.06E-02
-7.95E-03
-5.29E-03
-2.63E-03
+2.93E-05
+2.69E-03
+5.35E-03
+8.01E-03
+1.07E-02
+1.33E-02
+1.60E-02
+1.86E-02
+2.13E-02
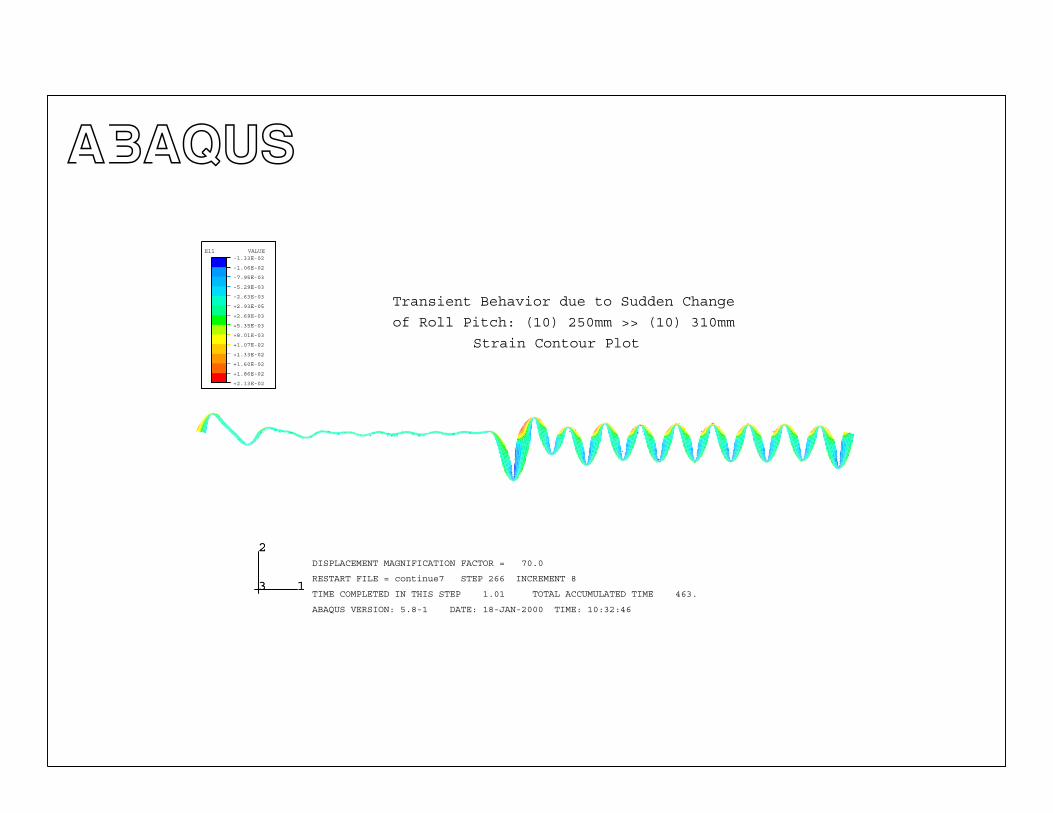
DISPLACEMENT MAGNIFICATION FACTOR = 70.0
RESTART FILE = continue7 STEP 266 INCREMENT 8
TIME COMPLETED IN THIS STEP 1.01 TOTAL ACCUMULATED TIME 463.
ABAQUS VERSION: 5.8-1 DATE: 18-JAN-2000 TIME: 10:32:46
Strain Contour Plot
Transient Behavior due to Sudden Change
of Roll Pitch: (10) 250mm >> (10) 310mm

University of Illinois at Urbana-Champaign Metals Processing Simulation Lab Lan Yu
-6
-4
-2
0
2
4
0 8 0 0 1 6 0 0 2 4 0 0 3 2 0 0 4 0 0 0 4 8 0 0 5 6 0 0
Comparison of Bulging Profile between uniform roll pitch and sudden roll pitch change
S u d d e n r o l l p i t c h c h a n g e f r o m 2 5 0 m m t o 3 1 0 m m
U n i f o r m 3 1 0 m m r o l l p i t c h
-6
-4
-2
0
2
4
Su
rfa
ce D
isp
lace
me
nt
(mm
)
D i s t a n c e x ( m m )
5 . 9 6
3 . 6 23 . 7 3
2 . 7 5
4 . 0 6
3 . 4 9 3 . 6 6 3 . 6 7
1 . 7 8
0 . 9 3
3 . 6 7
0 . 3 4
University of Illinois at Urbana-Champaign Metals Processing Simulation Lab Lan Yu
-6
-4
-2
0
2
4
-6
-4
-2
0
2
4
0 800 1 6 0 0 2400 3200 4 0 0 0 4800 5600
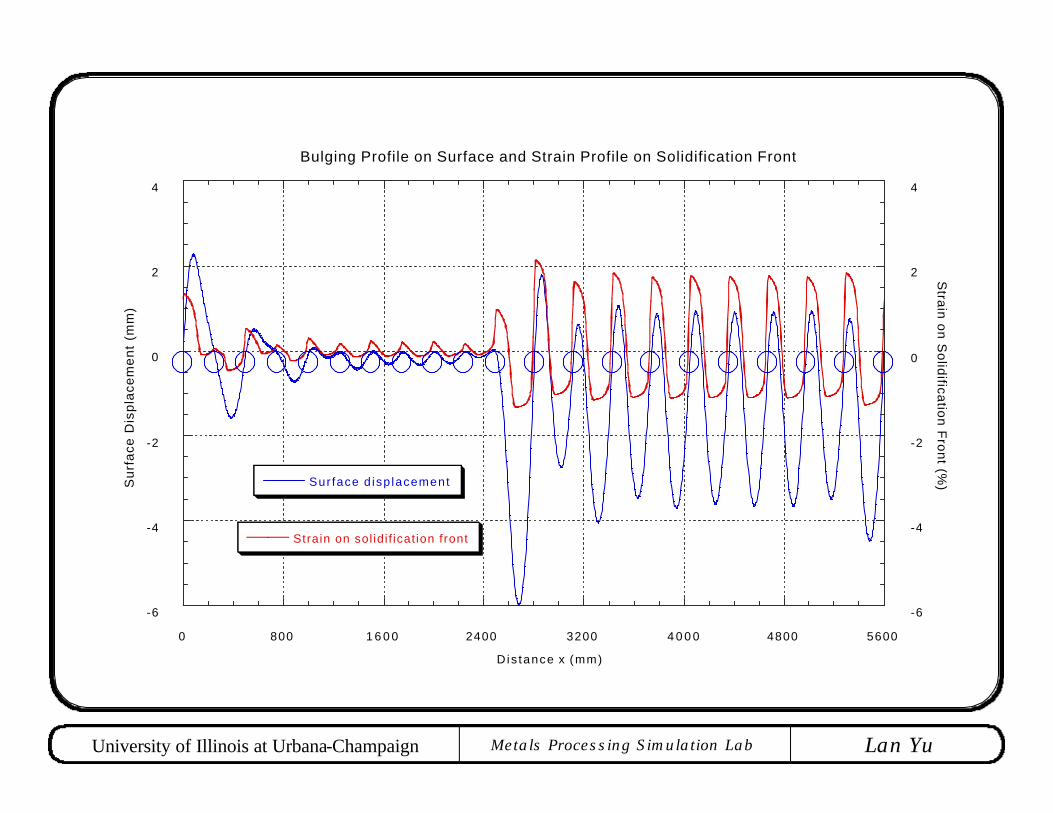
Bulging Profile on Surface and Strain Profile on Solidification Front
Sur face d isp lacement
Strain on sol idi f icat ion front
Sur
face
Dis
plac
emen
t (m
m)
Strain on S
olidification Front (%)
Dis tance x (mm)

University of Illinois at Urbana-Champaign Metals Processing Simulation Lab Lan Yu
Observations
l Current model qualitatively matches Sumitomo measurements and simulation by J. Gancarz, et al.
l Sudden roll pitch change leads to a larger bulge and bigger tensile strain on solidification front.
l Disturbance from upstream rolls settles down (within 2%) after 4 roll pitches. l Maximum tensile strain on solidification front is located on top of the rolls, instead of maximum
negative bulge.
Uniform 250mm
Sudden change from 250mm to 310mm
Uniform 310mm
Increase (sudden/uniform)
Maximum bulge 0.34 mm 5.96 mm 3.67 mm 62%
Negative bulge 0 mm 1.78 mm 0.93 mm 91%
Max strain on sol. front 0.2% 2.1% 1.75% 20%
Sudden change of roll pitch from 250mm to 310mm
Uniform 310mm roll pitch
Increase (sudden/uniform)
Sumitomo measurements 4.6 mm 3.2 mm 44%
J. Gancarz et al. model 3.6 mm 2.0 mm 80%
Our model 5.96 mm 3.67 mm 62%

University of Illinois at Urbana-Champaign Metals Processing Simulation Lab Lan Yu
Evaluation of Empirical Bulging Prediction Equations
l Okamura Equation (based on FEM simulations):
Where,
l Palmaers Equation (based on beam bending analysis):
where,
l Lamant Equation (based on beam bending analysis):
nc
msurf
lkjb VTLPDLWAFd )/(,max =ε
47.54.0
18.216.714
max ))273(003866.0exp(104088.7DV
HLTd
csurf +×= −
8.322.0
12.55.1
max )(4623.0DV
LPTCd
c
surf=
°=×
°=×
°=×
=−
−
−
C1100 10929.0
C1000 10725.0
C900 10609.0
)(4
4
4
surf
surf
surf
surf
T
T
T
TC
{ } )2/cosh(2/2)2/tanh()2/(1)/( LWLWLWLWF πππ +−=

University of Illinois at Urbana-Champaign Metals Processing Simulation Lab Lan Yu
Comparison of Different Models
Conclusion: o Okamura Equation is always much too low.
o Lamant Equation is ok except for Armco case (too low).
o Palmaers Equation matches measurements and our model pretty well.
* Must use surface temperature = 1100 C instead of 1220 C, so prediction is really higher.
Wunnenberg case (860mm)
Sumitomo case (310mm)
Mold exit case (165mm)
Okamura Equation 1.4985 0.4680 0.0012
Palmaers Equation 10.2025 3.5596 * 0.0332
Lamant Equation 9.0123 3.8384 0.0033
Our Model 10.61 3.67 0.02
Measurement 5~7 3.2 N/A

University of Illinois at Urbana-Champaign Metals Processing Simulation Lab Lan Yu
Limitation and Future Work
l Need more appropriate material properties at high temperature for each individual case
l Results should be more quantitative
l Applications– Crack formation
– Slab width prediction