feko mesh optimization study of the edges antenna...
TRANSCRIPT

FEKO Mesh Optimization Study of the EDGES Antenna Panels with Side Lips using a Wire Port and an Infinite Ground Plane
Tom Mozdzen
12/08/2013
Summary This study evaluated adaptive mesh refinement in the FEKO simulation environment of the EDGES antenna panels with side lips by measuring S11 from 90 to 210 MHz for a series of increasingly refined meshes. The mesh refinement effect was evaluated for a variety of pin port radii using both surface and volume representation of the antenna’s panels.
The meshing refinement process consisted of the following iterative process:
1) Create an initial mesh using a conservative custom triangle edge length ( 3 to 4 inches) 2) Request “Error Estimation” 3) Run the FEKO solver to obtain S11 vs. Frequency and the Error Estimation results 4) Add one adaptive meshing request 5) Re-mesh 6) Validate the mesh for E&M computational consistency 7) Go to step 3 if the mesh is valid and more accuracy is needed.
The high level conclusions are as follows:
1) In order to generate an S11 result independent of meshing parameters, the surface FEKO model needed 1000-2000 mesh triangles, and the FEKO volume model needed 2000 – 5000 mesh triangles.
a. Note: Use of a larger port radius wire will limit the number of mesh refinement steps as the wire is segmented by the adaptive meshing process causing an eventual failure of the “thin wire”.
2) The number of mesh triangles required for convergence in FEKO can be reduced by the use of adaptive meshing which generates mesh triangles of different sizes. The same S11 convergence results can be obtained without adaptive meshing by using a large number of uniform mesh triangles, but longer simulation times will be needed.
3) The port wire radius affected the location of the second resonance. As the radius went from 0.3” to 0.01”, the second resonance location went from 174 MHz to 162 MHz.
4) S11 results for CST and FEKO generally agree with each other on the location of resonances to within ~3 MHz, but differ by a few dB in absolute magnitude.
Recommendations for FEKO surface (volume) model simulations are to adaptively re-mesh and re-run until 1500 (5000) mesh triangles are created. Use of a thin wire port is recommended to avoid interfering with mesh adaptation. Future work should focus on determining a port design to excite the panels in a manner consistent with its eventual connection to a balun.

Introduction
A study was carried out to compare FEKO simulation results using a simplified model of the EDGES antenna, varying the port wire radius and the meshing methods. The model used only the flat panels and the side lips of the four-point design (See Figure 1). There were no inter-panel capacitors and the structure was placed above an infinite (implicit) ground plane. The reflection coefficient, S11, was measured between the frequencies of 90 MHz and 210 MHz in steps of 2 MHz (0.2 MHz near the second resonance between 158 and 164 MHz). A brief comparison to CST results using comparable port pins was also made.
Two FEKO models were explored: A FEKO model using surface structures having no thickness (surface model) ; and a FEKO model using structures with a thickness of 1/16” (volume model). For the surface model, the antenna panels were placed as far above the ground plane as the top surface of the panel in the volume model. Placing it at the panel’s bottom surface would have simply meant it would have been 1/16” closer to the ground plane.
As mentioned in the summary, adaptive meshing was used for the FEKO simulations. FEKO run time is highly dependent upon the number of surface mesh triangles. Therefore, it is recommended to begin with coarse (large triangles) meshing and only use small triangles in the areas that need them as determined by error estimation obtained via a FEKO S11 simulation. This is best accomplished using adaptive meshing.
While multiple mesh adaptation requests can be made after one simulation (each would address smaller error estimations), FEKO support recommended adding one mesh adaptation request per run to get the most accurate and up to date error estimation (see Fig. 2). Each adaptive mesh request considered smaller errors than the previous adaptive mesh request. To speed up the mesh adaptation process, one can simulate just two frequencies in the range of interest (the high and the low frequencies – or just the highest frequency) and then use a finer frequency step once the mesh is refined satisfactorily.
CAD FEKO highlighted the areas of mesh refinement when an adaptive mesh request was made. Figure 3 shows the progressive regions of refinement as the number of adaptive mesh requests progressed from 1 to 6 requests.
The size of the port pin also played an important role. The location of the 2nd resonance was dependent upon the size of the radius. Furthermore, this wire became segmented during meshing. Once the wire is sliced up too thinly, FEKO issued an error that the wire segment length is less than the wire diameter and that the thin wire approximation is no longer valid.
CST uses a time domain solver which generated results at all frequencies once the time domain solution has completed. CST uses a gridded mesh. FEKO uses a method of moments solver which requires an individual solution at each frequency point desired. However, the mesh is only created once by considering the highest frequency in the range of requested frequencies.

Figure 1. EDGES antenna model using surfaces in FEKO.
Figure 2. CAD FEKO user interface showing the 4th meshing step. One mesh step without adaptive refinement and three mesh runs with adaptive refinement made up the four meshes.

Figure 3. Progressive mesh refinement. Panel (a) is the initial mesh, (b) is the first refinement, and (f) is the last refinement. Note: Panels (b) and (c) are not identical, just very similar.
(a) (b)
(c) (d)
(e) (f)

Simulation Setup
Figure 1 above shows the antenna model while Figures 4 and 5 below show the FEKO and CST port pins. Note how the FEKO pin has been segmented into 3 pieces by the meshing algorithm. The CST pin was cut in half so that CST can accept a port on the two wires. Figure 6 shows the CST gridding near the port. Table 1 lists the physical parameters of the antenna.
Table 1. Physical Antenna Parameters Parameter Value (meters) Diagonal 0.685 Gap 0.0089 Lip 0.017 Metal thickness 0.0015875 (1/16”) Side Length 0.375 Height above ground plane 0.525 (add 1/16” for the surface model)
Tables 2 and 3 list the details of the adaptive meshing runs. The initial mesh specified custom triangle edge lengths of 3” and one wire segment of 2”. This resulted in 600 mesh triangles and one wire segment for the surface model and 1422 mesh triangles and one wire segment for the volume model. The volume model is expected to have roughly 2x the number of mesh triangles as the surface model because the surface area of the volume model is twice that of the surface model.
As seen in Tables 2 and 3, the port wires with a larger radius failed the thin wire approximation at earlier mesh refinement steps than the thinner wires, due to the increasing segmentation of the port wire by the adaptive meshing process. When an error occurs, the FEKO solver cannot be run and no S11 results are possible.
The mesh size increased with each adaptation run and the simulation time tracked the number of mesh triangles. Figure 7 graphs the combined runtime, memory, and mesh triangle count statistics. The CPU times and memory requirements are for one of the four threads which ran in parallel. Total memory requirements and CPU time is therefore four times the numbers listed in the table and on the graph. Each FEKO simulation ran 61 frequencies sequentially using the same mesh. CST run times were approximately 3000 seconds, but CST converts the time domain results into the frequency domain with sub-MHz step sizes.
The computer system used in the simulations was running Windows 7 64 bit Professional using an Intel Core i7-4770K CPU running at a base frequency of 3.50 GHz with 32 GB of system RAM. Four threads ran in parallel because both FEKO 6.3 and CST 2013 (Oct. update) do not use hyper-threading.

Table 2. FEKO Surface Model meshing iteration data. The “Warnings” and “Errors” refer to a violation of the E&M thin wire approximation of the port pin. S11 curves can be generated for meshes with warnings but not for meshes with errors. A checkmark means that S11 vs. frequency results were generated.
Surface Model Mesh 1 Mesh 2 Mesh 3 Mesh 4 Mesh 5 Mesh 6 Mesh 7 Mesh 8 Wire Segments 1 1 3 7 12 17 23 28 Mesh Triangles 600 724 898 1145 1668 1920 4095 4807 CPU time (s) 62 84 120 200 420 520 3010 - r = 0.3” Warning Warning Warning Error r = 0.1” Warning Error r = 0.05” Warning Warning Error r = 0.01” Warning Error
Table 3. FEKO Volume Model meshing parameters. Volume Model Mesh 1 Mesh 2 Mesh 3 Mesh 4 Mesh 5 Mesh 6 Mesh 7 Mesh 8 Wire Segments 1 1 6 8 12 18 20 23 Mesh Triangles 1422 2000 2150 4764 6242 7296 8032 9092 CPU Time (s) 290 580 600 3100 3500 3800 4000 - r = 0.3” Warning Warning Error r = 0.1” Warning Error r = 0.05” Warning Warning Error r = 0.01” Warning Warning Error
Figure 4. Close up of the FEKO port. Note that the wire has been segmented into three pieces.

Figure 5. CST close up view of the physical port with a 0.050” cut in the port wire.
Figure 6. Gridding in CST

Figure 7. Run-time statistics. Runs 1-4 are from the surface model and runs 11-14 are from the volume model. Runs 5-10 are an even mixture of surface and volume models.
Simulation Results This section will present representative graphs of the key results. The full set of result graphs is presented in Appendix A.
Surface Model Mesh Refinement Figures 8a and 8b show the effect of mesh refinement using a 0.1” port radius with the FEKO surface model. The initial number of mesh triangles was 600 and the final mesh consisted of 1145 triangles. The S11 magnitudes of the final two meshes produced results with a difference of +0.2 dB to -0.7dB even in the areas of resonance. Similar results using other port radii can be seen in Figures A1a – A4c in the appendix. Notice how the S11 response converges as the mesh refinement continues. Our conclusion from these meshing simulations is that an optimized mesh triangle count of at least 1145 should be used for the surface model of the EDGES antenna.
Volume Model Mesh Refinement Figures 9a - 9c show the effect of mesh refinement using a 0.01” port radius with the FEKO volume model. The initial number of mesh triangles was 1422 and the final mesh consisted of 8032 triangles. The S11 magnitudes of the meshes 6 and 7 produced results with a difference of +0.05 dB to -0.03dB even in the areas of resonance. The resonance frequency shifted by 0.8 MHz between meshes 3 and 4, which is caused by the increase in mesh refinement in response to the error estimates.
Results using other port radii can be seen in Appendix Figures A5a – A8c. Our conclusion from these meshing simulations is that an optimized mesh triangle count of 7300 should be used for best results.

Because the volume model begins with more mesh triangles, the accuracy was high from the beginning. Not shown in this report are simulations to confirm the previous statement. When uniform triangles edges of 6” were used in the initial mesh, resulting in a triangle count of 686, the initial results showed more variation from the final mesh result similar to what is seen in the surface models.
To be able to use more triangles in the surface model, a smaller beginning uniform mesh triangle edge should be specified. The extra mesh triangles produced in the volume model’s initial mesh are not redundant. They help the mesh converge more quickly, but at the expense of simulation time.
Effect of Port Pin Radius Figures 10a – 10c show the effect of the pin radius using the FEKO surface, FEKO volume, and CST models. The smaller pin radius shifted the second resonance to lower values by as much as 12 MHz. Since this is a major effect, care must be taken to choose a proper pin radius. This is an area of future work.
Fixed Pin Radius – Comparison between the Models Figures 11a – 11d compare the FEKO surface, FEKO volume, and CST models while using a converged mesh and a fixed pin radius. To compare CST as closely to FEKO as possible, a physical port pin was added to the CST model, but then a 0.050” section was sliced out of the pin so that CST could view this as a port and not a short circuit.
There is a qualitative agreement between the simulators. CST in general produced S11 values lower than the corresponding FEKO results. There was better agreement as to the placement of the resonance points. All simulators agreed that the first resonance should be at 105 MHz independent of port radius. The second resonance was dependent upon port radius, but the simulators agreed to within 3 MHz of each other for the large pin radii and to within 1.6 MHz for the 0.01” radius models.
Conclusions
The surface and volume FEKO models produce similar S11 results when given enough refinement in mesh triangles. A meshing study should be made to determine the point at which mesh refinement becomes counterproductive. 1000 to 2000 optimized triangles for the surface model and 4000 to 5000 triangles for the volume model are appropriate for the EDGES simulator.
CST results using a dimensionless port connection matched the thinnest port wire radius (0.01”) the best. A meshing study should be done for CST to determine the optimum number of grid points. It is possible that CST is not gridded optimally.
For future work, the excitation of the antenna in these simulations needs to be looked at. Hopefully, there is a better way to excite the panels than with a wire that doesn’t exist in the real antenna but does have a real effect in the simulation.
Many thanks to Alan Rogers and Chris Beaudoin for helpful suggestions with FEKO simulations. Also thanks goes to the FEKO support team who answered many of my questions about FEKO.

Figure 8a. FEKO surface model showing S11 convergence with mesh refinement using a pin radius of 0.1”. The first mesh used 600 mesh triangles and the last refinement used 1145 mesh triangles.
Figure 8b. Delta S11 between successive meshing iterations.

Figure 9a. FEKO volume model showing S11 convergence with mesh refinement using a pin radius of 0.01”. The first mesh used 1422 mesh triangles and the last refinement used 8032 mesh triangles.
Figure 9b. Delta S11 between successive meshing iterations. After mesh solution 5, the differences in S11 are less than 0.1 dB, occurring when S11 is ~ -21 dB.

Figure 9c. Detailed view of the minimum point with a resolution of 0.2 MHz. The first three solutions have minimums at 161.6 MHz and the next four are at 160.8 MHz.
Figure 10a. The effect of the port pin’s radius upon the S11 response using the FEKO surface model. The S11 curve chosen for each port radius is one of the converged mesh results for that pin size.

Figure 10b. The effect of the port pin’s radius upon the S11 response using the FEKO volume model. The S11 curve chosen for each port radius is one of the converged mesh results for that pin size.
Figure 10c. The effect of the port pin’s radius upon the S11 response using the CST model with various two-piece physical pins. Also shown is the result for the ideal zero diameter CST pin.

Figure 11a. Comparison of the three models using a fix pin radius of 0.3”
Figure 11b. Comparison of the three models using a fix pin radius of 0.1”

Figure 11c. Comparison of the three models using a fix pin radius of 0.05”
Figure 11d. Comparison of the three models using a fix pin radius of 0.01”

Appendix A. Complete Set of Simulation Graphs
Figure Number Brief Graph Description FEKO Surface Model Graphs
A1a S11 progression with mesh refinement. Port radius = 0.3” A1b Delta S11 between successive mesh refinements. Port radius = 0.3” A2a S11 progression with mesh refinement. Port radius = 0.1” A2b Delta S11 between successive mesh refinements. Port radius = 0.1” A3a S11 progression with mesh refinement. Port radius = 0.05” A3b Delta S11 between successive mesh refinements. Port radius = 0.05” A4a S11 progression with mesh refinement. Port radius = 0.01” A4b Delta S11 between successive mesh refinements. Port radius = 0.01” A4c Zoomed view: delta S11 between successive mesh refinements. Port radius = 0.01”
FEKO Volume Model Graphs A5a S11 progression with mesh refinement. Port radius = 0.3” A5b Delta S11 between successive mesh refinements. Port radius = 0.3” A6a S11 progression with mesh refinement. Port radius = 0.1” A6b Delta S11 between successive mesh refinements. Port radius = 0.1”. A7a S11 progression with mesh refinement. Port radius = 0.05” A7b Delta S11 between successive mesh refinements. Port radius = 0.05”. A8a S11 progression with mesh refinement. Port radius = 0.01” A8b Delta S11 between successive mesh refinements. Port radius = 0.01”. A8c Zoomed view: delta S11 between successive mesh refinements. Port radius = 0.01”
Port wire radius effect upon S11 for a converged mesh A9a FEKO Surface Model A9b FEKO Volume Model A9c CST Model
Comparison between FEKO Surface, FEKO Volume, and CST models for a fixed port wire radius A10a Radius = 0.3” – One S11 plot per model type: FEKO surface, FEKO volume, CST A10b Radius = 0.1” – One S11 plot per model type: FEKO surface, FEKO volume, CST A10c Radius = 0.05” – One S11 plot per model type: FEKO surface, FEKO volume, CST A10d Radius = 0.01” – One S11 plot per model type: FEKO surface, FEKO volume, CST
FEKO memory, simulation time, and mesh triangle counts vs. mesh refinement iteration A11 Volume and surface model data merged

Figure A1a. FEKO surface model showing S11 convergence with mesh refinement using a pin radius of 0.3”. The first mesh used 600 mesh triangles and the last refinement used 898 mesh triangles.
Figure A1b. Delta S11 between successive meshing iterations.

Figure A2a. FEKO surface model showing S11 convergence with mesh refinement using a pin radius of 0.1”. The first mesh used 600 mesh triangles and the last refinement used 1145 mesh triangles.
Figure A2b. Delta S11 between successive meshing iterations.

Figure A3a. FEKO surface model showing S11 convergence with mesh refinement using a pin radius of 0.05”. The first mesh used 600 mesh triangles and the last refinement used 1668 mesh triangles.
Figure A3b. Delta S11 between successive meshing iterations.
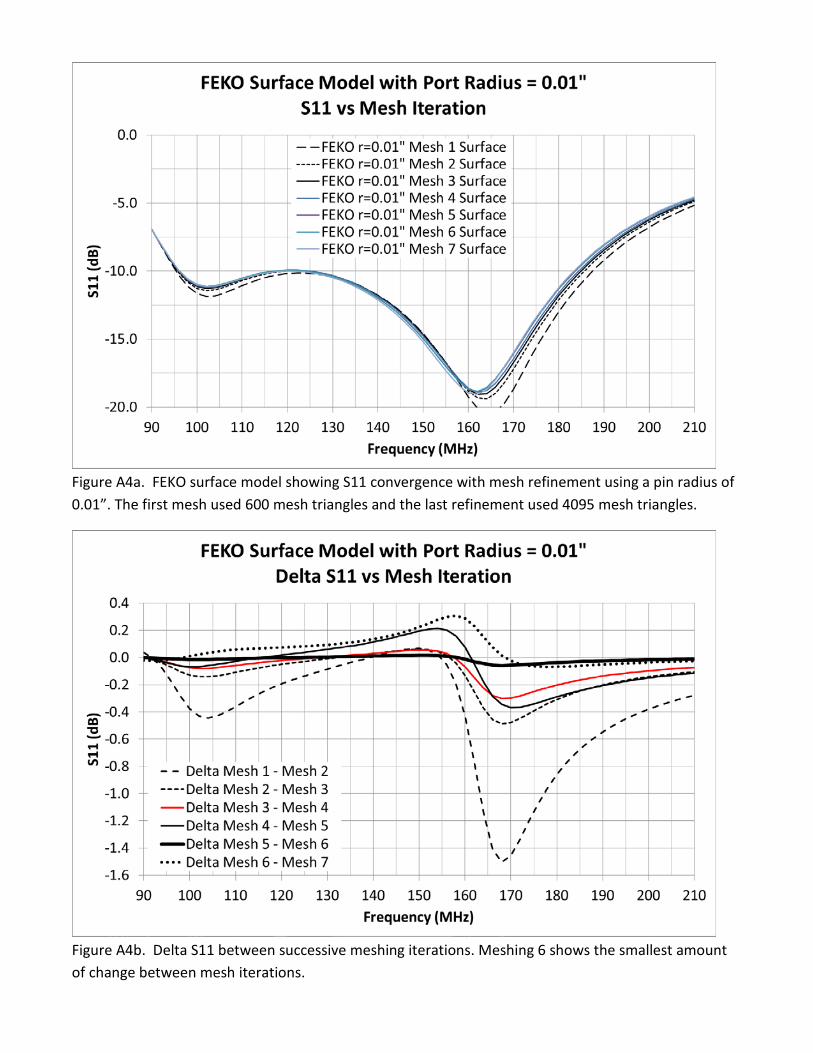
Figure A4a. FEKO surface model showing S11 convergence with mesh refinement using a pin radius of 0.01”. The first mesh used 600 mesh triangles and the last refinement used 4095 mesh triangles.
Figure A4b. Delta S11 between successive meshing iterations. Meshing 6 shows the smallest amount of change between mesh iterations.

Figure A4c. Detailed view of Figure 10a. Notice how the first three solutions are at a minimum at 164 MHz, but then the next three solutions shift to 162 MHz. The solution only has data points every 2 MHz. The frequency shift is investigated with more resolution using the volume model which is shown in Figure 14b.

Figure A5a. FEKO volume model showing S11 convergence with mesh refinement using a pin radius of 0.3”. The first mesh used 1422 mesh triangles and the last refinement used 2000 mesh triangles. The volume model converges quicker than the surface model due to the larger number of initial mesh triangles.
Figure A5b. Delta S11 between successive meshing iterations.

Figure A6a. FEKO volume model showing S11 convergence with mesh refinement using a pin radius of 0.1”. The first mesh used 1422 mesh triangles and the last refinement used 2150 mesh triangles.
Figure A6b. Delta S11 between successive meshing iterations.

Figure A7a. FEKO volume model showing S11 convergence with mesh refinement using a pin radius of 0.05”. The first mesh used 1422 mesh triangles and the last refinement used 4764 mesh triangles.
Figure A7b. Delta S11 between successive meshing iterations.

Figure A8a. FEKO volume model showing S11 convergence with mesh refinement using a pin radius of 0.01”. The first mesh used 1422 mesh triangles and the last refinement used 8032 mesh triangles.
Figure A8b. Delta S11 between successive meshing iterations. After mesh solution 5, the differences in S11 are less than 0.1 dB, occurring when S11 is ~ -21 dB.
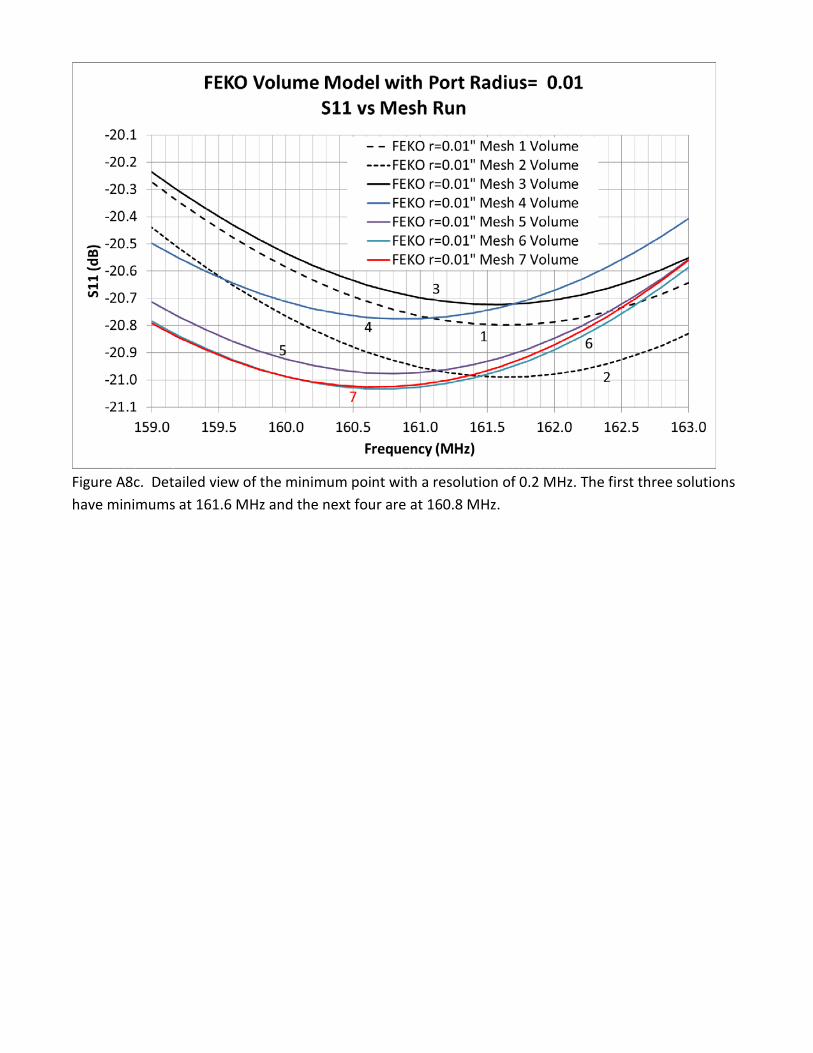
Figure A8c. Detailed view of the minimum point with a resolution of 0.2 MHz. The first three solutions have minimums at 161.6 MHz and the next four are at 160.8 MHz.

Figure A9a. The effect of the port pin’s radius upon the S11 response using the FEKO surface model. The S11 curve chosen for each port radius is one of the converged mesh results for that pin size.
Figure A9b. The effect of the port pin’s radius upon the S11 response using the FEKO volume model. The S11 curve chosen for each port radius is one of the converged mesh results for that pin size.

Figure A9c. The effect of the port pin’s radius upon the S11 response using the CST model with various two-piece physical pins. Also shown is the result for the ideal CST pin which is a wire of zero diameter.

Figure A10a. Comparison of the three models using a fix pin radius of 0.3”
Figure A10b. Comparison of the three models using a fix pin radius of 0.1”

Figure A10c. Comparison of the three models using a fix pin radius of 0.05”
Figure A10d. Comparison of the three models using a fix pin radius of 0.01”

Figure A11. Run-time statistics. Runs 1-4 are from the surface model and runs 11-14 are from the volume model. Runs 5-10 are an even mixture of surface and volume models.