feeding studies of dietary diacylglycerol oil in …
TRANSCRIPT

FEEDING STUDIES OF DIETARY DIACYLGLYCEROL OIL IN NORMAL AND LIPOPROTEIN LIPASE-DEFICIENT CATS
___________________________________________________
A Thesis presented to the Faculty of the Graduate School University of Missouri
__________________________________
In Partial Fulfillment Of the Requirements for the Degree
Master of Science
_________________________
by CRAIG DATZ
Dr. Robert Backus, Thesis Supervisor
DECEMBER 2008

The undersigned, appointed by the Dean of the Graduate School, have examined the thesis entitled
FEEDING STUDIES OF DIETARY DIACYLGLYCEROL OIL IN NORMAL AND LIPOPROTEIN LIPASE-DEFICIENT CATS
Presented by Craig Datz A candidate for the degree of Master of Science And hereby certify that in their opinion it is worthy of acceptance.
__________________________________________
Dr. Robert Backus
__________________________________________
Dr. Kevin Fritsche
__________________________________________
Dr. David Ledoux

ACKNOWLEDGEMENTS
Dr. Robert Backus served as a mentor and advisor throughout the project. He
originated the idea for the studies and provided guidance, expertise, and laboratory
support for all steps involved in carrying out the research.
Dr. Kevin Fritsche also provided a great deal of guidance and the use of his
laboratory facilities for performing much of the hands-on research.
Dr. David Ledoux allowed the use of his laboratory facilities for a portion of the
project and was always available to help with questions and procedures.
Dr. Jon Ramsey served as the principal investigator at the University of
California, Davis, where the feeding studies were performed. He provided oversight and
assistance with animal protocols.
Deborah Bee was the supervisor of the Feline Nutrition and Pet Care Center at
U.C. Davis and carried out the actual feeding studies. Her expertise in handling and
caring for the cats in the colony was invaluable in completing the research.
Ying Liu and Dr. Tom Thomas, Department of Nutritional Sciences, allowed the
use of their laboratory facilities for a portion of the research and Ying Liu assisted with
the statistical analysis of the data. Lada Micheas, assistant director of the Social Science
Statistics Center, also assisted with statistical analysis. Harold Huff, Department of
Biological Engineering, provided equipment and guidance in diet preparation.
Funding in part was provided by a Resident Research grant from Nestlé Purina
PetCare, St. Louis, Missouri.
ii

TABLE OF CONTENTS
ACKNOWLEDGEMENTS…………………………………………………………….…ii
LIST OF TABLES………………………………………………………………………..iv
LIST OF ILLUSTRATIONS……………………………………………………………...v
Chapter
1. DIACYLGLYCEROL OIL – AN INTRODUCTION AND LITERATURE
REVIEW…………………………………………………………………………..1
2. LIPOPROTEIN LIPASE DEFICIENCY AND RATIONALE FOR STUDY……..24
3. PALATABILITY OF DIETARY DAG OIL IN HEALTHY CATS………………28
4. EFFECT OF DIETARY DIACYLGLYCEROL OIL ON
HYPERTRIGLYCERIDEMIA IN LIPOPROTEIN
LIPASE-DEFICIENT CATS…………………………………………………….41
APPENDIX
1. NUTRIENT COMPOSITION OF TEST DIETS…………………………………..59
2. PALATABILITY STUDY DATASHEET…………………………………………60
3. DAILY FOOD INTAKES FOR INDIVIDUAL CATS…………………………,,,.61
BIBLIOGRAPHY………………………………………………………………………..66
iii

LIST OF TABLES
Table Page
1. DAG content of vegetable oils……….…….…………………………………………..4
2. Studies showing reduced serum TAG………………..……………………………….15
3. Studies showing no change in serum TAG.…………………………………………..16
4. Effect of long-term administration of DAG oil on serum lipid levels in an LPL-deficient patient………………...…………………………………………..…22
5. Changes in body weights……………………………………………………………..32
6. Statistical analysis of total food intake by type of diet.……........................................35
7. Statistical analysis of total food intake normalized to MBW by type of diet………...36
8. Acylglycerol and fatty acid compositions of the test oils………………………….…43
9. Ingredient composition and macronutrient contribution to ME of treatment diets…..44
10. Serum TAG, cholesterol, and NEFA concentrations in LPL-deficient cats when given diets with TAG or DAG vegetable oils as fat sources…………….….51
11. Serum concentrations of TAG, cholesterol, and NEFA by diet sequence…………..51
12. Daily food intakes by diet and intakes normalized to metabolic BW……………….53
iv

v
LIST OF ILLUSTRATIONS
Figure Page
1. Representations of chemical structures…………………………………………….…..3
2. Representation of TAG and DAG………………………………………………….…..4
3. Digestion and absorption of TAG and DAG…………………………………………..8
4. Mean changes from baseline in serum triacylglycerol concentrations after ingestion of diacylglycerol emulsion or triacylglycerol emulsion……………………………13
5. Postprandial serum TAG responses after ingestion of 3 different oils in an LPL-deficient patient………………………...………………………………….….21 6. Serum lipid changes after ingestion of diacylglycerol or triacylglycerol oil…….…...23
7. Weekly body weights by cat ID #.................................................................................33
8. Total food intake during trial………………………………………………………....34
9. Total food intake during trial divided by ending metabolic body weight……….…....35
10. Serum TAG concentration in LPL-deficient cats given diet with DAG and TAG vegetable oils as fat sources……………………………………..…..….50

CHAPTER 1. DIACYLGLYCEROL OIL – AN INTRODUCTION AND
LITERATURE REVIEW
Obesity is a significant issue in the United States, with recent surveys suggesting
prevalence rates of 33-35% in adults and 16% in children (CDC 2008). A number of
serious health problems are associated with obesity such as hypertension, osteoarthritis,
type 2 diabetes, coronary heart disease, stroke, and dyslipidemia (high levels of
cholesterol and/or triglycerides). Treatment of obesity with calorie-restricted or low-fat
diets is often unsuccessful due to lack of compliance. The Centers for Disease Control
and other health professionals are currently targeting several areas to help manage
overweight and obesity, including increasing physical activity, decreasing television
viewing, increasing consumption of fruits and vegetables, and decreasing consumption of
high energy-dense foods. However, simply encouraging Americans to make lifestyle
changes may not affect obesity rates.
Another strategy to manage obesity involves alterations in foods and food products with
the goals of decreasing caloric or fat density or adding, subtracting, or modifying
ingredients and additives to promote weight loss and health. One example is olestra
(Olean®, Procter and Gamble), a dietary fat substitute produced by transesterifying fatty
acids from triglycerides onto sucrose. It is not metabolized by digestive enzymes, so it
does not contribute fat or calories (Procter and Gamble 2008). However, consumer
acceptance of olestra has been limited by reports of side effects. Z Trim® gel is another
example of a fat substitute that is currently available for consumers and food
1

manufacturers. This product is made from insoluble plant fiber (cellulose and
hemicellulose from corn, oats, soy, or other grains) combined with water (Z Trim
Holdings 2008).
A novel cooking and salad oil with a high concentration of diacylglycerols (DAG) was
introduced in Japan in 1999 (Econa®, Kao Corporation) and in the U.S. in 2003 (Enova®
oil, ADM-Kao LLC). The Enova product label prominently states “Less Is Stored In The
Body As Fat” because it “is metabolized in a slightly different way” than conventional
oils. Other product claims include “Results in lower serum triglyceride levels after a
meal” and “Lower in saturated fat than canola oil”. Research dating back to 1993 has
demonstrated several interesting effects in both lab animals and humans. These include a
reduction in serum triglyceride levels and post-prandial lipemia, decreased body weight,
and decreased body fat (especially visceral fat). Potential health benefits have been
demonstrated in different populations (e.g. healthy, overweight, diabetic). The following
is a description of DAG oil along with a discussion of metabolism and possible
mechanisms explaining its effects.
2

A. Description
The typical structure of dietary lipids (fats and oils) consists of glycerol with free fatty
acids substituted for hydroxyls by ester linkages (Figure 1). Acylglycerols occur
naturally as monoacylglycerol (MAG, 1-Monoacyl-sn-glycerol), diacylglycerol (DAG,
1,2- or 1,3-Diacyl-sn-glycerol), and triacylglycerol (TAG, 1,2,3-Triacyl-sn-glycerol)
(Brenna and Sacks 2006).
Figure 1. Representations of chemical structures. (http://www.public.iastate.edu/~cfford/101triacylglycerol.gif)
3

Vegetable oils consist primarily of triacylglycerols, but small amounts of diacylglycerols
are also variably present (Table 1) Table 1. DAG content of vegetable oils Oil DAG content Soybean 1.0% Safflower 2.1% Corn 2.8% Palm 5.8% Cottonseed 9.5%
(D’Alonzo et al 1982, Abdel-Nabey et al 1992).
DAG can be synthesized enzymatically from
vegetable oils by using the reverse reaction
of 1,3-specific lipase (Figure 2) (Macrae 1983, Watanabe et al 2003). The result is a
stable mixture consisting mainly of 1,3-DAG with smaller amounts of 1,2 (2,3)- DAG
due to acyl migration. The ratio of 1,3-DAG to 1,2 (2,3)- DAG equilibrates to
approximately 7:3 during the refining process and storage following the synthesis process
(Watanabe et al 2003).
Figure 2. Representation of TAG and DAG (Tada 2004).
4

B. Properties
DAG oil was found to have similar energy and apparent digestibility values to TAG oil in
a feeding study in laboratory rats (Taguchi et al 2001). The fatty acid content of DAG oil
varies in types and amounts depending on which vegetable oils are used in the enzymatic
synthesis process. When TAG oil is used in comparative studies, blends of vegetable oils
are used to create a mixture with a similar fatty acid profile as DAG oil.
The use of DAG oil in cooking has been reported. Thermal oxidation appeared to be
similar to TAG oil and dependent on fatty acids rather than molecular structure (Shimizu
et al 2004). Smoke and flash points are slightly less for DAG oil compared with TAG
and more free fatty acids are produced (Li et al 2005). Oxidative stability when DAG is
used in butter blends is similar to TAG but sensory characteristics (salty, buttery) are
reduced (Kristensen et al 2006).
C. Safety
In the U.S., commercial DAG oil is classified as GRAS (Generally Recognized As Safe)
by the Food and Drug Administration. In Japan, DAG is approved by a similar
governmental agency as FOSHU (Foods Approved for Specific Health Use). The use of
DAG oil in food products in the U.S. is limited to cooking oil and as an ingredient in
salad dressing and mayonnaise.
5

Safety studies have been conducted in humans and laboratory animals. Certain vitamins
are fat-soluble and absorption can depend on the type and amount of dietary lipids. In
one study, healthy men ingested 20 g DAG or TAG daily for 12 weeks. At 4, 8, and 12
weeks, fasting serum concentrations of vitamin A (retinol), vitamin D (25-hydroxy- and
1-α-25-dihydroxy-vitamin D), and vitamin E (α-, β-, and γ-tocopherol) were measured.
No significant differences were seen between the two groups (Watanabe et al 2001).
In rats, DAG oil fed at 2.65% and 5.3% of the diet for 105 weeks did not cause any
significant toxicological or treatment-related effects (Soni et al 2001). Genotoxicity
potential was evaluated in mice using a bacterial reverse mutation assay, a chromosomal
aberration assay, and a bone marrow micronucleus assay with both plain and heated DAG
oil. No genotoxic effects were seen under the conditions of normal use (Kasamatsu et al
2005). A one-year study starting in 2.5-month-old dogs using varying levels of dietary
DAG or TAG from 0% to 9.5% revealed no differences in clinical conditions, body
weights, growth, food intakes, laboratory measures, or pathologic findings (Chengelis et
al 2006).
Carcinogenicity potential was evaluated in 24-month studies in both rats and mice. DAG
oil up to 5% of the diet did not result in any toxicity or carcinogenic effects compared
with TAG oil (Chengelis et al 2006). No adverse maternal or fetal effects were seen in
pregnant rats at DAG levels of 0-5.0 ml/kg body weight (Morita et al 2008). Heated
DAG oil at 0-5.5% of the diet had no observed effects in rats (Morita et al 2008).
6
D. Metabolism
The normal metabolism of dietary lipids has been reviewed (Tso et al 2006). Briefly,
TAG is hydrolyzed by gastric lipase preferentially at the sn-3 position regardless of the
esterified fatty acids. The resulting compound, 1,2-DAG, may promote the
emulsification of fat in the stomach. In the duodenum, pancreatic lipase acts on the sn-1
and sn-3 positions of TAG and DAG molecules, resulting in 2-MAG and free fatty acids.
To facilitate absorption, bile acids (or salts) solubilize the lipids by forming micelles
which are able to diffuse through the unstirred water layer surrounding the epithelial
surfaces of the enterocytes. Passive uptake and carrier-mediated uptake are proposed
mechanisms for entry of micelles into enterocytes.
Once intracellular, lipids are rapidly reesterified to form TAG, phospholipids, and
cholesteryl esters in the endoplasmic reticulum. Two mechanisms can be involved: the
monoacylglycerol pathway and the glycerol 3-phosphate pathway. The concentration of
2-MAG appears to be directly related to the importance of the MAG pathway, and the
enzymes involved include acyl-CoA:monoacylglycerol acyltransferase (MGAT) and
acyl-CoA:diacylglycerol acyltransferase (DGAT). The glycerol phosphate pathway
becomes the major mechanism when levels of 2-MAG are low. Lipoproteins and
chylomicrons are assembled from TAG, cholesterol, apolipoproteins, and phospholipids
and secreted into the lymphatic system via lacteals of the intestinal villi (Figure 3 top).
7

Figure 3. Digestion and absorption of TAG (top) and DAG (bottom) (Yanai et al 2007).
8

DAG molecules are likewise hydrolyzed by gastric and pancreatic lipase to form MAG
and free fatty acids. The two forms, 1,3-DAG and 1,2 (2,3)-DAG, are thought to be
metabolized in different ways (Tada and Yoshida 2003). 1,2-DAG is hydrolyzed to 2-
MAG and 1,3-DAG is hydrolyzed to 1- or 3-MAG. After uptake into enterocytes, 2-
MAG is reesterified into TAG but there is decreased affinity for 1 (3)-MAG to MGAT.
This may lead to slower synthesis of TAG through the glycerol phosphate pathway and
decreased secretion into the lymphatics. The accumulation of fatty acids in enterocytes
may lead to release into the portal vein directly to hepatocytes, where the fatty acids
would undergo β-oxidation (Figure 3 bottom) (Tada 2004).
Evidence supporting the different metabolic outcomes of TAG and 1,3-DAG has been
reported in several in vitro studies as well as research conducted in lab animals and
humans. Intestinal mucosa studies from rats showed that 2-MAG molecules lead to high
amounts of 1,2-DAG and TAG while 1-MAG molecules lead to 1,3-DAG and low
quantities of TAG through the actions of MGAT and DGAT (Ailhaud et al 1964).
MGAT had 3.9 X more activity with 2-MAG compared with 1-MAG in guinea pig
mucosal studies (Short et al 1974), and 1.6-2.4 X more activity in human mucosal studies
(Bierbach 1983).
Clinical evidence of the metabolism of dietary DAG was first reported in rats (Murata et
al 1994). Rats were treated with emulsions of TAG and DAG, and cannulas in the
thoracic ducts were used to collect lymph fluid. The rates of triacylglycerol and
cholesterol transport in lymph were significantly lower in the DAG group compared with
9

the TAG group at several time points. A followup study (Murata et al 1997) showed that
rats fed DAG had decreased activities of fatty acid synthetase and other enzymes of fatty
acid synthesis as well as increased rates of mitochondrial and peroxisomal oxidation of
palmitoyl-CoA in liver homogenates. Hepatic enzymes involved in the β-oxidation
pathway also had increased activity with DAG compared with TAG. In mice, DAG
stimulated β-oxidation and gene expression of acyl-CoA oxidase, acyl-CoA
dehydrogenase, and uncoupling protein-2 in the small intestine (Murase et al 2002). A
study in rats showed that mucosal TAG synthesis in the small intestine was reduced by
intraduodenally infused DAG compared with TAG (Kondo et al 2003). Lymphatic
transport of radiolabeled TAG and 1,3-DAG was compared in rats, and TAG levels were
significantly reduced after 1 hour in the DAG group while no differences were seen after
2 or 3 hours (Yanagita et al 2004). In pigs, portal vein transport of nonesterified fatty
acids (NEFA) were similar with either a TAG or DAG bolus feeding, but glycerol
concentrations were higher in the DAG group.
A more recent report suggested that in mice chylomicrons formed after ingestion of DAG
compared with TAG have similar total acylglycerol concentration but higher levels of
MAG and DAG (Yasunaga et al 2007). These chylomicrons are cleared more rapidly
from circulation by lipoprotein lipase-mediated lipolysis. Intravenous infusion of DAG
and TAG was also evaluated, and DAG was cleared faster than TAG due to lipolysis and
apolipoprotein E-dependent hepatic uptake.
10

Studies of fat oxidation have been performed to help elucidate the metabolic
consequences of DAG ingestion. In healthy women, dietary DAG increased fat oxidation
measured in a respiratory chamber compared with TAG while energy expenditure was
not different (Kamphuis et al 2003). Another study in healthy men showed a lower
postprandial respiratory quotient (RQ) and higher energy expenditure (EE) after a DAG-
containing meal compared with a TAG meal (Saito et al 2006). No differences were seen
in a third study of healthy men and women in EE and RQ (Hibi et al 2008). However, in
a subgroup analysis of subjects, those with a higher fat ratio had significantly lower RQ
with DAG than TAG. In rats, postprandial oxygen consumption and fat oxidation was
increased after ingesting a DAG emulsion compared with TAG (Kimura et al 2006).
Lower RQ were also seen in a study in rats after a single and short-term DAG dietary
ingestion compared with TAG (Osaki et al 2008).
In summary, the metabolism of dietary DAG has been shown to be different than TAG.
There are several explanations for this difference, including slower and less efficient
assembly of chylomicrons in enterocytes, increased portal circulation of DAG-derived
fatty acids with increased oxidation, and faster and more efficient clearance of DAG-
containing chylomicrons in the circulation. Further studies are needed in both animals
and humans to evaluate the digestion, absorption, and metabolism of DAG compared
with TAG.
11

E. Observations
1. Serum TAG
The most consistently reported effect of dietary DAG oil in humans and animals is
reduction of triglyceride (triacylglycerol, TAG) levels in plasma or serum.
Hypertriglyceridemia is associated with an increased risk of cardiovascular disease in
humans, and medications that lower TAG levels have demonstrated decreased events in
the primary and secondary coronary prevention populations (Citkowitz 2008). Extreme
elevations of TAG (above 1000 mg/dl) may cause acute pancreatitis. In the U.S., the
prevalence of hypertriglyceridemia (> 150 mg/dl) is approximately 35% in men and 25%
in women. Commonly recommended dietary treatments include reduction of fat intake,
restriction of simple carbohydrates and alcohol, and increased fiber. Omega-3 fatty acid
supplementation and aerobic exercise are also recommended. Fibrates, niacin, and statin
drugs may be prescribed to lower high TAG levels (Citkowitz 2008). Because of the
possibility of side effects of drugs and lack of compliance with exercise and diet plans,
substitution of dietary DAG oil for TAG may be a useful adjunctive treatment for
hypertriglyceridemia.
The first reported study of dietary DAG showed reduced TAG levels in normal rats after
17 and 34 days compared with TAG oil (Hara et al 1993). The difference in serum TAG
was approximately 30% lower with DAG. A followup study in normal rats showed a 40-
44% reduction in serum TAG after 14 or 21 days with DAG compared with TAG
12

(Murata et al 1997). The first report in humans was a postprandial study of DAG and
TAG oil emulsions in healthy men (Taguchi et al 2000). At the late postprandial phase (4
and 6 hours after ingestion), serum TAG was reduced approximately 40% with DAG
compared with TAG (Figure 4). Another human postprandial study showed an average
25% reduction in serum TAG at 2, 3, and 8 hours after DAG loading (Tada et al 2001).
A meta-analysis of 10 studies confirmed a significant reduction in postprandial serum
TAG at 2, 4, and 6 hours that was positively correlated with daily dosage (Xu et al 2008).
Figure 4. Mean (± SD) changes from baseline ( ) in serum triacylglycerol
concentrations after ingestion of diacylglycerol emulsion (●) or triacylglycerol emulsion (
). (A) 44g fat ingestion (n = 17); (B) 20g fat ingestion (n = 10); (C) 10g fat ingestion (n
= 13); a: Significantly different from fasting levels, p < 0.05 (Student’s t test for paired
values); b: Significantly different from the corresponding values for the triacylglycerol
emulsion, p < 0.05 (Student’s t test for paired values). (Taguchi et al 2000).
13

A 12-week study was conducted in humans with hypertriglyceridemia (mean, 222 mg/dl)
due to type II diabetes mellitus. DAG oil was substituted for ordinary TAG cooking oil,
and the results showed a 39% decrease in serum TAG compared with baseline (mean,
135 mg/dl) (Yamamoto et al 2001). In contrast, the control group (TAG oil) showed a
12% increase from baseline in serum TAG levels.
A study in humans with insulin resistance but not diabetes used a single dose of DAG or
TAG oil (Takase et al 2005). Postprandial serum samples were analyzed for TAG at 2, 3,
and 4 hours, and there was less increase at each time point in the DAG group (change in
baseline DAG: +17, +27, +18 mg/dl; TAG: +25, +42, +36 mg/dl).
In obese Beagle dogs, a 6-week feeding trial using DAG or TAG oil as a dietary fat
source showed reduced serum TAG in the DAG group (baseline mean 66.0, post-feeding
mean 52.5 mg/dl, 20% decrease) compared with the TAG group (baseline mean 73.7,
post-feeding mean 70.3 mg/dl, 5% decrease) (Umeda et al 2006).
A reduction in serum TAG as a result of DAG consumption was also shown in multiple
studies (Table 2). However, a number of other human and animal studies did not
demonstrate a reduction in serum TAG when DAG was substituted for TAG (Table 3).
14

Table 2. Studies showing reduced serum TAG
Study (et al.) Year Subjects Duration Yanagisawa 2003 Healthy women 8 weeks Sugimoto 2003 Healthy rats 1-12 weeks Meng 2004 Healthy rats 8 weeks Mori 2005 Diabetes-prone rats Postprandial Tada 2005 Diabetic men and women Postprandial Kristensen 2006 Healthy pigs Postprandial Bauer 2006 Healthy dogs Postprandial Ijiri 2006 Atherogenic mice 8 weeks Yamamoto 2006 Diabetic men and women 6 months Yamamoto 2006 Diabetic men and women 3 months Mitsuhashi 2006 Obese dogs Postprandial Tomonobu 2006 Healthy men and women Postprandial Kimura 2006 Healthy rats Postprandial Ai 2007 Healthy and insulin-resistant men Postprandial Fujii 2007 Diabetic atherogenic mice 20 weeks Kim 2007 Healthy rats 6 weeks Yasunaga 2007 Healthy mice Postprandial
15

Table 3. Studies showing no change in serum TAG
Study (et al.) Year Subjects Duration Nagao 2000 Healthy men 16 weeks Murase 2001 Obesity-prone mice 5 months Soni 2002 Healthy rats 77 weeks Taguchi 2002 Healthy rats 21 days Murase 2002 Obesity-prone mice 8 months Maki 2002 Overweight men 24 weeks Sugimoto 2003 Obese rats 5 weeks Yasunaga 2004 Healthy men and women 12 weeks Chengelis 2006 Healthy dogs 12 months Chengelis 2006 Healthy rats 12 months Matsuyama 2006 Obese children 5 months Saito 2007 Obesity-prone rats 15 weeks Ota 2007 Healthy rabbits 50 days Ijiri 2007 Atherogenic mice 8 weeks Kawashima 2008 Obese men and women 1 year Li 2008 Diabetic men and women 4 months DeIulio 2008 Healthy rats 30 days Ramprasath 2008 Overweight women 4 weeks
16

The reasons why DAG oil was not effective in some studies are not apparent.
Differences in subjects, study designs, amount or dose of oil used, effect of diet and other
dietary fats and oils, and other factors may have influenced the results. However, the
nearly 25 studies that did show a TAG-lowering effect of DAG support the theoretical
mechanisms noted in the previous section.
2. Body weight and composition
Another observation is the reduction in body weight and adipose tissue (fat mass)
reported in several studies. The first report in humans was a double-blind controlled trial
in 38 healthy men in which 10 g of DAG or TAG oil was incorporated into a normal
daily diet (Nagao et al 2000). Measurements included anthropometric values, blood
samples, computed tomography (CT), and densitometry. After 16 weeks, the DAG group
had statistically significant reductions in body weight, body mass index (BMI), waist
circumference, total fat area, visceral fat area, subcutaneous fat area, and hepatic fat.
A double-blind randomized, parallel intervention trial study of 79 obese (BMI 34) men
and women was carried out for 24 weeks (Maki et al 2002). Subjects incorporated DAG-
or TAG-containing foods into the diet with the goal of achieving 15% of the total dietary
energy from the oils (~ 20-40 g/day). Body weight decreased in both treatment groups,
with the DAG group showing significantly more weight loss and reduction in fat mass
than the TAG group. A recent meta-analysis of 6 studies found a modest effect of DAG
on weight loss (-0.75 kg) (Xu et al 2008).
17

The mechanism explaining the reduction in body fat may involve differences in how
DAG is metabolized compared to TAG. Studies in humans and animals have
demonstrated lower respiratory quotients (RQ) indicating increased fat oxidation. In one
report, 12 healthy women were given diets containing 40% energy as DAG or TAG oil
(Kamphuis et al 2003). After 36 hours in a respiratory chamber, fat oxidation (g/day)
was significantly higher in the DAG group along with reduced RQ. A postprandial study
of 13 healthy men used a breath analysis apparatus to demonstrate lower RQ when a
DAG-containing meal was eaten compared to a TAG-meal (Saito et al 2006). Higher
energy expenditure and fat oxidation was also seen in healthy rats after a DAG or TAG
emulsion was given (Kimura et al 2006). An example of an animal study is a 2-week
feeding study in healthy rats that showed lower RQ with DAG measured by indirect
calorimetry (Osaki et al 2008).
A recent study in overweight men and women using a respiratory chamber showed
increased fat oxidation and resting metabolic rate after a 14-day intake of 10 g/day of
DAG compared with TAG oil (Hibi et al 2008). However, no difference in RQ was seen
in a study of healthy men and women in which half of dietary fat intake (15% of daily
energy) was either DAG or TAG oil over a 4-day period in a respiratory chamber (Hibi et
al 2008).
18

3. Medical conditions
DAG oil has been suggested as part of the treatment for humans with various lipid-related
disorders. As noted above, a number of research studies of effects of DAG have been
performed in normal, healthy humans and animals. Other studies have used animal
models and humans with previously diagnosed diseases such as type 2 diabetes mellitus
and obesity.
In a study of 16 human patients seen in an outpatient clinic for type 2 diabetes and
hypertriglyceridemia, DAG or TAG oil was incorporated into the daily diet for 12 weeks
(Yamamoto et al 2001). Serum TAG and glycohemoglobin A1C levels were significantly
lower in the DAG group. The authors concluded that a DAG-enriched diet might be
useful as an adjunct treatment leading to reduced risk factors for arteriosclerosis and
better quality of life than simply a fat-restricted diet. A postprandial study of DAG oil in
six humans with type 2 diabetes showed a smaller increase in serum TAG compared with
TAG oil (Tada et al 2005). A 6-month trial in type 2 diabetic humans with nephropathy
(n=15) comparing DAG and TAG oil demonstrated reduced body weight, BMI, serum
TAG, and level of azotemia in the DAG group (Yamamoto et al 2006). In a study of type
2 diabetic humans (n=24), a 3-month trial of DAG vs. TAG oil showed reduced waist
circumference and serum TAG concentration along with increased HDL concentration
(Yamamoto et al 2006). In humans with type 2 diabetes (n=112), a 4-month trial
comparing DAG and TAG demonstrated reduced body weight, BMI, waist
circumference, insulin levels, and leptin levels with DAG (Li et al 2008).
19

A study carried out in overweight or obese men and women (n=131) demonstrated
increased loss of body weight and body fat when DAG oil was substituted for TAG oil
over a 24-week period (Maki et al 2002). The actual losses were modest but statistically
significant (3.6% vs. 2.5% weight loss, 8.3% vs. 5.6% fat mass reduction). In obese
children (7-17 years old, n=11), DAG oil was incorporated into the daily diet for 5
months which resulted in decreased fat mass and decreased serum leptin and HDL
concentrations (Matsuyama et al 2006). A one-year study compared DAG and TAG oil
in overweight humans (n=312), and the DAG group had a slightly reduced body weight (-
0.55 kg) while the TAG group had a slight increase (+ 0.31 kg) (Kawashima et al 2008).
Patients receiving hemodialysis are at high risk of lipid disorders including
hypertriglyceridemia and low HDL-cholesterol. In a study of ten uremic humans on
dialysis, DAG was incorporated into the daily diet for 5 months (Teramoto et al 2004).
Abdominal fat mass along with serum lipoprotein A and VLDL concentrations all
decreased while there was no change in serum TAG, cholesterol, LDL, HDL, or IDL
concentrations.
A single case report has been published reporting the use of DAG oil in a patient
diagnosed with hyperlipidemia resulting from lipoprotein lipase deficiency (Yamamoto et
al 2005). This 34-year old man had elevated serum TAG (1818 mg/dl) and undetectable
lipoprotein lipase (LPL) (< 20 ng/ml). An initial postprandial study was performed
comparing DAG, TAG and medium-chain triglyceride (MCT) oils (approximately 17 g in
an emulsion). The results indicated an increased serum TAG concentration after the
20

TAG oil and decreased TAG after DAG or MCT oil (Figure 5). Following this, a 3-
month study was performed in which DAG oil (20 g/day) was substituted for a portion of
TAG in the daily diet. DAG was introduced at month 3 and a reduction in serum TAG
was seen 1 and 2 months later. The overall intake of both TAG and DAG increased in
the final month of the study which apparently caused an increase in serum TAG (Table
4). The results suggest that DAG oil included as part of a fat-restricted diet is beneficial
in reducing the hyperlipidemia of LPL-deficiency.
Figure 5. Postprandial serum TAG responses
after ingestion of 3 different oils in an
LPL-deficient patient. Postprandial serum
TAG levels after ingestion of each emulsified
oil was expressed as Δpostprandial TAG (mg/dl),
minus the initial TAG value from each time point value.
Circles indicate DAG oil; triangles, TAG oil;
and squares, MCT oil. (Yamamoto et al 2005)
21

Table 4. Effect of long-term administration of DAG oil on serum lipid levels in an LPL-
deficient patient
Duration (mo) TAG (mg/dl) Total chol (mg/dl) HDL chol (mg/dl)
0 1939 205 21
1 2525 293 34
DAG oil 2 1926 234 27
3 1173 155 16
4 749 142 17
5 2195 269 29
DAG oil was used for the duration of 2 to 5 months. Chol indicates cholesterol; HDL,
high-density lipoprotein. (Yamamoto et al 2005)
In another case report, a 43-year old man with hypertriglyceridemia, chylomicronemia,
postprandial epigastric pain, and recurrent pancreatitis was diagnosed with apolipoprotein
C-II deficiency (Yanai et al 2007). He was placed on a diet restricted in fat (10 g/day)
and energy (900 kcal/day). After 3 weeks, serum TAG was reduced from 2252 mg/dl to
230 mg/dl. A postprandial study was then done comparing DAG and TAG oil (10 g
emulsion). The results indicated a lower serum TAG level at 4 and 6 hours (Figure 6).
The suppression of postprandial TAG increase by DAG oil in this individual may have a
benefit in preventing complications such as discomfort and pancreatitis in the future.
22

Figure 6. Serum lipid changes after ingestion of diacylglycerol (DAG) or triacylglycerol
oil (TAG). Black and white circles indicate values changed from baseline; black and
white boxes indicate the incremental area under the curve of each value for 8 h after
ingestion of TAG and DAG, respectively. (Yanai et al 2007)
Laboratory animal studies previously noted that used strains of mice or rats predisposed
to obesity, diabetes, or atherosclerosis have revealed both beneficial effects of DAG oil
and no evidence of effect compared with TAG oil. Animal models of human disease are
valuable for pilot studies and for investigations of mechanisms, safety, and other
observations not possible or practicable in human studies. Because DAG oil is intended
for dietary use in humans, emphasis should appropriately be placed on human clinical
trials.
23

CHAPTER 2. LIPOPROTEIN LIPASE DEFICIENCY AND RATIONALE FOR
STUDY
Lipoprotein lipase (LPL) is an enzyme involved in lipid metabolism and transport (Mead
et al 2002). Its main function is the hydrolysis of triacylglycerols (TAG) found in
circulating chylomicrons and very low-density lipoproteins (VLDL) (Preiss-Landl et al
2002). LPL is found primarily in adipose, myocardial, and skeletal muscle tissue. Other
tissues with LPL activity include the brain, placenta, lungs, spleen, and pancreas along
with macrophages and steroidgenic tissue (Preiss-Landl et al 2002). In addition to TAG
hydrolysis, LPL also has a bridging function between lipoproteins and capillary
endothelial walls and acts as a ligand for the LDL receptor to facilitate cellular uptake of
lipoproteins.
LPL deficiency is a rare familial autosomal recessive disorder, occurring at an estimated
rate of one per one million population (Brunzell and Deeb 2001). The disease is often
diagnosed in infancy or childhood by detecting “chylomicronemia”, or marked
hypertriglyceridemia. The most severe clinical manifestation is acute or recurrent
pancreatitis, which can lead to pancreatic necrosis and death. Episodic abdominal pain,
hepatomegaly, eruptive xanthomas (deposits of lipid in skin), lipemia retinalis, and
dyspnea are also common complications of hypertriglyceridemia. The condition can be
life-threatening during pregnancy (Ivan et al 2008). Typically the plasma fasting
triglyceride level is 2000 mg/dl or higher in clinically affected patients, but some
24

individuals have triglyceride levels up to 29,000 mg/dl with no symptoms. The main
treatment is dietary fat restriction, with the goal of achieving a plasma triglyceride level
consistently below 1000 to 2000 mg/dl. Medium-chain triglyceride oil (MCT) can be
used for cooking because it is absorbed directly into the portal circulation instead of
being incorporated into chylomicrons. Avoidance of alcohol and certain medications
may help, and one individual responded to omega-3 fatty acid supplementation from fish
oil (Brunzell and Deeb 2001).
To further study the function of LPL and LPL deficiency, homozygous knockout mice
(LPL-/-) were developed (Weinstock et al 1995). Neonatal pups had marked
hypertriglyceridemia (15,000 mg/dl) and died at 16-24 hours of age. Heterozygous mice
(LPL+/-) had mild elevations in triglycerides (up to twofold) and survived to adulthood.
The LPL deficiency was later shown to be corrected by gene transfer of a naturally-
occurring beneficial mutation, LPLS447X (Ross et al 2004). Rescued mice had near-
normal plasma lipoprotein profiles and were clinically healthy.
A naturally-occurring feline model of LPL deficiency has been developed and maintained
in a breeding colony of domestic cats (Jones et al 1983, Ginzinger et al 1996). A
mutation leads to a substitution of arginine for glycine at residue 412 in the LPL gene
(Gly412Arg mutation) (Ginzinger et al 1996). The phenotype is similar to familial LPL
deficiency in humans, as homozygous cats have marked hypertriglyceridemia (200-
12,000 mg/dl), xanthomas, and lipemia retinalis (Jones et al 1986, Bauer et al 1984,
Ginzinger et al 1999). However, unlike in humans, abdominal pain and pancreatitis have
25

not been reported in cats. In one study, LPL-/- kittens had reduced body mass and growth
rates along with an increased rate of stillbirths in homozygous queens compared with
heterozygous (LPL+/-) or normal (LPL+/+) queens (Ginzinger et al 1996). A later study
found improved growth of kittens when fed a low-fat (10% as fed) purified or
commercial diet (Reginato et al 2002). In another study, a commercial diet with 12.5%
crude fat as fed was used in adult LPL-deficient cats with no reported adverse effects
(Kanchuk et al 2003). This feline model has the potential to be useful in comparative
studies of LPL physiology, function, and regulation in addition to dietary or medical
treatments of hypertriglyceridemia in both humans and cats. In one recent example, gene
therapy was successfully used to correct feline LPL deficiency (Ross et al 2006). The
effects were transient due to an immune response by the cats to the human LPL variant,
but immunosuppressive therapy helped increase the duration of the beneficial effect.
Human LPL gene therapy may be feasible as a treatment for familial
hypertriglyceridemia.
One approach to the treatment of hypertriglyceridemia in humans is varying the types of
dietary fat instead of or in addition to restricting the total intake. MCT oil has been used
in patients with primary hypertriglyceridemia (Rouis et al 1997, Asakura et al 2000).
Omega-3 fatty acid supplementation was shown to lower triglyceride levels in 12
individuals with familial LPL deficiency (Richter et al 1992). Fish oil and omega-3 fatty
acids have been successfully incorporated into feline diets and used to treat several
disorders, but have not been investigated in LPL-deficient cats. MCT oil has been shown
to be unpalatable in normal cats, leading to decreased feed intake and weight loss
26

(MacDonald et al 1985). However, a recent report suggested that MCT palatability in
cats may depend on the type, amount, and diet composition (Trevizan et al 2008).
Based on these and other reports concerning dietary DAG and hypertriglyceridemia, a
study was conducted to evaluate the effects of DAG oil in LPL-deficient cats. The
research hypothesis was that a short-term feeding trial with DAG oil as the fat source in a
semipurified diet would result in lower serum triglyceride concentrations compared with
TAG oil. Serum cholesterol and non-esterified fatty acids were also measured, and feed
intakes, body weights, and overall health were monitored. A pilot study in healthy
colony cats was performed first to determine acceptance of DAG oil when added to a
commercial dry-type diet.
This research project was designed to yield useful information in the management of both
cats and humans with similar lipid disorders, and help establish homozygous LPL-/- cats
as a valid research model in future studies of familial hypertriglyceridemia syndromes.
In addition, the palatability and safety of DAG oil in cats would be evaluated for potential
usefulness in home-prepared and commercial feline diets.
27

CHAPTER 3. PALATABILITY OF DIETARY DAG OIL IN HEALTHY CATS
1. Experimental Methods
Animals
Eight specific pathogen-free domestic shorthair cats aged 39 ± 5.0* months, body weight
3.73 ± 0.322 kg were obtained from the Feline Nutrition and Pet Care Center, University
of California, Davis, and individually housed. Daily exercise and socialization were
provided in a group setting. Cats were given fresh food and water each morning for ad
libitum consumption. General health observations by trained personnel were recorded
daily, and cages and litter boxes were carefully examined for evidence of vomiting or
diarrhea. Fecal quality was assessed daily on a 7-point scoring system (1 = hard and dry,
2 = firm, 3 = formed, 4 = formed and moist, 5 = very moist, 6 = unformed, 7 = watery;
Nestlé Purina Fecal Scoring System). The protocol allowed for removal from the study if
any cat consumed 50% or less of daily energy requirements on 3 consecutive days or if
any medical problems occurred that needed veterinary treatment.
* All statistical results are reported as mean ± the standard error of the mean (SEM)
28

Test oils
The DAG-rich oil was a commercially available product (Enova® oil, ADM-Kao LLC).
The TAG-rich oil was also a commercially available product (Crisco® Pure Vegetable oil
(100% soybean), J. M. Smucker Company). Both oils were purchased locally at a
grocery store.
Diets
A commercially available dry kibbled feline diet was used in this study (Royal Canin
Veterinary Diet™ feline Diabetic DS 44™). This diet was formulated to meet the
nutritional levels established by the Association of American Feed Control Officials
(AAFCO) cat food nutrient profiles for adult maintenance (Appendix 1). The test diet
was formulated by adding 15 grams of DAG oil per 100 grams of dry diet. The control
diet was formulated by adding 15 grams of TAG oil per 100 grams of dry diet (Appendix
1). The amount of oil to add was limited by both the ability of the dry diet to absorb the
liquid and the desire to limit dietary fat to less than 50% of total energy. Each diet was
prepared with a stand-type mixer (Hobart, Troy, OH) and stored at 2º C until use.
Design
Each cat was offered two food bowls (marked “A” and “B”) and one bowl for water.
Fresh food was added to the bowls each morning and the weight of the bowl and diet was
29

recorded. After each 24-hour period, the bowls were removed, weighed, emptied,
cleaned, and refilled with fresh food. The differences in bowl weights were recorded as
the daily food intake.
A five-day acclimation period was performed by mixing the two diets together in equal
amounts by weight. Each cat was offered approximately one-half cup (~ 37 grams) of the
diet mixture in each of two separate bowls from Day -5 to Day -1. The experimental trial
started on Day 0 and continued through Day 13 (total of 14 days). Each cat was offered
approximately one cup (~ 75 grams) of each diet (DAG and TAG) in separate bowls.
The placement of the bowls was randomized by assigning the left-right order based on a
chart generated by coin flips.
Observations and measurements were recorded on datasheets (Appendix 2). The amount
of food intake of each diet, fecal quality, and general health notes were recorded daily.
Cats were weighed weekly starting on Day 0 (0, 7, and 14 days of trial).
Statistical Analysis
The data on food intake passed normality and equal variance tests. Body weights were
normalized to metabolic body weights using the formula (BWkg0.75). The effect of diet on
food intake was analyzed with paired t-tests. Changes in body weight over time was
evaluated by one way analysis of variance. Differences were considered significant at P
30

< 0.05. Statistical analysis was performed using SigmaStat version 3.5 (Systat, Chicago,
IL), and Microsoft Excel 2003 (Microsoft, Redmond, WA).
31

2. Results
General health observations
All cats completed the trial with no clinical signs of illness, and the diets were accepted.
All fecal scores were recorded as “1” (hard and dry) or “2” (firm) with two exceptions.
One cat had a score of “3” (formed) on Day 5 and a different cat had a score of “4”
(formed and moist) on Day 0.
Body weights
Body weights of cats did not significantly change at Days 7 and 14 compared with
baseline (Table 5, Figure 7). Cat # 01-307 lost approximately 5% BW from day 7 to day
14, but general health and fecal scores remained normal during this time.
Table 5. Changes in body weights (BW), mean ± SEM
Day 0 Day 7 Day 14 P value
BW (kg) 3.73 ± 0.32 3.75 ± 0.33 3.74 ± 0.30 0.98
32

Body Weights
0
1
2
3
4
5
6
CAT ID #
Wei
ght (
kg)
DAY 0DAY 7DAY 14
DAY 0 4.94 5.38 3 3.53 3.48 3.16 3.07 3.31
DAY 7 4.96 5.44 3.01 3.67 3.48 3.1 3.04 3.3
DAY 14 4.95 5.16 3.11 3.69 3.57 3.17 2.99 3.26
01-306 01-307 02-103 02-254 04-037 04-160 04-227 04-331
Figure 7. Weekly body weights (kg) by cat ID #.
Food intake
The daily intake was measured by subtracting the bowl plus food weight from the
previous day’s bowl plus food weight. The DAG and TAG diet weights were recorded
separately. The total diet intake over the 14-day trial is shown in Figure 8.
33
Total Intake by Diet
0
100
200
300
400
500
600
700
800
900
1000
01-306 01-307 02-103 02-254 04-037 04-160 04-227 04-331
Cat ID #
Food
inta
ke (g
)
DAG dietTAG diet
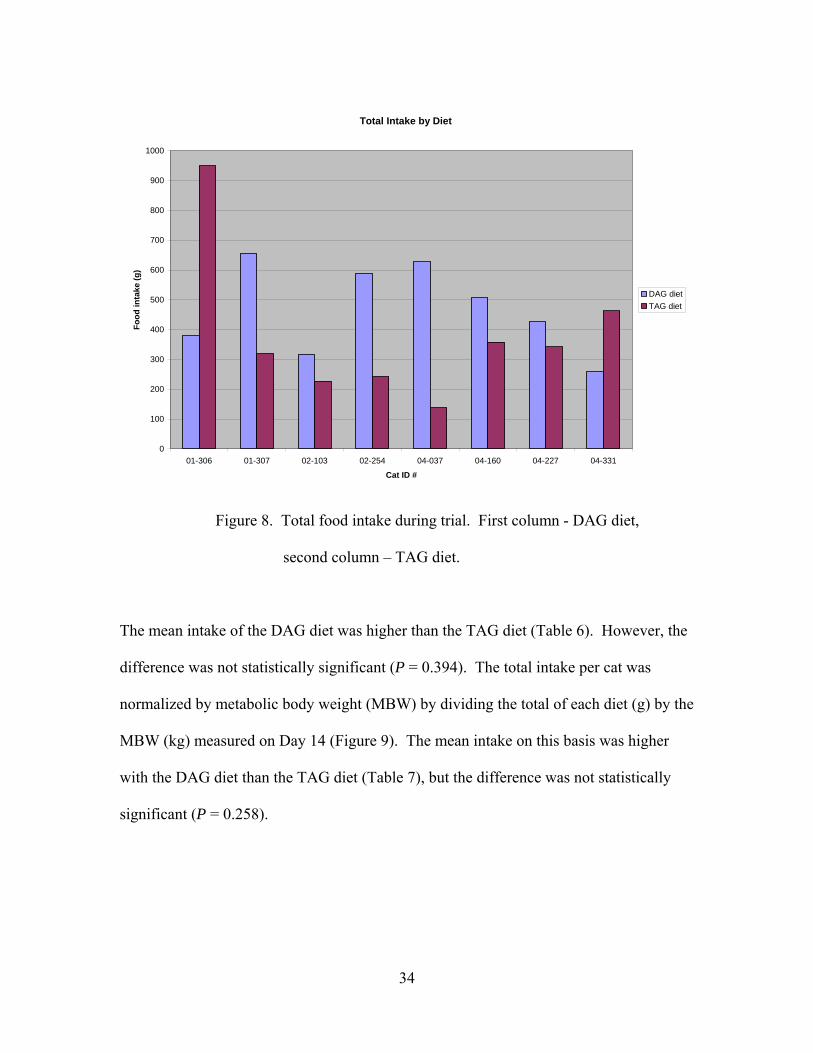
Figure 8. Total food intake during trial. First column - DAG diet,
second column – TAG diet.
The mean intake of the DAG diet was higher than the TAG diet (Table 6). However, the
difference was not statistically significant (P = 0.394). The total intake per cat was
normalized by metabolic body weight (MBW) by dividing the total of each diet (g) by the
MBW (kg) measured on Day 14 (Figure 9). The mean intake on this basis was higher
with the DAG diet than the TAG diet (Table 7), but the difference was not statistically
significant (P = 0.258).
34

Table 6. Statistical analysis of total food intake by type of diet.
Normality Test: Passed (P = 0.257)
Equal Variance Test: Passed (P = 0.757)
Group Name N Missing Mean Std Dev SEMDAG 8 0 470.375 147.633 52.196TAG 8 0 380.125 250.160 88.445
Difference 90.250
t = 0.879 with 14 degrees of freedom. (P = 0.394)
t-test raw data (total intake per cat)
Total Intake by Diet Normalized to Metabolic Body Weight
0
50
100
150
200
250
300
350
01-306 01-307 02-103 02-254 04-037 04-160 04-227 04-331
Cat ID #
Food
inta
ke (g
/BW
kg^
0.75
)
DAG dietTAG diet
Figure 9. Total food intake during trial divided by ending metabolic BW (kg0.75).
First column - DAG diet, second column – TAG diet.
35

Table 7. Statistical analysis of total food intake normalized to MBW by type of diet.
t-test raw data (total intake per cat normalized to MBW) Normality Test: Passed (P = 0.191) Equal Variance Test: Passed (P = 0.465) Group Name N Missing Mean Std Dev SEM DAG 8 0 176.737 51.232 18.113 TAG 8 0 139.233 73.839 26.106 Difference 37.504 t = 1.180 with 14 degrees of freedom. (P = 0.258)
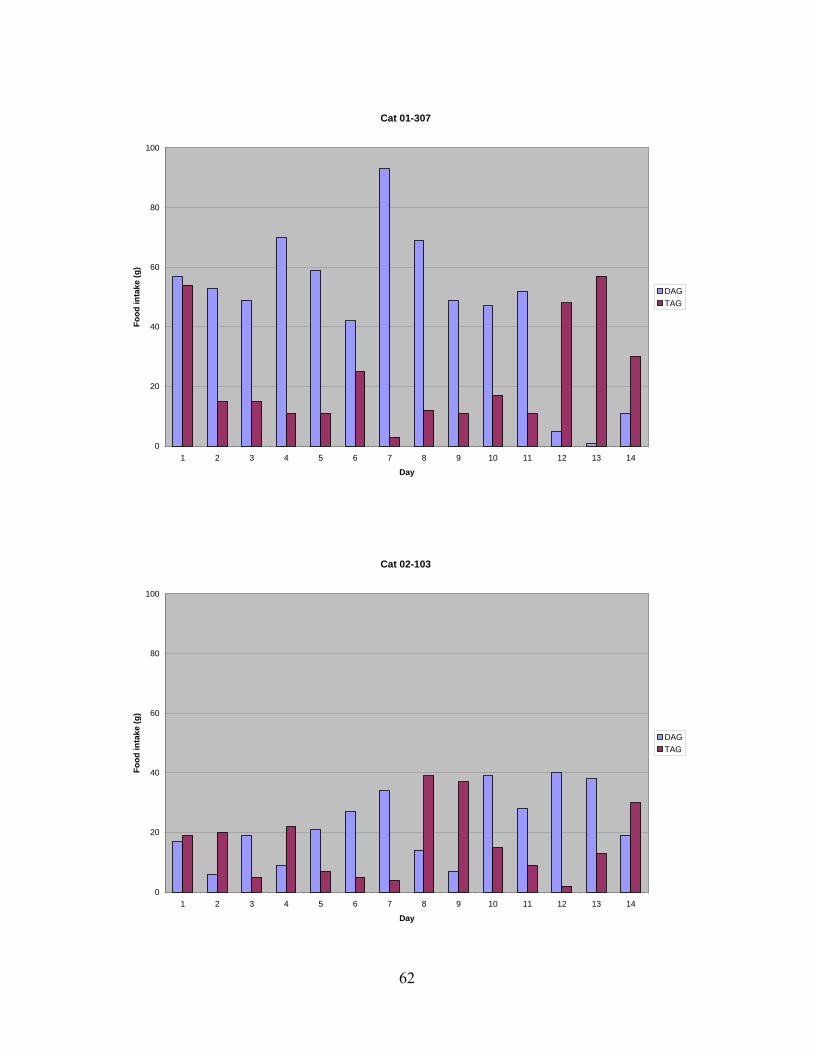
Individual daily food intakes ranged from 21 g to 116 g, and all cats ate from one or both
bowls every day. One cat (ID # 04-037) consumed the highest amount of the DAG diet
(MBW basis) and the least amount of TAG diet compared to the other cats, most likely
indicating a palatability preference (Figure 9). Individual data also showed that there
were four occasions in which zero food intake was recorded (ID # 04-037, TAG diet, 2
days; ID # 04-331, DAG diet, 2 days). Individual cat data also revealed that in some
cases the amount of intake of each diet changed over time (Appendix 3). This may
indicate that some cats developed a preference for one of the other diets during the study.
36

3. Discussion
The main purpose of this pilot study was to determine if DAG oil would be palatable to
cats when added to a commercial diet. Studies have shown that cats do not accept fats
and oils equally (Kane et al 1981, MacDonald et al 1985), so it was important to establish
that DAG oil would not negatively influence palatability before performing further
research.
The DAG and TAG vegetable oils were added to a dry-type commercial diet that was
formulated to be a high-protein, low-carbohydrate diet mildly restricted in fat and
appropriate for the management of diabetes mellitus in cats. The diet met the nutritional
requirements for maintenance of adult cats. After the addition of the oils, the diet was
approximately twice as high in fat, and moderately lower in protein and carbohydrate
(Appendix 1). The energy density increased 18% from 372 to 439 kcal/100g. On a dry
matter basis (DMB), the fat content of the diets after oil addition was 25%. This level
has been reported in a study using purified diets, and was found to be more palatable than
diets containing either 10% or 50% fat (Kane et al 1981). The safe upper limit of total
dietary fat for adult cats is 33% DMB (NRC 2006).
In the study, cats were offered a choice of DAG- and TAG-containing diets in equal
quantities with the position of the bowls changed randomly to minimize any effects of
placement in determining food intake. Domestic lean adult cats at maintenance have a
37

metabolizable energy requirement of 100 kcal X kg BW0.67 (NRC 2006). The cats were
offered a sufficient quantity of each diet so that they could meet energy needs with either
diet alone. Cat #01-307 had the highest body weight (5.44 kg) and the highest
requirement (311 kcal/day). The diets were supplied at a minimum of 75 g each, so with
an energy density of 4.39 kcal/g, the total for each diet was 329 kcal which exceeded the
requirements of each cat. Cats that ate most or all of the diet were given additional
amounts on subsequent days to minimize the confounding effect of food disappearance
forcing consumption of the alternate diet.
The results indicated that there was no significant difference in total food intake when the
two diets were compared The data showed that 6/8 cats ate more DAG diet while 2/8
cats ate more TAG diet (Figures 8 and 9). However, the difference was not statistically
significant.
Another purpose of this study was to determine if the addition of either oil had any
clinically apparent negative effects. The general health of the cats was observed and
recorded daily by an experienced caretaker, and no problems were noted. Body weights
did not significantly change during the trial except for a 5% weight loss in one cat (ID #
01-307). Examination of total daily food intakes in this cat showed a decrease in the
second week of the study compared with the first week (234 g vs 423 g). There was no
obvious reason for this reduction in intake. Fecal quality was also observed as an
indicator of problems with digestibility or gastrointestinal tract function. On two
occasions, the feces were scored as “3” or “4” in two cats, but subsequent scores were
38

“1” or “2”, which are considered normal. Based on these observations, DAG oil was
considered to be safe when fed to cats for a short time period.
39

4. Conclusions
A pilot study was performed with eight healthy cats to determine acceptance and
tolerance of dietary DAG oil as measured by food intake and general health monitoring
prior to undertaking further research. A commercial diet was mixed with either DAG or
TAG oil and both diets were offered to cats during a two-week feeding trial. The
majority of cats preferred the DAG diet as measured by higher food intake compared
with the TAG diet, but the difference was not statistically significant. All cats accepted
both diets with no adverse effects noted on general health and fecal quality. One cat had
an unexplained reduction in food intake and body weight in the second week of the study,
but all other cats maintained healthy weights and normal diet consumption. Therefore,
DAG oil was shown to be palatable and safe for use in other dietary trials.
40

CHAPTER 4. EFFECT OF DIETARY DIACYLGLYCEROL OIL ON
HYPERTRIGLYCERIDEMIA IN LIPOPROTEIN LIPASE-DEFICIENT CATS
1. Experimental Methods
Animals
Twelve specific pathogen-free domestic shorthair male cats aged 1.5 ± 0.1* years, body
weight (BW) 4.6 ± 0.2 kg were obtained from and individually housed at the Feline
Nutrition and Pet Care Center, University of California, Davis. Daily exercise and
socialization were provided in a group setting. Each cat was determined to be
homozygous for the Gly412Arg LPL mutation by polymerase chain reaction-based
mismatch analysis (Ginzinger et al 1996). Cats were given fresh food and water each
morning, and remaining food from the previous day was collected and frozen for later dry
matter determination. Diets and water were offered for ad libitum consumption. Food
intakes, BW, fecal quality, and general health observations were recorded daily. Body
condition scores were assigned weekly according to a 9-point integer system in which 5
is ideal and 1 is leanest and 9 is the heaviest possible body condition (Laflamme 1997).
The care and housing of the cats and the experimental protocol were approved by the
Institutional Animal Care and Use Committee of the University of California, Davis.
* All statistical results are reported as mean ± the standard error of the mean (SEM)
41

Test oils
The evaluated DAG-rich oil was a commercially available product (Enova® oil, ADM-
Kao LLC). A TAG oil was prepared by mixing canola, soybean, and safflower oils
(Crisco® Pure Rapeseed and Crisco® Pure Vegetable Oil, J. M. Smucker Company,
LouAna Pure Safflower Oil, Ventura Foods) so that the fatty acid profile was similar to
that of the DAG oil (Table 8). The fatty acid compositions of the TAG and DAG oils
were analyzed by extraction-methylation and gas chromatography (Sukhija, Palmquist
1988).
Diets
Two semipurified diets were formulated to meet or exceed the recommended nutrient
allowances for maintenance of adult cats (NRC 2006). The diets differed only in oil
source (Table 9). Diets were mixed and extruded through a meat grinder die (Hobart M-
802, Hobart 4812, 1-cm die, Troy, OH, USA) to form pellets. The diets were stored
frozen and thawed immediately before use.
42

Table 8. Acylglycerol and fatty acid compositions of the test oils.
DAG oil TAG oil
Acylglycerol species1 g/100 g
Monoacylglycerol 0.6 0
Diacylglycerol 87.4 0.1
Triacylglycerol 11.0 >98.5
Fatty acid composition2
16:0 3.3 6.6
18:0 0.5 1.5
18:1 40.4 40.5
18:2 47.1 43.5
18:3 7.9 6.5
1 Analyzed at Agricultural Experiment Station Chemical Laboratories, University of
Missouri
2 As measured from lipid extracts followed by methylation and gas chromatographic
analyses as described in Experimental Methods (n = 3)
43

Table 9. Ingredient composition and macronutrient contribution to ME of treatment
diets1
Treatment diet
DAG TAG
Ingredients, g/kg (as-fed basis)
Casein, High Nitrogen2 300 300
Soy Protein Isolate3 250 250
Corn Starch2 200 200
Sucrose2 91 91
DAG oil4 100 0
TAG oil5 0 100
Mineral mix6 40 40
Vitamin mix7 10 10
Choline8 4 4
Arachidonic acid9 3 3
Taurine10 2 2
Water added, g/kg diet 400 400
Protein, % of ME 47 47
Fat, % of ME 25 25
Carbohydrate, % of ME 28 28
ME, MJ·kg DM–1 17.1 17.1
1 Calculated assuming protein, carbohydrate, and fat contain 16.7, 16.7, and 37.7 MJ/kg,
respectively.
2 Dyets, Inc. (Bethlehem, PA)
3 Supro 661, Dyets, Inc. (Bethlehem, PA)
44

4 Enova® oil, ADM-Kao LLC (Decatur, IL, USA)
5 Crisco® Pure Canola and Crisco® Pure Vegetable Oil, J. M. Smucker Co. (Orrville, OH,
USA), LouAna Pure Safflower Oil, Ventura Foods LLC (Brea, CA, USA)
6 NRC Cat Salt Mix, Dyets, Inc. (Bethlehem, PA, USA) Provided (g/kg diet): calcium
phosphate tribasic 570, potassium phosphate 250, sodium chloride 35, potassium chloride
80, magnesium oxide 19, manganous carbonate 0.35, ferric citrate 13, zinc carbonate 2.8,
cupric carbonate 0.35, potassium iodate 0.02, sodium selenite 0.01, chromium potassium
sulfate 0.55, sucrose 28.92
7 NRC Cat Vitamin Mixture, Dyets, Inc. (Bethlehem, PA, USA) Provided (g/kg diet):
thiamin HCl 0.7, riboflavin 0.5, pyridoxine HCl 0.6, niacin 4.5, calcium pantothenate 0.7,
folic acid 0.09, biotin 0.01, vitamin B12 (0.1%) 2.2, vitamin A palmitate (500,000 U/g)
1.3, vitamin D3 (400,000 U/g) 0.15, vitamin E acetate (500 U/g) 10.0, menadione sodium
bisulfite 0.02, myo-inositol 20, sucrose 959.23
8 Choline chloride, Dyets, Inc. (Bethlehem, PA, USA)
9 VEVODAR Crude Arachidonic Oil, DSM Food Specialties (Delft, the Netherlands)
10 Sigma Chemical Co. (St. Louis, MO, USA)
Design
Two identical dietary crossover studies were conducted approximately 6 months apart.
For each study, 6 cats were adapted to the TAG diet from a commercial dry-type
45

extruded diet (34% metabolizable energy [ME] fat, Whiskas® for kittens, Mars, McLean,
VA, USA) for 21 d. Two days before the start of the study, a nonfasting 1-ml blood
sample was collected from each cat by jugular venipuncture and submitted to a
commercial laboratory (IDEXX, West Sacramento, CA, USA) for determination of
serum TAG concentration. Cats were pair-matched based on serum TAG concentrations
(range, 540 - 2796 mg/dl) and assigned to 2 groups of 3 cats each so that the range in
serum TAG concentrations was similar between the groups. One group continued to
receive the TAG diet after the adaptation period while the other group was switched to
the DAG diet. After 8 days, the diets were crossed-over and presented for 8 more days
with no washout period.
Samples and analyses
Nonfasting blood samples were collected by jugular venipuncture from each cat on days
6, 7, and 8 and again on days 14, 15, and 16. The samples were allowed to clot,
centrifuged at ~ 1200 x g for 10 minutes, and serum separated and frozen at -20 °C for
later analysis.
Serum TAG. A commercial enzymatic-colorimetric kit (Infinity™, Thermo Electron,
Pittsburgh, PA, USA) that measures glycerol after hydrolysis of acylglycerol was used to
determine serum TAG concentrations. Due to the unusually high triglyceridemia, serum
was diluted from 1:5 to 1:15 with normal saline (0.9% NaCl) so that assayed TAG
concentrations were in the linear range of the test kit.
46

Serum cholesterol. Serum turbidity even after serial dilutions precluded use of
colorimetric kits for cholesterol determinations. Cholesterol was determined in organic
phase extract of serum by HPLC (Webb et al 1982) with minor modifications. For each
assay, 50 μl of serum was mixed with 2 mL of alcoholic potassium hydroxide solution
(56.1 g potassium hydroxide in 1 L ethanol) in a loosely-capped glass tube and incubated
in a 75°C water bath for 30 min. After cooling, 2 mL of deionized water was added and
mixed. The tube was agitated with 5 mL of hexanes for 15 min in a horizontal position
then centrifuged at 200 x g for 5 minutes. A 3 mL aliquot of hexanes (upper layer) was
dried under nitrogen gas at 40°C. The residue was dissolved in 0.85 mL isopropanol and
50 μl of reconstitute was injected onto an HPLC column (Microsorb 100-5 C18, 250 x
4.6 mm, Varian, Lake Forest, CA, USA). Cholesterol was eluted with an isocratic mobile
phase (1:1 acetonitrile:isopropanol, 1.0 mL/min) in a peak monitored at 205 nm
approximately 8.5 min after injection.
Serum NEFA. A commercial enzymatic-colorimetric kit (Wako Diagnostics, Richmond,
VA, USA) was used to determine serum NEFA concentration. Prior to analysis, samples
were centrifuged at 13,000 x g for 10 minutes at 4 °C. The infranatant (serum separated
from the lipid layer) was used in the assay to avoid interference from sample turbidity.
Diet samples. Food intake of each cat was determined from the daily difference in dry
matter mass of food offered and food remaining. For this, frozen (-15°C) samples of
presented diet and uneaten diet samples were collected each day. Samples were dried in
a convection oven at 110°C for 48 hours and weighed to determine the dry matter. Each
47

batch of diet was assayed for fatty acid composition by extraction-methylation and gas
chromatography (Sukhija, Palmquist 1988).
Statistical analysis
Results are expressed as means and their standard errors. Paired t-tests and one-way
repeated-measures ANOVA with Bonferroni adjustment for multiple comparisons were
used to evaluate the effect of diet type and diet presentation sequence on mean serum
concentrations of TAG, cholesterol, and NEFA. The relationship between food intake
and serum biochemical variables was evaluated by calculating Pearson correlation
coefficients. Differences were considered significant at P < 0.05. Statistical analysis was
performed with SPSS version 16.0 (SPSS Inc., Chicago, IL, USA) and SigmaStat version
3.5 (Systat Inc., San Jose, CA, USA).
48

2. Results
One cat was found to have normal serum TAG concentrations (pooled mean, 186 ± 15
mg/dl). Repeat analysis for occurrence of the Gly412Arg mutation in this cat revealed
normal LPL alleles. Therefore, all observations from this cat were excluded from further
analysis.
Body weights and general health
All cats accepted the semipurified diet during the acclimation period and the study
periods. Body weights and body condition scores were maintained throughout the trial.
Soft stool but not diarrhea was noted in 3 cats on 9 occasions; 6 while eating the DAG
diet and 3 while eating the TAG diet.
Serum TAG, Cholesterol, and NEFA
Serum TAG concentrations varied by more than 400% among the cats (Figure 10). In
contrast, within each cat, serum TAG concentrations were substantially less variable.
The mean coefficient of variation (standard deviation/mean X 100) of TAG
concentrations within cats during the TAG diet periods was only 23 ± 20% and during
the DAG diet periods was only 19 ± 13%.
49

0
20
40
60
80
100
6 7 8 6 7 8Sample Day Sample Day
TAG Diet DAG Diet
Figure 10. Serum TAG concentration in LPL-deficient cats given diet with DAG and
TAG vegetable oils as fat sources. Marker and connecting lines indicate observations
common to each cat.
There was no significant effect of sampling day on serum TAG, cholesterol, and NEFA
concentrations. Therefore, mean concentrations were determined for each dietary period
for each cat and these means were used for evaluation of the effect of diet.
Serum TAG concentrations were reduced when cats received the TAG diet compared
with the DAG diet but the difference was not significant (P = 0.47) (Table 10). The diets
had no significant effect on serum cholesterol and NEFA concentrations (P = 0.81, 0.62).
The order of diet presentation had no significant effect on serum TAG, cholesterol, and
NEFA concentrations (Table 11).
50

Table 10. Serum TAG, cholesterol, and NEFA concentrations in LPL-deficient cats
when given diets with TAG or DAG vegetable oils as fat sources (eleven cats)
(Mean values with their standard errors)
DAG TAG P-VALUE
TAG (mg/dl) 3282 ± 400 3001 ± 302 0.47
Cholesterol (mg/dl) 186 ± 11.2 184 ± 9.3 0.81
NEFA (mmol/L) 1.36 ± 0.18 1.39 ± 0.18 0.62
Table 11. Serum concentrations of TAG, cholesterol, and NEFA by diet sequence (six
cats for DAG/TAG column, five cats for TAG/DAG column)
(Mean values with their standard errors)
DAG/TAG TAG/DAG P-VALUE
TAG (mmol/L) 3165 ± 291 3121 ± 391 0.53
Cholesterol (mmol/L) 186 ± 8.9 184 ± 10.8 0.16
NEFA (mmol/L) 1.42 ± 0.18 1.33 ± 0.17 0.67
51

To evaluate the effect of amount of food intake on the serum measurements, the
significance of correlations between food intake and serum concentrations of TAG,
cholesterol, and NEFA were determined. For this analysis, food intake was calculated as
the mean daily DM intake over the 8-day period of diet presentation and corresponding
serum concentrations were calculated as the means of TAG, cholesterol, and NEFA from
the 3 sampling days of each diet period. No significant correlations were found between
food intake and serum concentrations of TAG, cholesterol, and NEFA when either diet
was fed (P > 0.33).
52

3. Discussion
The semipurified diets presently used contained either TAG or DAG oil as the sole fat
source. The diets were well-accepted by all cats as indicated by food intake observations.
Intake of the diets on an ME basis (Table 12) was higher than the reported requirement
for lean cats at maintenance, 100 kcal x kg BW0.67 (NRC 2006). The DAG oil appeared
well tolerated because BW, fecal quality, and overall health when the DAG oil diet was
presented were not different from observations when the TAG oil diet was presented.
Based on these findings, we conclude that DAG oil is palatable for cats and is suitable for
inclusion in a complete and balanced feline diet. Long-term feeding studies of DAG-
enriched diets are needed to verify nutritional adequacy.
Table 12. Daily food intakes by diet and intakes normalized to metabolic BW (eleven
cats)
(Mean values with their standard errors)
DAG TAG P-VALUE
Food intake (g)1 79.8 ± 2.5 78.5 ± 2.4 0.71
Food intake (kcal/kg BW0.67)2 117 ± 3.8
116 ± 3.4
0.82
1 Dry matter basis, per day
2 ME, metabolic body weight basis, per day
53

There is normally a wide variation in circulating TAG concentrations among
homozygous LPL-deficient cats (Ginzinger et al 1999, Kanchuk et al 2003, Veltri et al
2006). This was confirmed by a more than 400% range in serum TAG concentrations
observed in the present study (Figure 10). Because of the great between-individual
variance, we elected to evaluate dietary treatment effects with a crossover design and
balance grouping for order of diet presentation by preliminary serum TAG
concentrations. We observed that TAG concentrations were relatively stable within
individuals even with sampling during ad libitum food intake. The stability in serum
TAG concentrations probably reflects inconsequential impact of meals. Serum TAG is
very slowly cleared in LPL-deficient cats (Ginzinger et al 1999), and TAG formed from
the 11-20 meals/d typically consumed by cats (Kane et al 1987) probably contributes
only a small fraction to the large pool of circulating TAG in LPL-deficient cats.
The cause for the large and consistent between individual differences in serum TAG
concentrations was not apparent. Serum TAG concentrations did not appear to reflect the
amount of dietary fat consumed because the TAG concentrations were not significantly
correlated with food intake. Activity of secondary mechanisms of TAG removal, perhaps
involving hepatic lipase (Demacker et al 1988), endothelial lipase (Jaye, Krawiec 2004),
or receptor-mediated transport (Goudriaan et al 2004) might underlie individual
differences in serum TAG concentrations. These secondary mechanisms would appear
especially effective in cats. Normalization of triglyceridemia in LPL deficiency after an
oral fat challenge occurs more rapidly in cats (~24 h) (Ginzinger et al 1999) than in
humans (> 40 h) (Sprecher et al 1991).
54

We did not observe lower mean serum TAG concentrations in cats receiving the DAG
diet compared with the TAG diet (Table 3). Therefore, our observations do not support
the hypothesis that substitution of DAG oil as the sole source of dietary fat reduces serum
TAG concentrations in this animal model. Although dietary DAG oil did not appear to
be harmful in LPL-deficient cats, we did not find evidence of a benefit. It is noteworthy
that our findings may not reflect responses of humans with LPL deficiency. Metabolism
of DAG oil in cats may importantly deviate from that in humans.
A simple explanation for a lack of effect of DAG oil is that the ability of the oil to lower
triglycerides may depend on the presence of functional LPL. Chylomicrons generated by
the metabolism and absorption of DAG are reported to be more efficiently hydrolyzed
compared with those generated by dietary TAG oil (Yasunaga et al 2007, Reyes et al
2008). The LPL-deficient cats studied are devoid of LPL catalytic activity and do not
produce an immunoreactive mutant protein (Ginzinger et al 1996). Other enzymes such
as hepatic lipase and endothelial lipase may be principally responsible for chylomicron
hydrolysis in LPL-deficient cats (Veltri et al 2006). Activities of these enzymes in
removal of chylomicrons may be little affected by dietary fat source. A non-catalytic
function of LPL may mediate the beneficial effect of dietary DAG oil. Dietary fat
substitution with DAG oil was recently reported to reduce triglyceridemia in a human
patient with apolipoprotein C-II deficiency (Yanai et al 2007a). Though not catalytically
active, LPL was present in the patient.
55
Cats have many similarities to humans with respect to lipid metabolism including
abundant and separable HDL2 and HDL3 subfractions (Chapman 1980, Demacker et al
1987). Serum cholesterol was presently measured as indicator of potential effects of
DAG oil on cholesterol-rich lipoproteins. Serum cholesterol concentrations were not
significantly affected by the dietary fat source (Table 3). This observation is consistent
with other human and animal studies in that total cholesterol concentrations remain
unchanged by dietary DAG oil, with few exceptions in which serum cholesterol was
lowered (Taguchi et al 2000, Murase et al 2001, Umeda et al 2006, Fujii et al 2007).
Although DAG oil fatty acids are reputedly absorbed principally as NEFA (Rudkowska
et al 2005), the jugular venous serum NEFA concentrations presently observed were
unaffected by dietary DAG (Table 3). This observation is also consistent with previous
reports (Taguchi et al 2000, Yasunaga et al 2004, Tada et al 2005). However, in some
studies serum NEFA concentrations were higher with DAG oil compared with TAG oil
(Kamphuis et al 2003, Sugimoto et al 2003). LPL-deficient compared to normal cats tend
to have higher NEFA concentrations when food is continuously present, while in normal
cats NEFA levels are higher when food is withheld (Veltri et al 2006). In the present
study, diets were not withheld at any time and NEFA fluctuated within a narrow range of
concentrations.
The study was designed to evaluate short-term effects of DAG oil on serum TAG
concentrations. Food was continuously presented, and there was no attempt to collect
fasting or postprandial blood samples. In a previous report of LPL-deficient cats, plasma
56
TAG concentrations after an oral fat load increased 10-fold (from 86 mg/dl to 828 mg/dl)
and peaked at 7 hours compared with a 2-fold increase and 3-hour peak in normal cats
(Ginzinger et al 1999). Further studies are needed to determine if DAG oil has the
potential to reduce postprandial TAG concentrations or increase the rate of clearance in
LPL-deficient cats.
57

4. Conclusions
In summary, our results show that cats voluntarily consume and tolerate diets prepared
with DAG oil at 10% dry matter weight and 25% metabolizable energy for short time
periods. Our results also show that the marked hypertriglyceridemia seen with LPL
deficiency is unchanged by substitution of TAG with DAG oil. Our finding of a lack of
effect of DAG oil on triglyceridemia is not without precedent. Lowering of
triglyceridemia in normal animals is not consistently reported. Nevertheless, the lack of
effect on triglyceridemia that we observed may be unique to the LPL deficiency model
studied, or it may be a consequence of a unique attribute of the fatty acid metabolism of
cats. Future studies of dietary applications of DAG oil in LPL-deficient and normal cats
are warranted. These should include evaluation of postprandial effects on lipid profiles
and long-term studies on DAG effects on energy metabolism, obesity prevention and
treatment, and disorders such as insulin resistance and diabetes mellitus, which are
observed in cats.
58

APPENDIX 1
Nutrient composition of test diets
Base diet: Royal Canin Veterinary Diet™ feline Diabetic DS 44™
Typical Analysis Dry Matter Analysis Energy Basis Analysis
Protein 46.0% 49.5% 46.5%
Fat 12.0% 12.9% 29.4%
Carbohydrate 23.8% 25.6% 24.1%
Base diet with added DAG or TAG oil (15 g oil added per 100 g diet)
Typical Analysis Dry Matter Analysis Energy Basis Analysis
Protein 40.0% 42.6% 34.0%
Fat 23.5% 25.0% 48.4%
Carbohydrate 20.7% 22.0% 17.6%
Energy density: Base diet, 372 kcal/100 g. Base diet with added oil, 439 kcal/100 g.
59

APPENDIX 2. Palatability study datasheet
CAT # __________
Body weight (kg) morning: Day 0 _____ Day 7 _____ Day 14 _____
Days -5 to -1: 50:50 mixture
Days 0 to 13: Diet A and Diet B
DAY BOWL ORDER
BOWL A WT IN (g)
BOWL A WT OUT (g)
BOWL B WT IN (g)
BOWL B WT OUT (g) NOTES (fecal score)
-5 N/A xxx xxx
-4 N/A
-3 N/A
-2 N/A
-1 N/A
0 B-A
1 A-B
2 A-B
3 A-B
4 B-A
5 B-A
6 A-B
7 B-A
8 A-B
9 A-B
10 B-A
11 B-A
12 B-A
13 A-B
14 xxx xxx xxx
60

APPENDIX 3. Daily food intakes for individual cats. First column – DAG diet, second
column – TAG diet.
Cat 01-306
0
20
40
60
80
100
1 2 3 4 5 6 7 8 9 10 11 12 13 14
Day
Food
inta
ke (g
)
DAGTAG
61
Cat 01-307
0
20
40
60
80
100
1 2 3 4 5 6 7 8 9 10 11 12 13 14
Day
Food
inta
ke (g
)
DAGTAG
Cat 02-103
0
20
40
60
80
100
1 2 3 4 5 6 7 8 9 10 11 12 13 14
Day
Food
inta
ke (g
)
DAGTAG
62

Cat 02-254
0
20
40
60
80
100
1 2 3 4 5 6 7 8 9 10 11 12 13 14
Day
Food
inta
ke (g
)
DAGTAG
Cat 04-037
0
20
40
60
80
100
1 2 3 4 5 6 7 8 9 10 11 12 13 14
Day
Food
inta
ke (g
)
DAGTAG
63

Cat 04-160
0
20
40
60
80
100
1 2 3 4 5 6 7 8 9 10 11 12 13 14
Day
Food
inta
ke (g
)
DAGTAG
Cat 04-227
0
20
40
60
80
100
1 2 3 4 5 6 7 8 9 10 11 12 13 14
Day
Food
inta
ke (g
)
DAGTAG
64

Cat 04-331
0
20
40
60
80
100
1 2 3 4 5 6 7 8 9 10 11 12 13 14
Day
Food
inta
ke (g
)
DAGTAG
65

BIBLIOGRAPHY
Abdel-Nabey AA, Shehata AAY, Ragab MH. Glycerides of cottonseed oils from Egyptian and other varieties. Riv Ital Sostanze Grasse 1992;69:443-447. Ai M, Tanaka A, Shoji K, et al. Suppressive effects of diacylglycerol oil on postprandial hyperlipidemia in insulin resistance and glucose intolerance. Atherosclerosis. 2007;195:398-403. Ailhaud G, Samuel D, Lazdunski M, et al. Some observations on the mode of action of mono- and diglyceride transacylase of intestinal mucosa. Biochim Biophys Acta. 1964;84:643-664. Asakura L, Lottenberg AMP, Neves MQTS, et al. Dietary medium-chain triacylglycerol prevents the postprandial rise of plasma triacylglycerols but induces hypercholesterolemia in primary hypertriglyceridemic subjects. Am J Clin Nutr. 2000;71:701-705. Backus RC, Ginzinger DG, Ashbourne Excoffon KJD, et al. Maternal expression of functional lipoprotein lipase and effects on body fat mass and body condition scores of mature cats with lipoprotein lipase deficiency. Am J Vet Res. 2001;62:264-269. Bauer JE, Nagaoka D, Porterpan B, et al. Postprandial lipolytic activities, lipids, and carbohydrate metabolism are altered in dogs fed diacylglycerol meals containing high- and low-glycemic-index starches (abstract). J Nutr. 2006;136:1955S-1957S. Bauer JE, Verlander JW. Congenital lipoprotein lipase deficiency in hyperlipemic kitten siblings. Vet Clin Pathol. 1984;13:7-11. Bierbach H. Triacylglycerol biosynthesis in human small intestinal mucosa. Digestion. 1983;28:138-147. Brenna JT, Sacks GL. Structure, nomenclature, and properties of lipids. In: Stipanuk MH. Biochemical, physiological, & molecular aspects of human nutrition. St. Louis: Saunders Elsevier, 2006, pp 122-124. Brunzell JD, Deeb SS. Familial lipoprotein lipase deficiency, apo C-II deficiency, and hepatic lipase deficiency. In: Scriver Cr, Beaudet AL, Sly WS, et al. (eds). The metabolic and molecular bases of inherited disease, 8th ed. New York: McGraw-Hill, 2001;2789-2800. CDC. Overweight and obesity. Available at http://www.cdc.gov/nccdphp/dnpa/obesity/ and at http://www.cdc.gov/nccdphp/publications/aag/dnpa.htm (accessed August 2008).
66

Chapman MJ. Animal lipoproteins: chemistry, structure, and comparative aspects. J Lipid Res. 1980;21:789-853. Chengelis CP, Kirkpatrick JB, Marit GB, et al. A chronic dietary toxicity study of DAG (diacylglycerol) in Beagle dogs. Food Chem Toxicol. 2006a;44:81-97. Chengelis CP, Kirkpatrick JB, Bruner RH, et al. A 24-month dietary carcinogenicity study of DAG (diacylglycerol) in rats. Food Chem Toxicol. 2006b;44:98-121. Chengelis CP, Kirkpatrick JB, Bruner RH, et al. A 24-month dietary carcinogenicity study of DAG in mice. Food Chem Toxicol. 2006c;44:122-137. Citkowitz E. Hypertriglyceridemia. Updated July 12, 2008, available at http://www.emedicine.com/MED/topic2921.htm (accessed September 2008) D’Alonzo RP, Kozarek WJ, Wade RL. Glyceride composition of processed fats and oils as determined by glass capillary gas chromatography. J Am Oil Chem Soc. 1982;59:292-295. DeIulio E, Precht K, Zamudio A, et al. Diacylglycerol consumption and blood lipids and adiposity in rats (abstract). FASEB J. 2008;22:1092.10. Demacker PNM, van Heijst PF, Hak-Lemmers HLM, et al. A study of the lipid transport system in the cat, Felix domesticus. Atherosclerosis. 1987;66:113-123. Demacker PNM, Hijmans AGM, Stalenhoef AFH, et al. Studies on the function of hepatic lipase in the cat after immunological blockade of the enzyme in vivo. Atherosclerosis. 1988;69:173-183. Feoli-Fonseca JC, Levy E, Godard M, et al. Familial lipoprotein lipase deficiency in infancy: clinical, biochemical, and molecular study J Pediatrics. 1998;133:417-423. Fujii A, Allen TJ, Nestel PJ. A 1,3-diacylglycerol-rich oil induces less atherosclerosis and lowers plasma cholesterol in diabetic apoE-deficient mice. Atherosclerosis. 2007;193:55-61. Ginzinger DG, Clee SM, Dallongeville J, et al. Lipid and lipoprotein analysis of cats with lipoprotein lipase deficiency. Eur J Clin Invest. 1999;29:17-26. Ginzinger DG, Lewis MES, Ma Y, et al. A mutation in the lipoprotein lipase gene is the molecular basis of chylomicronemia in a colony of domestic cats. J Clin Invest. 1996;97:1257-1266. Goudriaan JR, Espirito Santo SMS, Voshol PJ, et al. The VLDL receptor plays a major role in chylomicron metabolism by enhancing LPL-mediated triglyceride hydrolysis. J Lipid Res. 2004;45:1475-81
67

Gunn-Moore DA, Watson TDG, Dodkin SJ, et al. Transient hyperlipidaemia and anaemia in kittens. Vet Rec. 1997;140:355-359. Hara K, Onizawa K, Honda H, et al. Dietary diacylglycerol-dependent reduction in serum triacylglycerol concentration in rats. Ann Nutr Metab. 1993;37:185-191. Hibi M, Takase H, Yasunaga K, et al. Fat utilization in healthy subjects consuming diacylglycerol oil diet: dietary and whole body fat oxidation. Lipids. 2008a;43:517-524. Hibi M, Takase H, Yasunaga K, et al. Greater fat oxidation with diacylglycerol oil consumption for 14 days compared with triacylglycerol oil consumption in overweight men and women (abstract). Int J Obes (Lond). 2008b;epub ahead of print. Ichihara T, Yoshino H, Doi Y, et al. No enhancing effects of diacylglycerol oil on tumor development in a medium-term multi-organ carcinogenesis bioassay using male F344 rats. Food Chem Toxicol. 2008;46:147-167. Ijiri Y, Naemura A, Yamashita T, et al. Mechanism of the antithrombotic effect of dietary diacylglycerol in atherogenic mice. Pathophysiol Haemost Thromb 2006;35:380-387. Ivan B, Tamas D, Ildiko S, et al. Acute hypertriglyceridemic pancreatitis during pregnancy due to homozygous lipoprotein lipase gene mutation. Clin Chim Acta. 2008;in press. Jaye M, Krawiec J. Endothelial lipase and HDL metabolism. Curr Opin Lipidol. 2004;15:183-9. Johnstone AC, Jones BR, Thompson JC, et al. The pathology of an inherited hyperlipoproteinaemia of cats. J Comp Path. 1990;102:125-137. Jones BR, Johnstone AC, Cahill JI, et al. Peripheral neuropathy in cats with inherited primary hyperchylmicronaemia. Vet Rec. 1986;119:268-272. Jones BR, Wallace A, Harding DRK, et al. Occurrence of idiopathic, familial hyperchylomicronemia in a cat. Vet Rec. 1983;112:543-547. Kamphuis MMJW, Mela DJ, Westerterp-Plantenga MS. Diacylglycerols affect substrate oxidation and appetite in humans. Am J Clin Nutr. 2003;77:1133-1139. Kanchuk ML, Backus RC, Calvert CC. Weight gain in gonadectomized normal and lipoprotein lipase-deficient male domestic cats results from increased food intake and not decreased energy expenditure. J Nutr. 2003;133:1866-1874.
68

Kane E, Leung PM, Rogers QR, et al. Diurnal feeding and drinking patterns of adult cats as affected by changes in the level of fat in the diet. Appetite. 1987;9:89-98. Kane E, Morris JG, Rogers QR. Acceptability and digestibility by adult cats of diets made with various sources and levels of fat. J Anim Sci. 1981;53:1516-1523. Kasamatsu T, Ogura R, Ikeda N, et al. Genotoxicity studies on dietary diacylglycerol (DAG) oil. Food Chem Toxicol. 2005;43:253-260. Kawashima H, Takase H, Yasunaga K, et al. One-year ad libitum consumption of diacylglycerol oil as part of a regular diet results in modest weight loss in comparison with consumption of a triacylglycerol control oil in overweight Japanese subjects. J Am Diet Assoc. 2008;108:57-66. Kim HJ, Lee KT, Lee MK, et al. Hypolipidemic effect of dietary diacylglycerol oil in Sprague-Dawley rats fed a normal diet. J Med Food. 2007;10:60-66. Kimura S, Tsuchiya H, Inage H, et al. Effects of dietary diacylglycerol on the energy metabolism. Int J Vitam Nutr Res. 2006;76:75-79. Kondo H, Hase T, Murase T, et al. Digestion and assimilation features of dietary DAG in the rat small intestine. Lipids. 2003;38:25-30. Kristensen JB, Nielsen NS, Jacobsen C, et al. Oxidative stability of diacylglycerol oil and butter blends containing diacylglycerols. Eur J Lipid Sci Technol. 2006;108:336-350. Kristensen JB, Jørgensen H, Mu H. Diacylglyerol oil does not affect portal vein transport of nonesterified fatty acids but decreases the postprandial plasma lipid response in catheterized pigs. J Nutr. 2006;136:1800-1805. Laflamme D. Development and validation of a body condition score system for cats: a clinical tool. Feline Pract. 1997;25:13-18. Li CM, Kimura F, Endo Y, et al. Deterioration of diacylglycerol- and triacylglycerol-rich oils during frying of potatoes. Eur J Lipid Sci Technol. 2005;107:173-179. Li D, Xu T, Takase H, et al. Diacylglycerol-induced improvement of whole-body insulin sensitivity in type 2 diabetes mellitus: A long-term radomized, double-blind controlled study. Clin Nutr. 2008;27:203-211. MacDonald ML, Rogers QR, Morris JG. Aversion of the cat to dietary medium-chain triglycerides and caprylic acid. Physiol Behav. 1985;35:371-375. Macrae AR. Lipase-catalyzed interesterification of oils and fats. J Am Oil Chem Soc. 1983;60:243-246.
69

Maki KC, Davidson MH, Tsushima R, et al. Consumption of diacylglycerol oil as part of a reduced-energy diet enhances loss of body weight and fat in comparison with consumption of a triacylglycerol control oil. Am J Clin Nutr. 2002;76:1230-1236. Matsuyama T, Shoji K, Watanabe H, et al. Effects of diacylglycerol oil on adiposity in obese children: initial communication. J Pediatr Endocrinol Metab. 2006;19:795-804. Mead JR, Irvine SA, Ramji DP. Lipoprotein lipase: structure, function, regulation, and role in disease. J Mol Med. 2002;80:753-769. Meng X, Zou D, Shi Z, et al. Dietary diacylglycerol prevents high-fat diet-induced lipid accumulation in rat liver and abdominal adipose tissue. Lipids. 2004;39:37-41. Mitsuhashi Y, Bandy D, Nagaoka D, et al. Suppression of chylomicron triacylglycerol but not lipoprotein lipase or lipoprotein-cholesterol distribution during weight loss in Beagles fed diacylglycerol enriched oil (abstract). J Vet Intern Med. 2006;20:792. Mori Y, Nakagiri H, Kondo H, et al. Dietary diacylglycerol reduces postprandial hyperlipidemia and ameliorates glucose intolerance in Otsuka Long-Evans Tokushima Fatty (OLETF) rats. Nutrition. 2005;21:933-939. Morita O, Knapp JF, Tamaki Y, et al. Effects of dietary diacylglycerol oil on embryo/fetal development in rats. Food Chem Toxicol. 2008a;46:2510-2516. Morita O, Tamaki Y, Kirkpatrick JB, et al. Safety assessment of heated diacylglycerol oil: subchronic toxicity study in rats. Food Chem Toxicol. 2008b;46:2748-2757. Morita O, Soni M. Safety assessment of diacylglycerol oil as an edible oil: a review of the published literature. Food Chem Toxicol. 2008c;in press. Murase T, Mizuno T, Omachi T, et al. Dietary diacylglycerol suppresses high fat and high sucrose diet-induced body fat accumulation in C57BL/6J mice. J Lipid Res. 2001;42:372-378. Murase T, Aoki M, Wakisaka T, et al. Anti-obesity effect of dietary diacylglyerol in C57BL/6J mice. J Lipid Res. 2002;43:1312-1319. Murata M, Hara K, Ide T. Alteration by diacylglycerols of the transport and fatty acid composition of lymph chylomicrons in rats. Biosci Biotechnol Biochem. 1994;58:1416-1419. Murata M, Ide T, Hara K. Reciprocal responses to dietary diacylglycerol of hepatic enzymes of fatty acid synthesis and oxidation in the rat. Br J Nutr. 1997;77:107-121.
70

Nagao T, Watanabe H, Goto N, et al. Dietary diacylglycerol suppresses accumulation of body fat compared to triacylglycerol in men in a double-blind controlled trial. J Nutr. 2000;130:792-797. National Research Council. Nutrient requirements of cats and dogs. Washington, DC: National Academies Press, pp 366, 367, 2006. Osaki N, Meguro S, Onizawa K, et al. Effects of a single and short-term ingestion of diacylglycerol on fat oxidation in rats. Lipids. 2008;43:409-417. Ota N, Soga S, Hase T, et al. Dietary diacylglycerol induces the regression of atherosclerosis in rabbits. J Nutr. 2007;137:1194-1199. Peritz LN, Brunzell JD, Harvey-Clarke C, et al. Characterization of a lipoprotein lipase class III type defect in hypertriglyceridemic cats. Clin Invest Med. 1990;13:259-263. Preiss-Landl K, Zimmermann R, Hammerle G, et al. Lipoprotein lipase: the regulation of tissue specific expression and its role in lipid and energy metabolism. Curr Opin Lipidol. 2002;13:471-481. Procter and Gamble. Olean, available at http://www.olean.com/ (accessed August 2008). Ramprasath VR, Yuan Q, Jones P. Effect of diacylglycerol (Enova oil™) consumption on serum lipid profiles in overweight hypertriglyceridemic women (abstract). FASEB J. 2008;22:lb737. Reginato CF, Backus RC, Rogers QR. Improved growth of lipoprotein lipase deficient kittens by feeding a low-fat, highly digestible diet. J Nutr Biochem. 2002;13:149-156. Reyes G, Yasunaga K, Rothenstein E, et al. Effects of a 1,3-diacylglycerol oil-enriched diet on postprandial lipemia in people with insulin resistance. J Lipid Res. 2008;49:670-678. Richter WO, Jacob BG, Ritter MM, et al. Treatment of primary chylomicronemia due to familial hypertriglyceridemia by ω-3 fatty acids. Metabolism. 1992;41:1100-1105. Ross CJD, Twisk J, Bakker AC, et al. Correction of feline lipoprotein lipase deficiency with adeno-associated virus serotype 1-mediated gene transfer of the lipoprotein lipase S447X beneficial mutation. Hum Gene Ther. 2006;17:487-499. Ross CJD, Twisk J, Meulenberg JM, et al. Long-term correction of murine lipoprotein lipase deficiency with AAV11-mediated gene transfer of the naturally occurring LPL beneficial mutation. Hum Gene Ther. 2004;15:906-919.
71

Rouis M, Dugi KA, Previato L, et al. Therapeutic response to medium-chain triglycerides and ω-3 fatty acids in a patient with the familial chylomicronemia syndrome. Arterioscler Thromb Vasc Biol. 1997;17:1400-1406. Rudkowska I, Roynette CE, Demonty I, et al. Diacylglycerol: efficacy and mechanism of action of an anti-obesity agent. Obes Res. 2005;13:1864-76. Saito S, Tomonobu K, Hase T, et al. Effects of diacylglycerol on postprandial energy expenditure and respiratory quotient in healthy subjects. Nutrition. 2006;22:30-35. Saito S, Hernandez-Ono A, Ginsberg HN. Dietary 1,3-diacylglycerol protects against diet-induced obesity and insulin resistance. Metabolism. 2007;56:1566-1575. Shimizu M, Moriwaki J, Nishide T, et al. Thermal deterioration of diacylglycerol and triacylglycerol oils during deep-frying. J Am Oil Chem Soc. 2004;81:571-576. Soni MG, Imura H, Burdock GA. Chronic study of diacylglycerol oil in rats. Food Chem Toxicol. 2001;39:317-329. Sprecher DL, Knauer SL, Black DM, et al. Chylomicron-retinyl palmitate clearance in type I hyperlipidemic families. J Clin Invest. 1991;88:985–94. Sugimoto T, Kimura T, Fukuda H, et al. Comparisons of glucose and lipid metabolism in rats fed diacylglycerol and triacylglycerol oils. J Nutr Sci Vitaminol. 2003;49:47-55. Sugimoto T, Fukuda H, Kimura T, et al. Dietary diacylglycerol-rich oil stimulation of glucose intolerance in genetically obese rats. J Nutr Sci Vitaminol. 2003;49:139-144. Sukhija PS, Palmquist DL. Rapid method for determination of total fatty acid content and composition of feedstuffs and feces. J Agric Food Chem. 1988;36:1202-1206. Tada N, Watanabe H, Matsuo N, et al. Dynamics of postprandial remnant-like lipoprotein particles in serum after loading of diacylglycerols. Clinica Chimica Acta. 2001;311:109-117. Tada N, Yoshida H. Diacylglycerol on lipid metabolism. Curr Opin Lipidol. 2003;14:29-33. Tada N. Physiological actions of diacylglycerol outcome. Curr Opin Clin Nutr Metab Care. 2004;7:145-149. Tada N, Shoji K, Takeshita M, et al. Effects of diacylglycerol ingestion on postprandial hyperlipidemia in diabetes. Clinica Chimica Acta. 2005;353:87-94. Taguchi H, Watanabe H, Onizawa K, et al. Double-blind controlled study on the effects of dietary diacylglycerol on postprandial serum and chylomicron triacylglycerol responses in healthy humans. J Am Coll Nutr. 2000;19:789-796.
72

Taguchi H, Nagao T, Watanabe H, et al. Energy value and digestibility of dietary oil containing mainly 1,3-diacylglycerol are similar to those of triacylglycerol. Lipids. 2001;36:379-382. Taguchi H, Omachi T, Nagao T, et al. Dietary diacylglycerol suppresses high fat diet-induced hepatic fat accumulation and microsomal triacylglycerol transfer protein activity in rats. J Nutr Biochem. 2002;13:678-683. Takase H, Shoji K, Hase T, et al. Effect of diacylglycerol on postprandial lipid metabolism in non-diabetic subjects with and without insulin resistance. Atherosclerosis. 2005;180:197-204. Takase H. Metabolism of diacylglycerol in humans. Asia Pac J Clin Nutr. 2007;16(Suppl 1):398-403. Teramoto T, Watanabe H, Ito K, et al. Significant effects of diacylglycerol on body fat and lipid metabolism in patients on hemodialysis. Clin Nutr. 2004;23:1122-1126. Thompson JC, Johnstone AC, Jones BR, et al. The ultrastructural pathology of five lipoprotein lipase-deficient cats. J Comp Path. 1989;101:251-262. Tomonobu K, Hase, T, Tokimitsu I. Dietary diacylglycerol in a typical meal suppresses postprandial increases in serum lipid levels compared with dietary triacylglycerol. Nutrition. 2006;22:128-135. Trevizan L, Bigley K, Anderson W, et al. Lipid metabolism effects in cats fed diets varying in medium chain fatty acids and linoleic acid concentrations (abstract). J Vet Intern Med. 2008;22:743. Tso PP, Crissinger K, Jandacek RJ. Digestion and absorption of lipids. In In: Stipanuk MH. Biochemical, physiological, & molecular aspects of human nutrition. St. Louis: Saunders Elsevier, 2006, pp 219-239. Umeda T, Bauer JE, Otsuji K. Weight loss effect of dietary diacylglycerol in obese dogs. J Anim Physiol Anim Nutr (Berl). 2006;90:208-215. Veltri BC, Backus RC, Rogers QR, et al. Adipose fatty acid composition and rate of incorporation of α-linolenic acid differ between normal and lipoprotein lipase-deficient cats. J Nutr. 2006;136:2980-2986. Watanabe H, Onizawa K, Naito S, et al. Fat-soluble vitamin status is not affected by diacylglycerol consumption. Ann Nutr Metab. 2001;45:259-264.
73
Watanabe T, Shimizu M, Sugiura M, et al. Optimization of reaction conditions for the production of DAG using immobilized 1,3-regiospecific lipase lipozyme RM IM. J Am Oil Chem Soc. 2003;80:1201-1207. Watson TDG, Gaffney D, Mooney CT, et al. Inherited hyperchylomicronaemia in the cat: lipoprotein lipase function and gene structure. J Small Anim Pract. 1992;33:207-212. Webb LE, Lengle E, Izzo R, et al. Micromethod for lipid-chromatographic determination of cholesterol in lipemic sera. Clin Chem, 1982;28:1769-1772. Weinstock PH, Bisgaier CL, Aalto-Setala K, et al. Severe hypertriglyceridemia, reduced high density lipoprotein, and neonatal death in lipoprotein lipase knockout mice. J Clin Invest. 1995;96:2555-2568. Yamamoto K, Asakawa H, Tokunaga K, et al. Long-term ingestion of dietary diacylglycerol lowers serum triacylglycerol in type II diabetic patients with hypertriglyceridemia. J Nutr. 2001;131:3204-3207. Yamamoto K, Asakawa H, Tokunaga K, et al. Effects of diacylglycerol administration on serum triacylglycerol in a patient homozygous for complete lipoprotein lipase deficiency. Metabolism. 2005;54:67-71 Yamamoto K, Tomonobu K, Asakawa H, et al. Diet therapy with diacylglycerol oil delays the progression of renal failure in type 2 diabetic patients with nephropathy. Diabetes Care. 2006;29:417-419. Yamamoto K, Takeshita M, Tokimitsu I, et al. Diacylglycerol oil ingestion in type 2 diabetic patients with hypertriglyceridemia. Nutrition. 2006;22:23-29. Yanagisawa Y, Kawabata T, Tanaka O, et al. Improvement in blood lipid levels by dietary sn-1,3-diacylglycerol in young women with variants of lipid transporters 54T-FABP2 and -493g-MTP. Biochem Biophys Res Commun. 2003;302:743-750. Yanagita T, Ikeda I, Wang Y, et al. Comparison of the lymphatic transport of radiolabeled 1,3-dioleoylglycerol and trioleoylglycerol in rats. Lipids. 2004;39:827-832. Yanai H, Tada N, Yoshida H, et al. Diacylglycerol oil for apolipoprotein C-II deficiency. Q J Med. 2007a;100:247-9. Yanai H, Tomono Y, Ito K, et al. Diacylglycerol oil for the metabolic syndrome. Nutr J. 2007b;6:43.
74

75
Yasunaga K, Glinsmann WH, Seo Y, et al. Safety aspects regarding the consumption of high-dose dietary diacylglycerol in men and women in a double-blind controlled trial in comparison with consumption of a triacylglycerol control oil. Food Chem Toxicol. 2004;42:1419-1429. Yasunaga K, Saito S, Zhang Y, et al. Effects of triacylglycerol and diacylglycerol oils on blood clearance, tissue uptake, and hepatice apolipoprotein B secretion in mice. J Lipid Res. 2007;48:1108-1121. Xu T, Li X, Xiaohang M, et al. Effect of diacylglycerol on postprandial serum triacylglycerol concentration: a meta-analysis. Lipids. 2008;(in press). Xu T, Li X, Zhang A, et al. Effect of diacylglycerol on body weight: a meta-analysis. Asia Pac J Clin Nutr. 2008;17:415-421. Z Trim Holdings. Z Trim, available at http://www.ztrim.com/pages/home/1.php (accessed August 2008).