feedback of pavement management performance data...
TRANSCRIPT

74 TRANSPORTATION RESEARCH RECORD 1272
Feedback of Pavement Management Performance Data for Pavement Design
JOHN P. ZANIEWSKI, ROHAN W. PERERA, AND MICHAEL S. MAMLOUK
The Arizona Department of Transportation (ADOT) was one of the first state highway agencies to develop a formal pavement management system. ADOT has been coll cting pavement performance data ince 1972. These data were u ed during a recent project for the development of a new flexible pavement overlay design procec.Jure . la additi 11 to conventional overlr1ys , the design method permit. the evaluation of milling and replacing the su rface with either recycled r virgin mix. Two forms of models arc needed , one for predicting the roughness after the treatment and one for predicting the rate of de elopment of roughness over the life of the treatment. Several hypotheses of the factors affecting these models were developed on the basis of engineering judgment and pavement performance theories. However, from a statistical analysis of the data, the only factors found to affect the roughness after the overlay were the roughness of the pavement before the overlay and whether an asphalt concrete friction course was placed during the overlay construction. The rate of development of roughness was not affected by any of the design variables.
Pavement management systems (PMSs) have become widely accepted by state highway agencies for the cost-effective management of pavement networks. Virtually every state highway agency has a system either in place or under development even though the technology was virtually unknown 10 years ago (1,2). The elements of the PMS are well defined at this time. Although individual systems vary widely in the detailed treatment of these elements, the basic principles arc common to most systems. Textbooks and technical literature have defined such elements as the pavement network inventory, the pavement condition evaluation, data base development, and performance models. As shown in Figure 1, the feedback cycle is an integral part of the systems approach (3). Yet in the current state of the art in pavement management, the feedback cycle has not been fully implemented by most highway agencies.
The feedback cycle of the PMS provides the mechanism for the periodic evaluation of the elements of the system to determine whether the system is currently fulfilling the needs of the agency in the best possible manner. This implies that a PMS is a dynamic system that needs to be evaluated and adjusted to meet the changing needs of the highway agency. The feedback cycle can be used to evaluate virtually all elements of the PMS. For example, the rehabilitation project selection and treatment options can be compared with the actual construction program to define how well the PMS recommendations are implemented by the agency.
This paper demonstrates how the feedback cycle was used for the development of performance models for a new overlay design procedure for the Arizona Department of Transpor-
Department of Civil Engineering and Center for Advanced Research in Transportation, Arizona State University, Tempe, Ariz . 85281.
tation (ADOT). The details of this design method have been presented by Mamlouk et al. (4,5). This design procedure considers three forms of pavement deterioration-roughness, fatigue, and plastic deformation. The fatigue model was developed from data collected explicitly for the research project and is therefore not addressed here. The plastic deformation model is based only on theoretical considerations of the strain history of the existing pavement. The roughness models were developed on the basis of a statistical analysis of the pavement management data base.
ADOT PAVEMENT DATA FILES
The pavement data are contained in three data bases: pavement performance, construction history, and deflection. These
"' (.)
< a> 0 w w u.
ENVIRONMENT (Technological - Socio - Economic - Political)
------'----------· i y
PROBLEM RECOGNITION
Review of Existing Situation Preliminary Assessment of Needs
MEASUREMENT AND -> EVALUATION OF I
PROBLEM DEFINITION
• Objecliveo • Inputs • Oulputs • Con1traint1 • values
Decision Rules
GENERATION OF ALTERNATIVE STRATEGIES
ANALYSIS OF ALTERNATIVES • Predict Outputs
EVALUATION OF ALTERNATIVES AND
OPTIMIZATION
• Assign Values lo Ou1pu1s • Choose Best Alternative
IMPLEMENTATION OF BEST ALTERNATIVE
• Schedules
PERFORMANCE OF THE ----• Quality Control • lnformalion
Storage SYSTEM IN SERVICE • Operation
FIGURE 1 Major phases and components of the systems method (3).

Zaniewski et al.
data bases were originally developed on ADOT's mainframe computer. They were subsequently downloaded to a microcomputer for better access. The microcomputer files are currently maintained with dBase. The pavement performance and construction history data files were used for the development of the roughness performance models.
Pavement Performance Data Base
The pavement performance data base contains a record for each milepost on the two-lane pavements in the state. Two records, one for each direction, are maintained for the divided highways. The file contains 7 ,369 records. There are 90 data fields, which may be classified as location information, traffic data, performance data, maintenance costs, and project data. The location information consists of the highway class, route number, direction, district, region of the state, and so forth. The traffic data give the average daily traffic, annual 18-kip equivalent axle loads, and a growth factor based on a 10-year average of the traffic volumes.
There are several types of performance data. All performance data are current as of 1988. Initially roughness constituted the only performance data in the system. As ADOT increased the sophistication of the system and defined the need, other data were added. The types of performance data and the initial date of collection are as follows:
Type of Data
Roughness Cracking Skid resistance Patching Flushing Rutting
Initial Year of Collection
1972 1979 1980 1984 1986 1986
Roughness is measured with a Mays meter. The approximate relationship between the Mays meter output and the present serviceability index is (6)
SI = 0.3488 + 4.6836*0.9970MRM (1)
where: SI is the serviceability index (range 0 to 5) and MRM is output of the Mays meter (in ./mile).
Skid resistance is measured with a Mu meter. Manual condition surveys are performed on a 1,000-ft2 area at each milepost for the other distresses. Although patching is not a distress, it is included in the condition survey to explain a reduction in the cracking area from one year to the next.
Maintenance cost data, derived from the ADOT maintenance management system, PECOS, are available for 1979 to 1987. In the PECOS system the beginning and ending mileposts for each activity for each day are recorded. These costs were equally divided between the mileposts to arrive at the maintenance costs for each milepost. Because of the variability of the maintenance costs from one year to the next, a 3-year moving average is used to smooth out the data.
The project data contain information about the most recent capital construction or rehabilitation project performed at each milepost. The fields contain information on the layer type and thickness for each lift in the construction project.
Construction History File
The construction history file contains data for each capital construction and rehabilitation project performed by ADOT.
75
All historical records available to ADOT were used in the creation of this file, including as-built plans, construction records, and accounting files. As a result, the file represents a comprehensive history of the construction practices in the state. Each construction project is a record in the file. The fields contain data on the project number, the route number, beginning and ending mileposts, month and year of construction, and the layer type and thickness of each lift in the construction project.
Typically the user of the construction history file is interested in knowing the pavement structure at a specific location on the pavement. This requires searching the file for each construction project performed at that location. Because of the size of the file, this search process is cumbersome and time consuming. Therefore, an index file was generated that defines the construction projects records on a milepost basis. Thus, when the user wishes to access the construction records for a specific section of road, the index file is used first to identify the construction history file records that need to be accessed, and then the computer can recall these files directly without performing a search of the construction history file.
MODEL DEVELOPMENT
Modeling the performance of the treatments requires models of the change in roughness of the pavement due to the treatment and the rate of roughness development over time. The conceptual forms of the models are
R 0 - Ra = f(D, R 0 , Fe) ± e
dR = f(D, T, Ra, dRb, SN, RF) ± e
where
(2)
(3)
dR = rate of development of roughness (in./mile/year), D = thickness of the treatment, R0 = roughness before treatment (in./mile ), Ra = initial roughness after treatment (in./mile), Fe = indicator for the presence of a friction course, T = average daily traffic loadings,
dRb = rate of change in roughness before the treatment (in ./mile/year),
SN structural number, RF = regional factor, and
e = error term.
The roughness model development was stratified into six cases based on the highway type and treatment. The highway types used in the analysis were Interstate, state, and U.S. routes. The treatment types were conventional overlays and milled sections. Conventional overlays could consist of up to three layers. A single-layer overlay had only an asphalt concrete layer. A two-layer overlay could be either a leveling course followed by asphalt concrete or an asphalt concrete layer followed by an open graded friction course. A threelayer overlay consisted of a leveling course, an asphalt concrete layer, and a friction course. The milled sections consisted of either partial or full-depth removal of the existing surface followed by either a virgin or recycled layer of asphalt concrete, and in some cases a friction course was placed on the surface.

76
The pavement performance data base was queried to define homogeneous sections for each of the six highway type-andtreatment combinations. The minimum length for the homogeneous section was 2 mi. Because the location of the end of the treatment between mileposts was unknown, data from the last milepost of the homogeneous section were discarded. The roughness of the homogeneous section for each year in the analysis was then determined by averaging the roughness across all mileposts in the section.
All milling and overlay projects performed from 1972 to 1987 were included in the analysis for the model of the change in roughness due to the treatment. The rate of change in roughness model requires several years of data to establish, so only projects placed between 1972 and 1981 were considered for the development of roughness model. The number of sections available for the analysis for each of the six cases is given in Table 1. Although milling has been widely used on the Interstates in Arizona, there have not been enough applications of this type of treatment on state and U.S. routes to permit statistical analysis.
Analysis Method
Multiple regression was used to develop the models defined by Equations 2 and 3. The STATPAK program was used to carry out a forward stepwise regression. The forward stepwise algorithm adds independent variables to the model in the order of their computed F-to-enter values. The process continues to add variables into the model until all remaining variables have an F-value less than the user-specified value for F-to-enter. The minimum F-to-enter value was computed for a significance level of 0.05 and the number of degrees of freedom, and was in the range of 4.0 to 4.2.
TRANSPORTATION RESEARCH RECORD 1272
Rate of Roughness Development
To establish the rate of roughness uevelopmenl for each pro ject, a regression was performed for each homogeneous section between the annual roughness and year since overlay. The regression was performed on a quadratic equation:
where
R; = roughness for homogeneous section (in./mile), T = year since the treatment, and c = regression coefficients.
(4)
The c2 coefficient was not significant for the sections in this study, indicating a linear increase in roughness with time. The intercept of the equation indicates the initial roughness of the section after treatment. Because this factor was modeled independently, the intercept derived from this analysis was not considered further. Thus, the c1 coefficient of the slope of the roughness-time relationship was used to model the rate of roughness development for each of the homogeneous sections.
Figure 2 shows typical relationships between roughness and time for the three highway types. In general, these models had a high R2
, indicating a strong correlation between the roughness and time. The distribution of rate of development of roughness for each of the highway types is shown in Figure 3. For conventional overlays, the average rates of development of roughness for the Interstate, state, and U.S. routes are 6.7, 5.1, and 5.8 in./mile/year, respectively, and the standard deviation was about 2 in all cases. For the milled pavements on the Interstate system, the average rate of development of roughness was 4.3 in./mile/year.
TABLE 1 NUMBER OF PROJECTS USED IN THE ANALYSIS
Interstate U.S. Route State Route
Rate of Development
of Roughness for
overlaid Pavements 47 34 29
Rate of Development
of Roughness for
Milled Pavements 34 1 3
Change of Roughness Due
to overlay 33 65 52
Change of Roughness Due
to Milling 67 8 8

Zaniewski et al.
Once the rate of development of roughness of the individual sections was defined, regression analysis was used to determine whether any of the independent factors and their interactions in Equation 3 were significant. None of the independent variables were correlated with the rate of development of roughness. R2-values from the regression analysis were as follows:
INTERSTATE
140 •
~ 120 • •
I
~
~
• 100 • •
• 80 • • 60 •
• 40+-~~--~~--~~~~~~~~--~~-1
76 78 80 82 84 86 88
YEAR
STATE ROLITE
• • • • • •
•
• • •
120 •
100+-~~--~~--~~~~~~~~~~~--1
76 78
200
180
160 •
• • 140
80 82
YEAR
U.S. ROUTE
• •
• •
84 86 88
• • •
•
120._~~~~~~~~~~~~~~~~--1
16 78 80 82 84 VEAR
86 88
FIGURE 2 Typical relation between roughness and time for the three highway types.
Interstate State U.S. routes
Overlaid Pavement
0.16 0.15 0.10
Milled Pavement
0.39
77
Sufficient data were not available for state and U.S. routes to compute R2 for milled pavements.
INTERSTATES
10
r 4
2
0 0.5 1.5 2.5 3.5 4.5 5.5 6.5 7.5 8.5 9.5 10.511.512.5
RATE OF DEVELOPMENT OF ROUGHNESS (IN/MIL.ENA)
STAlE Ra.JTES
1.5 2.5 3.5 4.5 5.5 6.5 7.5 8.5 9.5
RATE OF DEVELOPMENT OF ROUGHNESS (IN/MILE/YR)
U.S. ROUTES
6
4
2
0 2.5 3.5 4.5 5.5 6.5 7.5 8.5 9.5 10.5
RATE OF DEVELOPMENT OF ROUGHNESS (IN/MIL.ENA)
FIGURE 3 Distribution of the rate of development of roughness for the three highway types.
78 TRANSPORTATION RESEARCH RECORD 1272
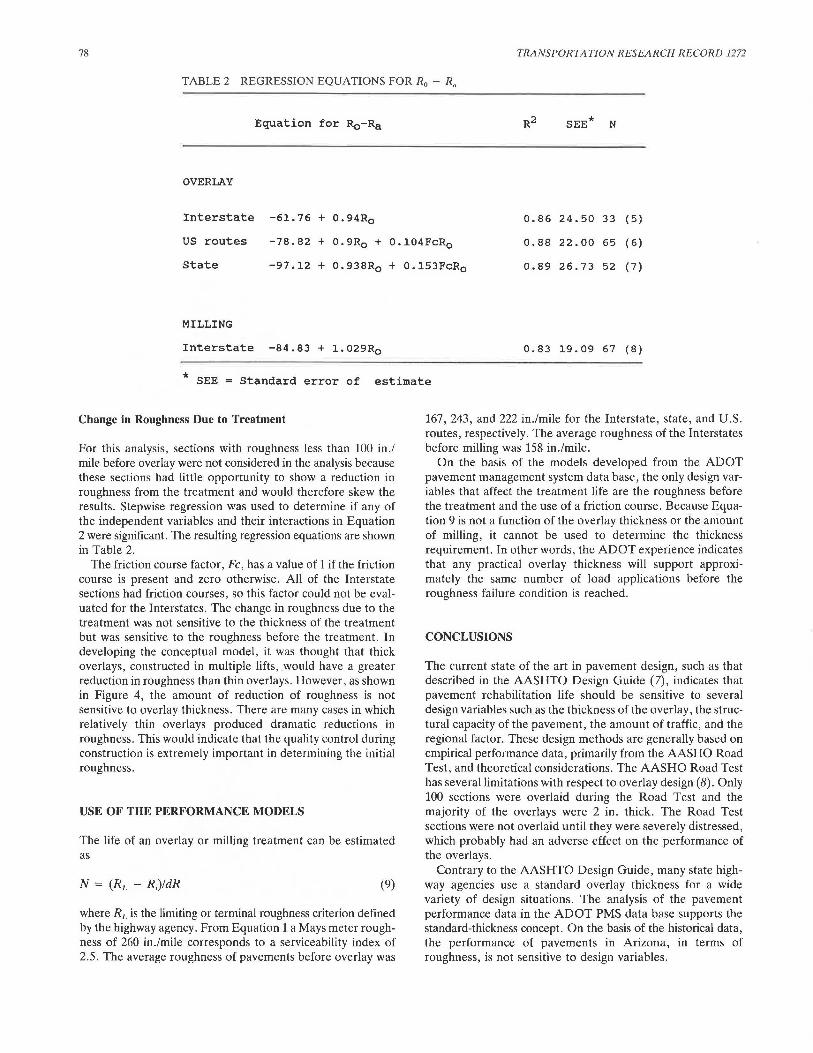
TABLE 2 REGRESSION EQUATIONS FOR Ro - Rn
Equation for R0 -Ra SEE* N
OVERLAY
Interstate -61.76 + 0.94R0
US routes -78.82 + 0.9R0 + 0.104FcR0
0.86 24.50 33 (5)
0.88 22.00 65 (6)
0.89 26.73 52 (7) State -97.12 + 0.938Ro + 0.153FCRo
MILLING
Interstate -84.83 + 1.029R0 0.83 19.09 67 (8)
* SEE = standard error of estimate
Change in Roughness Due to Treatment
For this analysis, sections with roughness less than 100 in./ mile before overlay were not considered in the analysis because these sections had little opportunity to show a reduction in roughness from the treatment and would therefore skew the results. Stepwise regression was used to determine if any of the independent variables and their interactions in Equation 2 were significant. The resulting regression equations are shown in Table 2.
The friction course factor, Fe, has a value of 1 if the friction course is present and zero otherwise. All of the Interstate sections had friction courses, so this factor could not be evaluated for the Interstates. The change in roughness due to the treatment was not sensitive to the thickness of the treatment but was sensitive to the roughness before the treatment. In developing the conceptual model, it was thought that thick overlays, constructed in multiple lifts, would have a greater reduction in roughness than thin overlays. However, as shown in Figure 4, the amount of reduction of roughness is not sensitive to overlay thickness. There are many cases in which relatively thin overlays produced dramatic reductions in roughness. This would indicate that the quality control during construction is extremely important in determining the initial roughness.
USE OF THE PERFORMANCE MODELS
The life of an overlay or milling treatment can be estimated as
N = (RL - R1)/dR (9)
where RL is the limiting or terminal roughness criterion defined by the highway agency. From Equation 1 a Mays meter roughness of 260 in./mile corresponds to a serviceability index of 2.5. The average roughness of pavements before overlay was
167, 243, and 222 in./mile for the Interstate, state, and U.S. routes, respectively. The average roughness of the Interstates before milling was 158 in./mile.
On the basis of the models developed from the ADOT pavement management system data base, the only design variables that affect the treatment life are the roughness before the treatment and the use of a friction course. Because Equation 9 is not a function of the overlay thickness or the amount of milling, it cannot be used to determine the thickness requirement. In other words, the ADOT experience indicates that any practical overlay thickness will support approximately the same number of load applications before the roughness failure condition is reached.
CONCLUSIONS
The current state of the art in pavement design, such as that described in the AASHTO Design Guide (7), indicates that pavement rehabilitation life should be sensitive to several design variables such as the thickness of the overlay, the structural capacity of the pavement, the amount of traffic, and the regional factor. These design methods are generally based on empirical performance data, primarily from the AASHO Road Test, and theoretical considerations. The AASHO Road Test has several limitations with respect to overlay design (8). Only 100 sections were overlaid during the Road Test and the majority of the overlays were 2 in. thick. The Road Test sections were not overlaid until they were severely distressed, which probably had an adverse effect on the performance of the overlays.
Contrary to the AASHTO Design Guide, many state highway agencies use a standard overlay thickness for a wide variety of design situations. The analysis of the pavement performance data in the ADOT PMS data base supports the standard-thickness concept. On the basis of the historical data, the performance of pavements in Arizona, in terms of roughness, is not sensitive to design variables.

Zaniewski et al.
Unfortunately, there are also limitations in the ADOT data base that should be recognized. The data available for this analysis were derived from the general population of pavements in the state rather than from a carefully designed experimental plan with properly selected factors and levels. This can confound the results of the analysis. Second, the inherent variability of the Mays meter has an effect on this analysis.
INTERSTATES ~ 300~~~~~~~~~~~~~~-----.
i 250
~ ~ 200
~ 150 I
~ 100 :
z 50
•
• •• • • • •
• • •
• • • •
• • •
• •
• • •
•
•
~ o +-~~~-.-~-.-~--..~~~--.~~~~..-~~---1
er , 3 5 7 9 , 1
OVERLAY THICKNESS (IN)
STATE Ra.TTES ~ 400 ..--~~~~~~~~~~~~~~---.
~ = ~ 300
!!!
~ 200
~ 100
I
• •
I • • I I •
•
I • I I I I
I I
•
•
•
• • • I
• •
2 3 4 5 OVERLAY THICKNESS (IN)
•
• •
6 7
~ U.S. ROUTES ~ 400-r-~~~~~~~~~~~~~~~~
! ~ 300 z J:
g 200
6::
~ 100
g
• • •
I •
I I
•
•
• • •
i I i: I • • • I • • I •
• : . . •
I
• •
0 w a:
o +-~~~~·-r-~~~~-r-~~~~....-~~~~~ , 3 5 7 OVERLAY THICKNESS (IN)
FIGURE 4 Reduction in roughness due to overlay versus overlay thickness for the three highway types.
9
79
Much of the variability in the year-to-year performance of the pavements can be attributed to measurement error rather than to the true variations in pavement performance. The measurement variability can mask out trends in the data that could be apparent with more precise measurements of roughness .
Even with these limitations, it is clear that the relationship between design variables and pavement performance is tenuous at best. Due to the size of the data base and the number of miles of pavement analyzed , any strong relationships between the pavement design variables and pavement performance should have surfaced during this analysis.
On the basis of the analysis performed, ADOT should take a conservative approach to overlay design. Minimal overlay thicknesses should be accepted for structural improvements to the pavement because the analysis indicated that increasing overlay thickness does not necessarily correspond to an increase in pavement life with respect to roughness. The analysis does demonstrate the need for strict smoothness specifications during the construction of overlay and milling jobs. Any roughness that is built into the pavement during construction leads to a direct reduction in pavement life.
ACKNOWLEDGMENTS
The authors would like to thank the Arizona Department of Transportation and Federal Highway Administration for the financial support for this research project. Special thanks go to J. Delton, J. Eisenberg, F. McCullagh, L. Scofield, and G. B. Way of ADOT for their valuable input and assistance during the project. The Center for Advanced Research in Transportation and the Civil Engineering Department at Arizona State University provided the facilities and support required for the performance of this research .
REFERENCES
l. G. B. Way. Network Optimization for Arizona. Proc., North American Pavement Management Conference, Vol. 2, Toronto, Ontario, Canada, 1985.
2. Pavement Management Systems, A National Perspective . Pavement Newsletter, No. 14, FHA, U.S. Department of Transportation , Spring 1989.
3. R . C. G. Haas and W. R . Hudson . Pavement Management Systems. McGraw-Hill, New York , 1978.
4. M. S. Mamlouk, W. N. Houston, S. L. Houston, and J . P. Zaniewski. Rational Characterization of Pavement Structures Using Deflection Analysis , Volume I, Research Results and Findings. Report FHWA-AZ88-254-I. Arizona Department of Transportation, Phoenix, Dec. 1988.
5. M. S. Mamlouk, J. P. Zaniewski, W. N. Houston, and S. L. Houston. Overlay Design Method for Flexible Pavements in Arizona. In Transportation Research Record 1286, in preparation .
6. G. B. Way, J. F. Eisenberg, J. 8. Delton, and J. E . Lawson . Structural Overlay Design for Arizona. Proc. AAPT, Vol. 53, 1984 .
7. AASHTO Guide for the Design of Pavement Structures . AASHO , Washington , D.C., 1986.
8. J. P. Zaniewski. Design Procedure for Asphalt Concrete Overlays of Flexible Pavements. Ph .D. dissertation. University of Texas, Austin, Tex., 1978.
Publication of this paper sponsored by Committee on Pavement Management Systems.