february 2012 state of the market
DESCRIPTION
Market statitistics for the Cincinnati area, residential housing (single family and condominium) for the month of February 2012TRANSCRIPT
Copyright© Karen Schlosser March 2012
6,1
87 7,3
37
8,1
00
8,7
74
9,6
52 10,6
44
13,4
95
14,6
28
15,1
01
13,0
94
12,5
61
12,9
62
11,1
14
0
2,000
4,000
6,000
8,000
10,000
12,000
14,000
16,000
0
200
400
600
800
1,000
1,200
1,400
1,600
1,800
2000 2001 2002 2003 2004 2005 2006 2007 2008 2009 2010 2011 2012
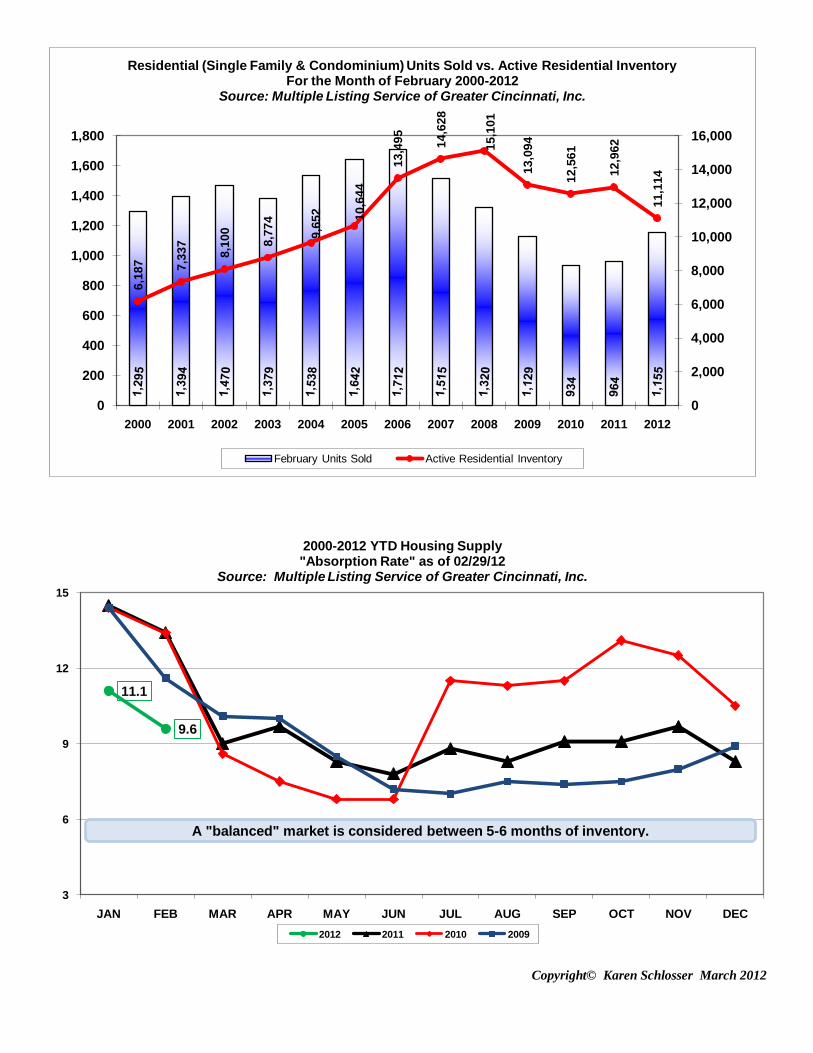
Residential (Single Family & Condominium) Units Sold vs. Active Residential Inventory For the Month of February 2000-2012
Source: Multiple Listing Service of Greater Cincinnati, Inc.
February Units Sold Active Residential Inventory
11.1
9.6
3
6
9
12
15
JAN FEB MAR APR MAY JUN JUL AUG SEP OCT NOV DEC
2012 2011 2010 2009
2000-2012 YTD Housing Supply "Absorption Rate" as of 02/29/12
Source: Multiple Listing Service of Greater Cincinnati, Inc.
A "balanced" market is considered between 5-6 months of inventory.

Copyright© Karen Schlosser March 2012
1,2
95
1,3
94
1,4
70
1,3
79
1,5
38
1,6
42
1,7
12
1,5
15
1,3
20
1,1
29
934
964
1,1
55
$182,5
99
$199,5
87
$224,5
68
$203,4
54 $
253,3
13
$277,8
17
$279,4
44
$248,4
46
$205,7
90
$146,7
98
$139,6
87
$138,7
45
$150,2
51
$0
$50,000
$100,000
$150,000
$200,000
$250,000
$300,000
0
200
400
600
800
1,000
1,200
1,400
1,600
1,800
2000 2001 2002 2003 2004 2005 2006 2007 2008 2009 2010 2011 2012
Number of Residential (Single Family & Condominium) Units Sold vs. Dollar Volume of Units (in $1,000's) Sold
For The Month Of February 2000-2012Source: Multiple Listing Service of Greater Cincinnati, Inc.
February Units Sold Dollar Volume of Solds
$141,0
03
$143,1
76
$152,7
67
$147,5
37
$164,7
03
$169,1
94
$163,2
27
$163,9
91
$155,9
02
$130,0
25
$149,5
58
$143,9
26
$130,0
87
100,000
120,000
140,000
160,000
180,000
2000 2001 2002 2003 2004 2005 2006 2007 2008 2009 2010 2011 2012
Nu
mb
er
of
Un
its S
old
Average Residential (Single Family & Condo) Sales Price For The Month Of February 2000-2012
Source: Multiple Listing Service of Greater Cincinnati, Inc.

Residential Sales (Single Family & Condominium) for February 2012
Summary Price Information
Source: Multiple Listing Service of Greater Cincinnati, Inc.
Minimum $2,500 Maximum $1,080,000
Selling Price Range # of
Homes Sold
Average $130,087 Median $105,000
$19,900 and under 106
$20,000 thru $29,999 80
$30,000 thru $39,999 67
$40,000 thru $49,999 50
$50,000 thru $59,999 54
$60,000 thru $69,999 52
$70,000 thru $79,999 53
$80,000 thru $89,999 55
$90,000 thru $99,999 42
$100,000 thru $119,999 93
$120,000 thru $139,999 87
$140,000 thru $159,999 81
$160,000 thru $179,999 66
$180,000 thru $199,999 51
$200,000 thru $249,999 78
$250,000 thru $299,999 55
$300,000 thru $349,999 28
$350,000 thru $399,999 16
$400,000 thru $449,999 14
$450,000 thru $499,999 11
$500,000 thru $549,999 3
$550,000 thru $599,999 2
$600,000 thru $649,999 2
$650,000 thru $699,999 3
$700,000 thru $749,999 3
$750,000 thru $799,999 1
$900,000 thru $949,999 1
$1,000,000 thru $1,249,999
1
Total Units Sold 1155
Copyright© Karen Schlosser March 2012