feasibility study of extra‑low voltage dc implementation
TRANSCRIPT
This document is downloaded from DR‑NTU (https://dr.ntu.edu.sg)Nanyang Technological University, Singapore.
Feasibility study of extra‑low voltage DCimplementation for LED lighting systems inbuilding
Ardiyanto, Nurul Husna
2016
Ardiyanto, N. H. (2016). Feasibility study of extra‑low voltage DC implementation for LEDlighting systems in building. Doctoral thesis, Nanyang Technological University, Singapore.
https://hdl.handle.net/10356/67988
https://doi.org/10.32657/10356/67988
Downloaded on 04 Dec 2021 00:37:19 SGT

FEASIBILITY STUDY OF EXTRA-LOW
VOLTAGE DC IMPLEMENTATION FOR LED
LIGHTING SYSTEMS IN BUILDING
NURUL HUSNA ARDIYANTO
SCHOOL OF ELECTRICAL AND ELECTRONIC ENGINEERING
2016

FEASIBILITY STUDY OF EXTRA-LOW
VOLTAGE DC IMPLEMENTATION FOR LED
LIGHTING SYSTEMS IN BUILDING
NURUL HUSNA ARDIYANTO
SCHOOL OF ELECTRICAL AND ELECTRONIC ENGINEERING
A thesis submitted to the Nanyang Technological University
in fulfilment of the requirement for the degree of
Master of Engineering
2016
NU
RU
L H
US
NA
AR
DIY
AN
TO
iii
Abstract
Total energy consumption in Singapore’s household system is as huge as 6,560 GWh
Among this total energy consumption, the lighting system contributes to 20.9%. The
common application of available LED system has a remarkable impact by reducing
energy consumption. However, the DC/DC driver in the LED system contributes to
system losses and has shorter lifetime than LED’s. Therefore, in this study we
proposed novel power distribution for LED lighting system. Compared to commonly
available LED lighting system, our novel LED lighting system eliminated the DC/DC
driver part. The systematic assessment of LED Lighting System driven by Extra Low
Voltage Direct Current (ELVDC) topologies was conducted. Then, electrical
characteristics of qualified LED lamps that meet Singapore regulations were applied to
the calculation for ELVDC. In order to understand ELVDC feasibility in comparison
with AC system for lighting application, we assessed the voltage drop across the cable,
system power loss, total efficiency, safety and the potential economic savings. We
found that LED lamp could replace CFL by producing 138 to 191 lux within tolerable
voltage level with clear diffuser type. Furthermore, the feasible ELVDC topologies for
LED Lighting system could achieve up to 92.22% efficiency in unipolar topology and
92.65% efficiency in bipolar topology. More importantly, it provided savings with
respect to AC system up to 70.7%. Based on these results, we concluded that it is
feasible to use driverless ELVDC topology for LED lighting system. Our results
mainly impact on smart building development and may contribute to decrease global
energy consumption.

iv
Acknowledgment
I would like to express my greatest gratitude to Allah SWT. He is God who created us
all, gives inspiration and strength to me.
I also would like to extend my gratitude to Nanyang Technological University,
especially School of Electrical and Electronic Engineering, and SinBerBEST –
BEARS for my financial supports as well as the opportunity for pursuing my Master
degree.
I am very grateful to following people who tirelessly support and keep faith on me:
Prof. Tseng King Jet, my supervisor, for his patience, guidance and kind support. He
also has inspired and encouraged me to work for power distribution for smart grid
project which I gained many invaluable experiences. I believe that my experience
working under him will help me to handle problems in future.
My family, Zurowiyati, Fendy, Ary, Hafidz and Lita, Bani Fadhil and Bani Ahmad for
being very supportive and patience to walk along with me in my life journey. They are
my mood-booster whenever I get down facing problems in life.
My colleagues in SinBerBEST, Patricia, Komang Narendra, Irvan, and Guang Yu Jin,
who helped my early stage of research life. My project teammates, Dr. Chien Szu-
Cheng, Edwin Chan, Hoan Thong Nguyen, Sum Yee Loon, and Benjamin Chew, who
gave me fruitful discussions and insightful critics to get me better in research works.
Last but not least, it would not be delightful journey without my friends in Prapanca
433, Lima Sekawan, Psycho Spring, KUNTUM, FIM, IMAS, IAF Team 2013, Psycho
Spring, and TETI alumni who always give me support and make my life colourful. I
would thank them all for being my kind partner.
v
Table of Contents
Abstract .......................................................................................................................... iii
Acknowledgment ............................................................................................................ iv
Table of Contents ............................................................................................................ v
List of Figure ................................................................................................................. vii
List of Tables ................................................................................................................... x
1. Introduction .............................................................................................................. 1
1.1 Background and Motivation ............................................................................. 1
1.2 Objectives ......................................................................................................... 2
1.3 Organization of the thesis ................................................................................. 3
2. Literature Review ..................................................................................................... 4
2.1 Lighting Requirements ..................................................................................... 4
2.2 Light Emitting Diode (LED) Characteristics for Lighting System ................... 6
2.3 LED Driving methods ....................................................................................... 9
2.4 Harmonics of Power Converter ...................................................................... 13
2.5 Low Voltage and Extra Low Voltage DC for Building .................................. 18
2.6 Safety Issues in DC System ............................................................................ 22
2.7. Summary ............................................................................................................. 24
3. Retrofit of Lighting System ................................................................................... 25
3.1 LED Lamp Performance ................................................................................. 25
3.2 Summary ......................................................................................................... 32
4. ELVDC Evaluation ................................................................................................ 34
4.1 Topology of ELVDC Distribution System ..................................................... 34
4.2 Voltage Drop Evaluation ................................................................................ 36
4.3 Simulation for LED Lighting System Topologies .......................................... 44
A. AC System with Individual LED Driver ..................................................... 44
B. Unipolar System with 24Vdc Power Supply .............................................. 53
C. Bipolar System with Two-24Vdc on One-Neutral ...................................... 61
4.4 Economic Savings Evaluation ........................................................................ 67
4.4. Summary ............................................................................................................. 71
5. Conclusion and Future Work ................................................................................. 73
5.1 Conclusion ........................................................................................................... 73

vi
5.2 Recommendations for Future Work .................................................................... 74
References ..................................................................................................................... 75
APENDIX ...................................................................................................................... 78

vii
List of Figure
Figure 2-1. Forward Voltage Drop vs Current ................................................................ 7
Figure 2-2. LED's Symbol ............................................................................................... 7
Figure 2-3. LED's Equivalent Circuit .............................................................................. 7
Figure 2-4. LED's Lifetime Compared to Working Temperature (source:[14]) ............. 8
Figure 2-5. Typical Technology for LED Driver ............................................................ 9
Figure 2-6. Lifetime of Alumium Electrolytic Capacitor[19] ....................................... 10
Figure 2-7. External Reistor for LED ............................................................................ 11
Figure 2-8. Typical LED Driving Method with Current Control System ..................... 12
Figure 2-9. DCM Current Supply Waveform in Rectifier (source: [28]) ..................... 14
Figure 2-10. CCM Current Supply Waveform in Rectifier (source: [28]) .................... 15
Figure 2-11. Harmonic Component ............................................................................... 16
Figure 2-12. Boost Converter as Power Factor Corrector[29] ...................................... 16
Figure 2-13. Current in Supply Side After Using PFC[27] ........................................... 17
Figure 2-14. LV/ELVDC Configuration for Radial Topology[31] ............................... 20
Figure 2-15. LV/ELVDC Configuration for Loop/Ring Topology[31] ........................ 20
Figure 2-16. Migration of LVAC to LV/ELVDC Using Existing 4-Wire Conductors . 21
Figure 2-17. Zones of AC Current Effects (Left Hand to Feet at 15-100Hz)[38] ......... 22
Figure 2-18. Lumped Circuit for Human Body Model[38] ........................................... 23
Figure 2-19. Zones of DC Current Effects (Left Hand to Feet at 15-100Hz)[38] ......... 24
Figure 3-1. Typical Circuit of LED Strip ...................................................................... 25
Figure 3-2. V-I Curves of LED Strip ............................................................................. 26
Figure 3-3. Lighting Test Room .................................................................................... 27
Figure 3-4. Measurement Position ................................................................................ 28
Figure 3-5. LED Strip (left), Parallel LED (middle), and Circular LED (right) ........... 30
Figure 3-6. Solid Colour Lamp Cover ........................................................................... 31
Figure 3-7. Clear-Matte Cover ...................................................................................... 31
Figure 3-8. LED Lamp with 120deg Angle ................................................................... 32
Figure 3-9. I-V Curve of Osram LED ........................................................................... 33
Figure 4-1. Topology of AC system with CFL ............................................................. 35
Figure 4-2. Topology of AC system with LED Lamp ................................................... 35
Figure 4-3. Topology of DC System with DC/DC Driver for LED Lamp .................... 36
Figure 4-4. Topology of Driverless DC System for LED Lamp ................................... 36

viii
Figure 4-5. Top View of Electrical Installation System ................................................ 37
Figure 4-6. Side View of Electrical installation System ............................................... 38
Figure 4-7. Reconfiguration of Existing Wiring System ............................................... 39
Figure 4-8. Reconfiguration Effect of Wiring System .................................................. 39
Figure 4-9. Topology of AC System with Individual LED Driver ............................... 44
Figure 4-10. Simulation Result of "Current Vs Time Characteristic of LED” ............. 45
Figure 4-11. LED Driver for Each Lamp in AC System ............................................... 45
Figure 4-12. Simulation of LED Driver for Each Lamp in MATLAB ......................... 46
Figure 4-13. Rectified Wave in LED Driver Model ...................................................... 47
Figure 4-14. Output of Cuk Converter for LED Lamp ................................................. 47
Figure 4-15. Output Current from Power Supply and Harmonics Level of the Current
....................................................................................................................................... 48
Figure 4-16. Filter at Supply Side ................................................................................. 49
Figure 4-17. Harmonic Component After Using Filter ................................................. 49
Figure 4-18. Current Waveform in Supply Side after Placing Filter ............................ 50
Figure 4-19. Load Voltage Level in AC with Individual LED Driver .......................... 51
Figure 4-20. Electric Shock in AC System with Individual LED Driver ...................... 52
Figure 4-21. Fault Current on Human Body Effect in AC System ............................... 53
Figure 4-22. Unipolar 24V Driverless Topology .......................................................... 54
Figure 4-23. Equivalent Circuit of ELVDC .................................................................. 55
Figure 4-24. LED Circuit Treated as Load on Main Trunk .......................................... 56
Figure 4-25. Unipolar ELVDC Using Flyback Converter ............................................ 57
Figure 4-26. Voltage Drop Evaluation of Unipolar System .......................................... 58
Figure 4-27. Load Voltage Level in Unipolar System .................................................. 59
Figure 4-28. Electric Shock in Unipolar ELVDC System with Scheme A and B. ...... 60
Figure 4-29. Fault Current on Human Body Effect in Unipolar DC System ................ 61
Figure 4-30. Bipolar Topology for Driving LED Lamps .............................................. 62
Figure 4-31. Bipolar System Using Flyback Converter and Diode Clamping .............. 62
Figure 4-32. Load Voltage Level in Bipolar System .................................................... 63
Figure 4-33. Current Flowing Through Ground Cable ................................................. 63
Figure 4-34. Voltage Drop Evaluation of Bipolar Topology ........................................ 64
Figure 4-35. Electric Shock in Unipolar ELVDC System with Scheme A , B and C . 65
Figure 4-36. Fault Current on Human Body Effect in Unipolar DC System ................ 66
ix
Figure A-1. Estimated Capacitor and Series Resistance Value for Certain Load
Resistance and Ripple Voltage Value [50] .................................................................... 83
x
List of Tables
Table 2-1. Standard for Common Area Lighting System ................................................ 5
Table 2-2. Voltage Level Range .................................................................................... 18
Table 3-1. Illuminance Level on Ground of LED Strip ................................................ 29
Table 3-2. Illuminance Level at 1m of LED Strip ......................................................... 29
Table 3-3. Comparison of LED Performance for Different Shape ............................... 30
Table 3-4. Diffuser Effect .............................................................................................. 32
Table 3-5. Higher Efficacy LED Lamp Performance ................................................... 33
Table 4-2. Fault Current for AC System with Individual Driver .................................. 53
Table 4-3. Electric Shock Performance in Unipolar ELVDC-24V ............................... 61
Table 4-4. Electric Shock Performance in Bipolar ELVDC-24V ................................. 66
Table 4-5. Lamp’s Performane Comparison ................................................................. 67
Table 4-6. Payback Period for Different Lighting Topologies ...................................... 69
Table 4-7. NPV Calculation for Different Lighting Topologies ................................... 70
Table 4-8. Summary of Topology Comparison for LED Lighting System ................... 71
Table A. 1. Power Consumption of CFL Lighting System Using AC System ............. 78
Table A. 2. Power Consumption of AC System with LED Driver ............................... 79
Table A. 3. Power Consumption of LED Lighting System in Unipolar ELVDC ......... 80
Table A. 4. Power Consumption of LED Lighting System in Bipolar ELVDC ........... 81
1
Chapter 1
1. Introduction
1.1 Background and Motivation
Global consumption of energy is continuously increasing due to the growth of
population [1]. According to Singapore Energy Market Authority, the consumption of
electricity for buildings and household use was 6,560 GWh or 15.7% of overall energy
consumption in Singapore. In other hand, the energy consumption of lighting sector
contributed to 20.9% of total household electricity consumption[2]. Since in 2015,
more than 80% Singapore’s resident population lived in flats provided by the Housing
& Development Board (HDB), which is a public housing government and a lawful
board under the Ministry of National Development of Singapore [3]. Most of
Singapore’s residents live in public housing provided by HDB, termed HDB flats.
HDB flats buildings are high-rise buildings which has several blocks in an area. Each
HDB flats blocks has common area intended to support social interaction. The
common areas of HDB flats usually consist of corridors, staircases and a void deck.
The void deck is usually located on ground floor which provide commodious space for
communal activities such as bazaars, funerals and weddings. Several staircases also
exists in a HDB flats block to accommodate people who live in high floor sections of
the building. In each floor, corridors exist mainly to assist navigation to flat rooms. We
proposed system that would be applied on HDB flats common area because it is
always found in HDB flats and also the area that is mostly used by public. As it is
dedicated for public, by considering HDB flats as a subject of research, it will yield
more impact on the society. Reducing household’s energy consumption, especially
from HDB flats, is believed to have major impact on total energy saving. In addition,
development of smart building that consumes electrical energy efficiently is
substantial to be applied.
The concept of smart building has been proposed more than a decade ago [4] as the
integration of efficient energy consumption and practicality. Smart building mainly
manages AC system, lamp and IT loads in an integrated system to be dynamically
changing as the needs. The advancement of LED lamp technology and the increasing

2
demand of IT technologies in the smart building promote improvement in the design
of energy distribution in smart building. Smart building is designed to be more
efficient and intelligent while using many appliances in building. In this strategy,
smart building applies DC grid because it can improve the quality of power
distribution, lower operating cost, and lower investment cost compared to AC system
[5]. In DC grid system, voltage level is cascaded into 2 level grids. Firstly, 380 VDC
grid is aimed for the power distribution network in building. Secondly, 24 VDC grid
that is recognized as extra-low voltage DC (ELVDC) grid is aimed for lighting and
Information Technology (IT) loads. For the lighting system, smart building applies
dimmable solid state lamps (SSL) for lighting system, not only because dimmable SSL
has been available in the market widely, but also using dimmable SSL may reduce
energy consumption by 44.3% in lighting system [6]. However, AC distribution
system needs additional interface device, such as rectifier, to supply these loads. In the
other hand, DC distribution system may supply the load directly whenever the load
voltage as required matches to the voltage of DC supply. Therefore in order to
improve electrical system’s efficiency, we compared AC distribution system to DC
distribution system. Moreover, driverless system could extend the lifetime of the
lighting system. It was because our system removed the need for driver which has
shorter life time than SSL. In this study, we also designed our novel suitable power
distribution topology to support the system. Our study mainly impacts on smart
building development and may contribute to decrease global energy consumption.
1.2 Objectives
This thesis discusses about the processes of implementing Extra-Low Voltage DC
distribution system for common area lighting, especially in HDB flats. There are two
main goals of this research: to design lighting system for common area; to implement
LED lighting system powered by ELVDC. The specific objectives of our study
include:
1. To design lighting system for HDB flats’ common area. A typical HDB flat’s
block has some area that is reserved for public activities. The activities could
be for long time or temporary. Lighting design can be varied due to the period
of the typical activity in the specific types of area. In this research, the most
suitable and efficient lighting system for common area in HDB flats will be
developed.
3
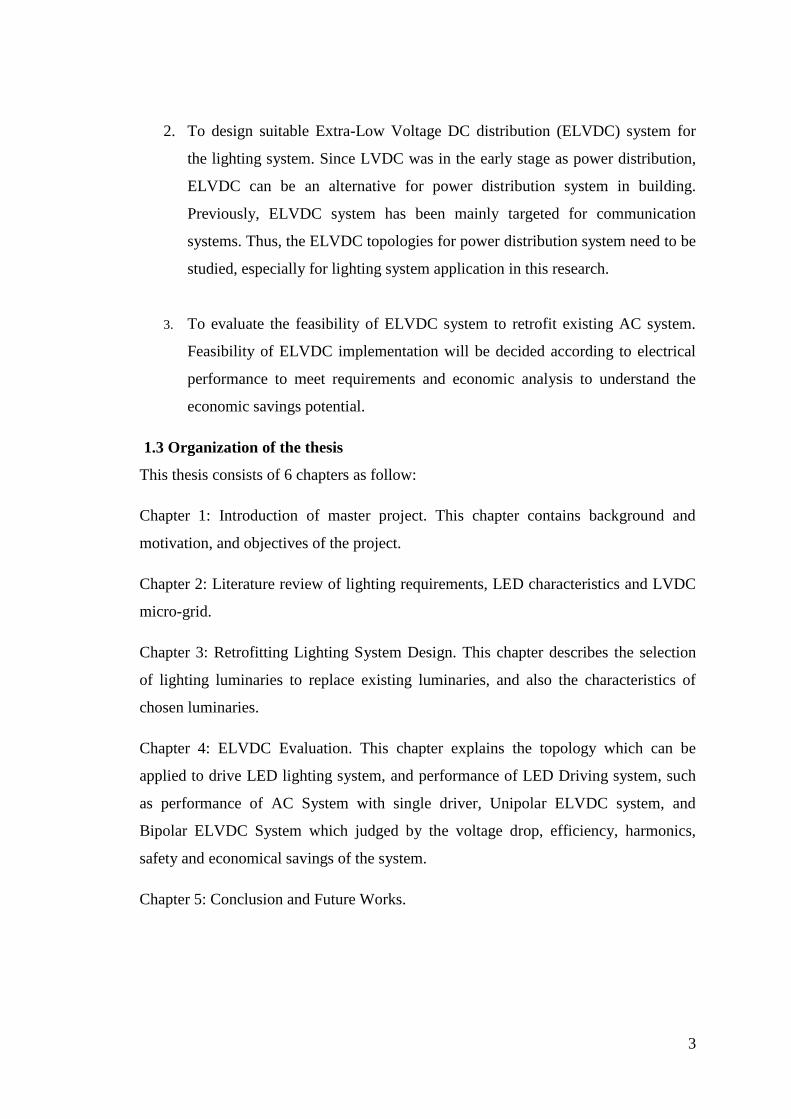
2. To design suitable Extra-Low Voltage DC distribution (ELVDC) system for
the lighting system. Since LVDC was in the early stage as power distribution,
ELVDC can be an alternative for power distribution system in building.
Previously, ELVDC system has been mainly targeted for communication
systems. Thus, the ELVDC topologies for power distribution system need to be
studied, especially for lighting system application in this research.
3. To evaluate the feasibility of ELVDC system to retrofit existing AC system.
Feasibility of ELVDC implementation will be decided according to electrical
performance to meet requirements and economic analysis to understand the
economic savings potential.
1.3 Organization of the thesis
This thesis consists of 6 chapters as follow:
Chapter 1: Introduction of master project. This chapter contains background and
motivation, and objectives of the project.
Chapter 2: Literature review of lighting requirements, LED characteristics and LVDC
micro-grid.
Chapter 3: Retrofitting Lighting System Design. This chapter describes the selection
of lighting luminaries to replace existing luminaries, and also the characteristics of
chosen luminaries.
Chapter 4: ELVDC Evaluation. This chapter explains the topology which can be
applied to drive LED lighting system, and performance of LED Driving system, such
as performance of AC System with single driver, Unipolar ELVDC system, and
Bipolar ELVDC System which judged by the voltage drop, efficiency, harmonics,
safety and economical savings of the system.
Chapter 5: Conclusion and Future Works.
4
Chapter 2
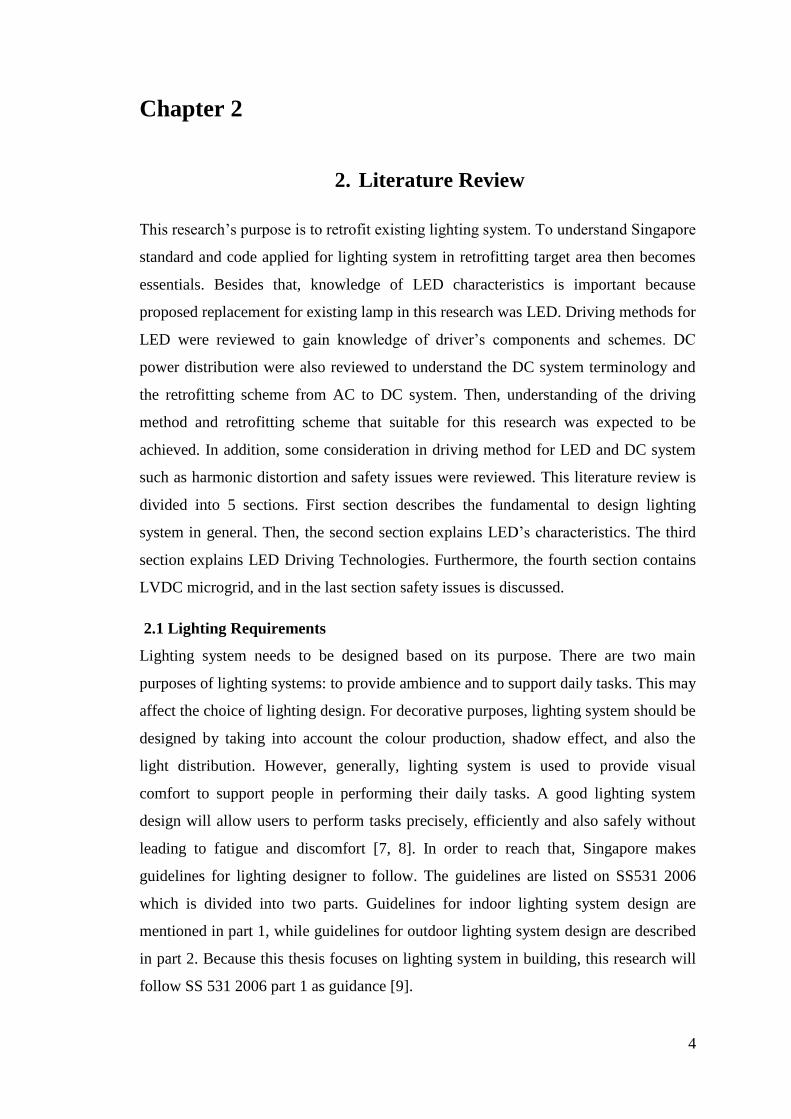
2. Literature Review
This research’s purpose is to retrofit existing lighting system. To understand Singapore
standard and code applied for lighting system in retrofitting target area then becomes
essentials. Besides that, knowledge of LED characteristics is important because
proposed replacement for existing lamp in this research was LED. Driving methods for
LED were reviewed to gain knowledge of driver’s components and schemes. DC
power distribution were also reviewed to understand the DC system terminology and
the retrofitting scheme from AC to DC system. Then, understanding of the driving
method and retrofitting scheme that suitable for this research was expected to be
achieved. In addition, some consideration in driving method for LED and DC system
such as harmonic distortion and safety issues were reviewed. This literature review is
divided into 5 sections. First section describes the fundamental to design lighting
system in general. Then, the second section explains LED’s characteristics. The third
section explains LED Driving Technologies. Furthermore, the fourth section contains
LVDC microgrid, and in the last section safety issues is discussed.
2.1 Lighting Requirements
Lighting system needs to be designed based on its purpose. There are two main
purposes of lighting systems: to provide ambience and to support daily tasks. This may
affect the choice of lighting design. For decorative purposes, lighting system should be
designed by taking into account the colour production, shadow effect, and also the
light distribution. However, generally, lighting system is used to provide visual
comfort to support people in performing their daily tasks. A good lighting system
design will allow users to perform tasks precisely, efficiently and also safely without
leading to fatigue and discomfort [7, 8]. In order to reach that, Singapore makes
guidelines for lighting designer to follow. The guidelines are listed on SS531 2006
which is divided into two parts. Guidelines for indoor lighting system design are
mentioned in part 1, while guidelines for outdoor lighting system design are described
in part 2. Because this thesis focuses on lighting system in building, this research will
follow SS 531 2006 part 1 as guidance [9].
5
Lighting system design needs to consider the number of luminaries, illuminance level,
colour rendering index, and also uniformity of the light distribution for the designed
area. Moreover, different room type needs different requirements to fulfil. Staircase
and corridor, based on SS531 2006, follow criteria as shown in Table 2-1. Table 2-1
shows that maintained lux for circulation area is 100 lux and for stairs are 150 lux. In
this research the staircase is for circulation area. Thus, the minimum maintained
illuminance level is adjusted to be 125 lux [10].
In lighting system design, there is Color Rendering Index (CRI) to indicate color
accuracy of objects under certain light source. CRI value is from 0 to 100 that
indicates the comparison between object’s color under tested light source to object’s
color under natural light source (sunlight). The purpose of color rendering index is
mainly to maintain the human visual comfort, to see color properly, for example
human skin colour needs to be maintained to look normal. CRI value is important for
the light source selection to comply lighting regulation. In Singapore Standard, CRI
for building’s common areas are 40. It means the color accuracy in those common
areas is not significant. So that, light source color in this research can use cold to warm
color with CRI level more than 40.
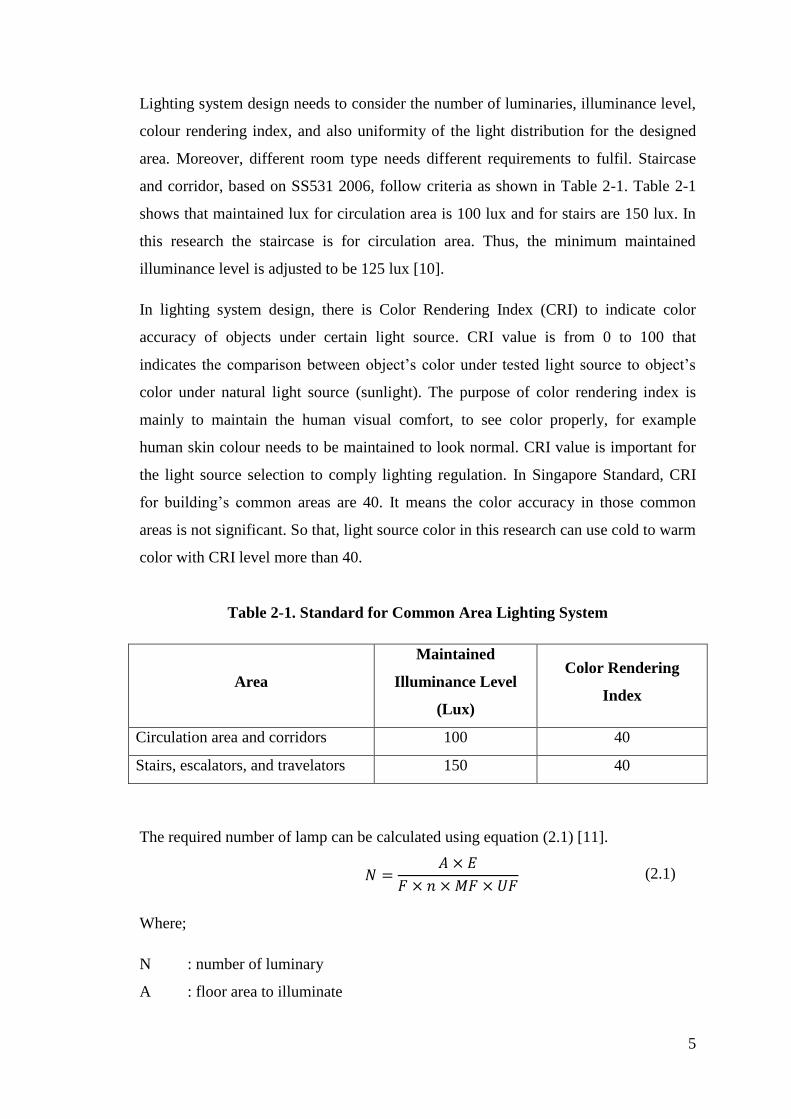
Table 2-1. Standard for Common Area Lighting System
Area
Maintained
Illuminance Level
(Lux)
Color Rendering
Index
Circulation area and corridors 100 40
Stairs, escalators, and travelators 150 40
The required number of lamp can be calculated using equation (2.1) [11].
(2.1)
Where;
N : number of luminary
A : floor area to illuminate
6
E : lux to be maintained
F : initial lamp lumen
n : number of lamp in a luminary
MF : maintenance factor
UF : utilization factor
In order to minimize the power consumption, minimum required number of luminary
need to be achieved. As illustration, to minimize power consumption in a corridors
area of 2.5x2.5 m2, the luminary is set to use one lamp. For staircase with maintenance
factor and utilization factor 1, the number of luminary can be calculated below:
From the calculation above, for stated staircase which is designed to use single lamp, a
lamp is needed to produce at least 781.25 lumens to meet the desired maintained lux
value at 125 lux. Thus, the desired maintained lux value has higher than the minimum
lux value required for corridors area at 100 lux.
2.2 Light Emitting Diode (LED) Characteristics for Lighting System
LED is a solid state device which is able to emit light when activated. LED has
operating characteristics like zener diode with series resistance, as seen in Figure 2-3.
It will operate after applied voltage on LED surpassing LED’s forward voltage (Vf),
and also has breakdown voltage which is the limit of the maximum voltage of the LED
can handle when it is placed in the opposite polarity. [12]
LED works as luminary because of its ability to emit light. This emitted light is caused
by photons production as the result of moving electron due to potential difference
across P-N Junction [13]. A photon which produces light will be emitted when an
electron loses energy and falls back into the valence band. The potential difference
across P-N Junction also affects the wavelength of the light production. Thus, voltage
difference across P-N Junction (voltage drop of LED) will produce different colour of
LED. Red colour is at the lowest voltage drop, while blue colour requires highest
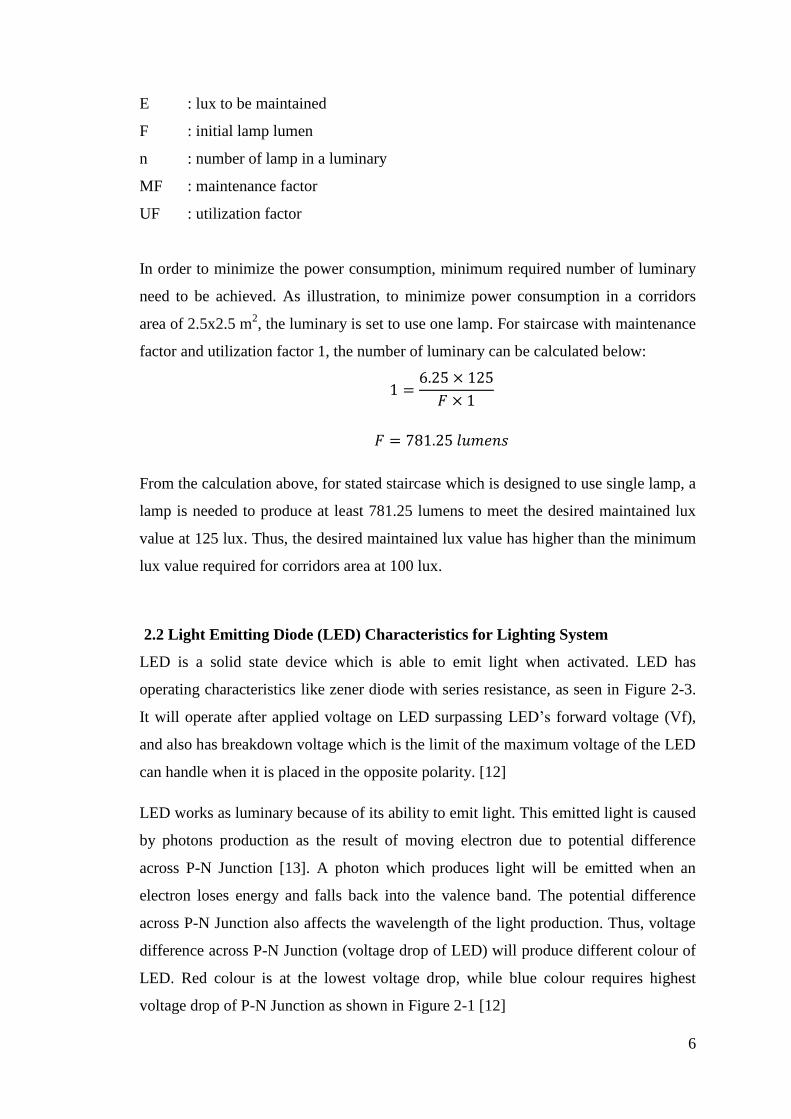
voltage drop of P-N Junction as shown in Figure 2-1 [12]
7
Figure 2-1. Forward Voltage Drop vs Current
Figure 2-1 shows that LED has differential resistance characteristic. It means that
current flowing through LED will change after forward voltage and following equation
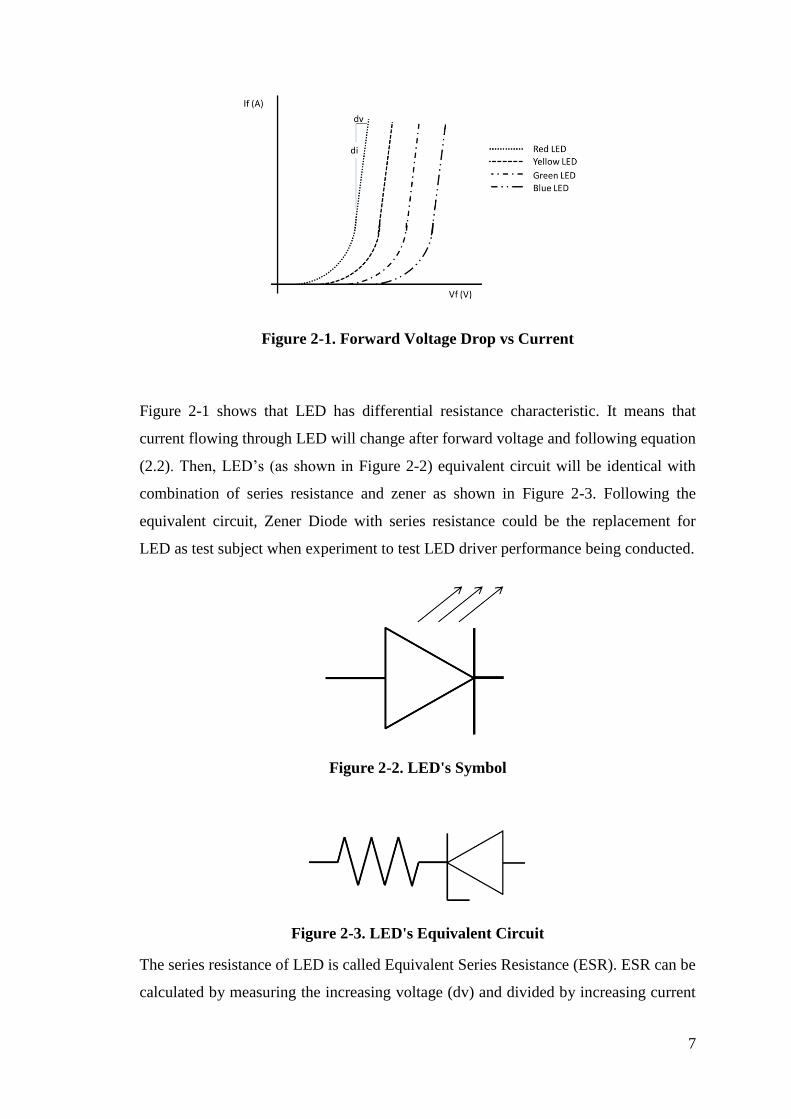
(2.2). Then, LED’s (as shown in Figure 2-2) equivalent circuit will be identical with
combination of series resistance and zener as shown in Figure 2-3. Following the
equivalent circuit, Zener Diode with series resistance could be the replacement for
LED as test subject when experiment to test LED driver performance being conducted.
Figure 2-2. LED's Symbol
Figure 2-3. LED's Equivalent Circuit
The series resistance of LED is called Equivalent Series Resistance (ESR). ESR can be
calculated by measuring the increasing voltage (dv) and divided by increasing current

8
(di) in the linear operating region of LED. This resistance value of ESR is differential
resistance type, as its value constant following dv and di of LED operation value. The
equation to calculate ESR is described in equation (2.2).
(2.2)
In implementation, LED for lighting system has been studied in past years. It was able
to produce high lumen, low power consumption and fast response to light up. There
are many types of material to make LED. Each material has its own characteristics and
operating performance. Gallium Arsenide (GaAs) could produce light with wavelength
about 905nm. And also, it was the first material to produce LEDs by applying P-N
Junction material. This LED emits red colour light.
The limitation of using LED was its narrow light production and decreasing life time
due to operating temperature[14]. As shown in Figure 2-4 LED will get shorter life
time when its temperature is higher. Then the T-junction temperature of LED must be
maintained to be at slow operating temperature. Thus, typically LED needs driver to
control current input by using current control driver.
Figure 2-4. LED's Lifetime Compared to Working Temperature (source:[14])

9
2.3 LED Driving methods
Typically LED driver for LED consists of AC/DC Converter (rectifier) if the source is
AC supply, boost PFC Converter, and Half Bridge LLC Resonant Converter or
DC/DC Converter[15, 16]. Besides that, LED Driver should employ Filter to reduce
harmonics of the system. Constant current driver controls current flowing through
LED lamp using feedback system in circuit. The strategies require switching system
with controller which will need more passive device to couple the output as shown in
Figure 2-5.
Some designs tried to simplify the drivers to reduce the passive components or
replacing electrolytic capacitor in the circuit to improve efficiency and lifetime of the
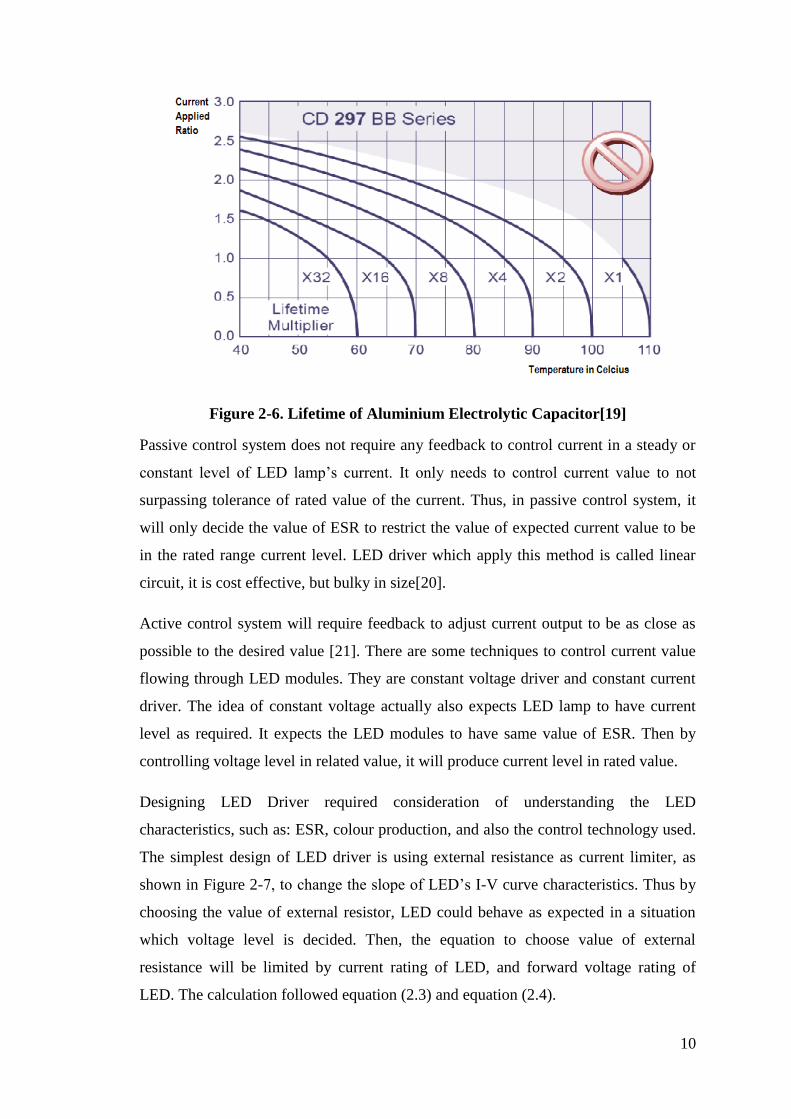
driver[17, 18]. Electrolytic capacitor was removed to improve driver’s lifetime as it
has 5000h which is much lower than LED’s lifetime [17]. Moreover, electrolytic
capacitor is better to use in lower temperature and current condition as shown in
Figure 2-5 [19]. Figure - shows that with 105 C rated capacitor, if it was operated at
75⁰C and at rated current then the capacitor would have 8 times longer of lifetime.
Figure 2-5. Typical Technology for LED Driver
As the lumen output enhancement of LED lamp is related accordingly to the increase
of current level of LED, the basic ideas to control LED lamp typically are controlling
current flowing through LED modules. LED current’s value depends on the voltage
level and ESR value of LED. Thus, there are two ways to control LED lamp. They are
passive control system and active control system.
10
Figure 2-6. Lifetime of Aluminium Electrolytic Capacitor[19]
Passive control system does not require any feedback to control current in a steady or
constant level of LED lamp’s current. It only needs to control current value to not
surpassing tolerance of rated value of the current. Thus, in passive control system, it
will only decide the value of ESR to restrict the value of expected current value to be
in the rated range current level. LED driver which apply this method is called linear
circuit, it is cost effective, but bulky in size[20].
Active control system will require feedback to adjust current output to be as close as
possible to the desired value [21]. There are some techniques to control current value
flowing through LED modules. They are constant voltage driver and constant current
driver. The idea of constant voltage actually also expects LED lamp to have current
level as required. It expects the LED modules to have same value of ESR. Then by
controlling voltage level in related value, it will produce current level in rated value.
Designing LED Driver required consideration of understanding the LED
characteristics, such as: ESR, colour production, and also the control technology used.
The simplest design of LED driver is using external resistance as current limiter, as
shown in Figure 2-7, to change the slope of LED’s I-V curve characteristics. Thus by
choosing the value of external resistor, LED could behave as expected in a situation
which voltage level is decided. Then, the equation to choose value of external
resistance will be limited by current rating of LED, and forward voltage rating of
LED. The calculation followed equation (2.3) and equation (2.4).

11
Figure 2-7. External Reistor for LED
(2.3)
(2.4)
For example, if current rating (ILED) value of LED is designed to be 50mA, Vled of
3.8V and operating power supply with voltage level (Vs) rating of 5V. Besides that,
ESR of LED could be found by testing the LED modules for the particular LED. In the
end, the value of external resistor can be chosen by following the nearest value from
the calculation as follow.
(2.5)
Then, by assuming the tolerance of voltage supply (Vs) by 10%, maximum and
minimum value of current flowing through LED can be found using equation (2.5).
(( ) )
(( ) )

12
As current maximum exceeded the rating, external resistance had to be modified to
limit the current to be at rated current value as maximum value. Then, external resistor
was chosen based on calculation below.
After modifying external resistor value, minimum and maximum current flowing
through LED followed calculation below.
(( ) )
(( ) )
The most common method to drive LED lamp is using active control system. This
method could operate LED lamp as designers want. As LED’s brightness and lifetime
are correlated to current value flowing through the modules, engineers designed LED
driver focusing on the current value of the LED to set the brightness and also safety
concern of LED. Thus, although there are some constant voltage drivers available in
market, the most common drivers are constant current based technology. The design of
current control for the driver followed Figure 2-8[22-25].
Figure 2-8. Typical LED Driving Method with Current Control System
13
2.4 Harmonics of Power Converter
Power Converter normally uses as the driver for Compact Fluorescent Lamp (CFL)
modern lamp technology. Then, as LED popularity increasing, driver for LED also
used to drive LED which compatible with ballast. People normally install LED for the
more efficient device, but by installing with ballast it means that maximum efficiency
of the system was not achieved. Besides that, the harmonic from the driver and ballast
can cause the power loss.
Harmonics of the system is calculated by using Fast Fourier Transform. This method
transforms time frame signal to frequency frame. The basic idea of using FFT is that
one signal is composed by many waves with fundamental frequency and the
multiplication of fundamental frequency with specific amplitude. Therefore, one signal
will be modelled using Fast Fourier Transform equation, as stated in equation (2.6).
[26, 27]
( ) ∑ ( )
(2.6)
( )
∑{ ( ) ( )}
(2.7)
Where
is the average value, and and is the magnitude of n harmonics
following equation (2.8) and equation (2.9).
For
h=0, ,4…
∫ ( ) ( )
(2.8)
For
h=1,3,5,…
∫ ( ) ( )
(2.9)
In DC system, especially for lighting system, loads are using DC voltage which
requires AC/DC Converter. This converter could produce harmonics, as the harmonics
level will be affected by the AC/DC current-modes. There are two modes in rectifying,
Continuous-Current Modes (CCM) and Discontinuous-Current Mode (DCM).
14
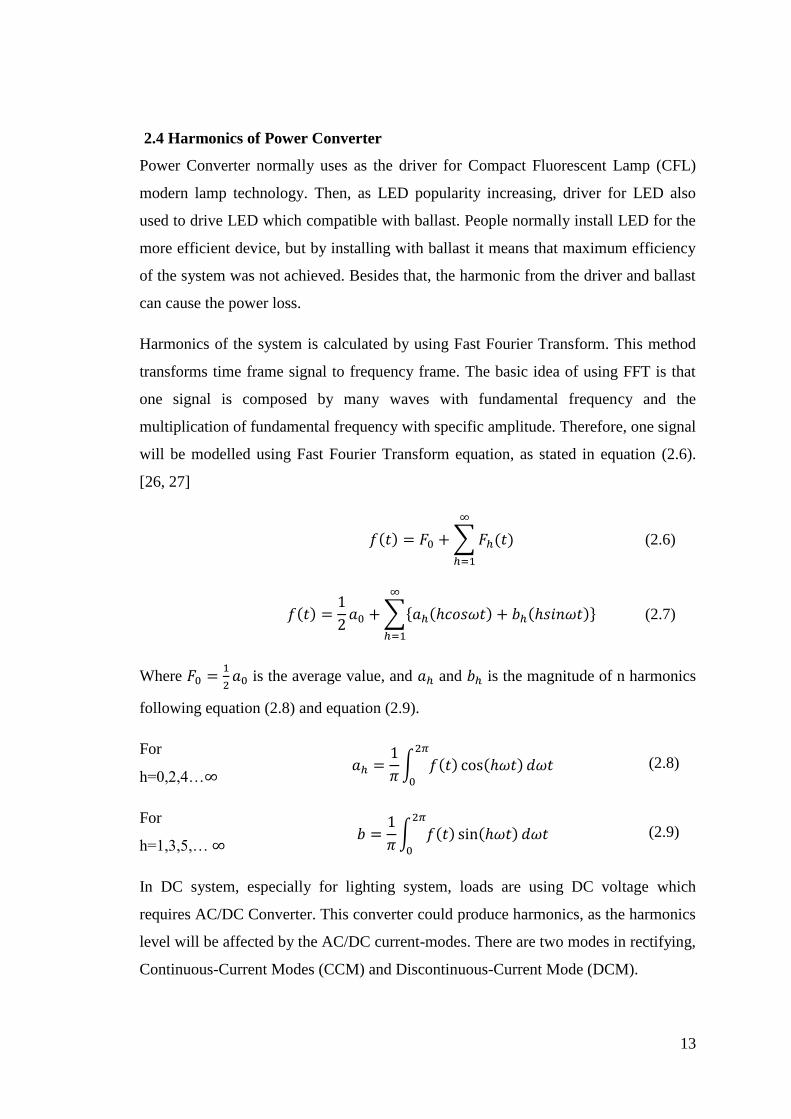
Discontinuous-Current Modes happens when driver use too small inductance of
inductor which will make the current wave form as shown in Figure 2-9.
Figure 2-9. DCM Current Supply Waveform in Rectifier (source: [28])
In Continuous-Current Modes (CCM), for full bridge diode will make typical current
wave form as shown in Figure 2-10. It shows that the rectifier uses high inductance
inductor is able to make constant current waveform in supply side.
If power supply used 220Vrms sinus wave input, with 50Hz frequency, and L is
infinite. This rectifier will be in CCM, and then the harmonics component will be
generated by 3, 5, 7, and odd harmonics. Then, THD of the system will be 44.5% as
calculated below.
For h=3
∫ ( ) ( )
( ) √ ( )
√
( )
Then, the other odd harmonic component was calculated using equation (2.8) so that it
produced Figure 2-11.
Total Harmonic Distortion (THD) of the system was calculated using equation (2.10).
15
√∑
(2.10)
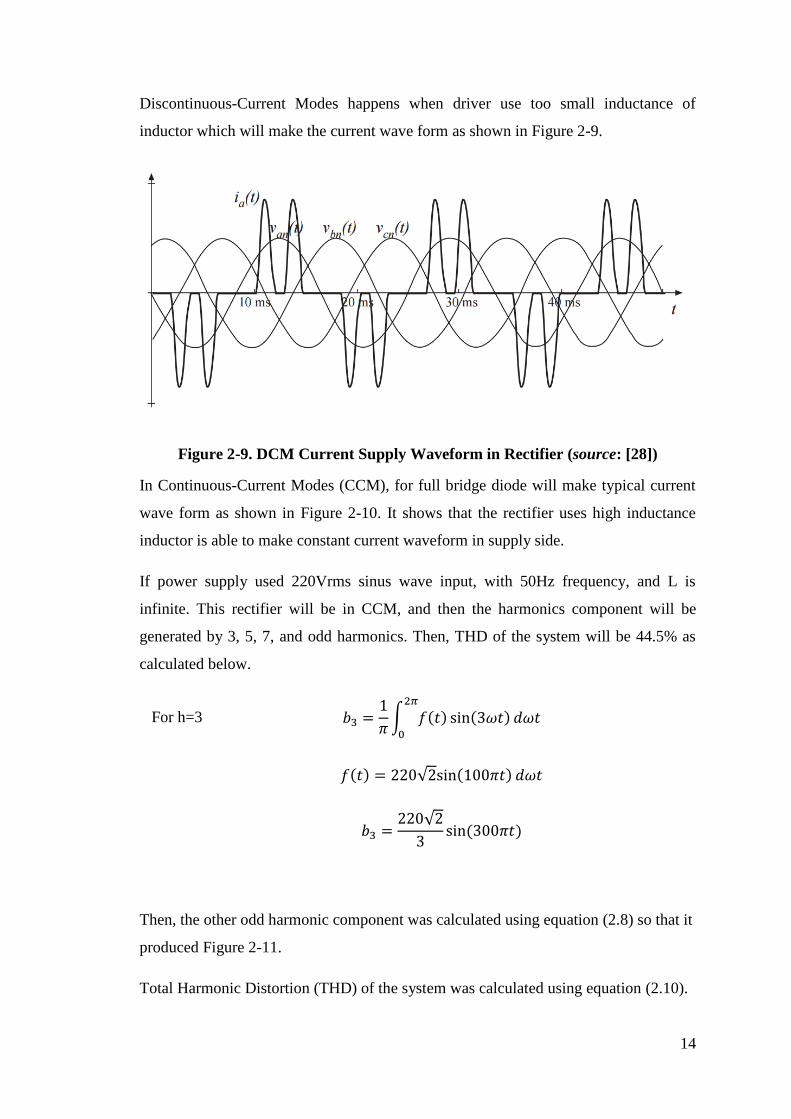
Equation (2.10) tells that square of each current harmonic magnitude will be added to
be compared to fundamental current. As only the odd harmonics appear on the system,
THD of the rectifier with CCM was 44.5%. In this example as shown in Figure 2-11,
only harmonic 3,5,7,9,11, and 13 appeared, then the calculation as follows;
h=3,5,
7,9 √
∑
√
√( )
( )
( )
( )
( )
( )
Figure 2-10. CCM Current Supply Waveform in Rectifier (source: [28])
16
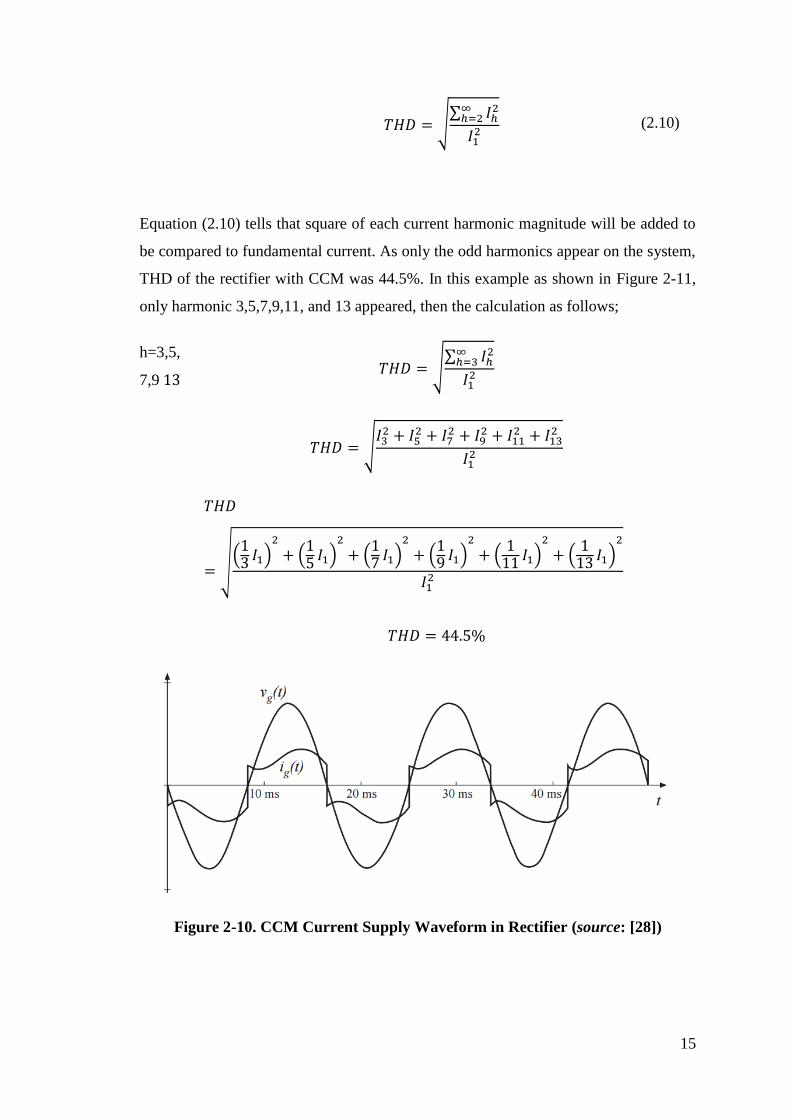
Figure 2-11. Harmonic Component
There are some methods to eliminate harmonics component. As shown in Figure 2-11,
the biggest magnitude of the harmonics is the 3rd
harmonic, as the higher harmonic
number will be less in magnitude. Thus, most methods will focus on the lower number
harmonic to improve THD significantly.
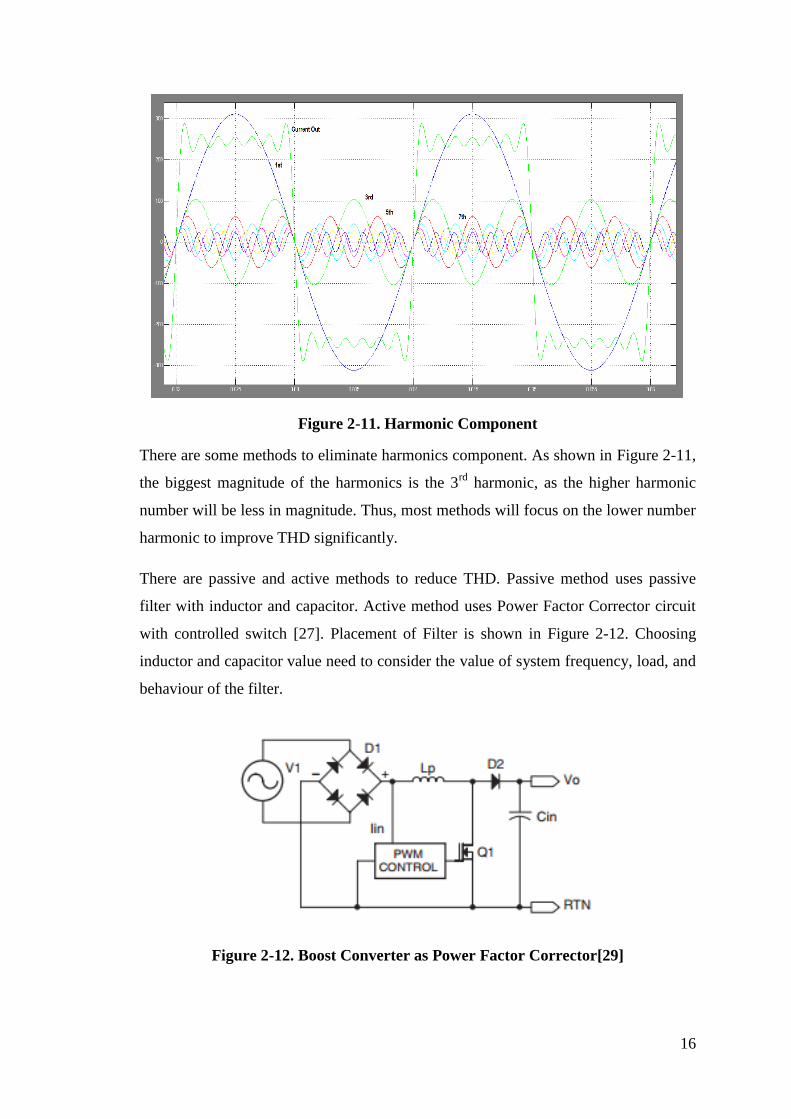
There are passive and active methods to reduce THD. Passive method uses passive
filter with inductor and capacitor. Active method uses Power Factor Corrector circuit
with controlled switch [27]. Placement of Filter is shown in Figure 2-12. Choosing
inductor and capacitor value need to consider the value of system frequency, load, and
behaviour of the filter.
Figure 2-12. Boost Converter as Power Factor Corrector[29]

17
Figure 2-13. Current in Supply Side After Using PFC[27]
PFC Design is typically based on boost converter with Cin will be used to reduce
ripple voltage output. Then, Lp is chosen to make CCM or DCM mode of current
input in supply side. In ideal case, switching frequency will be set as infinite then Lp
could be negligibly small [27]. Then PFC is operated by shaping the current in supply
side to be as close as fundamental current as shown in Figure 2-13.
Where fs is frequency of the switch, and then operation mode of boost converter will
follow [30].
In CCM operation,
(2.11)
With switching frequency fs as describe in equation (2.12).
(2.12)
So that, during on and off period of the switch, ton followed equation (2.13) and toff
followed equation (2.14)
(2.13)
(2.14)

18
Switching then followed equation (2.15).
( )
(2.15)
Thus I ripple could be calculated using equation (2.16).
( )
(2.16)
Where;
Vd : output voltage of PFC (Boost Converter) (V)
vs : voltage input from supply (V)
Irip : ripple current in supply side (A)
Fs : switching frequency for PFC (Hz)
Lp : the inductor for PFC (H)
2.5 Low Voltage and Extra Low Voltage DC for Building
As DC power distribution system becomes more prospective over AC power
distribution system, there have been some studies that show benefit of using DC
system over AC system. The terms of High Voltage DC (HVDC), Low Voltage DC
(LVDC), and Extra Low Voltage DC (ELVDC) has been stated in BS 7671 and IET
Standard [31, 32]. As stated in the standard, the usage of HVDC, LVDC and ELVDC
is shown in Table 2-2.
Table 2-2. Voltage Level Range
Voltage Category
Voltage Range
AC System (V) DC System (V)
High Voltage >1000 >1500
Low Voltage 50-1000 120-1500
Extra Low Voltage 0-50 0-120
High Voltage DC was known to be used in transmission power system. Based on some
studies it was start to be cost effective for long transmission system (i.e >600km), as

19
benefit of lower power loss and power flow controllability would be able to achieve,
compared to DC system properties’ (i.e conversion device) costs [33]. But with current
technology, conversion device cost starts to be cheaper that increases feasibility of DC
system implementation.
Low Voltage DC (LVDC) has been commonly used for telecommunication cabling
system. Besides that, Power Line Cable (PLC) technology is operated in LVDC to be
an important part of SMART grid. It can be used to deliver power while delivering
signal for telecommunication. LVDC itself has many benefits compared to AC
especially on investment cost of the cable by using bipolar system and improvement of
the power quality of the system. Moreover, the implementation of Power over Ethernet
(PoE) cable to deliver cable for devices has been well established. Therefore, this
system is being the reference for the development of LVDC for power
distribution[34].
In the past few years, LVDC as power distribution system has been studied. Cable
performance employed in LVAC and LVDC system has been compared thoroughly.
From the works done by Borioli et. al cable in DC system can carry more power
compared to cable in AC system at the same voltage level. Using bipolar-3-wire
system could save more energy, by reducing losses in a cable [35]. These could be
some advantages of using DC system to deliver electricity.
Migration of LVAC to LVDC or even to lower voltage level as Extra Low Voltage DC
(ELVDC) System has been regulated by IET. This standard has confirmed that
migration from LVAC to LV and ELVDC is viable with some procedures considered.
The procedures before migration include [31]:
1. Equipotential bonding and the main earth conductor should be exist and
accurate;
2. Unsuitable loads for d.c. system need to be removed;
3. Existing conductors need to follow BS7671;
4. All installed protection measures need to be practicable;
5. Reviews and re-designs of the existing protection system need to be done to
support d.c. power distribution system;
6. Converted wiring need to be tested with accordance to BS 7671.

20
In Section 7 of the standard, for the migration the existing conductor from the existing
system (LVAC) was used. In unipolar system 2 conductors was used. In other case, 3
conductors will be used in bipolar system. And in both cases earthing cable should not
be used as power cable. In radial topology, LVDC and ELVDC can be installed
directly as seen in Figure 2-14. In other hand, in loop/ring topology, ring circuit
interruption need to be placed as shown in Figure 2-15. In the end, wiring mechanism
of these configurations will follow Figure 2-14 for radial topology and Figure for
loop/ring topology[31].
Figure 2-14. LV/ELVDC Configuration for Radial Topology[31]
Figure 2-15. LV/ELVDC Configuration for Loop/Ring Topology[31]
21
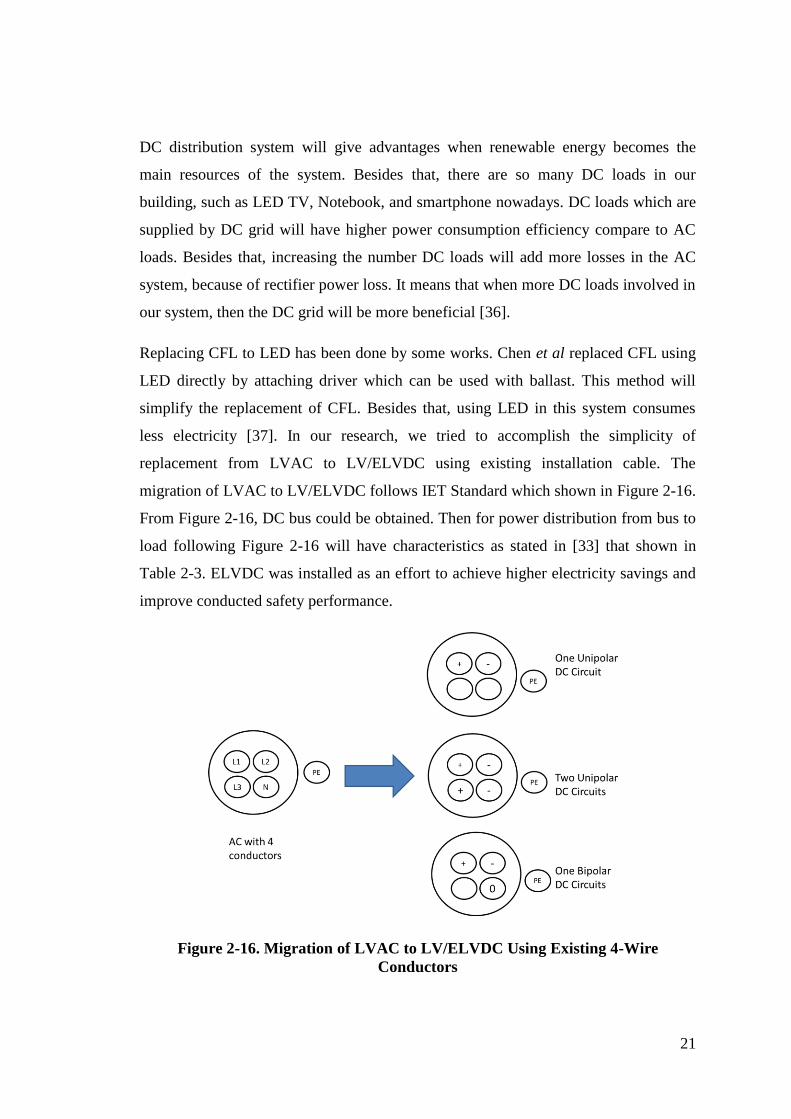
DC distribution system will give advantages when renewable energy becomes the
main resources of the system. Besides that, there are so many DC loads in our
building, such as LED TV, Notebook, and smartphone nowadays. DC loads which are
supplied by DC grid will have higher power consumption efficiency compare to AC
loads. Besides that, increasing the number DC loads will add more losses in the AC
system, because of rectifier power loss. It means that when more DC loads involved in
our system, then the DC grid will be more beneficial [36].
Replacing CFL to LED has been done by some works. Chen et al replaced CFL using
LED directly by attaching driver which can be used with ballast. This method will
simplify the replacement of CFL. Besides that, using LED in this system consumes
less electricity [37]. In our research, we tried to accomplish the simplicity of
replacement from LVAC to LV/ELVDC using existing installation cable. The
migration of LVAC to LV/ELVDC follows IET Standard which shown in Figure 2-16.
From Figure 2-16, DC bus could be obtained. Then for power distribution from bus to
load following Figure 2-16 will have characteristics as stated in [33] that shown in
Table 2-3. ELVDC was installed as an effort to achieve higher electricity savings and
improve conducted safety performance.
Figure 2-16. Migration of LVAC to LV/ELVDC Using Existing 4-Wire
Conductors
22
2.6 Safety Issues in DC System
One of the considerations using Extra Low Voltage DC is the safety concern. As
shown in Figure 2-17 and Figure 2-18, human will get different effect responding to
AC and DC electric shock. AC electric shocks with low frequency (from 15-100Hz)
are the most dangerous. It may cause Involuntary Muscular Contraction, and for the
worst scenario it may cause ventricular fibrillation which interrupts heart pumping
behaviour and leads to death [38].
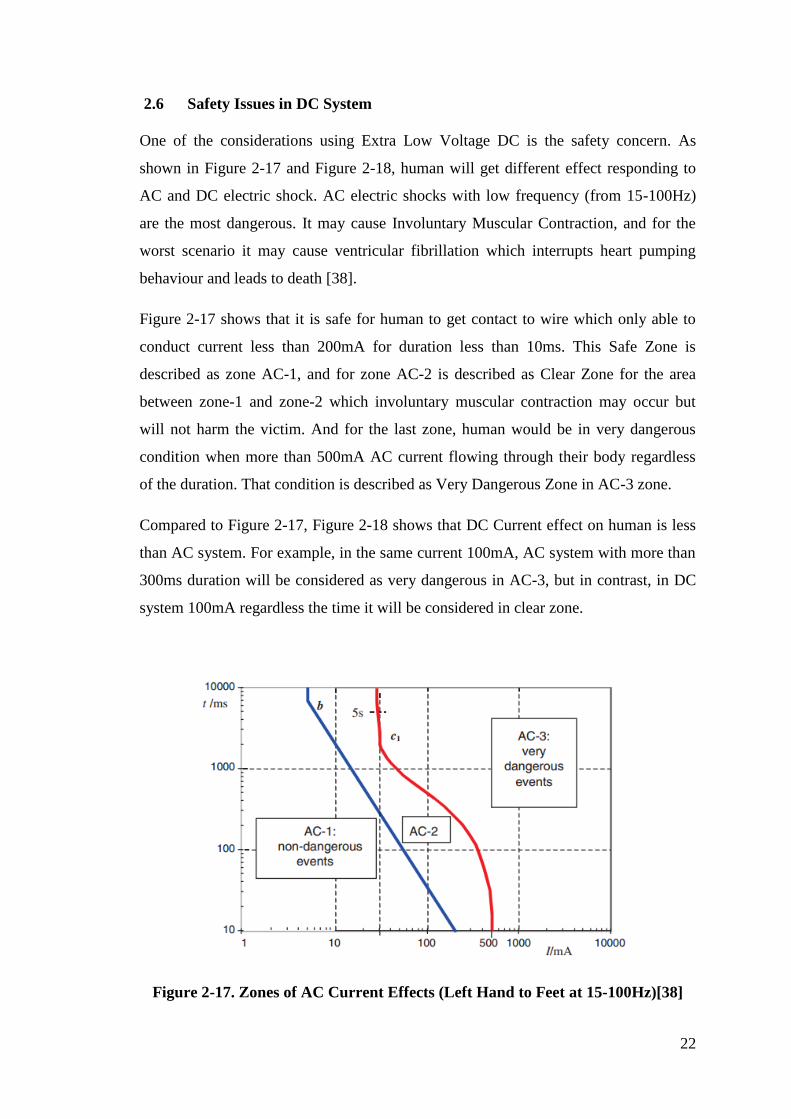
Figure 2-17 shows that it is safe for human to get contact to wire which only able to
conduct current less than 200mA for duration less than 10ms. This Safe Zone is
described as zone AC-1, and for zone AC-2 is described as Clear Zone for the area
between zone-1 and zone-2 which involuntary muscular contraction may occur but
will not harm the victim. And for the last zone, human would be in very dangerous
condition when more than 500mA AC current flowing through their body regardless
of the duration. That condition is described as Very Dangerous Zone in AC-3 zone.
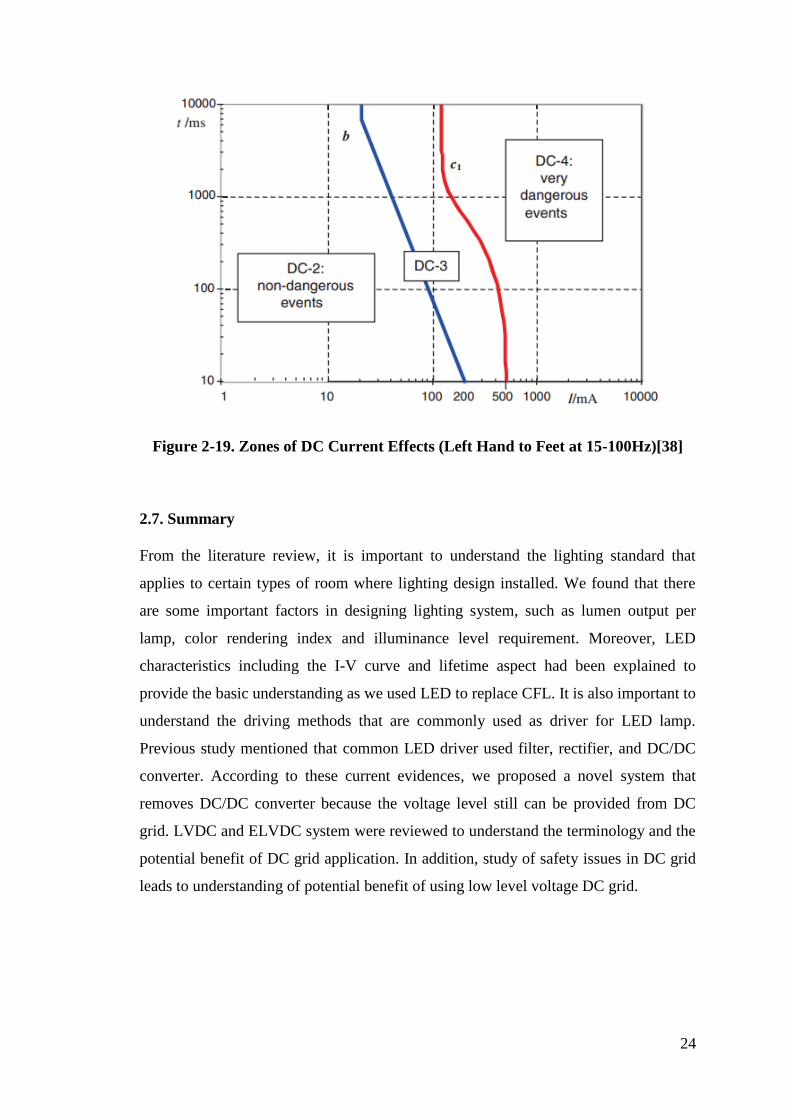
Compared to Figure 2-17, Figure 2-18 shows that DC Current effect on human is less
than AC system. For example, in the same current 100mA, AC system with more than
300ms duration will be considered as very dangerous in AC-3, but in contrast, in DC
system 100mA regardless the time it will be considered in clear zone.
Figure 2-17. Zones of AC Current Effects (Left Hand to Feet at 15-100Hz)[38]
23
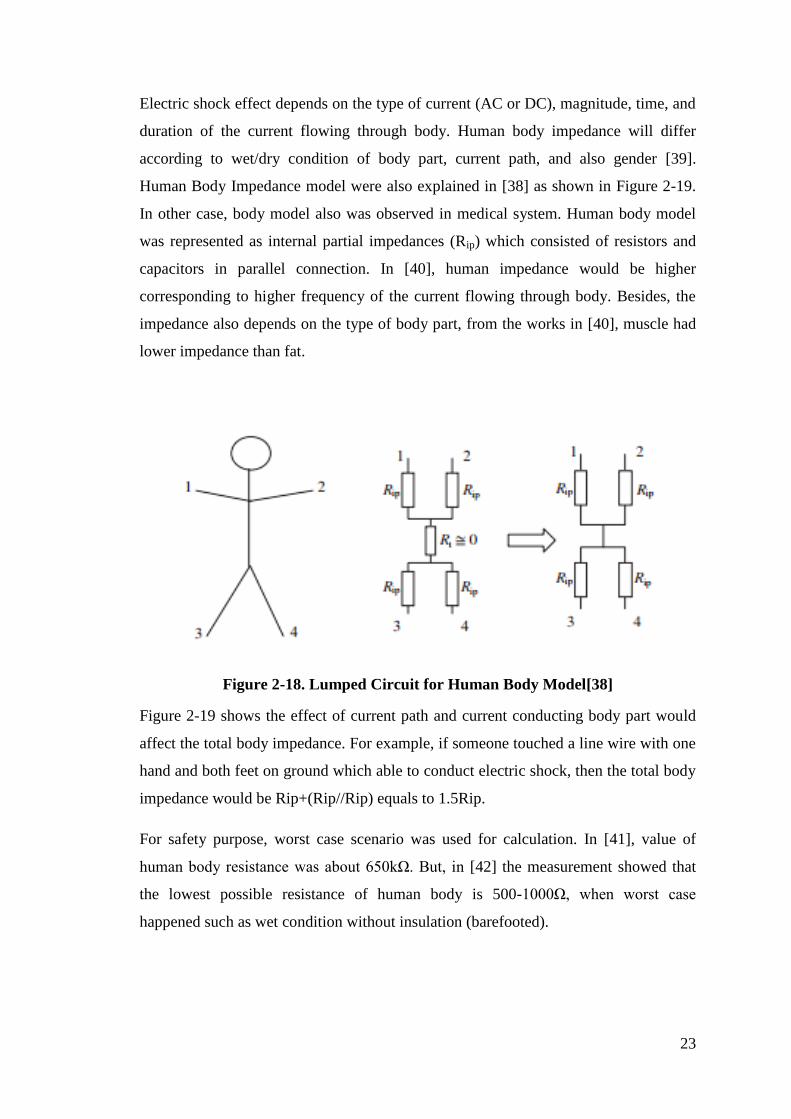
Electric shock effect depends on the type of current (AC or DC), magnitude, time, and
duration of the current flowing through body. Human body impedance will differ
according to wet/dry condition of body part, current path, and also gender [39].
Human Body Impedance model were also explained in [38] as shown in Figure 2-19.
In other case, body model also was observed in medical system. Human body model
was represented as internal partial impedances (Rip) which consisted of resistors and
capacitors in parallel connection. In [40], human impedance would be higher
corresponding to higher frequency of the current flowing through body. Besides, the
impedance also depends on the type of body part, from the works in [40], muscle had
lower impedance than fat.
Figure 2-18. Lumped Circuit for Human Body Model[38]
Figure 2-19 shows the effect of current path and current conducting body part would
affect the total body impedance. For example, if someone touched a line wire with one
hand and both feet on ground which able to conduct electric shock, then the total body
impedance would be Rip+(Rip//Rip) equals to 1.5Rip.
For safety purpose, worst case scenario was used for calculation. In [41], value of
human body resistance was about 50kΩ. But, in [42] the measurement showed that
the lowest possible resistance of human body is 500-1000Ω, when worst case
happened such as wet condition without insulation (barefooted).
24
Figure 2-19. Zones of DC Current Effects (Left Hand to Feet at 15-100Hz)[38]
2.7. Summary
From the literature review, it is important to understand the lighting standard that
applies to certain types of room where lighting design installed. We found that there
are some important factors in designing lighting system, such as lumen output per
lamp, color rendering index and illuminance level requirement. Moreover, LED
characteristics including the I-V curve and lifetime aspect had been explained to
provide the basic understanding as we used LED to replace CFL. It is also important to
understand the driving methods that are commonly used as driver for LED lamp.
Previous study mentioned that common LED driver used filter, rectifier, and DC/DC
converter. According to these current evidences, we proposed a novel system that
removes DC/DC converter because the voltage level still can be provided from DC
grid. LVDC and ELVDC system were reviewed to understand the terminology and the
potential benefit of DC grid application. In addition, study of safety issues in DC grid
leads to understanding of potential benefit of using low level voltage DC grid.

25
Chapter 3
3. Retrofit of Lighting System
This chapter describes the selection of lighting luminaries to replace existing
luminaries, and also the characteristics of chosen luminaries. The experiment was done
to understand the basic need of providing a certain number of lumen as per the
building standard and code. So that, experiment to test the compatibility of LED in
replacing CFL and choosing the right type of diffuser was done. The selection of the
luminary would be essential for this research to design light system for common area,
as it affected electrical calculation for the next chapter which discusses about design
suitable ELVDC. In general, lighting system in Singapore is required to follow the
standard from SS531 2006. In this research, the lighting luminary was tested in
recommended voltage range which is according to maximum voltage drop 4%
tolerance and 6% tolerance [43].
3.1 LED Lamp Performance
Solid state lamp is already been well known as replacement for conventional lamp,
such as lamp bulb and CFL. This research studied the characteristic of LED lamp and
also the effect of LED module’s shape. Basically, LED module is constructed by
LEDs and resistors. This typical LED’s strip circuit will be shown in Figure 3-1.
Figure 3-1. Typical Circuit of LED Strip
26
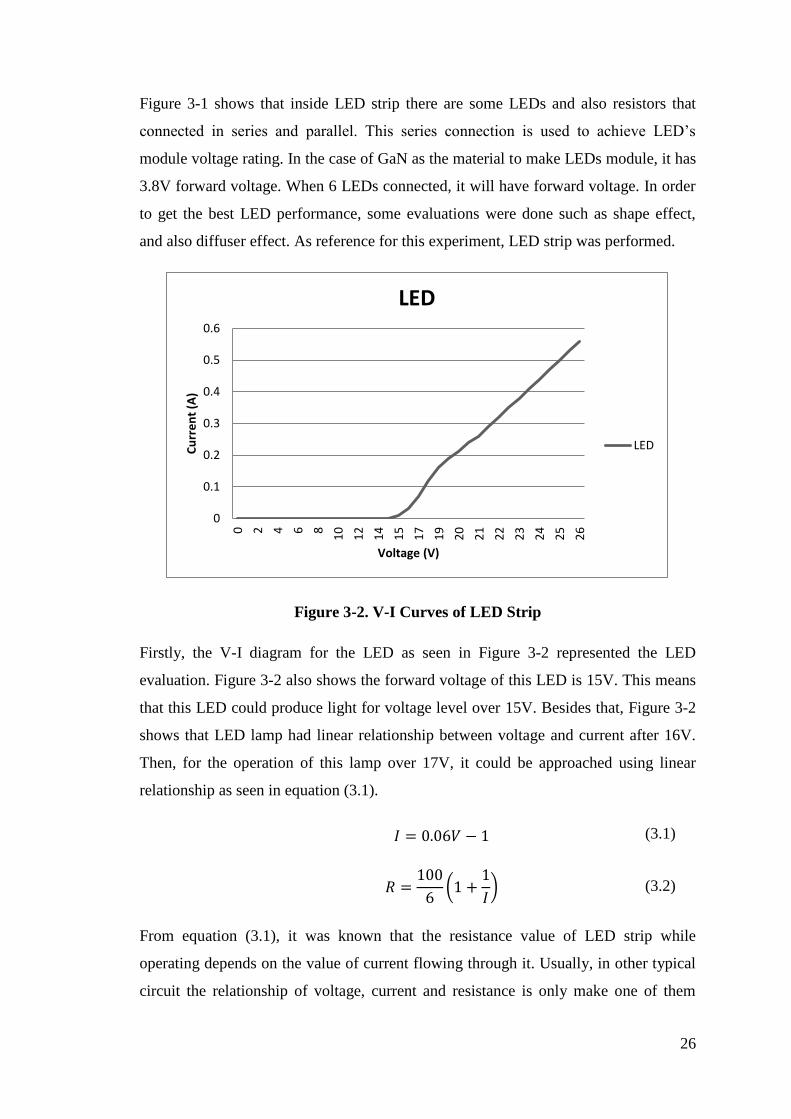
Figure 3-1 shows that inside LED strip there are some LEDs and also resistors that
connected in series and parallel. This series connection is used to achieve LED’s
module voltage rating. In the case of GaN as the material to make LEDs module, it has
3.8V forward voltage. When 6 LEDs connected, it will have forward voltage. In order
to get the best LED performance, some evaluations were done such as shape effect,
and also diffuser effect. As reference for this experiment, LED strip was performed.
Figure 3-2. V-I Curves of LED Strip
Firstly, the V-I diagram for the LED as seen in Figure 3-2 represented the LED
evaluation. Figure 3-2 also shows the forward voltage of this LED is 15V. This means
that this LED could produce light for voltage level over 15V. Besides that, Figure 3-2
shows that LED lamp had linear relationship between voltage and current after 16V.
Then, for the operation of this lamp over 17V, it could be approached using linear
relationship as seen in equation (3.1).
(3.1)
(
) (3.2)
From equation (3.1), it was known that the resistance value of LED strip while
operating depends on the value of current flowing through it. Usually, in other typical
circuit the relationship of voltage, current and resistance is only make one of them
0
0.1
0.2
0.3
0.4
0.5
0.6
0 2 4 6 8
10
12
14
15
17
19
20
21
22
23
24
25
26
Cu
rre
nt
(A)
Voltage (V)
LED
LED
27
constant by letting others changing. But, in this case, three of them were not constant
which means LED Strips had differential resistance. This phenomenon made the
calculation of the current flowing through LED strip would be based on voltage input
following equation (3.1) and affecting resistance which follows equation (3.2).
Equation (3.2) shows that LED Strip has two components of resistance. First
component was resistance that was independent to current. Second component was
resistance that linearly decreased according to current value; it represented power
consumed by LED to be used. Thus, the constant resistance for this LED strip was
16.67ohm. This value of constant resistance could be added to other resistance while
connected in series for evaluation, for example cable resistance.
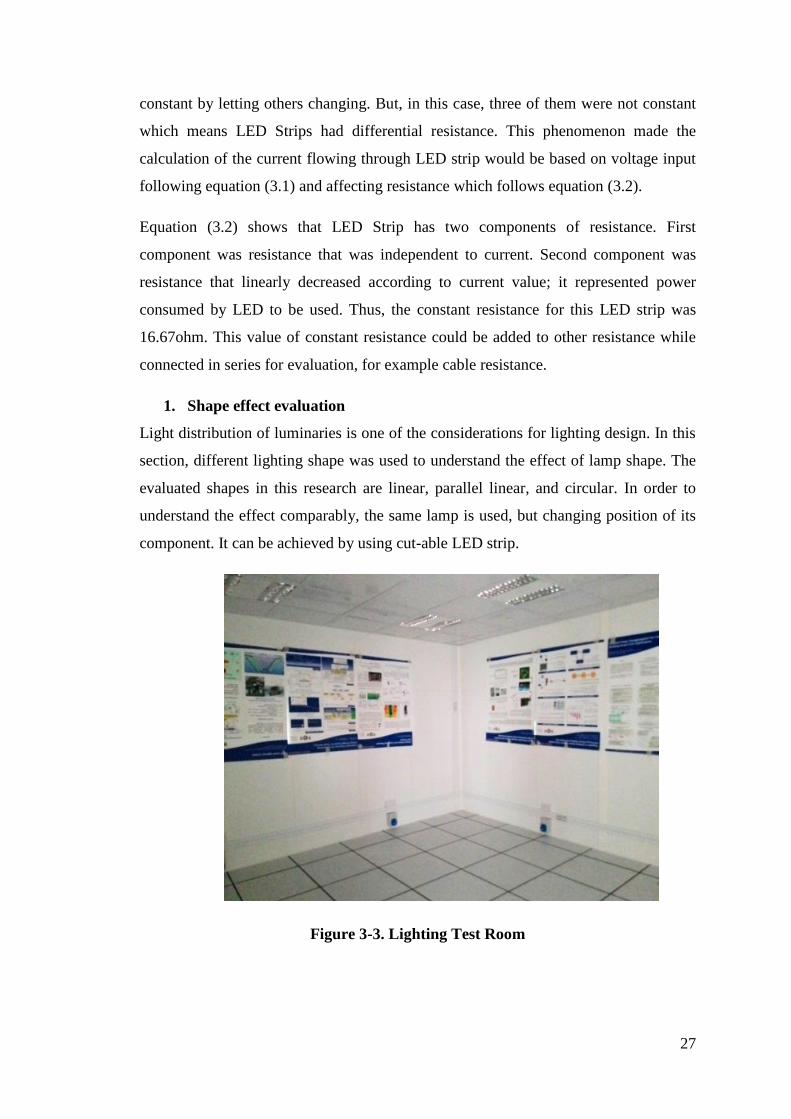
1. Shape effect evaluation
Light distribution of luminaries is one of the considerations for lighting design. In this
section, different lighting shape was used to understand the effect of lamp shape. The
evaluated shapes in this research are linear, parallel linear, and circular. In order to
understand the effect comparably, the same lamp is used, but changing position of its
component. It can be achieved by using cut-able LED strip.
Figure 3-3. Lighting Test Room
28
Firstly, this experiment was done in the room without other light source. The
set up for the room is shown in Figure 3-3. Then, for the reference the linear
shape was tested. The measurement of illuminance was done by using lux
meter at 1m height and on floor. Figure 3-4 shows the result of LED Strip
lumen test area.
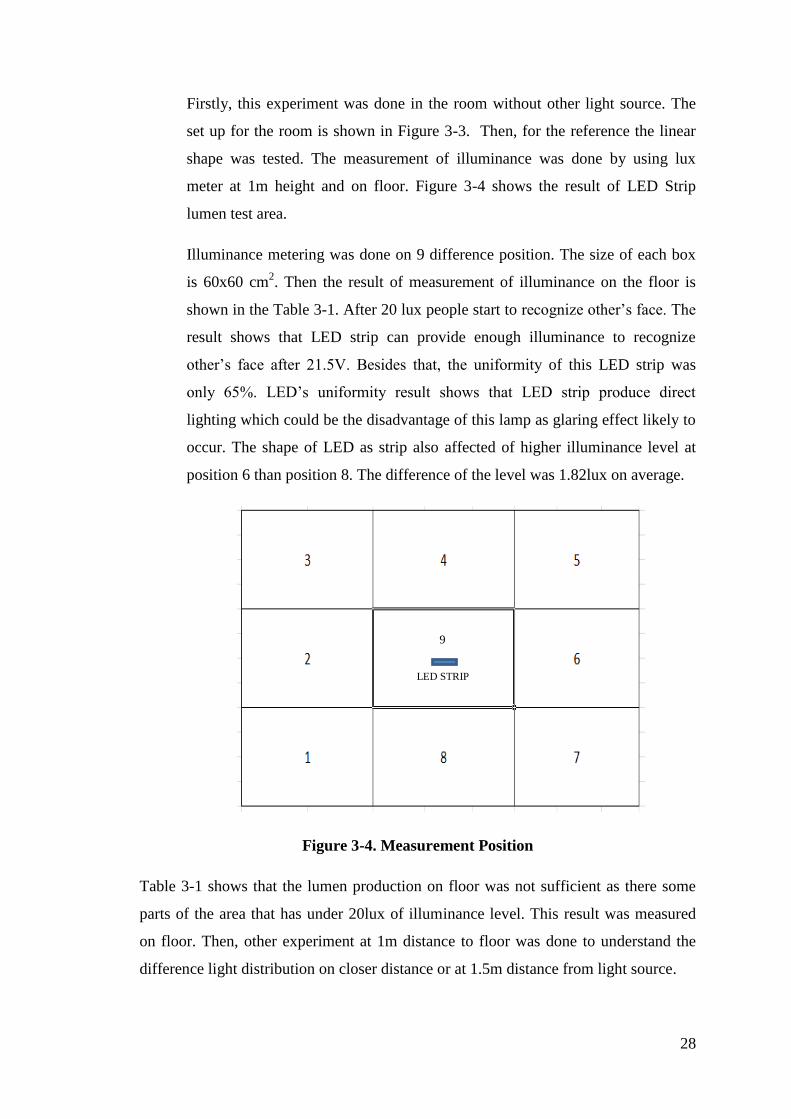
Illuminance metering was done on 9 difference position. The size of each box
is 60x60 cm2. Then the result of measurement of illuminance on the floor is
shown in the Table 3-1. After 20 lux people start to recognize other’s face. The
result shows that LED strip can provide enough illuminance to recognize
other’s face after 1.5V. Besides that, the uniformity of this LED strip was
only 5%. LED’s uniformity result shows that LED strip produce direct
lighting which could be the disadvantage of this lamp as glaring effect likely to
occur. The shape of LED as strip also affected of higher illuminance level at
position 6 than position 8. The difference of the level was 1.82lux on average.
Figure 3-4. Measurement Position
Table 3-1 shows that the lumen production on floor was not sufficient as there some
parts of the area that has under 20lux of illuminance level. This result was measured
on floor. Then, other experiment at 1m distance to floor was done to understand the
difference light distribution on closer distance or at 1.5m distance from light source.
9
LED STRIP
29
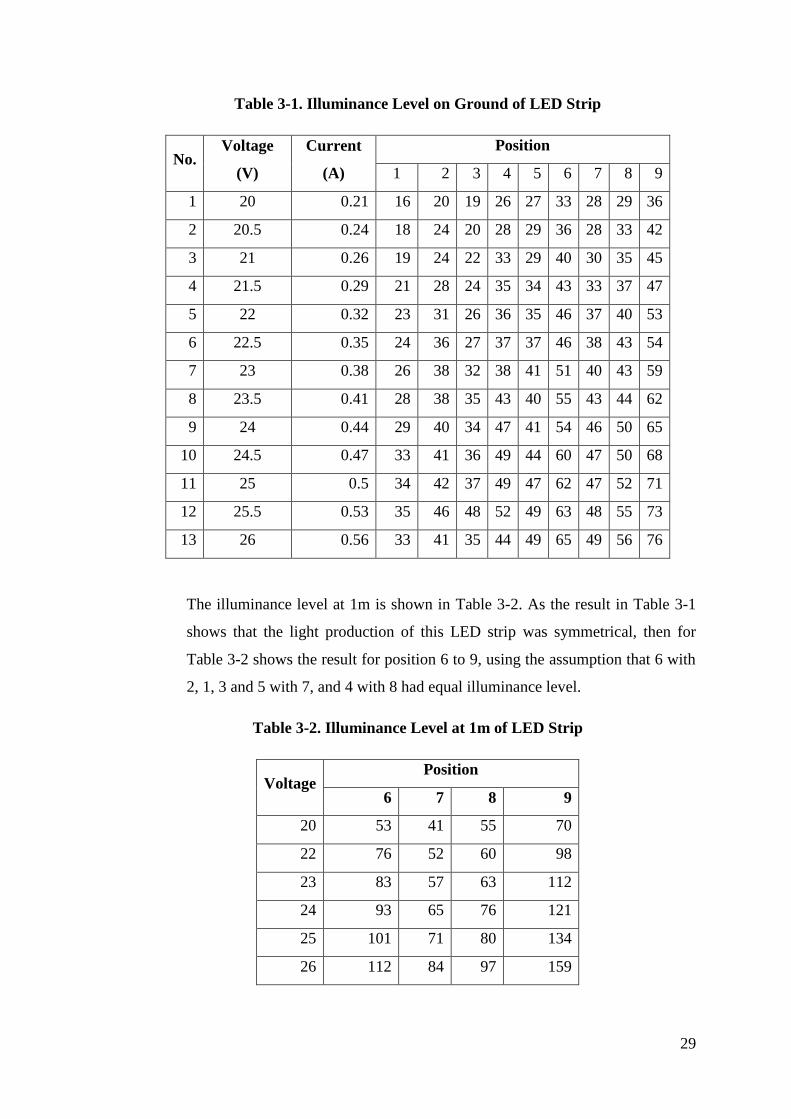
Table 3-1. Illuminance Level on Ground of LED Strip
No. Voltage
(V)
Current
(A)
Position
1 2 3 4 5 6 7 8 9
1 20 0.21 16 20 19 26 27 33 28 29 36
2 20.5 0.24 18 24 20 28 29 36 28 33 42
3 21 0.26 19 24 22 33 29 40 30 35 45
4 21.5 0.29 21 28 24 35 34 43 33 37 47
5 22 0.32 23 31 26 36 35 46 37 40 53
6 22.5 0.35 24 36 27 37 37 46 38 43 54
7 23 0.38 26 38 32 38 41 51 40 43 59
8 23.5 0.41 28 38 35 43 40 55 43 44 62
9 24 0.44 29 40 34 47 41 54 46 50 65
10 24.5 0.47 33 41 36 49 44 60 47 50 68
11 25 0.5 34 42 37 49 47 62 47 52 71
12 25.5 0.53 35 46 48 52 49 63 48 55 73
13 26 0.56 33 41 35 44 49 65 49 56 76
The illuminance level at 1m is shown in Table 3-2. As the result in Table 3-1
shows that the light production of this LED strip was symmetrical, then for
Table 3-2 shows the result for position 6 to 9, using the assumption that 6 with
2, 1, 3 and 5 with 7, and 4 with 8 had equal illuminance level.
Table 3-2. Illuminance Level at 1m of LED Strip
Voltage Position
6 7 8 9
20 53 41 55 70
22 76 52 60 98
23 83 57 63 112
24 93 65 76 121
25 101 71 80 134
26 112 84 97 159
30
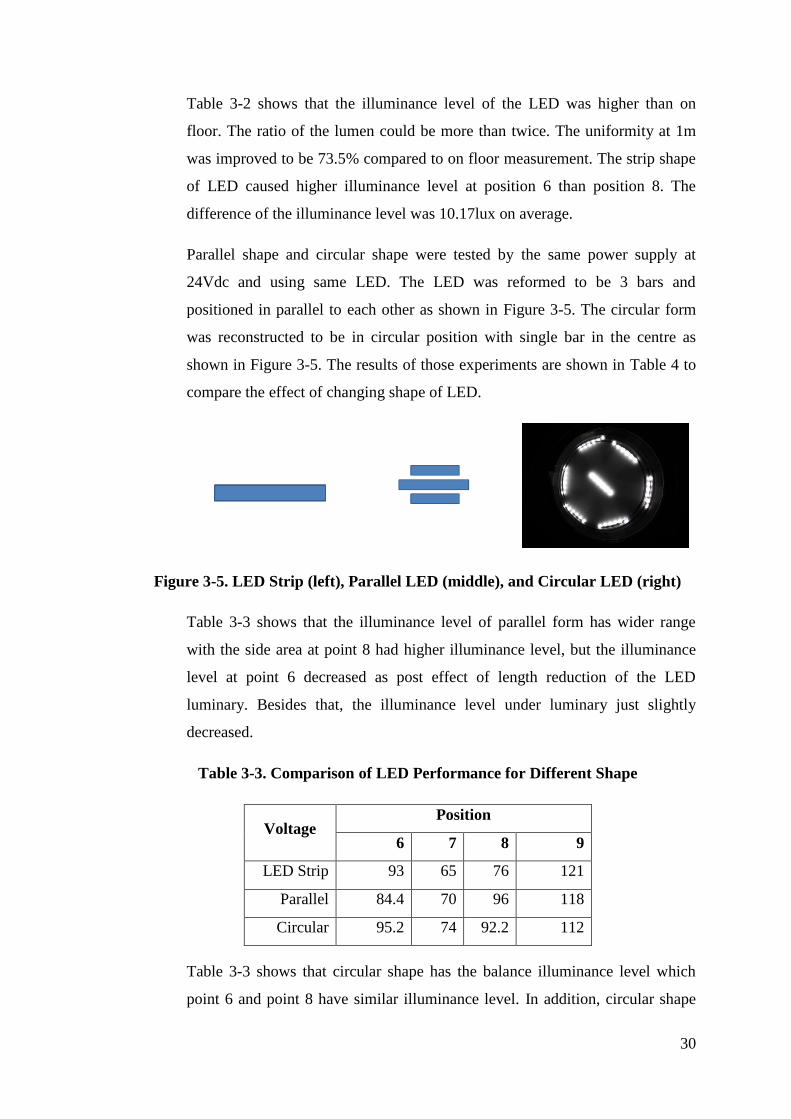
Table 3-2 shows that the illuminance level of the LED was higher than on
floor. The ratio of the lumen could be more than twice. The uniformity at 1m
was improved to be 73.5% compared to on floor measurement. The strip shape
of LED caused higher illuminance level at position 6 than position 8. The
difference of the illuminance level was 10.17lux on average.
Parallel shape and circular shape were tested by the same power supply at
24Vdc and using same LED. The LED was reformed to be 3 bars and
positioned in parallel to each other as shown in Figure 3-5. The circular form
was reconstructed to be in circular position with single bar in the centre as
shown in Figure 3-5. The results of those experiments are shown in Table 4 to
compare the effect of changing shape of LED.
Figure 3-5. LED Strip (left), Parallel LED (middle), and Circular LED (right)
Table 3-3 shows that the illuminance level of parallel form has wider range
with the side area at point 8 had higher illuminance level, but the illuminance
level at point 6 decreased as post effect of length reduction of the LED
luminary. Besides that, the illuminance level under luminary just slightly
decreased.
Table 3-3. Comparison of LED Performance for Different Shape
Voltage Position
6 7 8 9
LED Strip 93 65 76 121
Parallel 84.4 70 96 118
Circular 95.2 74 92.2 112
Table 3-3 shows that circular shape has the balance illuminance level which
point 6 and point 8 have similar illuminance level. In addition, circular shape
31
could increase illuminance level in the diagonal point 7. In the other hand, the
illuminance level decreased as the effect of spreading the LED bars.
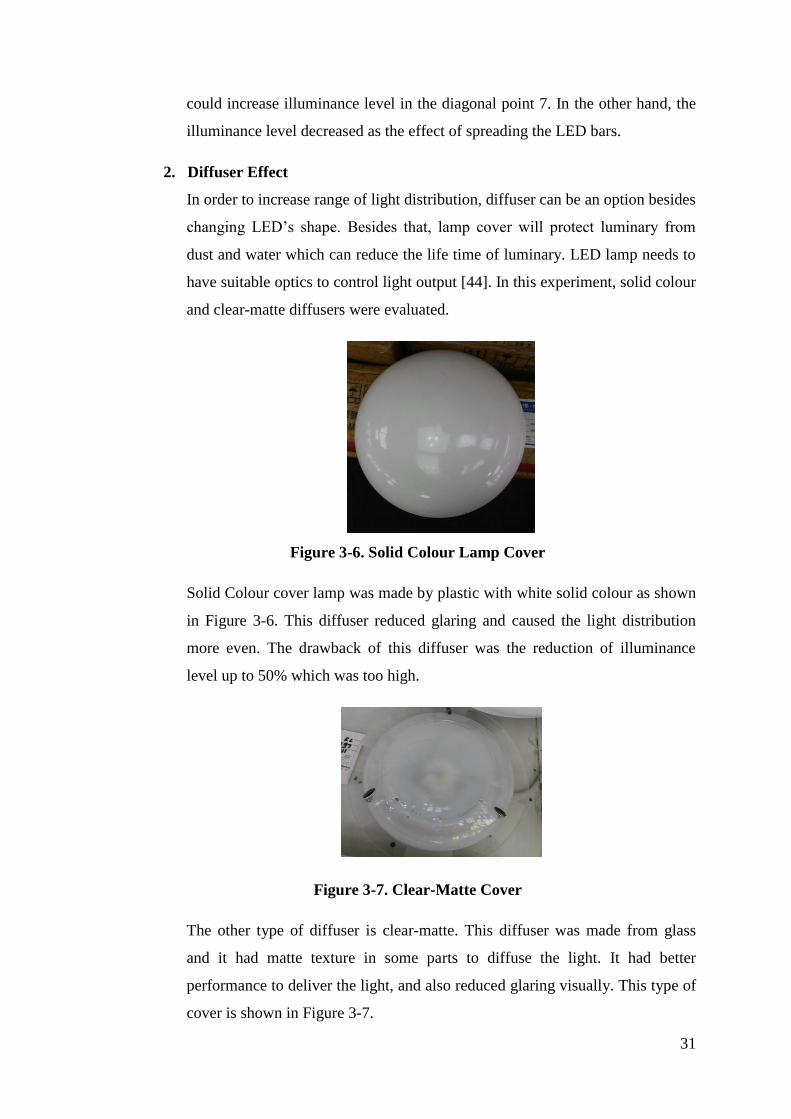
2. Diffuser Effect
In order to increase range of light distribution, diffuser can be an option besides
changing LED’s shape. Besides that, lamp cover will protect luminary from
dust and water which can reduce the life time of luminary. LED lamp needs to
have suitable optics to control light output [44]. In this experiment, solid colour
and clear-matte diffusers were evaluated.
Figure 3-6. Solid Colour Lamp Cover
Solid Colour cover lamp was made by plastic with white solid colour as shown
in Figure 3-6. This diffuser reduced glaring and caused the light distribution
more even. The drawback of this diffuser was the reduction of illuminance
level up to 50% which was too high.
Figure 3-7. Clear-Matte Cover
The other type of diffuser is clear-matte. This diffuser was made from glass
and it had matte texture in some parts to diffuse the light. It had better
performance to deliver the light, and also reduced glaring visually. This type of
cover is shown in Figure 3-7.

32
Table 3-4. Diffuser Effect
Voltage Position
6 7 8 9
Without diffuser 84.4 70 96 118
Solid colour 48 34 44 74
Clear-matte 74 64 80 108
In this experiment, the LED strip was shaped to parallel form to be fitted inside
lamp cover/diffuser. Therefore, the LED parallel measurement result would be
the reference for diffuser effect experiment. The result of this experiment is
shown in Table 3-4.
3.2 Summary
Based on the experiment results shown in Chapter 3.1, LED with higher lumen
production, strip shape and clear diffuser is selected to retrofit existing lamp in
common area. Higher lumen production of the LED was achieved by selecting other
LED lamp product which used different LED material. By selecting different material,
LED could produce higher lumen at the same wattage. It means that the selected LED
lamp, has higher efficacy (lumen/watt).
By using higher efficacy LED lamp, producing 162lux at 24V, a single lamp was able
to meet the minimum illuminance level at 150lux. In contrast, using lower efficacy
LED lamp, producing 121lux at 24V, two LED lamps were needed to meet the
requirement. Thus, using higher efficacy lamp may lead to potential savings in the
long run.
Figure 3-8. LED Lamp with 120deg Angle
Dimension of the area for lighting system determines lamp’s shape option. As the
form of stair case which will be retrofitted in this project was rectangular, thus LED
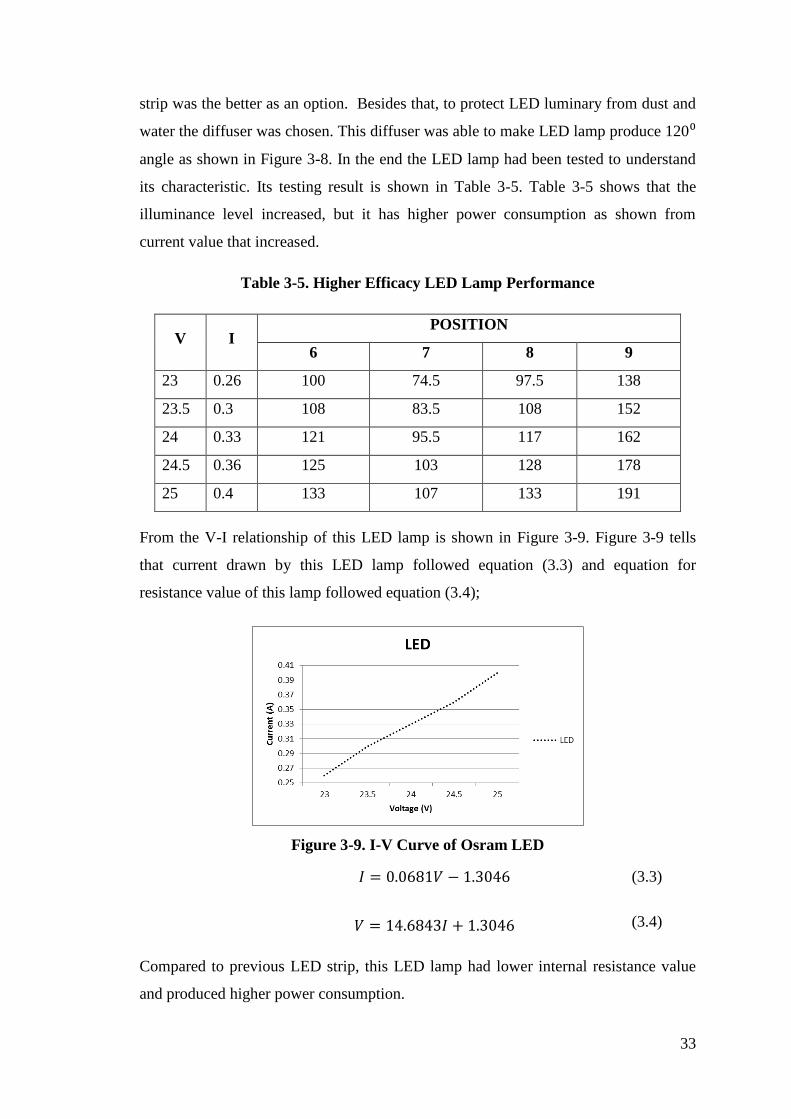
33
strip was the better as an option. Besides that, to protect LED luminary from dust and
water the diffuser was chosen. This diffuser was able to make LED lamp produce 120⁰
angle as shown in Figure 3-8. In the end the LED lamp had been tested to understand
its characteristic. Its testing result is shown in Table 3-5. Table 3-5 shows that the
illuminance level increased, but it has higher power consumption as shown from
current value that increased.
Table 3-5. Higher Efficacy LED Lamp Performance
V I POSITION
6 7 8 9
23 0.26 100 74.5 97.5 138
23.5 0.3 108 83.5 108 152
24 0.33 121 95.5 117 162
24.5 0.36 125 103 128 178
25 0.4 133 107 133 191
From the V-I relationship of this LED lamp is shown in Figure 3-9. Figure 3-9 tells
that current drawn by this LED lamp followed equation (3.3) and equation for
resistance value of this lamp followed equation (3.4);
Figure 3-9. I-V Curve of Osram LED
(3.3)
(3.4)
Compared to previous LED strip, this LED lamp had lower internal resistance value
and produced higher power consumption.

34
Chapter 4
4. ELVDC Evaluation
This study evaluated the feasibility of ELVDC system with LED lamp for retrofitting
HDB flats’ lighting system which used AC system topology with CFL. Feasibility of
ELVDC implementation will be decided according to the electrical performance, such
as: voltage drop, harmonic, safety, and efficiency. Based on the power savings of the
system, pay-back period and Net Present Value (NPV) of the system can be calculated.
In this study, we compared ELVDC topologies to AC power distribution topology.
The ELVDC topologies include Unipolar ELVDC and Bipolar ELVDC. Both
topologies were chosen because AC system could be migrated to DC grid using both
topologies following IET standard. As comparison, AC system with LED lamp was
also evaluated in this chapter. These topologies were simulated in MATLAB to
understand the voltage and current waveform in each load. Moreover, harmonic
evaluation was done using MATLAB. Voltage drop, power loss and efficiency of the
system was evaluated based on cable loss and lamp power consumption.
4.1 Topology of ELVDC Distribution System
Previous works done by Chen et al.[37] provided method to drive LED using existing
ballast which concluded that LED could be used as replacement of CFL Lamp. There
is also another works done by Tan et al. [6] explained the method to drive LED
without ballast and using driver operated in DC system which claimed that the design
could achieve 44.23% savings in user-preference-control mode. Then, this research
studied the effect of using direct operation of LED as lighting system. Further
explanation of the system used by conventional AC system driving CFL and LED is
shown in Figure 4-1.
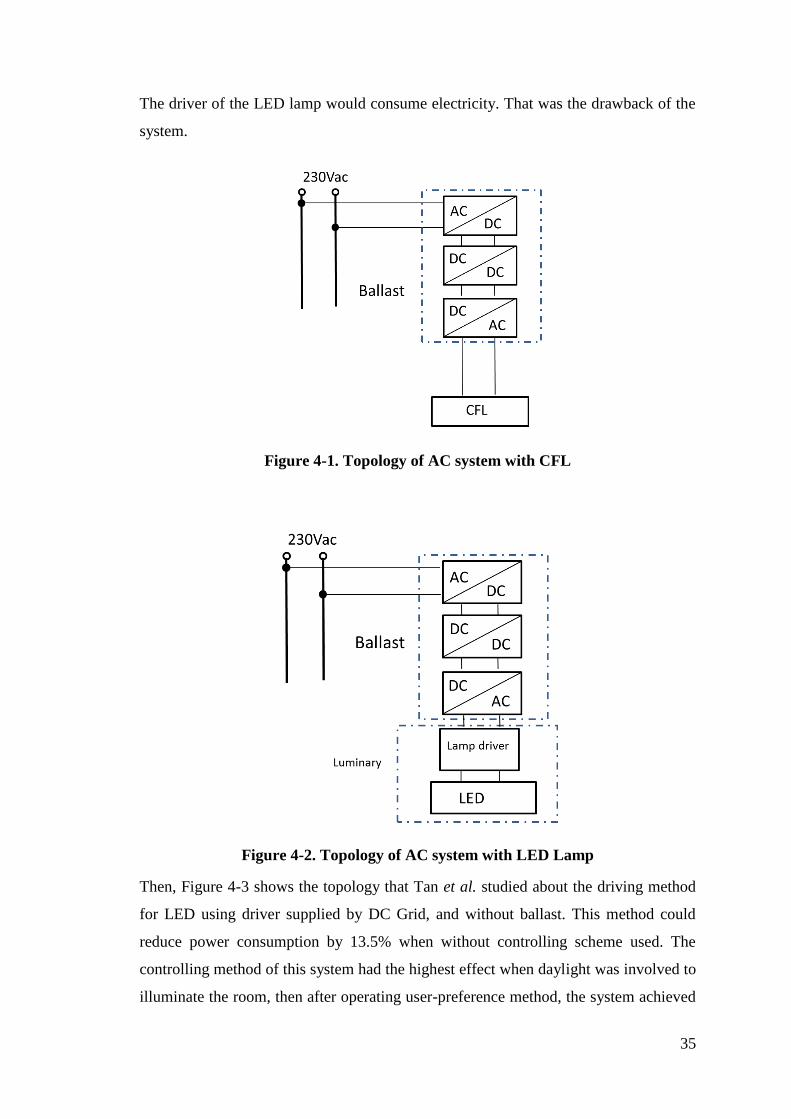
Figure 4-1 shows the typical topology for AC system to drive CFL. This system was
not efficient as ballast consume some electricity. From this topology, Chen et al.
replaced CFL to LED luminary with installed driver as shown in Figure 4-2. This
system proved to be a simple way to retrofit CFL to LED, this system operated 20W
LED to replace 36W CFL. In that time, their LED products produced 50lm/W [37].
35
The driver of the LED lamp would consume electricity. That was the drawback of the
system.
Figure 4-1. Topology of AC system with CFL
Figure 4-2. Topology of AC system with LED Lamp
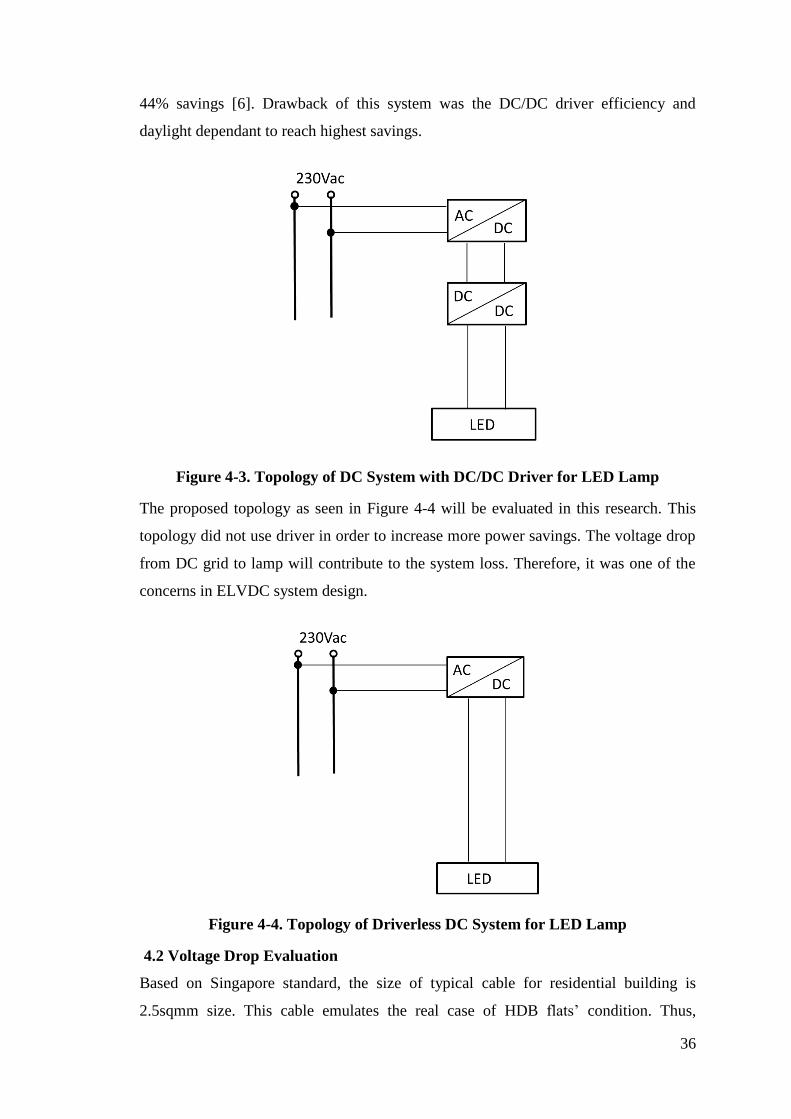
Then, Figure 4-3 shows the topology that Tan et al. studied about the driving method
for LED using driver supplied by DC Grid, and without ballast. This method could
reduce power consumption by 13.5% when without controlling scheme used. The
controlling method of this system had the highest effect when daylight was involved to
illuminate the room, then after operating user-preference method, the system achieved
36
44% savings [6]. Drawback of this system was the DC/DC driver efficiency and
daylight dependant to reach highest savings.
Figure 4-3. Topology of DC System with DC/DC Driver for LED Lamp
The proposed topology as seen in Figure 4-4 will be evaluated in this research. This
topology did not use driver in order to increase more power savings. The voltage drop
from DC grid to lamp will contribute to the system loss. Therefore, it was one of the
concerns in ELVDC system design.
Figure 4-4. Topology of Driverless DC System for LED Lamp
4.2 Voltage Drop Evaluation
Based on Singapore standard, the size of typical cable for residential building is
2.5sqmm size. This cable emulates the real case of HDB flats’ condition. Thus,
37
retrofitting of HDB flats’ electrical system could be evaluated. This cable has its own
properties. Based on Singapore Standard it has typical internal resistance as much as
0.18ohm/m. Maximum voltage drop (Vdrop) allowed is 4% tolerance and 6%
tolerance (for lighting purposes). It means that for 230Vac system the voltage
maximum voltage drop to the load is 9.2V. For ELVDC, there is still no regulation
about voltage drop. Thus, applying the same regulation to ELVDC is the simplest way
to evaluate ELVDC system in the beginning. This voltage drop is affected by the
system cable dimension. Therefore, cable dimension of the system need to be
measured.
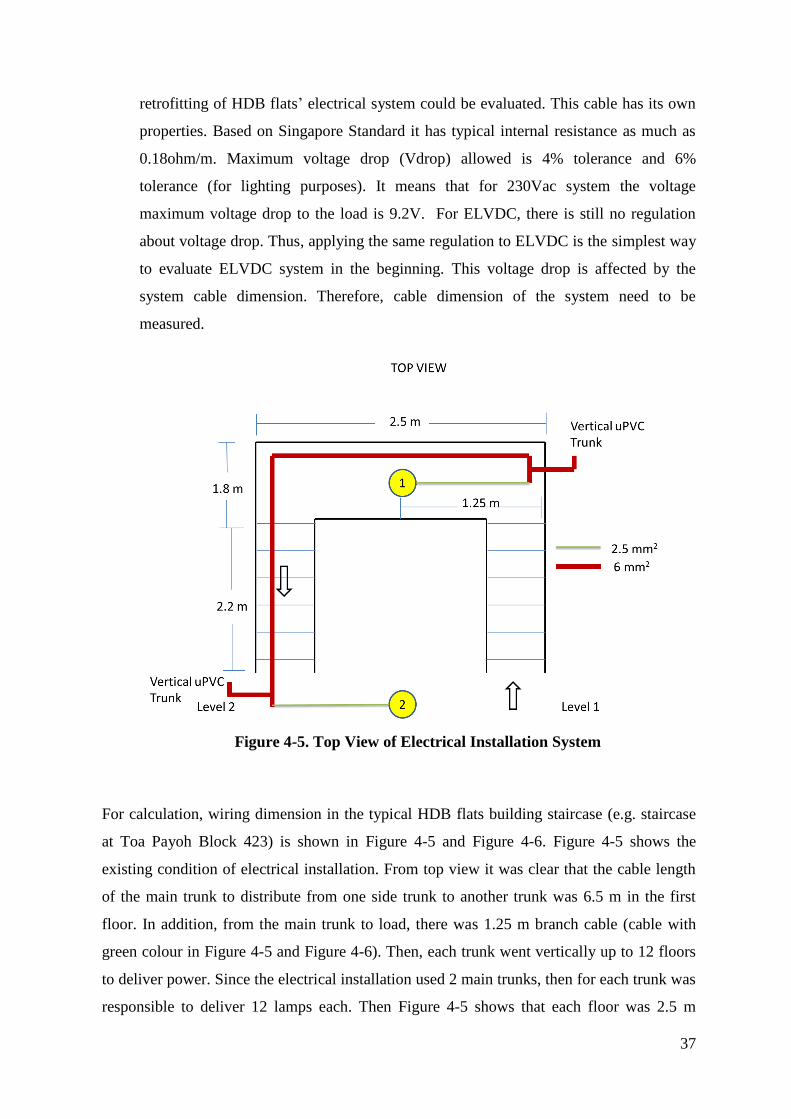
Figure 4-5. Top View of Electrical Installation System
For calculation, wiring dimension in the typical HDB flats building staircase (e.g. staircase
at Toa Payoh Block 423) is shown in Figure 4-5 and Figure 4-6. Figure 4-5 shows the
existing condition of electrical installation. From top view it was clear that the cable length
of the main trunk to distribute from one side trunk to another trunk was 6.5 m in the first
floor. In addition, from the main trunk to load, there was 1.25 m branch cable (cable with
green colour in Figure 4-5 and Figure 4-6). Then, each trunk went vertically up to 12 floors
to deliver power. Since the electrical installation used 2 main trunks, then for each trunk was
responsible to deliver 12 lamps each. Then Figure 4-5 shows that each floor was 2.5 m

38
height. The cable size and length affect internal resistance value. So it is important to
understand the cable dimension. For technical analysis in the following sections would
evaluate deeper using the dimension shown in Figure 4-5 and Figure 4-6.
Figure 4-6. Side View of Electrical installation System
1. Reconfiguration of the wiring
Initial evaluation is made by using one of rectifier product and also the cable
specification as CP 5 listed. The information follows:
Rectifier:
Maximum power : 500W
Input voltage : 220Vac
Output voltage : 24Vdc
Efficiency : 90%
Cable:
Size : 25mm2
Internal resistance : 18mV/A per m (for Line and Neutreal Cable) or
9mV/A (per cable).
39
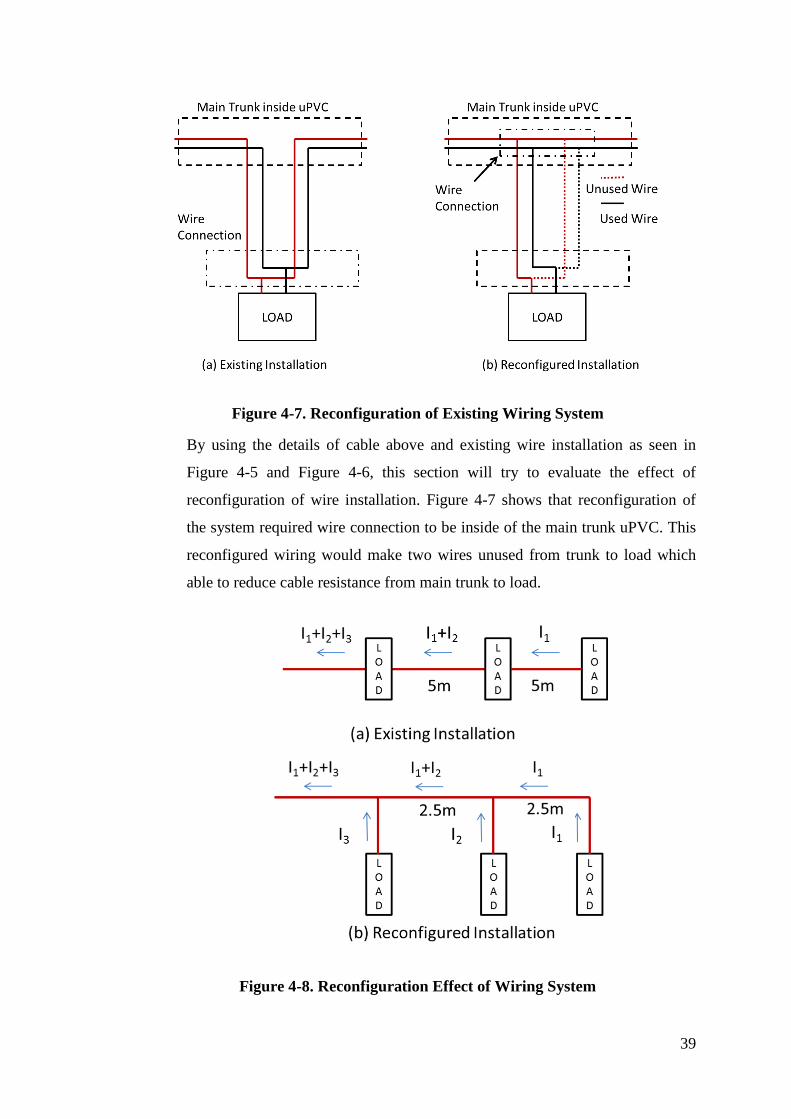
Figure 4-7. Reconfiguration of Existing Wiring System
By using the details of cable above and existing wire installation as seen in
Figure 4-5 and Figure 4-6, this section will try to evaluate the effect of
reconfiguration of wire installation. Figure 4-7 shows that reconfiguration of
the system required wire connection to be inside of the main trunk uPVC. This
reconfigured wiring would make two wires unused from trunk to load which
able to reduce cable resistance from main trunk to load.
Figure 4-8. Reconfiguration Effect of Wiring System
40
For example, in the existing installation, each floor distance was 2.5m, and
from main trunk to load was 1.25m. Thus total distance between loads to
another load in a higher floor would be 5m with no distance from node (place
for the cable connection) to load.
In contrast, total distance between loads to another load in a higher floor would
be 2.5m. But, this configuration required cable from node to load with 1.25m in
length. The significant benefit of this system happens when the main trunk
(bus) handling accumulated loads current as shown in Figure 4-8 as illustration.
As shown in Figure 4-8(b) cable in main trunk would handle the same
accumulated current in a shorter distance cable. It means that the power loss of
the cable could also be reduced. While power loss in cable of main trunk is
stated in equation (4.3) and power loss in cable from node to load is stated in
equation (4.4).
(4.1)
( )
( )
( ( ) ( ))
(4.2)
For n number of loads we use equation (4.3), as follows
∑(∑
)
(4.3)

41
( ) (4.4)
For n number of loads we use equation (4.5), as follows
(∑
)
(4.5)
For example, if each load took 1A and Rcable is 18mΩ/m, then total power
loss in existing system as seen in Figure 4-8 (a) would be 1260mW.
( ( ) ( ) )
( )
In contrast, power cable of the reconfigured wiring system would be as stated
in calculation below would be 697.5mW. From this example, by
reconfiguration (as seen in Figure 4-8 (b)) power loss in the system by cable
was reduced by 562.5mW or 44% less than existing configuration (as seen in
Figure 4-8 (a)). Thus in the following simulation, configuration of the system
followed proposed configuration as reconfigured wiring configuration.
( ( ) ( ) ) ( )
( ) ( )
2. 4% voltage drop regulation evaluation
Based on the information in sub-section 1 above, we tried to find the maximum
cable length possible when drawing maximum power from rectifier. As the
voltage reference of this system is 24Vdc (assumption made to be there was no
Vdrop in the supply because of load effect). Then, Voutput was set to be 24V
plus 4% tolerance in percentage (%), it will be 25.44V. The maximum Vdrop
which follow equation (4.5) became only 1.92V.
42
(4.5)
For single phase two wire system, the voltage drop was affected by 2 wires.
Besides that, if we use the main voltage input to be within tolerance, then
voltage level would be adjusted with the tolerance. Thus the voltage drop
followed equation (4.6);
(4.6)
If internal resistance is proportional to the length of the cable, then the function
of the maximum length of the cable for main trunk will follow equation (4.7):
( )
(4.7)
where
Vd : voltage drop (V)
I : current flowing through the cable (A)
R : Resistance of the system (Ω)
Rcable : internal resistance of the cable (Ω)
l : length of the cable (m)
Based on the evaluation, the maximum length of the cable for drawing 500W
was only 5.32m. This evaluation shows that retrofitting building electrical
system using one rectifier was not feasible to meet 4% voltage drop regulation
as in the LVAC system regulation. With the assumption of the height of the
typical height of common area room (corridor and staircase) was 2.5m. Thus,
2.56m was not feasible to be implemented as main trunk in real system.

43
3. 6% voltage regulation evaluation
Since there was still no voltage drop regulation in ELVDC system, and also the
LED lamp was able to be driven when forward voltage was above 15V, this
research tried to use 6% tolerance of the voltage following electrical
installation guide based on IEC standard. Then, with 24Vdc as reference, thus
the maximum voltage drop would be 1.44V.
( )
Using 6% regulation, the maximum length of the cable was proved to be
increased to be as high as the ratio of the voltage drop tolerance, in this case
1.5 times. The assumption in this case was only single load that supplied using
a cable. Thus, 3.84m would be the maximum distance for 500W load to the
main supply.
4. Dividing loads evaluation
From the previous evaluation, drawing 500W using with typical cable in
building as main trunk was not feasible. This research tried another approach to
use the typical cable to supply smaller power consumption of the load. It
means that the rectifier would not be operated at its maximum power rating. In
this evaluation, the maximum loading for one main trunk was set to be 100W.
Then, the maximum length of the main trunk for 100W, with 6% voltage drop
regulation, would be 19.2m as seen in the calculation below.
( )
This evaluation provided the proof that dividing loads or using smaller load
power consumption may increase length. The maximum feasible length was
44
19.2m for the distance between total loads in single node at 100W. Thus, from
the evaluation above, the feasible solution to implement ELVDC without
changing the existing electrical installation was using 6% tolerance for voltage
drop and using around 100W maximum loading for main supply cable.
4.3 Simulation for LED Lighting System Topologies
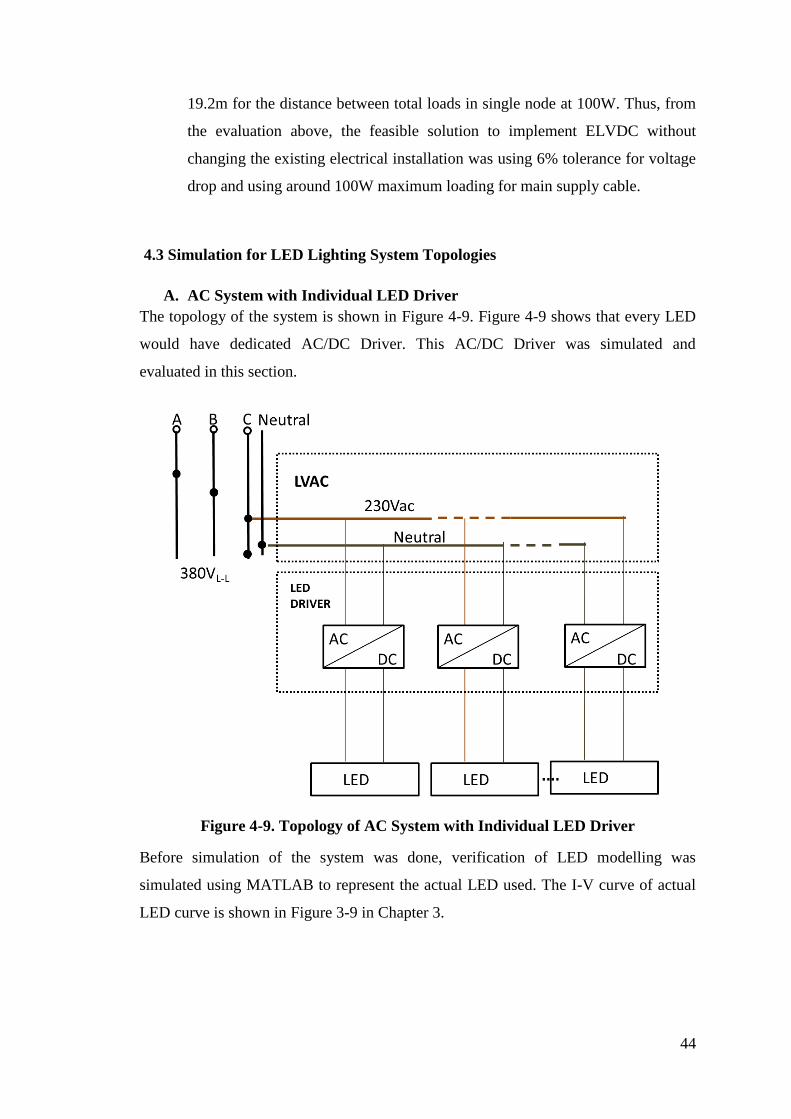
A. AC System with Individual LED Driver
The topology of the system is shown in Figure 4-9. Figure 4-9 shows that every LED
would have dedicated AC/DC Driver. This AC/DC Driver was simulated and
evaluated in this section.
Figure 4-9. Topology of AC System with Individual LED Driver
Before simulation of the system was done, verification of LED modelling was
simulated using MATLAB to represent the actual LED used. The I-V curve of actual
LED curve is shown in Figure 3-9 in Chapter 3.
45
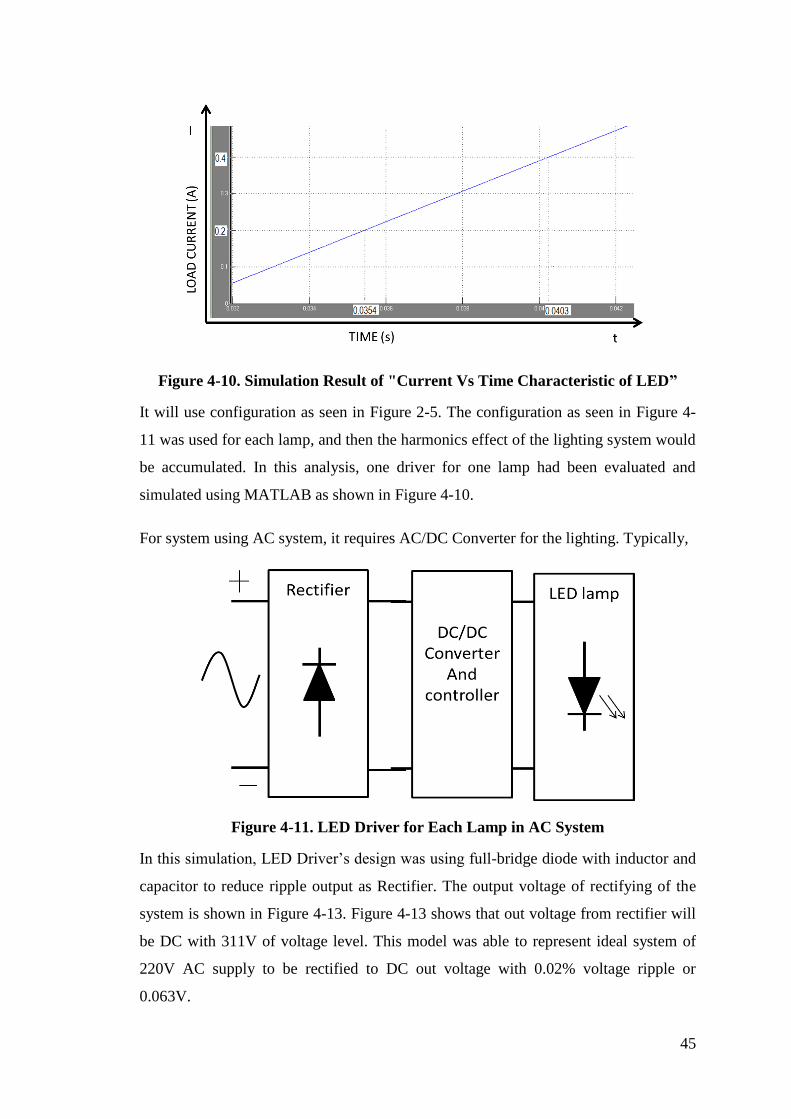
Figure 4-10. Simulation Result of "Current Vs Time Characteristic of LED”
It will use configuration as seen in Figure 2-5. The configuration as seen in Figure 4-
11 was used for each lamp, and then the harmonics effect of the lighting system would
be accumulated. In this analysis, one driver for one lamp had been evaluated and
simulated using MATLAB as shown in Figure 4-10.
For system using AC system, it requires AC/DC Converter for the lighting. Typically,
Figure 4-11. LED Driver for Each Lamp in AC System
In this simulation, LED Driver’s design was using full-bridge diode with inductor and
capacitor to reduce ripple output as Rectifier. The output voltage of rectifying of the
system is shown in Figure 4-13. Figure 4-13 shows that out voltage from rectifier will
be DC with 311V of voltage level. This model was able to represent ideal system of
220V AC supply to be rectified to DC out voltage with 0.02% voltage ripple or
0.063V.

46
Figure 4-12. Simulation of LED Driver for Each Lamp in MATLAB
This LED Driver model used rectifier configuration following [45]. Using Figure A-1,
2ohm series resistance (Rs) and 2µF capacitor (Cd) was placed. Besides that, the
driver also used DC/DC Converter. The DC/DC Converter design used Cuk converter
technology as seen in Figure 4-12. If the desired output voltage was 24 V with 0.5%
ripple voltage, 0.5% ripple current at load and source (after rectifier part) side. with
50kHz for switching frequency, the parameter of duty cycle, inductance and capacitor
follow [46] as seen in calculation below.
Duty cycle (D):
Inductance:
L1 (inductance at source side)
( )
( )
L2 (inductance at load side)
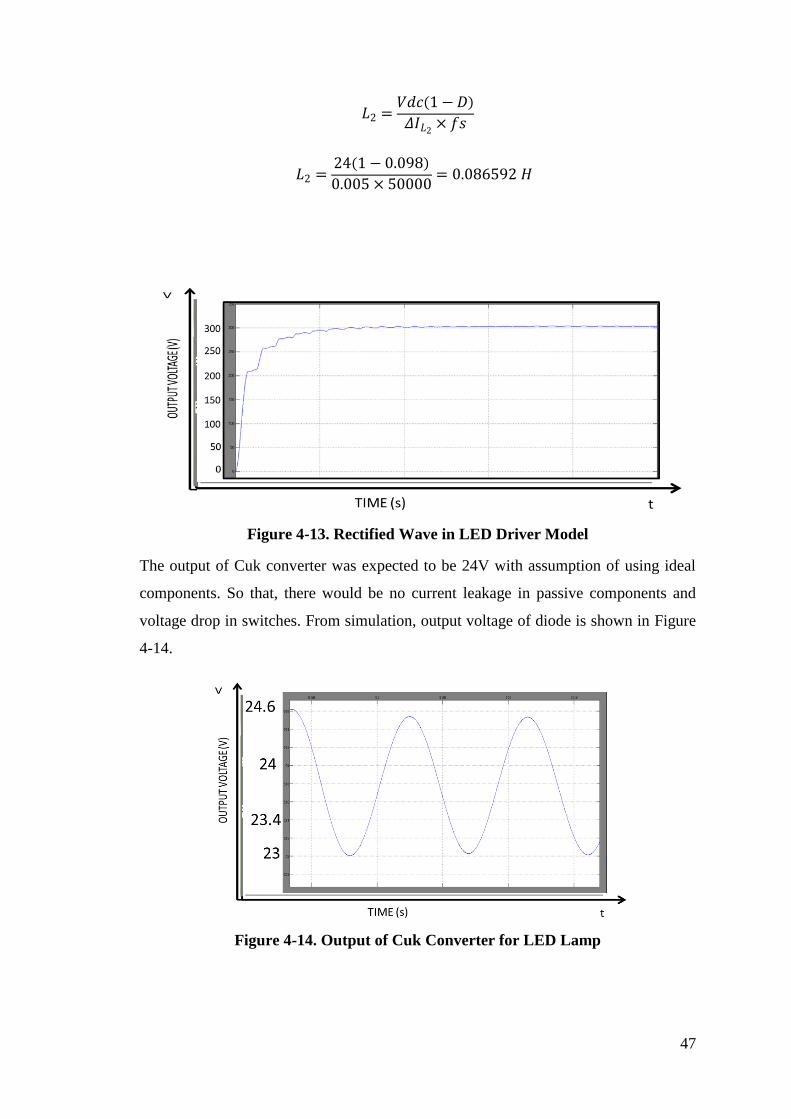
47
( )
( )
Figure 4-13. Rectified Wave in LED Driver Model
The output of Cuk converter was expected to be 24V with assumption of using ideal
components. So that, there would be no current leakage in passive components and
voltage drop in switches. From simulation, output voltage of diode is shown in Figure
4-14.
Figure 4-14. Output of Cuk Converter for LED Lamp
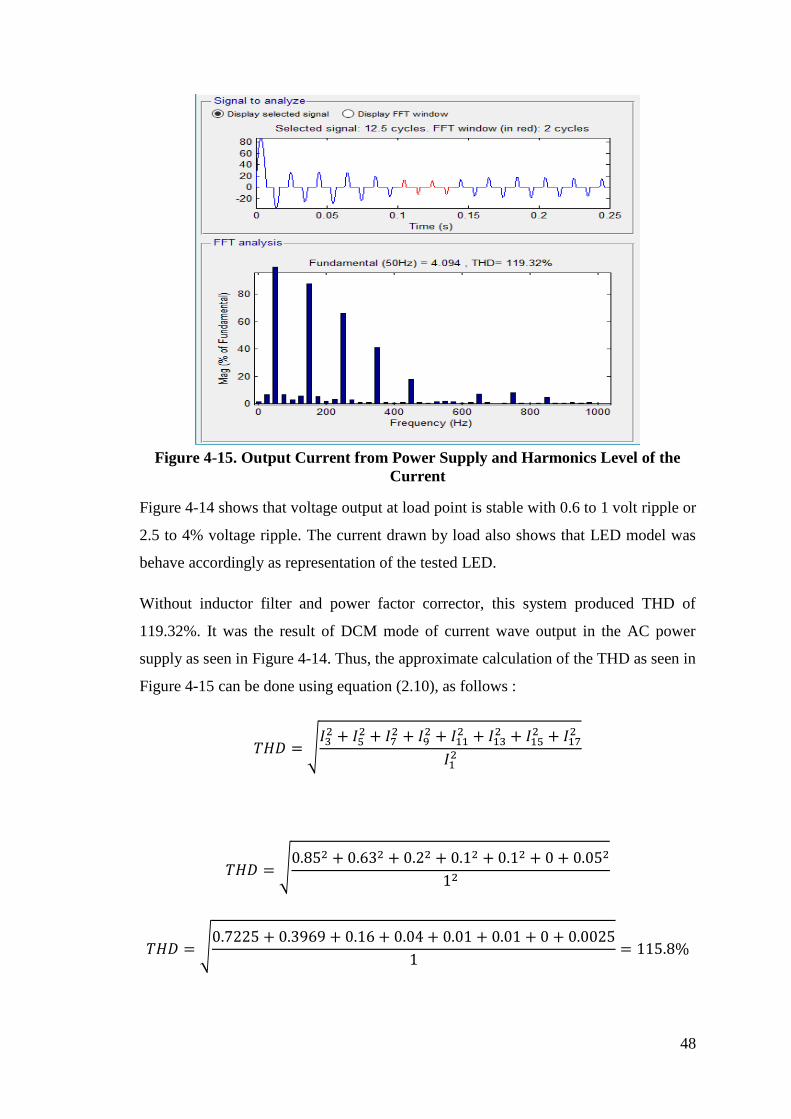
48
Figure 4-15. Output Current from Power Supply and Harmonics Level of the
Current
Figure 4-14 shows that voltage output at load point is stable with 0.6 to 1 volt ripple or
2.5 to 4% voltage ripple. The current drawn by load also shows that LED model was
behave accordingly as representation of the tested LED.
Without inductor filter and power factor corrector, this system produced THD of
119.32%. It was the result of DCM mode of current wave output in the AC power
supply as seen in Figure 4-14. Thus, the approximate calculation of the THD as seen in
Figure 4-15 can be done using equation (2.10), as follows :
√
√
√

49
Figure 4-16. Filter at Supply Side
Design of PFC followed the guidance in[23, 27, 29, 30]. Filter was placed at supply
side with 6.2kohm of resistor, 10H of Inductor and 1µF of Capacitor. After using
Filter, as seen in Figure 4-16, THD of the system was reduced to be 7.06% as seen in
Figure 4-17. By reducing harmonic distortion value, the current waveform transformed
to be similar to sinewave as shown in Figure 4-18.
Figure 4-17. Harmonic Component After Using Filter
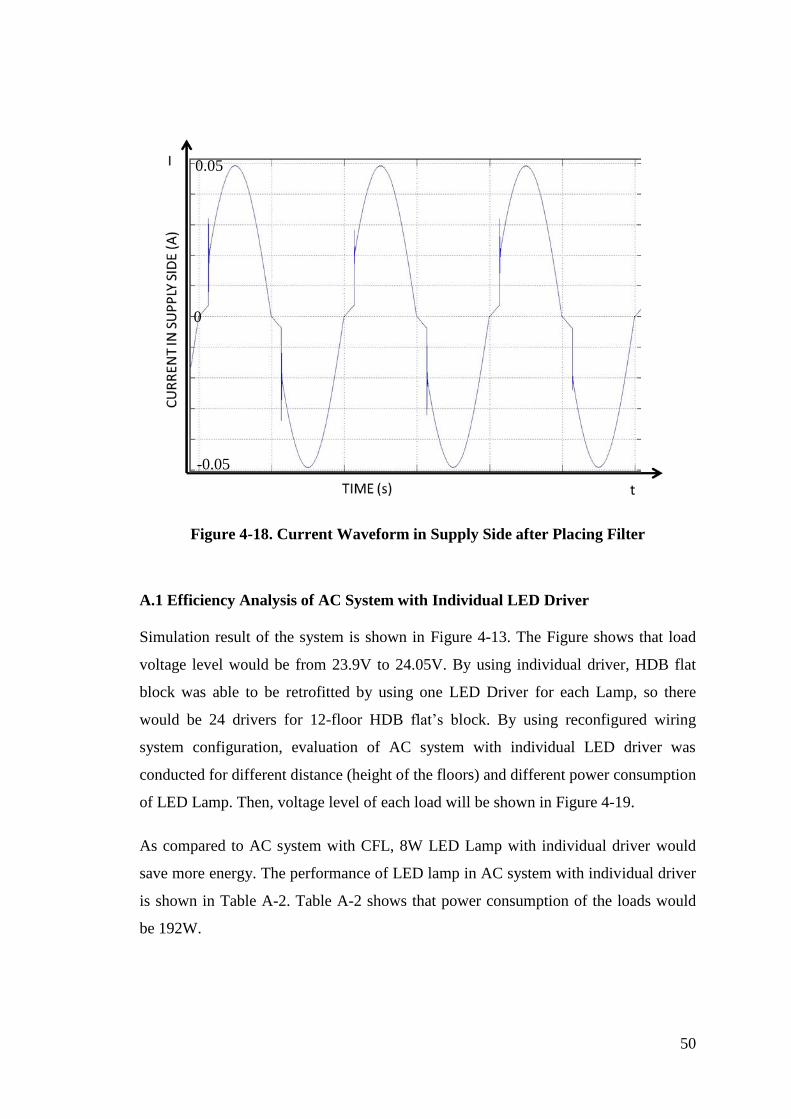
50
Figure 4-18. Current Waveform in Supply Side after Placing Filter
A.1 Efficiency Analysis of AC System with Individual LED Driver
Simulation result of the system is shown in Figure 4-13. The Figure shows that load
voltage level would be from 23.9V to 24.05V. By using individual driver, HDB flat
block was able to be retrofitted by using one LED Driver for each Lamp, so there
would be 24 drivers for 12-floor HDB flat’s block. By using reconfigured wiring
system configuration, evaluation of AC system with individual LED driver was
conducted for different distance (height of the floors) and different power consumption
of LED Lamp. Then, voltage level of each load will be shown in Figure 4-19.
As compared to AC system with CFL, 8W LED Lamp with individual driver would
save more energy. The performance of LED lamp in AC system with individual driver
is shown in Table A-2. Table A-2 shows that power consumption of the loads would
be 192W.
0
0.05
-0.05

51
Figure 4-19. Load Voltage Level in AC with Individual LED Driver
The efficiency in this system depended on the cable voltage drop and driver’s
efficiency. Then, the calculation of voltage drop followed equation (4.8);
∑( )
(4.8)
In AC system as seen in Figure 2-5, LED Driver used AC/DC Conversion stage and
DC/DC Conversion stage with typical efficiency of AC/DC Driver was 93-97% and
DC/DC converter was 94%. Thus, typical power conversion loss would be
combination of AC/DC conversion efficiency and DC/DC conversion efficiency. With
best scenario of this system, AC/DC Driver with efficiency of 97% and DC/DC
conversion efficiency of 94% would make the LED driver efficiency reaches 91.18%.
In this experiment, by using 24 loads of each trunk to supply 12 floors, the total power
out would be 192 W. Using 91.18% total driver efficiency, and cable power loss
between power consumed by LED lamp could be transformed to 210.57W. So that the
total efficiency would be 91.03% as follow;
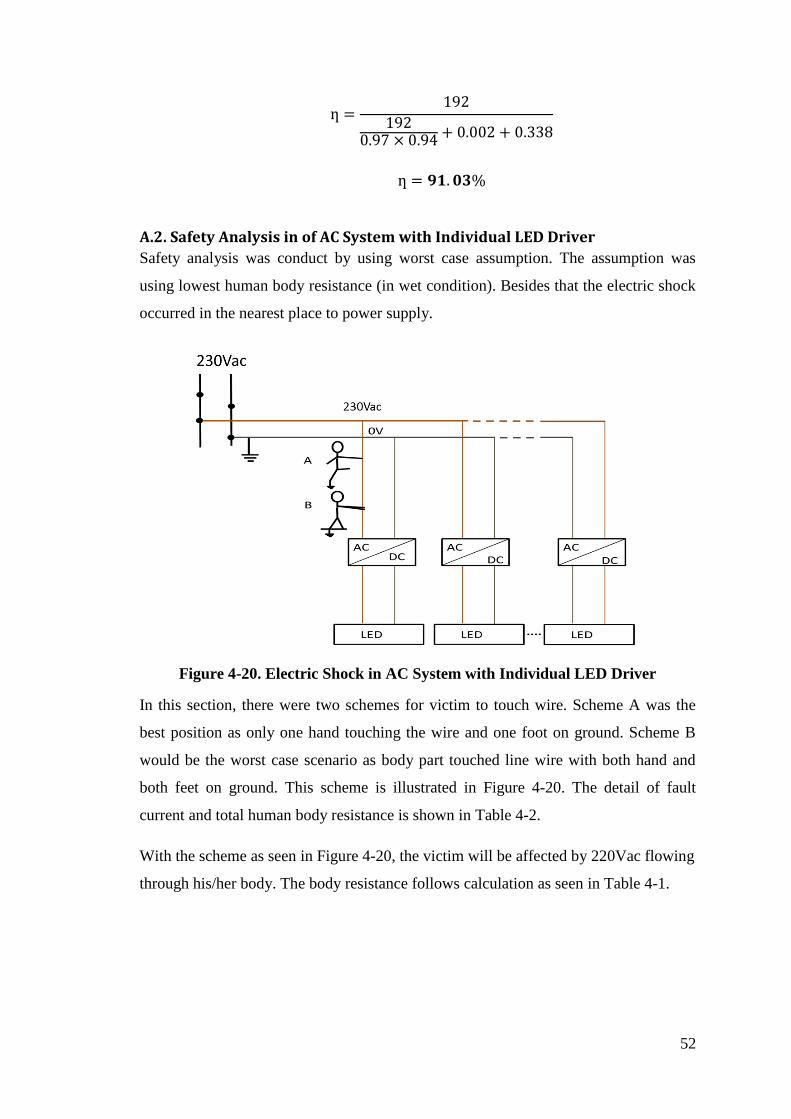
52
A.2. Safety Analysis in of AC System with Individual LED Driver
Safety analysis was conduct by using worst case assumption. The assumption was
using lowest human body resistance (in wet condition). Besides that the electric shock
occurred in the nearest place to power supply.
Figure 4-20. Electric Shock in AC System with Individual LED Driver
In this section, there were two schemes for victim to touch wire. Scheme A was the
best position as only one hand touching the wire and one foot on ground. Scheme B
would be the worst case scenario as body part touched line wire with both hand and
both feet on ground. This scheme is illustrated in Figure 4-20. The detail of fault
current and total human body resistance is shown in Table 4-2.
With the scheme as seen in Figure 4-20, the victim will be affected by 220Vac flowing
through his/her body. The body resistance follows calculation as seen in Table 4-1.
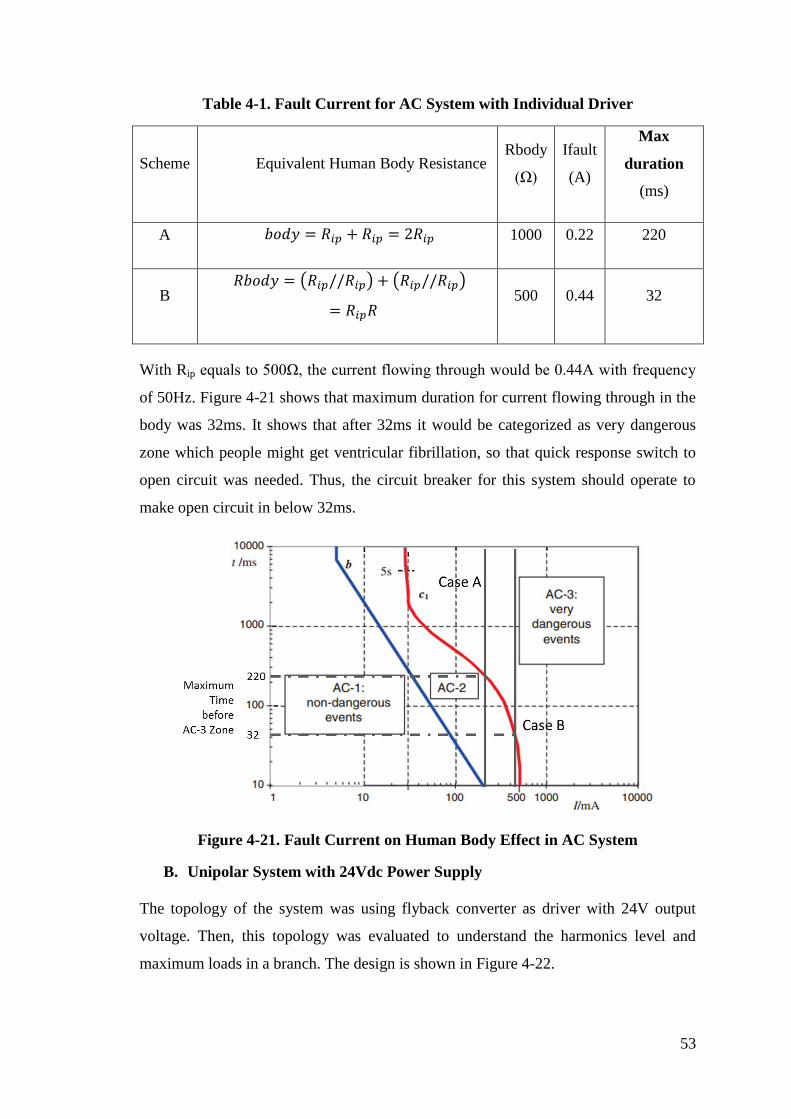
53
Table 4-1. Fault Current for AC System with Individual Driver
Scheme Equivalent Human Body Resistance Rbody
(Ω)
Ifault
(A)
Max
duration
(ms)
A 1000 0.22 220
B ( ) ( )
500 0.44 32
With Rip equals to 500Ω, the current flowing through would be 0.44A with frequency
of 50Hz. Figure 4-21 shows that maximum duration for current flowing through in the
body was 32ms. It shows that after 32ms it would be categorized as very dangerous
zone which people might get ventricular fibrillation, so that quick response switch to
open circuit was needed. Thus, the circuit breaker for this system should operate to
make open circuit in below 32ms.
Figure 4-21. Fault Current on Human Body Effect in AC System
B. Unipolar System with 24Vdc Power Supply
The topology of the system was using flyback converter as driver with 24V output
voltage. Then, this topology was evaluated to understand the harmonics level and
maximum loads in a branch. The design is shown in Figure 4-22.

54
Based on section 4.1., ELVDC of this system used 6%voltage drop regulation. By
using DC system in steady state as assumption, the reactive component of the cable
will not affect the system’s voltage drop. Then only resistive part of the system will
contribute to voltage drop. From Chapter 3, LED lamp has the similar character to
resistor. The equivalent circuit for the system is shown in Figure 4-23.
Figure 4-22. Unipolar 24V Driverless Topology
For the analysis the main trunk and branches was distinguished to have different value
of resistance. The resistances of the main trunk were labelled y and the resistances of
branches are labelled as x. Then, current flowing through circuit would have specific
value depending on load voltage level. Then the voltage drop in the last load of the
system relationship will follow equation (4.9), equation (4.10) and equation (4.11)
below.
( ) ( )
( ) ( ) (4.9)
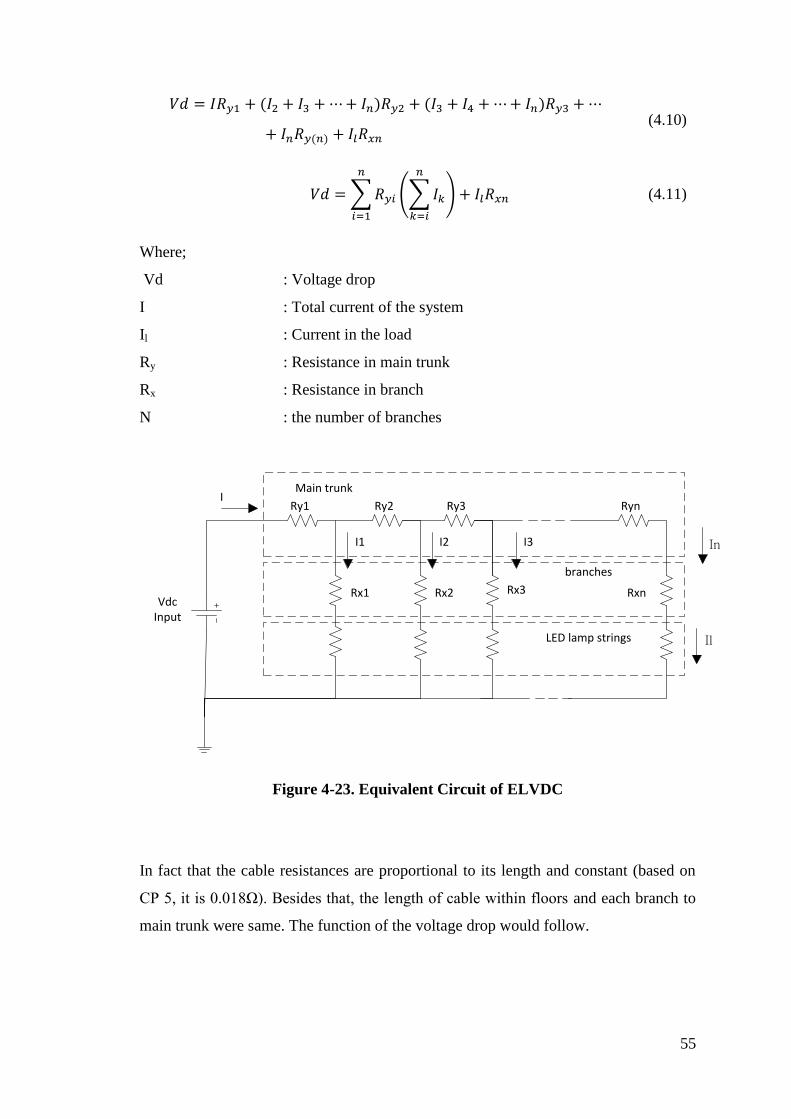
55
( ) ( )
( ) (4.10)
∑
(∑
) (4.11)
Where;
Vd : Voltage drop
I : Total current of the system
Il : Current in the load
Ry : Resistance in main trunk
Rx : Resistance in branch
N : the number of branches
Figure 4-23. Equivalent Circuit of ELVDC
In fact that the cable resistances are proportional to its length and constant (based on
CP 5, it is 0.018Ω). Besides that, the length of cable within floors and each branch to
main trunk were same. The function of the voltage drop would follow.
Vdc Input
Main trunk
Ry1 Ry2 Ry3 Ryn
branches
LED lamp strings
I1 I2 I3 In
I
Rx1 Rx2 Rx3 Rxn
Il
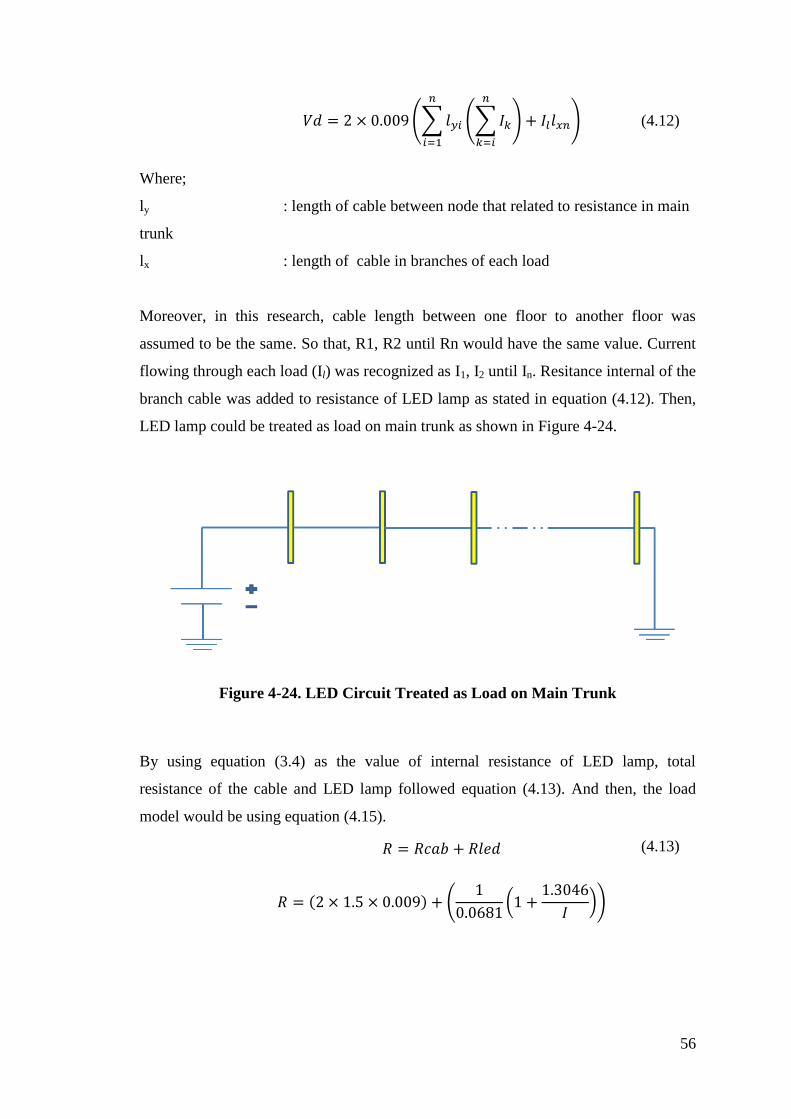
56
(∑
(∑
) ) (4.12)
Where;
ly : length of cable between node that related to resistance in main
trunk
lx : length of cable in branches of each load
Moreover, in this research, cable length between one floor to another floor was
assumed to be the same. So that, R1, R2 until Rn would have the same value. Current
flowing through each load (Il) was recognized as I1, I2 until In. Resitance internal of the
branch cable was added to resistance of LED lamp as stated in equation (4.12). Then,
LED lamp could be treated as load on main trunk as shown in Figure 4-24.
Figure 4-24. LED Circuit Treated as Load on Main Trunk
By using equation (3.4) as the value of internal resistance of LED lamp, total
resistance of the cable and LED lamp followed equation (4.13). And then, the load
model would be using equation (4.15).
(4.13)
( ) (
(
))
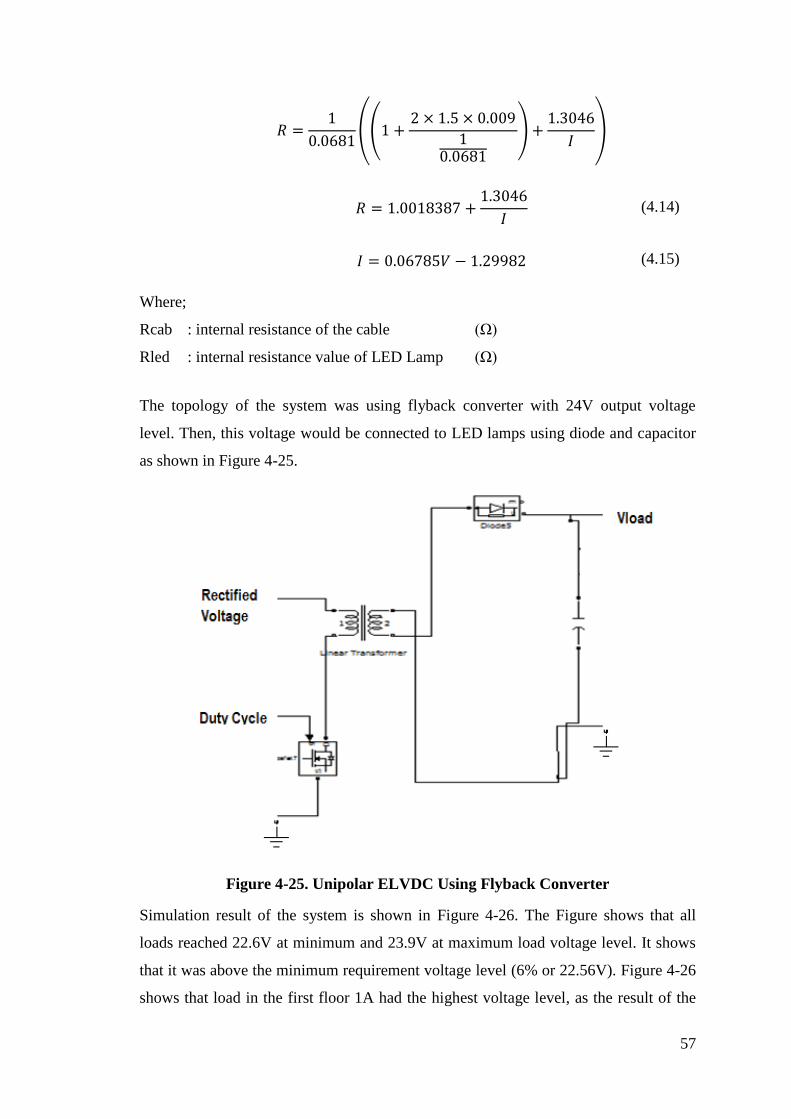
57
((
)
)
(4.14)
(4.15)
Where;
Rcab : internal resistance of the cable (Ω)
Rled : internal resistance value of LED Lamp (Ω)
The topology of the system was using flyback converter with 24V output voltage
level. Then, this voltage would be connected to LED lamps using diode and capacitor
as shown in Figure 4-25.
Figure 4-25. Unipolar ELVDC Using Flyback Converter
Simulation result of the system is shown in Figure 4-26. The Figure shows that all
loads reached 22.6V at minimum and 23.9V at maximum load voltage level. It shows
that it was above the minimum requirement voltage level (6% or 22.56V). Figure 4-26
shows that load in the first floor 1A had the highest voltage level, as the result of the
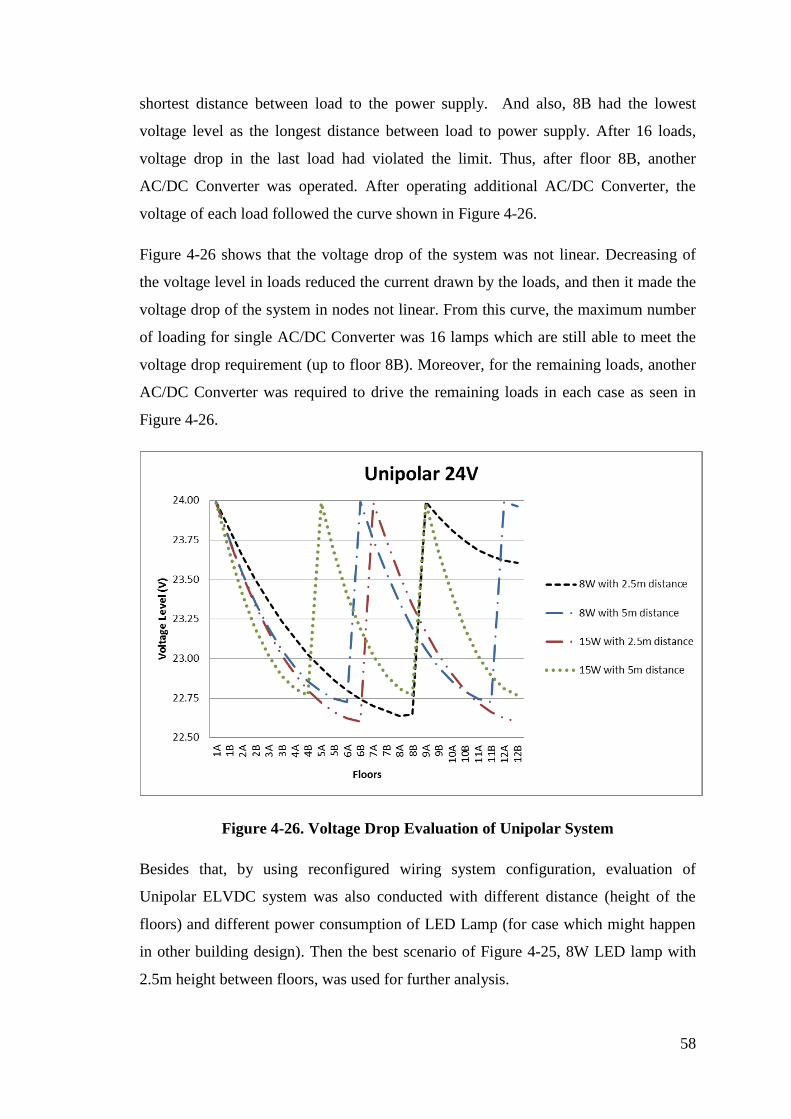
58
shortest distance between load to the power supply. And also, 8B had the lowest
voltage level as the longest distance between load to power supply. After 16 loads,
voltage drop in the last load had violated the limit. Thus, after floor 8B, another
AC/DC Converter was operated. After operating additional AC/DC Converter, the
voltage of each load followed the curve shown in Figure 4-26.
Figure 4-26 shows that the voltage drop of the system was not linear. Decreasing of
the voltage level in loads reduced the current drawn by the loads, and then it made the
voltage drop of the system in nodes not linear. From this curve, the maximum number
of loading for single AC/DC Converter was 16 lamps which are still able to meet the
voltage drop requirement (up to floor 8B). Moreover, for the remaining loads, another
AC/DC Converter was required to drive the remaining loads in each case as seen in
Figure 4-26.
Figure 4-26. Voltage Drop Evaluation of Unipolar System
Besides that, by using reconfigured wiring system configuration, evaluation of
Unipolar ELVDC system was also conducted with different distance (height of the
floors) and different power consumption of LED Lamp (for case which might happen
in other building design). Then the best scenario of Figure 4-25, 8W LED lamp with
2.5m height between floors, was used for further analysis.

59
B.1. Efficiency Evaluation of Unipolar ELVDC
Figure 4-27. Load Voltage Level in Unipolar System
Simulation result of the system is shown in Figure 4-26. The Figure shows that all
loads reached 22.6V at minimum and 23.9V at maximum load voltage level. It shows
that it was above the minimum requirement voltage level (6% or 22.56V). Figure 4-26
shows load in the first floor 1A will have highest voltage level as it will be the nearest
load to the power supply, and 8B will have the lowest voltage level as the furthest load
to power supply. Table A-3 shows the voltage level and power consumption for each
load in the system. It shows that lowest voltage level is 22.654V at load 8B.
In this experiment, by using 24 loads of each trunk to supply 12 floors, the total power
out was 158.73W. In other hand, total power supplied was 101.28W.The details of the
current of each load and the voltage drop is shown in Table A.3. Thus the efficiency is
calculated as follow;
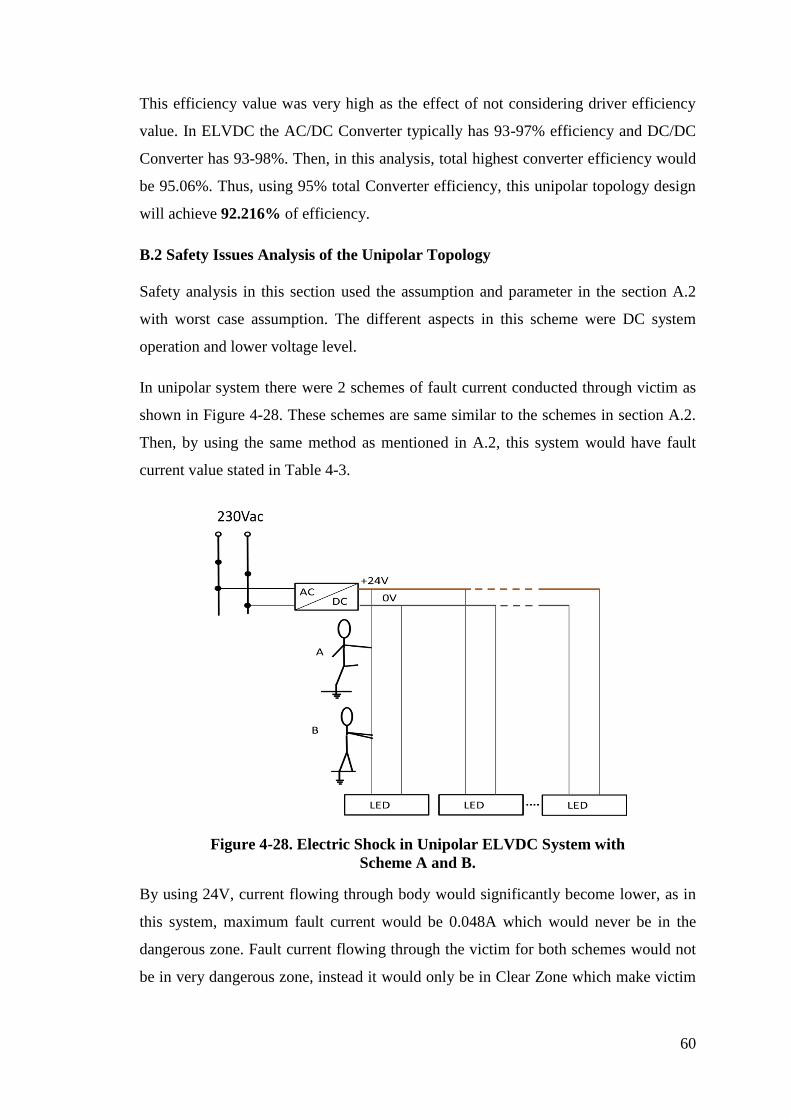
60
This efficiency value was very high as the effect of not considering driver efficiency
value. In ELVDC the AC/DC Converter typically has 93-97% efficiency and DC/DC
Converter has 93-98%. Then, in this analysis, total highest converter efficiency would
be 95.06%. Thus, using 95% total Converter efficiency, this unipolar topology design
will achieve 92.216% of efficiency.
B.2 Safety Issues Analysis of the Unipolar Topology
Safety analysis in this section used the assumption and parameter in the section A.2
with worst case assumption. The different aspects in this scheme were DC system
operation and lower voltage level.
In unipolar system there were 2 schemes of fault current conducted through victim as
shown in Figure 4-28. These schemes are same similar to the schemes in section A.2.
Then, by using the same method as mentioned in A.2, this system would have fault
current value stated in Table 4-3.
Figure 4-28. Electric Shock in Unipolar ELVDC System with
Scheme A and B.
By using 24V, current flowing through body would significantly become lower, as in
this system, maximum fault current would be 0.048A which would never be in the
dangerous zone. Fault current flowing through the victim for both schemes would not
be in very dangerous zone, instead it would only be in Clear Zone which make victim
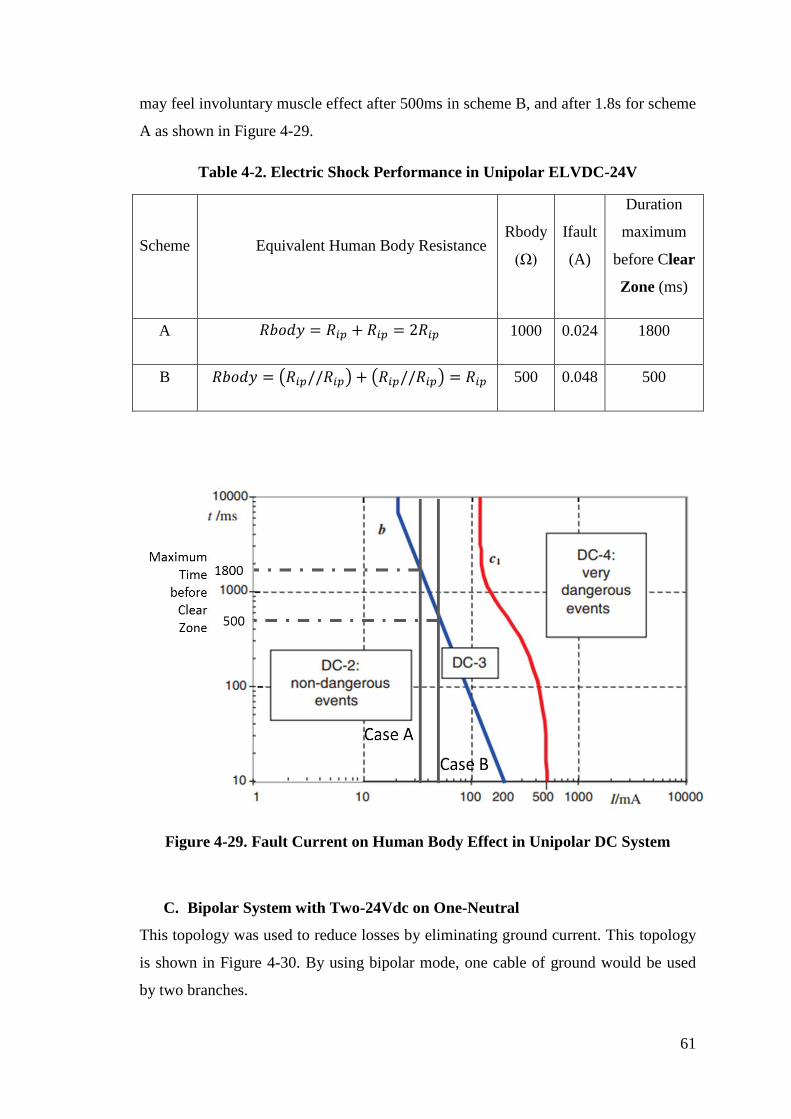
61
may feel involuntary muscle effect after 500ms in scheme B, and after 1.8s for scheme
A as shown in Figure 4-29.
Table 4-2. Electric Shock Performance in Unipolar ELVDC-24V
Scheme Equivalent Human Body Resistance Rbody
(Ω)
Ifault
(A)
Duration
maximum
before Clear
Zone (ms)
A 1000 0.024 1800
B ( ) ( ) 500 0.048 500
Figure 4-29. Fault Current on Human Body Effect in Unipolar DC System
C. Bipolar System with Two-24Vdc on One-Neutral
This topology was used to reduce losses by eliminating ground current. This topology
is shown in Figure 4-30. By using bipolar mode, one cable of ground would be used
by two branches.

62
Figure 4-30. Bipolar Topology for Driving LED Lamps
The topology of the system was using flyback converter with 48V output
voltage level. Then, this flyback converter’s output was divided to drive two
branches of LED lamps using diode and capacitor as shown in Figure 4-31.
Figure 4-31. Bipolar System Using Flyback Converter and Diode Clamping
C.1. Efficiency Evaluation of Bipolar ELVDC
Simulation result of the system is shown in Figure 4-31. The Figure shows that all
loads reached 22.6V at minimum and 23.9V at maximum load voltage level. It shows
that it was above the minimum requirement voltage level (6% or 22.56V). Figure 4-32
shows load in the first floor 1A would get the highest voltage level as the effect of
shortest distance from load to the power supply. Then, load at 15B would get the
lowest voltage level as the effect of longest distance from load to power supply. With
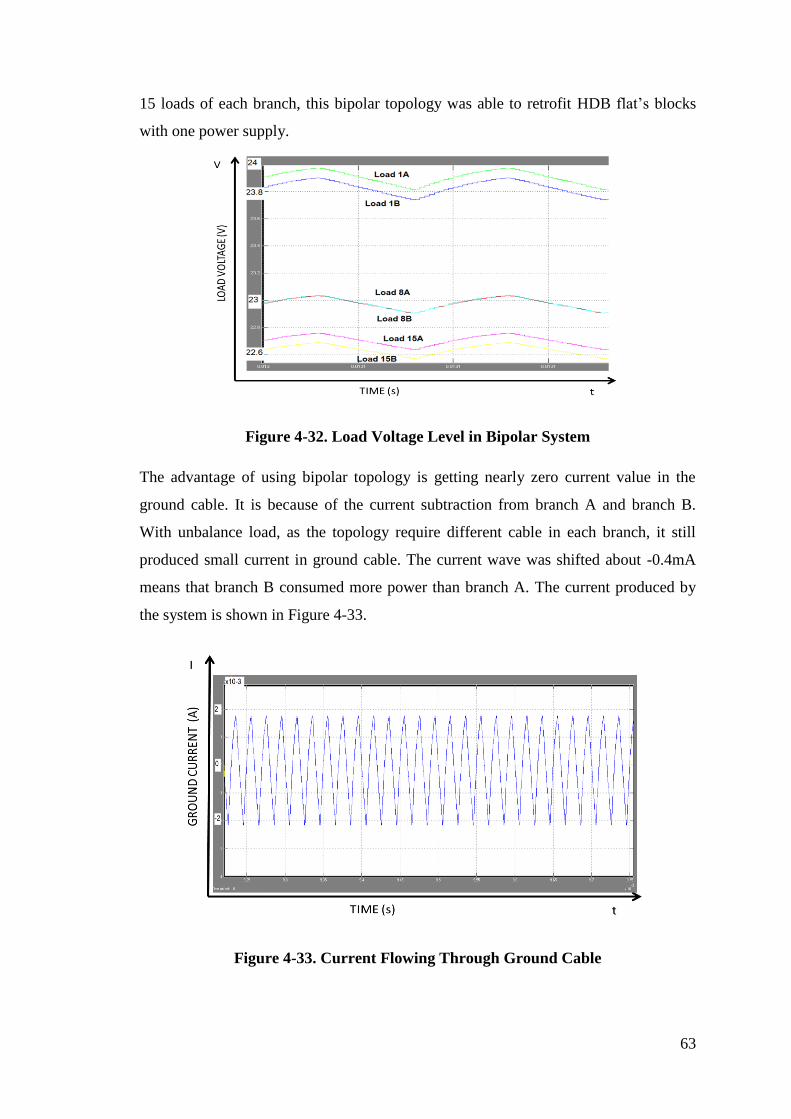
63
15 loads of each branch, this bipolar topology was able to retrofit HDB flat’s blocks
with one power supply.
Figure 4-32. Load Voltage Level in Bipolar System
The advantage of using bipolar topology is getting nearly zero current value in the
ground cable. It is because of the current subtraction from branch A and branch B.
With unbalance load, as the topology require different cable in each branch, it still
produced small current in ground cable. The current wave was shifted about -0.4mA
means that branch B consumed more power than branch A. The current produced by
the system is shown in Figure 4-33.
Figure 4-33. Current Flowing Through Ground Cable
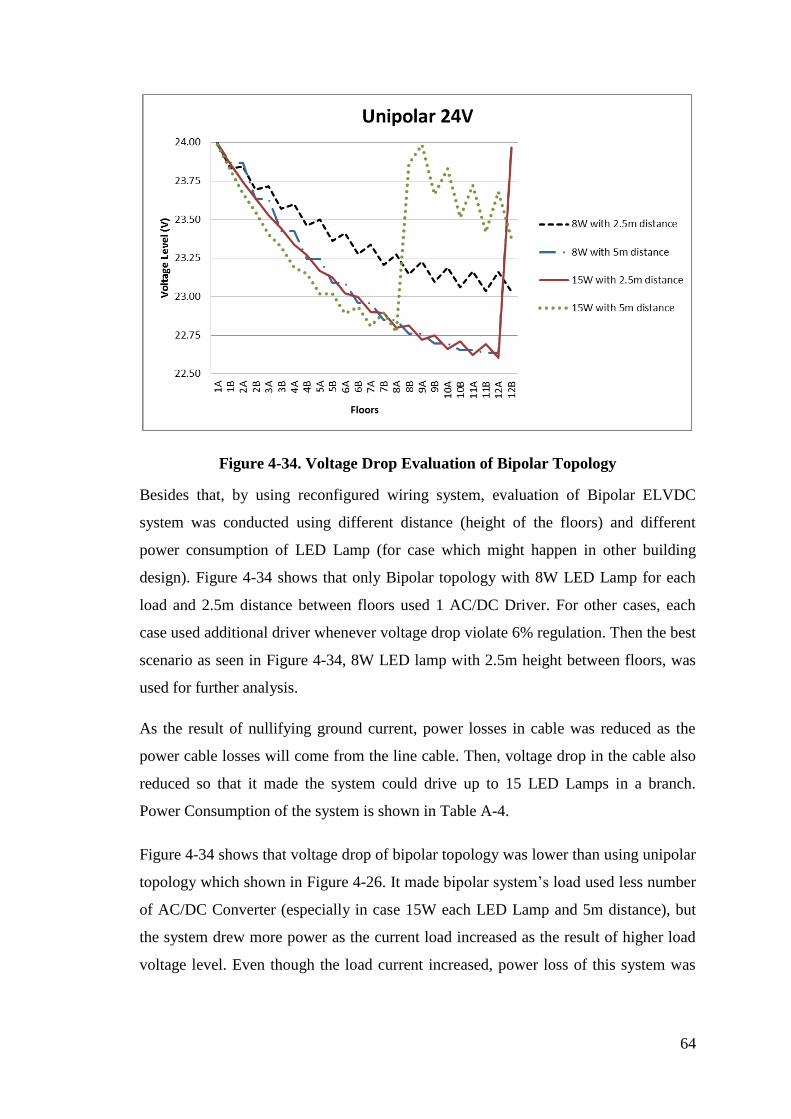
64
Figure 4-34. Voltage Drop Evaluation of Bipolar Topology
Besides that, by using reconfigured wiring system, evaluation of Bipolar ELVDC
system was conducted using different distance (height of the floors) and different
power consumption of LED Lamp (for case which might happen in other building
design). Figure 4-34 shows that only Bipolar topology with 8W LED Lamp for each
load and 2.5m distance between floors used 1 AC/DC Driver. For other cases, each
case used additional driver whenever voltage drop violate 6% regulation. Then the best
scenario as seen in Figure 4-34, 8W LED lamp with 2.5m height between floors, was
used for further analysis.
As the result of nullifying ground current, power losses in cable was reduced as the
power cable losses will come from the line cable. Then, voltage drop in the cable also
reduced so that it made the system could drive up to 15 LED Lamps in a branch.
Power Consumption of the system is shown in Table A-4.
Figure 4-34 shows that voltage drop of bipolar topology was lower than using unipolar
topology which shown in Figure 4-26. It made bipolar system’s load used less number
of AC/DC Converter (especially in case 15W each LED Lamp and 5m distance), but
the system drew more power as the current load increased as the result of higher load
voltage level. Even though the load current increased, power loss of this system was
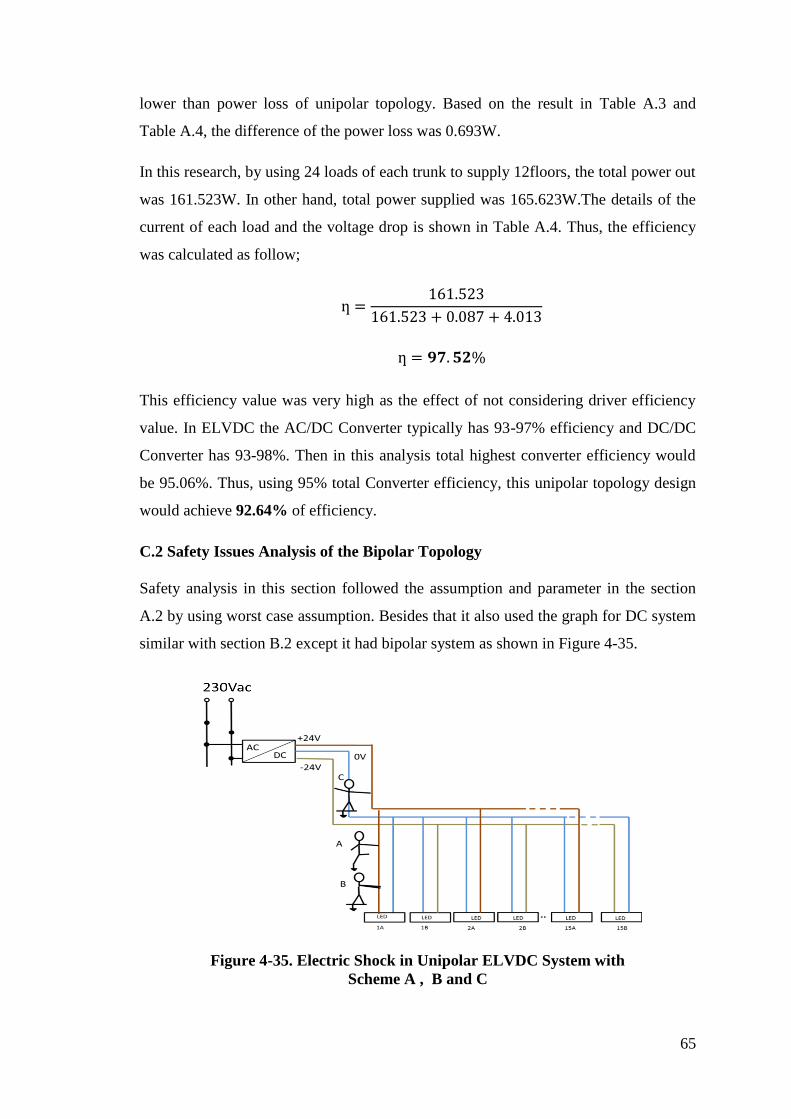
65
lower than power loss of unipolar topology. Based on the result in Table A.3 and
Table A.4, the difference of the power loss was 0.693W.
In this research, by using 24 loads of each trunk to supply 12floors, the total power out
was 161.523W. In other hand, total power supplied was 165.623W.The details of the
current of each load and the voltage drop is shown in Table A.4. Thus, the efficiency
was calculated as follow;
This efficiency value was very high as the effect of not considering driver efficiency
value. In ELVDC the AC/DC Converter typically has 93-97% efficiency and DC/DC
Converter has 93-98%. Then in this analysis total highest converter efficiency would
be 95.06%. Thus, using 95% total Converter efficiency, this unipolar topology design
would achieve 92.64% of efficiency.
C.2 Safety Issues Analysis of the Bipolar Topology
Safety analysis in this section followed the assumption and parameter in the section
A.2 by using worst case assumption. Besides that it also used the graph for DC system
similar with section B.2 except it had bipolar system as shown in Figure 4-35.
Figure 4-35. Electric Shock in Unipolar ELVDC System with
Scheme A , B and C

66
In Bipolar system there is another scheme that unavailable in unipolar. It is fault with
both hand touched both line. So that the voltage level applied to victim will be
doubled, but as the current path makes both hand in series connection, the resistance
becomes doubled.
Figure 4-36. Fault Current on Human Body Effect in Unipolar DC System
Table 4-3. Electric Shock Performance in Bipolar ELVDC-24V
Scheme Equivalent Human Body Resistance Rbody
(Ω)
Ifault
(A)
Duration
maximum
before Clear
Zone (ms)
A 1000 0.024 1800
B ( ) ( ) 500 0.048 500
C 1000 0.048 500
By using -24V,0, +24V, these three schemes shown in Figure 4-35 were
analysed. The analysis result then presented in Table 4-4 which shows that
maximum fault current would be 0.048A. It was the same to unipolar fault
current magnitude. Fault current flowing through the victim for both schemes
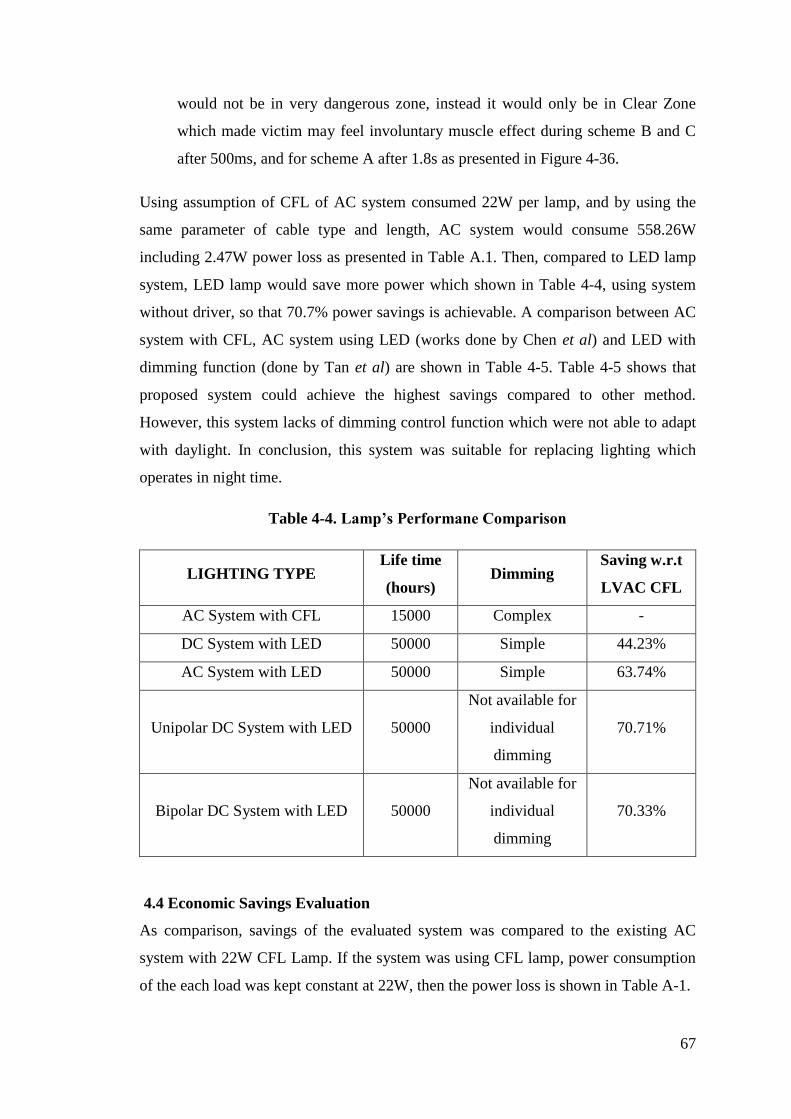
67
would not be in very dangerous zone, instead it would only be in Clear Zone
which made victim may feel involuntary muscle effect during scheme B and C
after 500ms, and for scheme A after 1.8s as presented in Figure 4-36.
Using assumption of CFL of AC system consumed 22W per lamp, and by using the
same parameter of cable type and length, AC system would consume 558.26W
including 2.47W power loss as presented in Table A.1. Then, compared to LED lamp
system, LED lamp would save more power which shown in Table 4-4, using system
without driver, so that 70.7% power savings is achievable. A comparison between AC
system with CFL, AC system using LED (works done by Chen et al) and LED with
dimming function (done by Tan et al) are shown in Table 4-5. Table 4-5 shows that
proposed system could achieve the highest savings compared to other method.
However, this system lacks of dimming control function which were not able to adapt
with daylight. In conclusion, this system was suitable for replacing lighting which
operates in night time.
Table 4-4. Lamp’s Performane Comparison
LIGHTING TYPE Life time
(hours) Dimming
Saving w.r.t
LVAC CFL
AC System with CFL 15000 Complex -
DC System with LED 50000 Simple 44.23%
AC System with LED 50000 Simple 63.74%
Unipolar DC System with LED 50000
Not available for
individual
dimming
70.71%
Bipolar DC System with LED 50000
Not available for
individual
dimming
70.33%
4.4 Economic Savings Evaluation
As comparison, savings of the evaluated system was compared to the existing AC
system with 22W CFL Lamp. If the system was using CFL lamp, power consumption
of the each load was kept constant at 22W, then the power loss is shown in Table A-1.

68
In this section, savings calculation of the evaluated systems was using an assumption
price of which the following year’s price would be similar to the electricity price in
2014. Electricity price in 2014 was 25.28cents per kWh [48].
For each staircase, this system’s savings for an hour could reach 394.74W per hour
with unipolar DC ELVDC System. Then, the savings could be translated to 9.98cents
per hour. If this system operated for 12 hour (from 18.30 pm to 6.30 am) then it would
save up to 119.75cents in a day. Assuming for a year usage, each staircase could save
the energy bills up to 437.01$. Using the same calculation method, LED with
individual driver could save 394$/year, and bipolar system could save 434.76$/year.
For the calculation purposes, this research used the evaluated LED lamp cost
45$/lamp, AC/DC driver cost 50$ and the assumed installation fee of 200$ per
staircase. By using simple pay-back period in equation (4.16), payback period for LED
using individual driver would be 4 years.
(4.16)
With the life time of LED lamp could be up to 50000 hours. By using only 12hours in
a day, then this system could be used for about 12 years. Where I, the interest rate of
banks, was 0.31% [48]. Then the present value was calculated using equation (4.17).
( ) (4.17)
( )
For the present value, it followed Present Value Function as stated in equation (4.18).

69
( )
(4.18)
Where A is annual cash flow, i is the interest rate and n is the life time of this system.
So that, the equivalent present value was
( )
Subsequently, the Net Present Value (NPV) at 12th
year of this system, which followed
equation (4.19), would be equal to;
(4.19)
For NPV calculation, as a comparison, LVAC using CFL was compared to ELVDC
using LED lamp. The assumption of CFL lamp’s life time was 15000hours or about
4years with price of 10$/lamp. However, ELVDC using LED lamp could sustain up to
12 years with price of 45$/lamp. Then, the comparison between them would be up to
12years, using discount rate of 0.31%, the effective period would be adjusted to
11.76years.
( )
( )
(4.20)
( )
( )
Table 4-5. Payback Period for Different Lighting Topologies
Topology
Install-
ation
fee ($)
n
Driver
Cost
($)
Lamp
Price
($)
Total
Invest-
ment
Cost ($)
Powe
r
Savin
g (W)
Saving
/day
(¢)
Saving
/
year
($)
Pay-
back
Perio
d
AC with
individual
200 24 12.57 45 1581.68 355.8 107.9 394 4.01
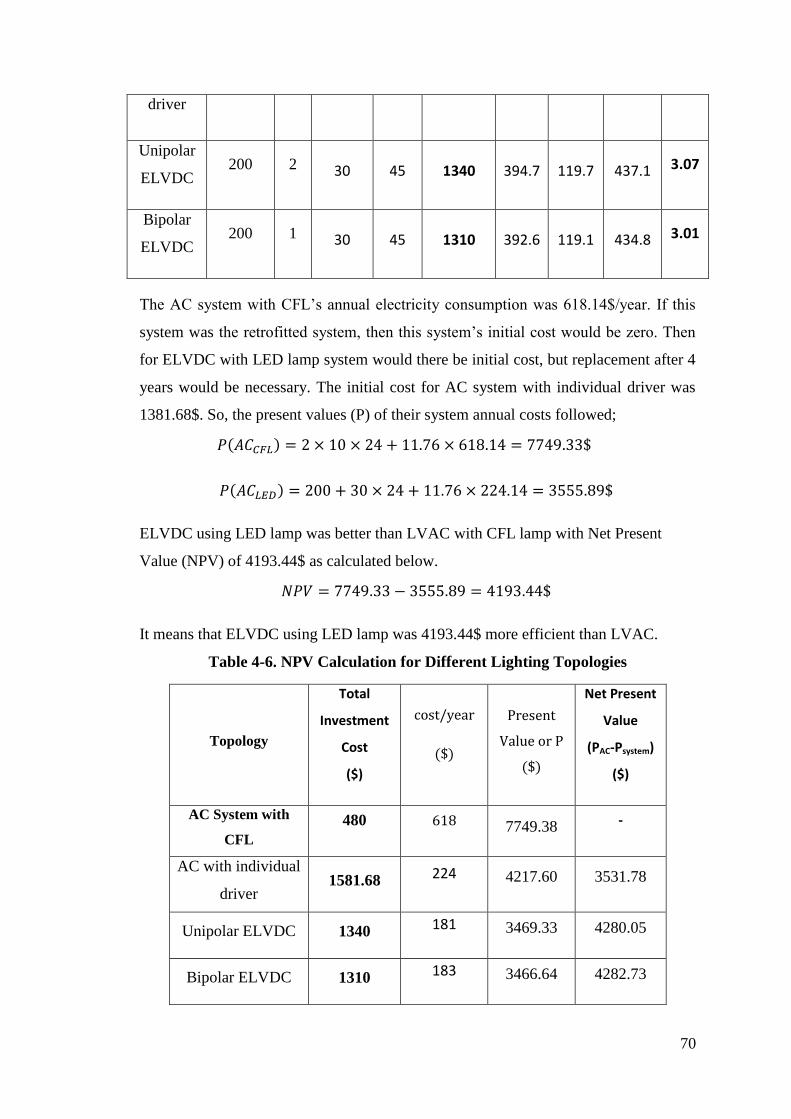
70
driver
Unipolar
ELVDC 200 2 30 45 1340 394.7 119.7 437.1 3.07
Bipolar
ELVDC 200 1 30 45 1310 392.6 119.1 434.8 3.01
The AC system with CFL’s annual electricity consumption was 18.14$/year. If this
system was the retrofitted system, then this system’s initial cost would be zero. Then
for ELVDC with LED lamp system would there be initial cost, but replacement after 4
years would be necessary. The initial cost for AC system with individual driver was
1381.68$. So, the present values (P) of their system annual costs followed;
( )
( )
ELVDC using LED lamp was better than LVAC with CFL lamp with Net Present
Value (NPV) of 4193.44$ as calculated below.
It means that ELVDC using LED lamp was 4193.44$ more efficient than LVAC.
Table 4-6. NPV Calculation for Different Lighting Topologies
Topology
Total
Investment
Cost
($)
cost/year
($)
Present
Value or P
($)
Net Present
Value
(PAC-Psystem)
($)
AC System with
CFL
480 618 7749.38 -
AC with individual
driver 1581.68
224 4217.60 3531.78
Unipolar ELVDC 1340 181 3469.33 4280.05
Bipolar ELVDC 1310 183 3466.64 4282.73

71
With n is the number of driver in the system, then using the same calculation using
equation (4.16), payback period for both Unipolar and Bipolar ELVDC system was
presented in Table 4-6. For Unipolar and Bipolar ELVDC System used the same price
scheme with AC System with individual driver. By using 11.76 years of PVF and
simple pay-back period in equation (4.16) to equation (4.20), Table 4-7 was generated
to show NPV for each the systems.
4.4. Summary
Retrofitting LVAC system to ELVDC system was challenging. Some factors must be
put in consideration, such as the feasibility of loading, feasibility of not violating
voltage drop regulation, and reduce energy consumption. In this research, ELVDC was
feasible to replace LVAC in lighting system case with some limitation. Main supply of
ELVDC needed to be positioned as close as possible to loads to maintain the voltage.
In the case of 100W loading, 18.9m will be the maximum distance. Besides that,
maximum loading would be restricted. Moreover, using suitable rectifier might give
more benefit with regard to rectifier efficiency, because the performance of rectifier
with low loading might not reach the maximum rectifier efficiency.
Table 4-7. Summary of Topology Comparison for LED Lighting System
Topology
Cable
Power
Loss
(W)
Ƞ
(%)
Worst
Case for
Safety
Lamp
Price
($)
Pay-
back
Period
Saving
w.r.t
AC
system
Saving/
day (¢)
AC with
individual
driver
2.5 91.03 Very
Dangerous 45 4.01 63.74% 107.9
Unipolar
ELVDC 4.7 92.22 Clear
Zone 45 3.07 70.71% 119.7
Bipolar
ELVDC 4.1 92.65 Clear
Zone 45 3.01 70.33% 119.1
From simulation harmonic of rectifier could be reduced by using passive filter in
supply side. By choosing high capacitor value, small voltage ripple could be achieved
72
and as the loads of the system was LED Lamp output current followed the waveform
of output voltage of flyback converter. Thus, main harmonic source was the AC/DC
driver itself.
According to efficiency evaluation, the highest efficiency of the system was achieved
by AC system with individual driver for LED. This topology had only 2.5W cable
power loss, meanwhile Unipolar ELVDC topology had 4.7W cable power loss, and
then Bipolar topology had 4.1W cable power loss. It shows that AC system with
higher voltage level than DC voltage may gain benefit of smaller cable power loss.
In other hand, AC system with higher voltage level might cause very dangerous
consequences for people as discussed above. For ELVDC, both system Unipolar and
Bipolar did not injure people with serious damage. The maximum effect would be
only involuntary muscle in a much longer period than AC system.
From economic analysis, ELVDC using LED lamp was proven to have better
performance compared to LVAC using CFL lamp system. According to Table 4-7
bipolar topology gave the highest savings in a 12-year run. Moreover, the retrofitting
strategy reduced the complexity of installation process and costs. Table 4-8 was
presented to summarize the research in Chapter 4.

73
Chapter 5
5. Conclusion and Future Work
5.1 Conclusion
Based on the efforts, we conclude that ELVDC with LED lamp for lighting system
could achieve higher energy efficiency, longer system lifetime and ease of integration
with common LVAC infrastructure in buildings. Thus, retrofitting existing electrical
system to ELVDC becomes a more feasible solution for cost effectiveness.
The selected LED lamp had high efficacy and 120⁰ angle of light distribution. This
lamp consumed 7.92 watts at rated voltage and produced high illuminance level at task
area level. The design with cover could protect LED lamp from external disturbances
that could reduce lamp’s life time. The equivalent of internal resistance of this lamp
was function of current. This approach simplified the system’s voltage drop
calculation by adding cable resistance with lamp’s internal resistance. Voltage drop of
the system was a non-linear function for the whole system depending on the number of
loads.
Main supply of ELVDC system required to be placed as close as possible to loads to
reduce cable loss. The load current was accumulated through the main trunk, so that
node to node voltage drop between main supply to the first load was the highest cable
voltage drop. Because of retrofitting purpose, changing the cable to bigger size was
anticipated; therefore, reducing the length of cable would be the best possible solution.
By using LED lamp, 63.74-70.7% savings was achievable. However, driverless
ELVDC did not provide individual dimming control function which could not adapt to
daylight condition. In conclusion, this system would be suitable for replacing lighting
which operates in night time.
By doing economic analysis, this retrofitting CFL lamp to LED lamp was considered
to be prospective project. This project required less than 4 years for the pay-back
period while using ELVDC System. Besides that, the ELVDC system’s Net Present

74
Value shows that ELVDC system would give more savings of 4282.73$ in 12 years,
compared to LVAC with CFL lamp.
The feature of low voltage level in ELVDC gave more benefits in terms of safety
without compromising cable power loss. When the voltage level of AC system was
high enough, it may make people to get ventricular fibrillation which may lead to
death. In contrast, by using ELVDC system people would not be in a danger with
worst possible scenario would only put people in clear zone. It means that ELVDC
could be promising solution to reduce energy in lighting sector for building with
additional benefit of safety reason.
5.2 Recommendations for Future Work
The implementation of ELVDC in this work focuses on migration of LVAC to
ELVDC for lighting system application. Moreover, the implementation of ELVDC
was aimed to retrofit lighting system specifically in common area without using any
dimming control. In order to get more understanding of ELVDC implementation in
building lighting system, more efforts are needed, including:
1. Investigated lamp in this work was aimed to meet the minimum requirements
with least power consumption. Therefore, in other applications, another lamp
types may be applied. Thus the equation (3.3) needs to be reconsidered
accordingly following the lamp characteristics.
2. It is known that dimming control may give more savings in lighting system.
Therefore, the centralized dimming control for ELVDC topologies design
needs to be investigated in the future.
3. Renewable energy resources have been understood to give more advantages
when integrated in DC system. Hence, integration of renewable energy
resources with ELVDC for building lighting system needs to be researched.
75
References
1. Energy, U.S.D.o. EIA projects world energy consumption will increase 56% by
2040. 2013; Available from:
http://www.eia.gov/todayinenergy/detail.cfm?id=12251.
2. Authority, E.M., Singapore Energy Statistic 2014. 2014, Energy Market
Authority: 991G Alexandra Road #01-29 Singapore 119975.
3. Board, H.D. Public Housing in Singapore. 2014; Available from:
https://www.hdb.gov.sg/.
4. Dykes, G.C.F.P.J.P.A.D.D.G.J.B.C.H.P.S.D., Smart Building for Healthy and
Sustainable Workplaces : Scoping Study, in 2002-043-B. 2003.
5. Pinomaa, A., J. Ahola, and A. Kosonen, PLC Concept for LVDC Distribution
Systems. Communications Magazine, IEEE, 2011. 49(12): p. 55-63.
6. Tan, Y.K., T.P. Huynh, and Z.Z. Wang, Smart Personal Sensor Network
Control for Energy Saving in DC Grid Powered LED Lighting System. Smart
Grid, IEEE Transactions on, 2012. PP(99): p. 1-8.
7. Singapore, S., Code of Practice for Lighting of Workplace. 2006: 2 Bukit
Merah Central, Singapore 159835.
8. Tregenza, P. and D. Loe, The Design of Lighting, second edition. 2013: Taylor
& Francis.
9. Singapore, S., Code of Practice for Ligthing of Work Places, in Part 1 Indoor.
2006, SPRING Singapore: 2 Bukit Merah Central, Singapore.
10. Chen, K., New Concepts in Interior Lighting Design. Industry Applications,
IEEE Transactions on, 1984. IA-20(5): p. 1179-1184.
11. Muhamad, W.N.W., et al. Energy Efficient Lighting System Design for
Building. in Intelligent Systems, Modelling and Simulation (ISMS), 2010
International Conference on. 2010.
12. Winder, S., Power Supplies for LED Driving. Elsevier.
13. Peng, Y.H., et al. Characteristics of Superlattice LED with a
Si<sub>0.8</sub>Ge<sub>0.2</sub> or Si Capped Layer at Room
Temperature. in SiGe Technology and Device Meeting, 2006. ISTDM 2006.
Third International. 2006.
14. Narendran, N. and Y. Gu, Life of LED-based white light sources. Display
Technology, Journal of, 2005. 1(1): p. 167-171.
15. Choi, J., H.-S. Han, and K. Lee, A Current-Sourced LED Driver Compatible
with Fluorescent Lamp Ballasts. Power Electronics, IEEE Transactions on,
2014. PP(99): p. 1-1.
16. Chun-An, C., C. Hung-liang, and C. Tsung-Yuan, A Novel Single-Stage High-
Power-Factor LED Street-Lighting Driver With Coupled Inductors. Industry
Applications, IEEE Transactions on, 2014. 50(5): p. 3037-3045.
17. Weiss, B. Lighting for Life. 2010 [cited 2015 24th June]; Available from:
http://www.digikey.com/en/articles/techzone/2010/dec/lighting-for-life.
18. Shu, W., et al., A Flicker-Free Electrolytic Capacitor-Less AC-DC LED
Driver. Power Electronics, IEEE Transactions on, 2012. 27(11): p. 4540-4548.
19. Albertsen, A. Electrolytic Capacitor Lifetime Estimation. 2010 [cited 2015
25th June]; Available from: http://jianghai-
america.com/uploads/technology/JIANGHAI_Elcap_Lifetime_-
_Estimation_AAL.pdf.
76
20. Modepalli, K. and L. Parsa. A scalable HB-LED driver for multi-color
Adaptive lighting systems. in Applied Power Electronics Conference and
Exposition (APEC), 2015 IEEE. 2015.
21. Robert Erickson, M.M., Sigmund Singer. Design of a Simple High-Power-
Factor Rectifier Based on the Flyback Converter. Available from:
http://ecee.colorado.edu/ecen4517/exp/project/APEC90.pdf.
22. Jovanovic, M.M. and J. Yungtaek, State-of-the-art, single-phase, active power-
factor-correction techniques for high-power applications - an overview.
Industrial Electronics, IEEE Transactions on, 2005. 52(3): p. 701-708.
23. Nussbaumer, T., K. Raggl, and J.W. Kolar, Design Guidelines for Interleaved
Single-Phase Boost PFC Circuits. Industrial Electronics, IEEE Transactions
on, 2009. 56(7): p. 2559-2573.
24. Huang-Jen, C., et al., A High-Efficiency Dimmable LED Driver for Low-Power
Lighting Applications. Industrial Electronics, IEEE Transactions on, 2010.
57(2): p. 735-743.
25. Lamar, D.G., et al., Design-Oriented Analysis and Performance Evaluation of
a Low-Cost High-Brightness LED Driver Based on Flyback Power Factor
Corrector. Industrial Electronics, IEEE Transactions on, 2013. 60(7): p. 2614-
2626.
26. Mohan, N., T.M. Undelan, and W.P. Robbins, Converters, Applications, and
Designs, in Power Electronics John Wiley & Sons Inc.: New York
27. Mohan, N. and T.M. Undeland, Power electronics: converters, applications,
and design. 2007: Wiley India.
28. Erickson, R.W., Fundamentals of Power Electronics. 1997, New York:
Chapman and Hall.
29. Semiconductor, F. Application Note 42047 Power Factor Correction (PFC)
Basics. 2004; Available from: https://www.fairchildsemi.com/application-
notes/AN/AN-42047.pdf.
30. Abdel-Rahman, S., F. Stückler, and K. Siu, PFC Boost Converter Design
Guide. 2015, Infineon Technologies AG: Munich, Germany.
31. Standards, I., ed. Code of Practice for Low and Extra Low Voltage Direct
Current Power Distribution in Buildings. 2015, IET Standards.
32. Standard, B., A Practical Guide to the Wiring Regulations. 2008, Geoffrey
Stokes and John Bradley.
33. Burt;, A.S.E.G.M., Protecting the last mile – enabling an LVDC distribution
network. 2013.
34. Cisco. Power over Ethernet (PoE) Power Requirements FAQ. 2008
30/12/2014]; Available from:
http://www.cisco.com/c/en/us/support/docs/voice-unified-
communications/unified-ip-phone-7900-series/97869-poe-requirement-faq.pdf.
35. Borioli, E., et al. Comparison between the electrical capabilities of the cables
used in LV AC and DC power lines. in Harmonics and Quality of Power, 2004.
11th International Conference on. 2004.
36. Gi-Hyeon, G., et al. Analysis of efficiency for AC and DC load in LVDC
distribution system. in Developments in Power System Protection (DPSP
2014), 12th IET International Conference on. 2014.
37. Chen, N. and H.S.H. Chung. A driving technology for retrofit LED lamp for
fluorescent lighting fixtures with electronic ballasts. in Energy Conversion
Congress and Exposition (ECCE), 2010 IEEE. 2010.
77
38. Poli, M.C.D., Electric Shock and Protective Measures. 2014, Wiley-IEEE
Press.
39. Hintz, H. Protection against Electric Shock. in Telecommunications
Conference, 2005. INTELEC '05. Twenty-Seventh International. 2005.
40. Fangming, R., et al. Human body impedance model and human age
dependence of dielectric properties. in Antennas Propagation and EM Theory
(ISAPE), 2010 9th International Symposium on. 2010.
41. Hernandez, J.C. and P.G. Vidal, Guidelines for Protection Against Electric
Shock in PV Generators. Energy Conversion, IEEE Transactions on, 2009.
24(1): p. 274-282.
42. Bernstein, T., Electrical shock hazards and safety standards. Education, IEEE
Transactions on, 1991. 34(3): p. 216-222.
43. Electric, S., Electrical Installation Guide 2009. 2009, Les Deux: Ponts, France.
44. Cheng, Y.K. and K.W.E. Cheng. General Study for using LED to replace
traditional lighting devices. in Power Electronics Systems and Applications,
2006. ICPESA '06. 2nd International Conference on. 2006.
45. Rectifier Design and Analysis. [cited 2016 8 April ]; Available from:
http://www.bwcelectronics.com/articles/WP10A190.PDF
46. Shrivastava, A., Shingh, B. Improved Power Quality Based High Brightness
LED Lamp Driver. IJEST, 2012. 4(1): p.135-141.
47. SERVICES, S. Media Release: "Electricity Tariff Revision for The Period 1
October to 31 December 2014". 2014 [cited 2014 20 November 2014];
Available from:
http://www.singaporepower.com.sg/irj/go/km/docs/wpccontent/Sites/SP%20Se
rvices/Site%20Content/Tariffs/documents/latest_press_release.pdf.
48. Interest Rates of Banks and Finance Companies. [cited 2014 20 November ];
Available from:
https://secure.mas.gov.sg/msb/InterestRatesOfBanksAndFinanceCompanies.as
px.

78
APENDIX
Simulation result for LED Lighting System :
1. AC System with CFL Lamp
Table A. 1. Power Consumption of CFL Lighting System Using AC System
Floor Voltage
Node (V)
V load
(V)
Load
Current
(A)
Voltage
drop
Node (V)
Power
Loss
Node to
Loads
(W)
Power
Loss
Node to
Node
(W)
Power
Loss Node
to Loads
(W)
1A 220.000 219.997 0.10526 0.003 22.000 0.0003 0.00030
1B 219.997 219.994 0.10526 0.009 22.000 0.0003 0.00199
2A 219.988 219.985 0.10527 0.014 22.000 0.0003 0.00449
2B 219.973 219.971 0.10528 0.019 22.000 0.0003 0.00798
3A 219.955 219.952 0.10528 0.024 22.000 0.0003 0.01247
3B 219.931 219.928 0.10530 0.028 22.000 0.0003 0.01795s
4A 219.902 219.900 0.10531 0.033 22.000 0.0003 0.02444
4B 219.869 219.866 0.10533 0.038 22.000 0.0003 0.03193
5A 219.831 219.829 0.10534 0.043 22.000 0.0003 0.04041
5B 219.789 219.786 0.10536 0.047 22.000 0.0003 0.04990
6A 219.741 219.738 0.10539 0.052 22.000 0.0003 0.06038
6B 219.689 219.686 0.10541 0.057 22.000 0.0003 0.07187
7A 219.632 219.629 0.10544 0.062 22.000 0.0003 0.08437
7B 219.571 219.568 0.10547 0.066 22.000 0.0003 0.09786
8A 219.504 219.501 0.10550 0.071 22.000 0.0003 0.11237
8B 219.433 219.430 0.10554 0.076 22.000 0.0003 0.12788
9A 219.357 219.355 0.10557 0.081 22.000 0.0003 0.14440
9B 219.277 219.274 0.10561 0.085 22.000 0.0003 0.16192

79
10A 219.191 219.189 0.10565 0.090 22.000 0.0003 0.18046
10B 219.101 219.098 0.10569 0.095 22.000 0.0003 0.20002
11A 219.006 219.004 0.10574 0.100 22.000 0.0003 0.22058
11B 218.907 218.904 0.10579 0.104 22.000 0.0003 0.24217
12A 218.802 218.800 0.10584 0.109 22.000 0.0003 0.26477
12B 218.693 218.690 0.10589 0.114 22.000 0.0003 0.28839
TOTAL 528 0.0072 2.44929
2. AC System with LED Lamp
Table A. 2. Power Consumption of AC System with LED Driver
Floor Voltage
Node (V)
V load
(V)
Load
Current
(A)
Voltage
drop
Node (V)
Power
Loss
Node to
Loads
(W)
Power
Loss
Node to
Node
(W)
Power
Loss Node
to Loads
(W)
1A 220.000 219.997 0.040 0.042 8.000 0.00007 0.00030
1B 219.957 219.956 0.040 0.040 8.000 0.00007 0.00199
2A 219.917 219.916 0.040 0.038 8.000 0.00007 0.00449
2B 219.879 219.877 0.040 0.036 8.000 0.00007 0.00798
3A 219.843 219.841 0.040 0.035 8.000 0.00007 0.01247
3B 219.808 219.806 0.040 0.033 8.000 0.00007 0.01795s
4A 219.776 219.774 0.040 0.031 8.000 0.00007 0.02444
4B 219.745 219.743 0.040 0.029 8.000 0.00007 0.03193
5A 219.716 219.714 0.040 0.027 8.000 0.00007 0.04041
5B 219.688 219.686 0.040 0.025 8.000 0.00007 0.04990
6A 219.663 219.661 0.040 0.024 8.000 0.00007 0.06038
6B 219.639 219.637 0.040 0.022 8.000 0.00007 0.07187
7A 219.617 219.616 0.040 0.020 8.000 0.00007 0.08437
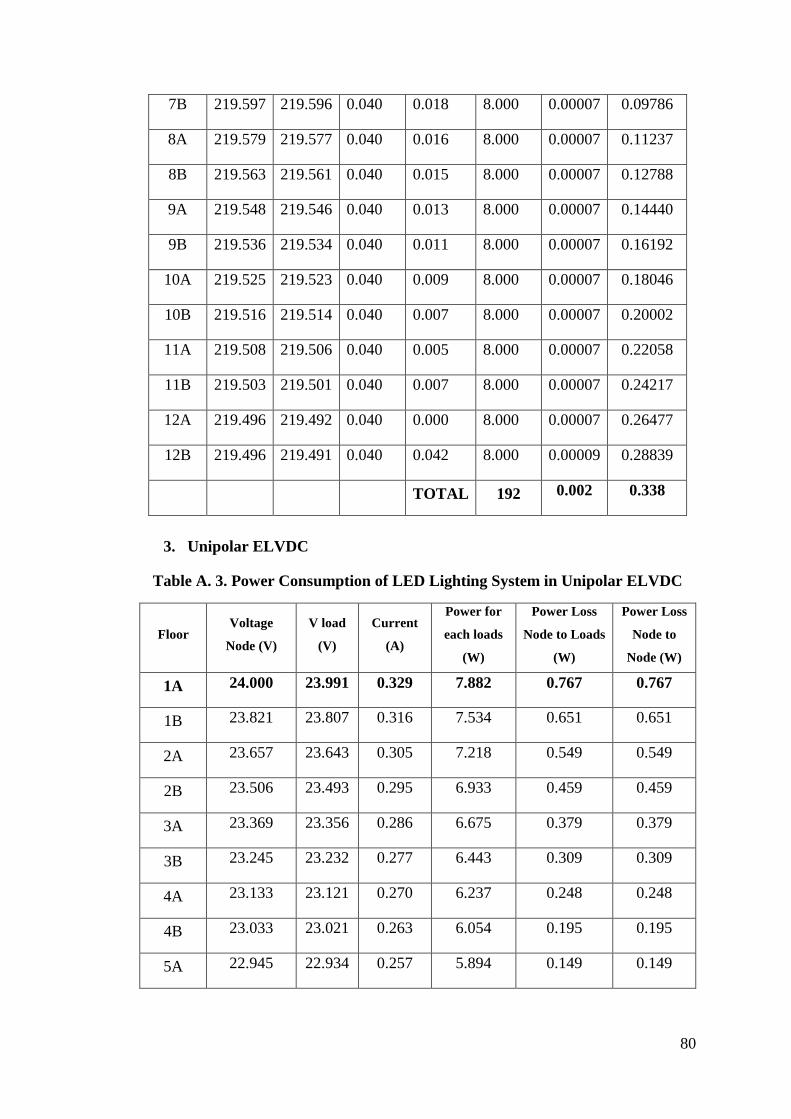
80
7B 219.597 219.596 0.040 0.018 8.000 0.00007 0.09786
8A 219.579 219.577 0.040 0.016 8.000 0.00007 0.11237
8B 219.563 219.561 0.040 0.015 8.000 0.00007 0.12788
9A 219.548 219.546 0.040 0.013 8.000 0.00007 0.14440
9B 219.536 219.534 0.040 0.011 8.000 0.00007 0.16192
10A 219.525 219.523 0.040 0.009 8.000 0.00007 0.18046
10B 219.516 219.514 0.040 0.007 8.000 0.00007 0.20002
11A 219.508 219.506 0.040 0.005 8.000 0.00007 0.22058
11B 219.503 219.501 0.040 0.007 8.000 0.00007 0.24217
12A 219.496 219.492 0.040 0.000 8.000 0.00007 0.26477
12B 219.496 219.491 0.040 0.042 8.000 0.00009 0.28839
TOTAL 192 0.002 0.338
3. Unipolar ELVDC
Table A. 3. Power Consumption of LED Lighting System in Unipolar ELVDC
Floor Voltage
Node (V)
V load
(V)
Current
(A)
Power for
each loads
(W)
Power Loss
Node to Loads
(W)
Power Loss
Node to
Node (W)
1A 24.000 23.991 0.329 7.882 0.767 0.767
1B 23.821 23.807 0.316 7.534 0.651 0.651
2A 23.657 23.643 0.305 7.218 0.549 0.549
2B 23.506 23.493 0.295 6.933 0.459 0.459
3A 23.369 23.356 0.286 6.675 0.379 0.379
3B 23.245 23.232 0.277 6.443 0.309 0.309
4A 23.133 23.121 0.270 6.237 0.248 0.248
4B 23.033 23.021 0.263 6.054 0.195 0.195
5A 22.945 22.934 0.257 5.894 0.149 0.149

81
5B 22.869 22.858 0.252 5.756 0.110 0.110
6A 22.804 22.793 0.247 5.639 0.078 0.078
6B 22.750 22.739 0.244 5.543 0.051 0.051
7A 22.707 22.696 0.241 5.467 0.031 0.031
7B 22.675 22.664 0.239 5.409 0.015 0.015
8A 22.654 22.643 0.237 5.372 0.000 0.000
8B 22.654 22.637 0.237 5.364 0.000 0.000
9A 24.000 23.985 0.329 7.880 0.244 0.244
9B 23.902 23.888 0.322 7.690 0.180 0.180
10A 23.819 23.805 0.316 7.529 0.127 0.127
10B 23.750 23.736 0.312 7.397 0.084 0.084
11A 23.695 23.681 0.308 7.291 0.050 0.050
11B 23.654 23.640 0.305 7.213 0.025 0.025
12A 23.627 23.161 0.303 7.161 0.004 0.000
12B 23.627 23.035 0.303 7.150 0.007 0.000
TOTAL 158.733 0.090 4.703
4. Bipolar ELVDC
Table A. 4. Power Consumption of LED Lighting System in Bipolar ELVDC
Floor Voltage
Node (V)
V load
(V)
Current
(A)
Power for
each loads
(W)
Power Loss
Node to Loads
(W)
Power Loss
Node to
Node (W)
1A 24.000 24.000 0.329 7.886 0.000 0.501
1B 23.847 23.833 0.318 7.584 0.005 0.470
2A 23.857 23.843 0.319 7.603 0.005 0.409
2B 23.709 23.695 0.309 7.317 0.004 0.383
3A 23.728 23.714 0.310 7.355 0.004 0.328
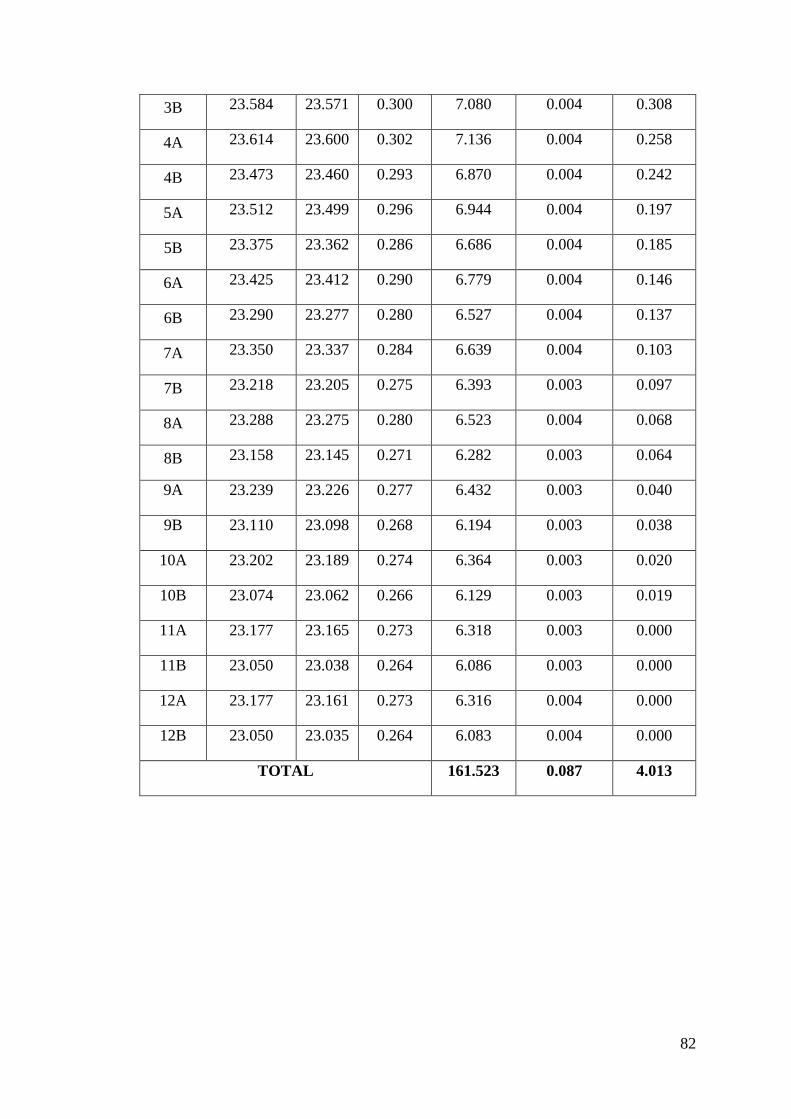
82
3B 23.584 23.571 0.300 7.080 0.004 0.308
4A 23.614 23.600 0.302 7.136 0.004 0.258
4B 23.473 23.460 0.293 6.870 0.004 0.242
5A 23.512 23.499 0.296 6.944 0.004 0.197
5B 23.375 23.362 0.286 6.686 0.004 0.185
6A 23.425 23.412 0.290 6.779 0.004 0.146
6B 23.290 23.277 0.280 6.527 0.004 0.137
7A 23.350 23.337 0.284 6.639 0.004 0.103
7B 23.218 23.205 0.275 6.393 0.003 0.097
8A 23.288 23.275 0.280 6.523 0.004 0.068
8B 23.158 23.145 0.271 6.282 0.003 0.064
9A 23.239 23.226 0.277 6.432 0.003 0.040
9B 23.110 23.098 0.268 6.194 0.003 0.038
10A 23.202 23.189 0.274 6.364 0.003 0.020
10B 23.074 23.062 0.266 6.129 0.003 0.019
11A 23.177 23.165 0.273 6.318 0.003 0.000
11B 23.050 23.038 0.264 6.086 0.003 0.000
12A 23.177 23.161 0.273 6.316 0.004 0.000
12B 23.050 23.035 0.264 6.083 0.004 0.000
TOTAL 161.523 0.087 4.013

83
Figure A-1. Estimated Capacitor and Series Resistance Value for Certain Load
Resistance and Ripple Voltage Value [45]