fdd_ssv
TRANSCRIPT
7/27/2019 FDD_SSV
http://slidepdf.com/reader/full/fddssv 1/25
Site name ETF827
Approved Date 28.05.2013
/ 2013
STC LTE FDD 4G1 Project
STC LTE-TD Radio Network Acceptance
Cluster/Site Initial Tuning Report
7/27/2019 FDD_SSV
http://slidepdf.com/reader/full/fddssv 2/25
Site name ETF827
Approved Date 28.05.2013
/ 2013
Cluster /Site Name ETF827
Drive test date 28.05.2013
Test interactionTest Type Scanner / Scanner + UE
Analyzed by
Date of report submission
© STC 2012 All rights reserved. The information in this document is the property of STC.
Except as specifically authorized in writing by STC, the receiver of this document
shall keep the information contained here confidential and shall protect the
same in whole or in part from disclosure and dissemination to third parties.
Disclosure and disseminations to the receiver's employees shall only be made
on a strict need to know basis. The information in this document is subject to
change without notice and STC assumes no responsibility for factual in
accuracies or typographical errors.
7/27/2019 FDD_SSV
http://slidepdf.com/reader/full/fddssv 3/25
Site name ETF827
Approved Date 28.05.2013
/ 2013
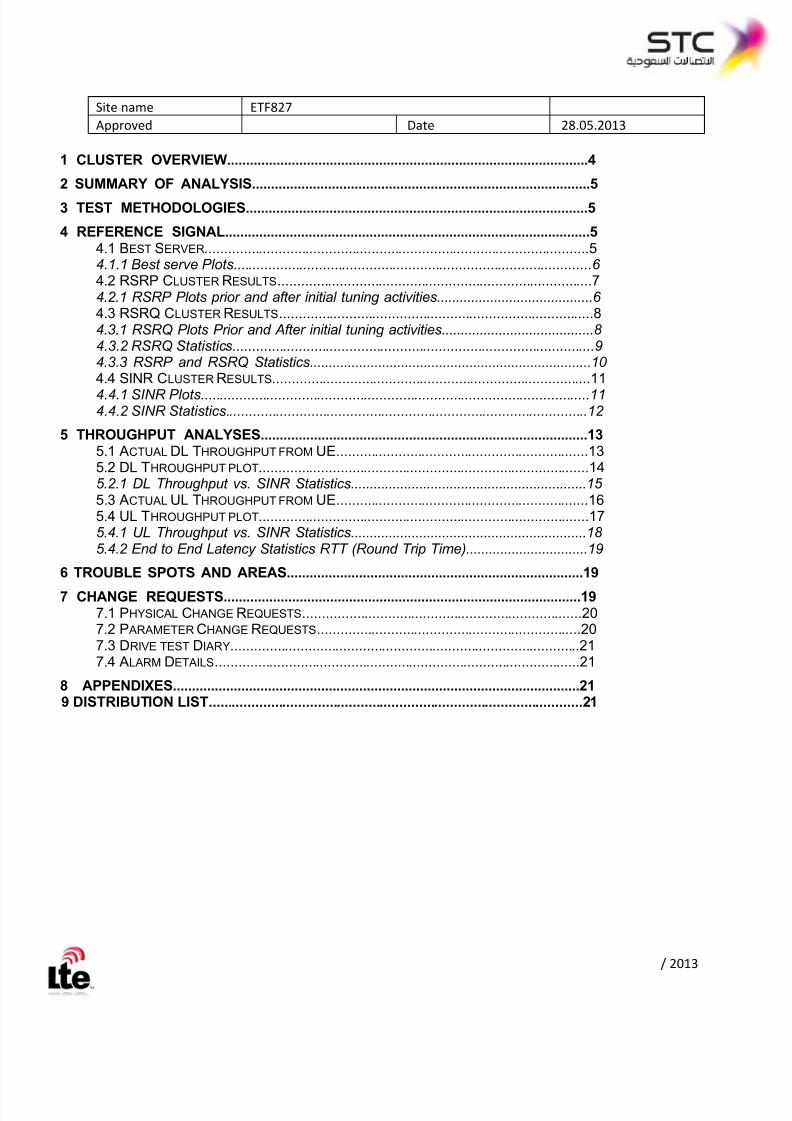
1 CLUSTER OVERVIEW...............................................................................................4
2 SUMMARY OF ANALYSIS.........................................................................................5
3 TEST METHODOLOGIES..........................................................................................5
4 REFERENCE SIGNAL................................................................................................54.1 BEST SERVER...................................................................................................54.1.1 Best serve Plots............................................................................................64.2 RSRP CLUSTER RESULTS.................................................................................74.2.1 RSRP Plots prior and after initial tuning activities.........................................64.3 RSRQ CLUSTER RESULTS.................................................................................84.3.1 RSRQ Plots Prior and After initial tuning activities........................................84.3.2 RSRQ Statistics.............................................................................................94.3.3 RSRP and RSRQ Statistics..........................................................................104.4 SINR CLUSTER RESULTS..................................................................................11
4.4.1 SINR Plots....................................................................................................114.4.2 SINR Statistics.............................................................................................12
5 THROUGHPUT ANALYSES......................................................................................135.1 ACTUAL DL THROUGHPUT FROM UE.................................................................135.2 DL THROUGHPUT PLOT.....................................................................................145.2.1 DL Throughput vs. SINR Statistics..............................................................155.3 ACTUAL UL THROUGHPUT FROM UE.................................................................165.4 UL THROUGHPUT PLOT.....................................................................................175.4.1 UL Throughput vs. SINR Statistics..............................................................185.4.2 End to End Latency Statistics RTT (Round Trip Time)................................19
6 TROUBLE SPOTS AND AREAS..............................................................................19
7 CHANGE REQUESTS..............................................................................................197.1 PHYSICAL CHANGE REQUESTS........................................................................207.2 P ARAMETER CHANGE REQUESTS....................................................................207.3 DRIVE TEST DIARY..........................................................................................217.4 ALARM DETAILS..............................................................................................21
8 APPENDIXES...........................................................................................................219 DISTRIBUTION LIST................................................................................................21

7/27/2019 FDD_SSV
http://slidepdf.com/reader/full/fddssv 4/25
Site name ETF827
Approved Date 28.05.2013
/ 2013
KPI and Configuration Check List
Cluster Site list:
Site ID Site Name
ETF827 ETF827A
ETF827 ETF827B
ETF827 ETF827C
Backhaul capacity check:
Designed Capacity E2E capacity check Source Status
(Matched/unmatched)
Configuration
CGI:
Cell Value
ETF827A
ETF827B
ETF827C
TAC
ETF827

7/27/2019 FDD_SSV
http://slidepdf.com/reader/full/fddssv 5/25
Site name ETF827
Approved Date 28.05.2013
/ 2013
Configuration Check list:
Item Information Source StatusFeature: LTE Session continuity to GSM/3G CM LTE & DT
Feature: LTE Reselection to GSM/3G CM LTE & DT
Feature: Intra-Automatic Neighbor Reporting CM LTE & DT or trace
Feature: Inter-Automatic Neighbor Reporting CM LTE & DT or trace
Feature: GSM/3G reselection to LTE CM 2G/3G & DT
Feature: Directed reselection to LTE from 2G/3G CM GSM/3G & DT
Feature: SMS origination/termination within LTE CM LTE Only
Feature: Multi Technology HO between FDD>TDD>FDD CM LTE Only
Feature: CSFB to 3G(UMTS 2100) CM LTE OnlyFeature: MIMO type CM LTE& LTE
Feature: CSFB to 3G(UMTS900) CM 3G/GSM If Applicable
Feature: X2 Handover CM LTE & DT
Number of concurrent users license CM LTE
System priority:
Technology Priority
LTE TDD 2.3 1
LTE FDD 1800 2
3G 1st carrier 3
3G 2nd
carrier 4
3G 3rd carrier 5
GSM 6
Test -KPI Value (Min, Avg,
Max)
LIMIT RESULT
(PASS/FAIL)
COMMENT
Session SetupSuccess rateDL_SINR>0dBDL_RSRP>-100dBm
97.00% pass/Fail
Minutes betweenE-RAB AbnormalReleases
25min pass/Fail
7/27/2019 FDD_SSV
http://slidepdf.com/reader/full/fddssv 6/25
Site name ETF827
Approved Date 28.05.2013
/ 2013
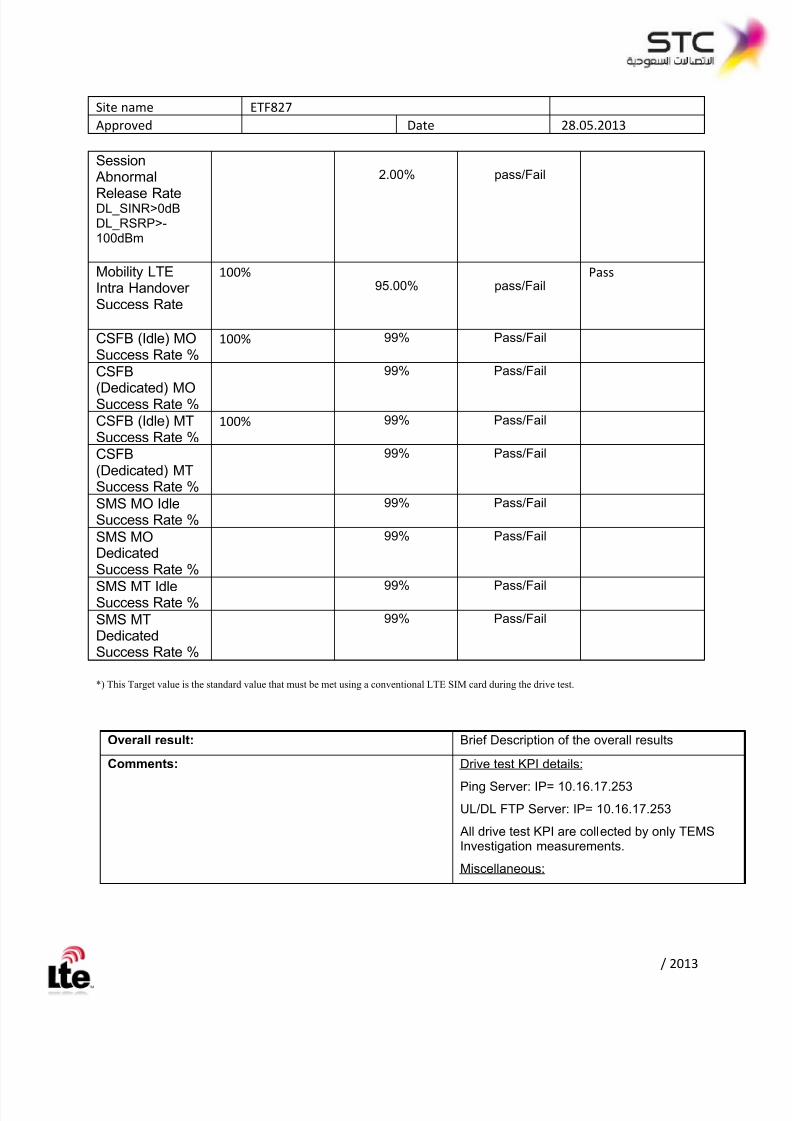
Session Abnormal
Release RateDL_SINR>0dBDL_RSRP>-100dBm
2.00% pass/Fail
Mobility LTEIntra HandoverSuccess Rate
100%95.00% pass/Fail
Pass
CSFB (Idle) MOSuccess Rate %
100% 99% Pass/Fail
CSFB
(Dedicated) MOSuccess Rate %
99% Pass/Fail
CSFB (Idle) MTSuccess Rate %
100% 99% Pass/Fail
CSFB(Dedicated) MTSuccess Rate %
99% Pass/Fail
SMS MO IdleSuccess Rate %
99% Pass/Fail
SMS MODedicatedSuccess Rate %
99% Pass/Fail
SMS MT IdleSuccess Rate %
99% Pass/Fail
SMS MTDedicatedSuccess Rate %
99% Pass/Fail
*) This Target value is the standard value that must be met using a conventional LTE SIM card during the drive test.
Overall result: Brief Description of the overall results
Comments: Drive test KPI details:
Ping Server: IP= 10.16.17.253
UL/DL FTP Server: IP= 10.16.17.253
All drive test KPI are collected by only TEMSInvestigation measurements.
Miscellaneous:

7/27/2019 FDD_SSV
http://slidepdf.com/reader/full/fddssv 7/25
Site name ETF827
Approved Date 28.05.2013
/ 2013
1 Cluster/Site Overview
Figure 1 Cluster/Site Location on Map
Figure 1 Cluster/Site Location on Map
Figure 1 Cluster/Site Location on Map
Number of Sites in cluster or Site Name: ETF827
Integration Status:
Alarm Status (from integrated sites):
Cell Availability (from integrated sites):
EARFCN(s) DL/UL: 1752/19752
DL/UL Configuration:
Bandwidth: 10 MHZTest Duration:
Table 1: Summary of Cluster/Site status

7/27/2019 FDD_SSV
http://slidepdf.com/reader/full/fddssv 8/25
Site name ETF827
Approved Date 28.05.2013
/ 2013
2 Summary of Analysis
<Insert summary of results and of any suggestions for improvement specifying desiredoutcome>
<All results in details are summarized in the Final Acceptance report >
3 Test Methodology
<Insert description of the drive test methodology and equipment used during the drive
test>
Insert short description of the drive test route and the difficulties and circumstancesfaced during the drive test, if any]
[This chapter shou ld be the same for al l clusters unless ch anges are required]
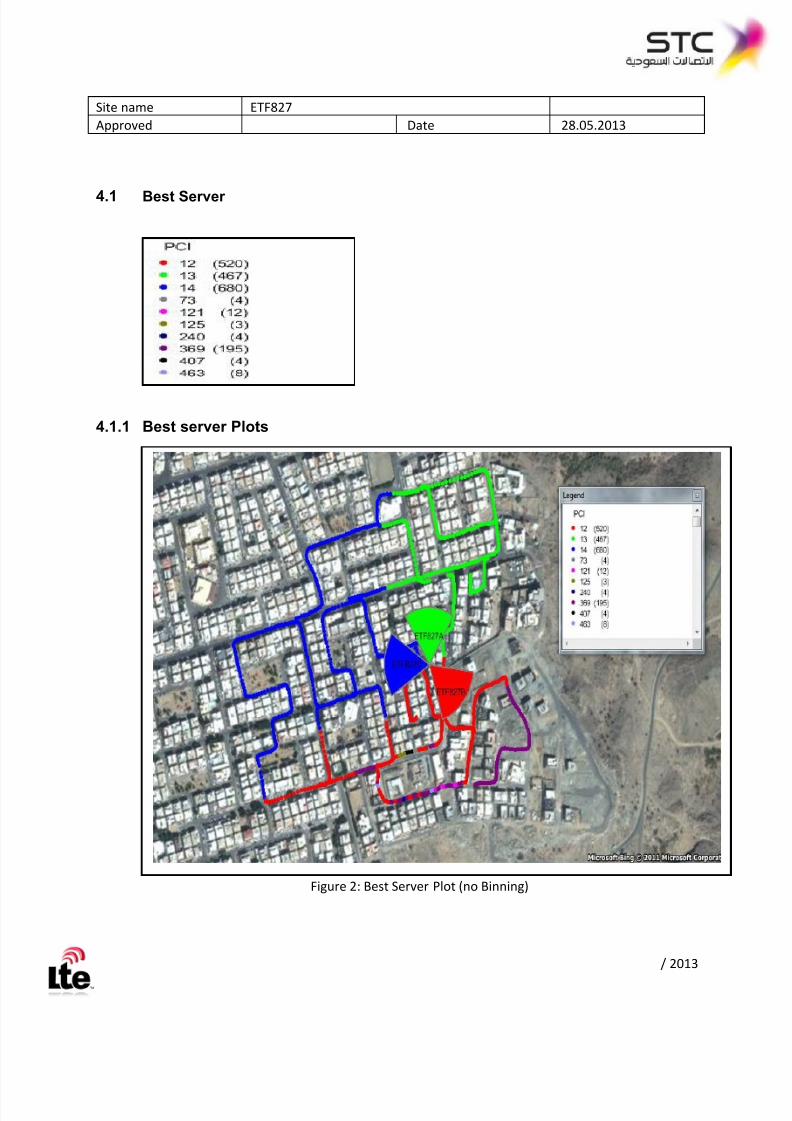
4 Reference Signal
Below are the results of the scanned reference signal data from the cluster. All datapresented is binned at 25m intervals
7/27/2019 FDD_SSV
http://slidepdf.com/reader/full/fddssv 9/25
Site name ETF827
Approved Date 28.05.2013
/ 2013
4.1 Best Server
4.1.1 Best server Plots
Figure 2: Best Server Plot (no Binning)
7/27/2019 FDD_SSV
http://slidepdf.com/reader/full/fddssv 10/25
Site name ETF827
Approved Date 28.05.2013
/ 2013
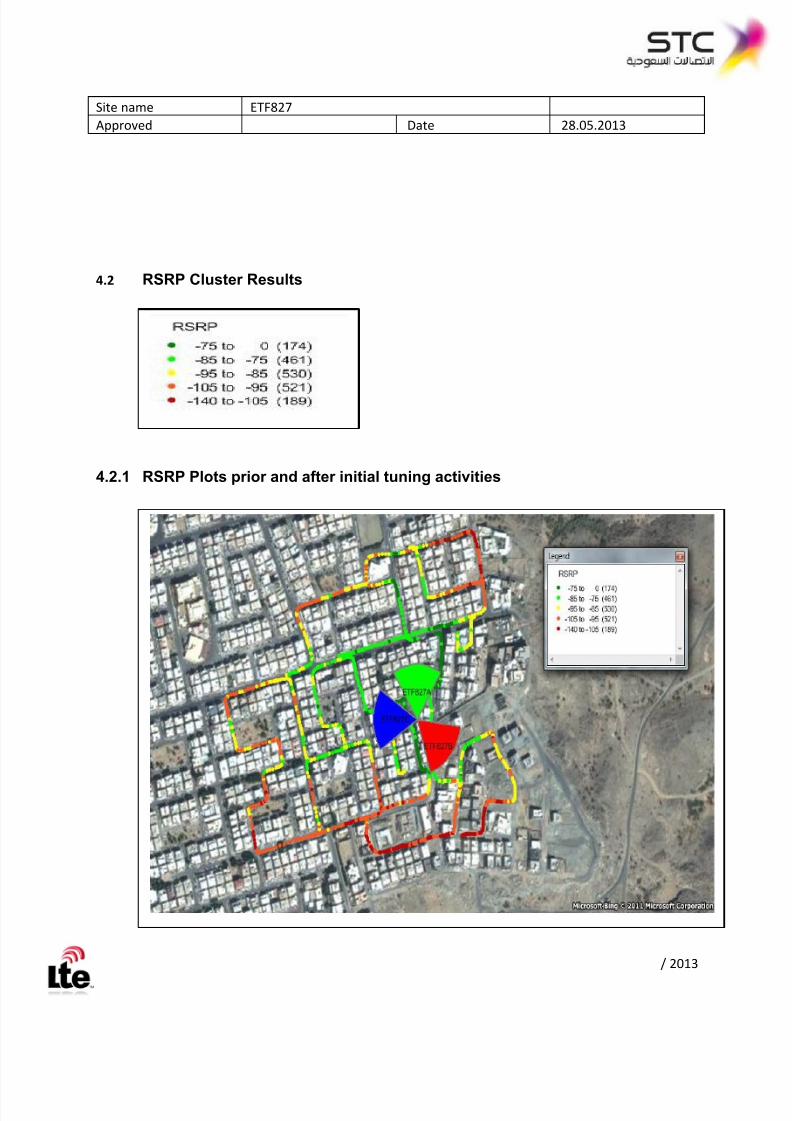
4.2 RSRP Cluster Results
4.2.1 RSRP Plots prior and after initial tuning activities

7/27/2019 FDD_SSV
http://slidepdf.com/reader/full/fddssv 11/25
Site name ETF827
Approved Date 28.05.2013
/ 2013
Figure 3: Cluster RSRP After initial tuning activities – Scanner [binned]
4.2.2 RSRP Statistics
See Table for breakdown of RSRP samples statistics for drive area
Figure 4: Cluster RSRP Distribution After initial tuning activities [No Binning]
7/27/2019 FDD_SSV
http://slidepdf.com/reader/full/fddssv 12/25
Site name ETF827
Approved Date 28.05.2013
/ 2013
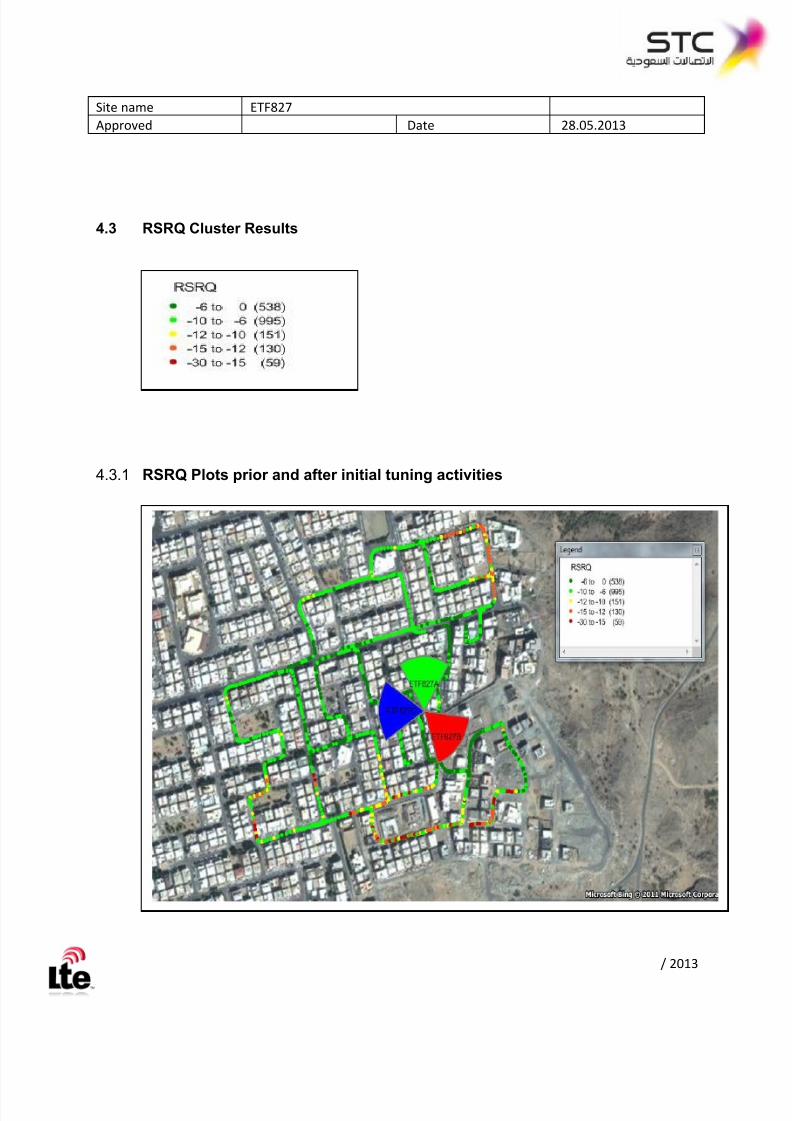
4.3 RSRQ Cluster Results
4.3.1 RSRQ Plots prior and after initial tuning activities

7/27/2019 FDD_SSV
http://slidepdf.com/reader/full/fddssv 13/25
Site name ETF827
Approved Date 28.05.2013
/ 2013
Figure 5: Cluster RSRQ After initial tuning activities – Scanner [binned]
4.3.2 RSRQ Statistics
See Table for breakdown of RSRQ samples statistics for drive area
Figure 6: Cluster RSRQ Distribution After initial tuning activities [No Binning]

7/27/2019 FDD_SSV
http://slidepdf.com/reader/full/fddssv 14/25
Site name ETF827
Approved Date 28.05.2013
/ 2013
4.3.3 RSRP and RSRQ Statistics
Table 2: Cluster RSRP vs. RSRQ After initial tuning activities – Scanner [binned]
Target (in case available full cluster ): 80% of the measured samples within the cluster arefulfilling:
RSRP >= -110dBm and RSRQ >= -15dBm
7/27/2019 FDD_SSV
http://slidepdf.com/reader/full/fddssv 15/25
Site name ETF827
Approved Date 28.05.2013
/ 2013
Figure 7: RSRP vs. RSRQ Distribution After initial tuning activities
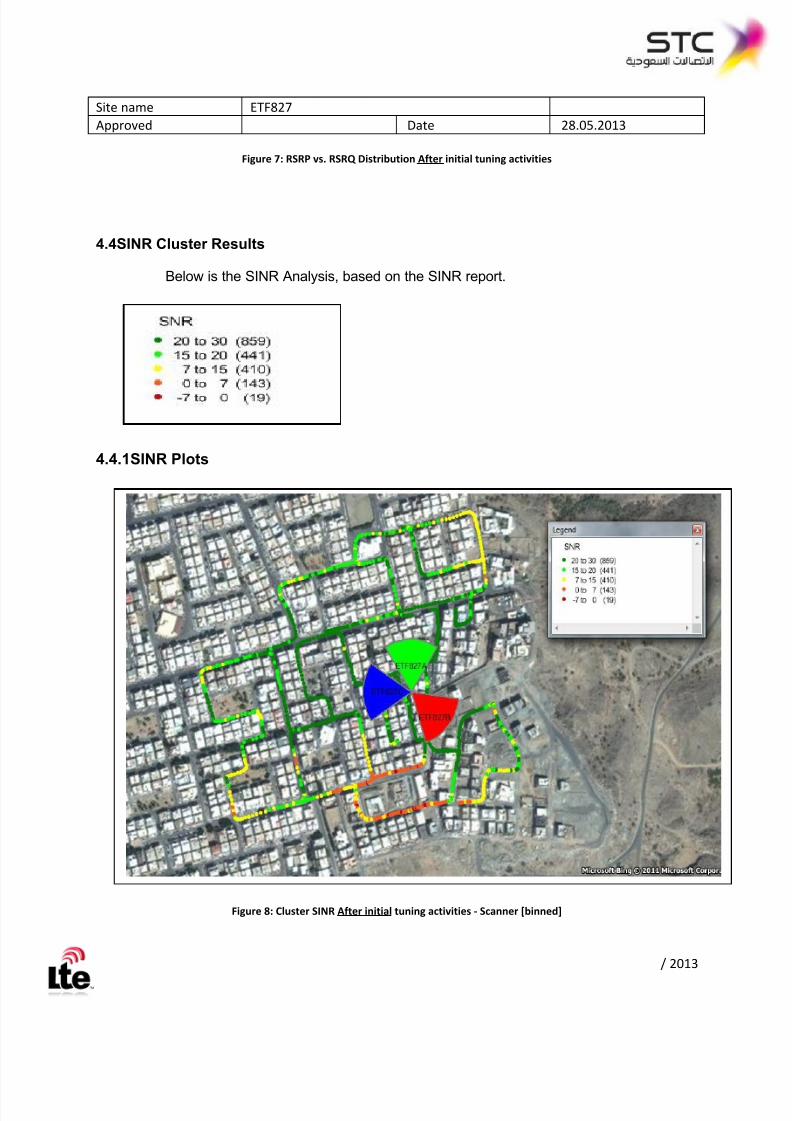
4.4SINR Cluster Results
Below is the SINR Analysis, based on the SINR report.
4.4.1SINR Plots
Figure 8: Cluster SINR After initial tuning activities - Scanner [binned]

7/27/2019 FDD_SSV
http://slidepdf.com/reader/full/fddssv 16/25
Site name ETF827
Approved Date 28.05.2013
/ 2013
4.4.2 SINR Statistics
Figure 9: SINR Distribution after initial tuning activities [No Binning]

7/27/2019 FDD_SSV
http://slidepdf.com/reader/full/fddssv 17/25
Site name ETF827
Approved Date 28.05.2013
/ 2013
5 Throughput Analysis
5.1 Actual DL Throughput from UE
DL Throughput data reported from LTE UE for FTP Sessions
5.2 DL Throughput plot

7/27/2019 FDD_SSV
http://slidepdf.com/reader/full/fddssv 18/25
Site name ETF827
Approved Date 28.05.2013
/ 2013
Figure 10: Cluster DL Throughput Plot [No Binning]
5.2.1 DL Throughput vs. SINR Statistics
Graph of all measured samples throughput values recorded during drive test
Figure 11: Cluster DL Throughput vs. SINR [No Binning]

7/27/2019 FDD_SSV
http://slidepdf.com/reader/full/fddssv 19/25
Site name ETF827
Approved Date 28.05.2013
/ 2013
Target: see below table:
Average DL User Throughput
Stationary Test (best location)
Value ( average,max)
Target Result(pass/fail)
Comment
No condition
Avg: 71.7 Mbps
Max: 73.5 Mbps
≥55 Mbps
≥70 Mbps
pass/Fail Red Target Value can
only be considered if
STC provides Vendor
with Priority LTE class
SIM card.
Average DL User Throughput
(DLUT) Mobile
Value ( average,max)
Target Result(pass/fail)
Comment
DLUT Quality Low
(Cell edge)
0dB ≤ DL_SINR < 7dB
DL_RSRP>-100dBm
Avg: 31.2 Mbps
Max: 34.3 Mbps
≥5.5 Mbps *)≥7 Mbps
pass/Fail Red Target Value canonly be considered ifSTC provides Vendorwith Priority LTE classSIM card.
DLUT Medium
(Mid Cell)
7dB ≤ DL_SINR < 15.5dB
DL_RSRP>-100dBm
Avg: 49.3 Mbps
Max: 52.3 Mbps
≥11 Mbps *)≥14 Mbps
pass/Fail Red Target Value canonly be considered ifSTC provides Vendorwith Priority LTE classSIM card.
DLUT High
(Under antennas)
DL_SINR ≥ 15.5dB
DL_RSRP>-100dBm
Avg: 71.7 Mbps
Max: 73.5 Mbps
≥20 Mbps *)≥30 Mbps
pass/Fail Red Target Value canonly be considered ifSTC provides Vendorwith Priority LTE classSIM card.
*) This Target value is the standard value that must be met using a conventional LTE SIM card during the drive test.
7/27/2019 FDD_SSV
http://slidepdf.com/reader/full/fddssv 20/25
Site name ETF827
Approved Date 28.05.2013
/ 2013
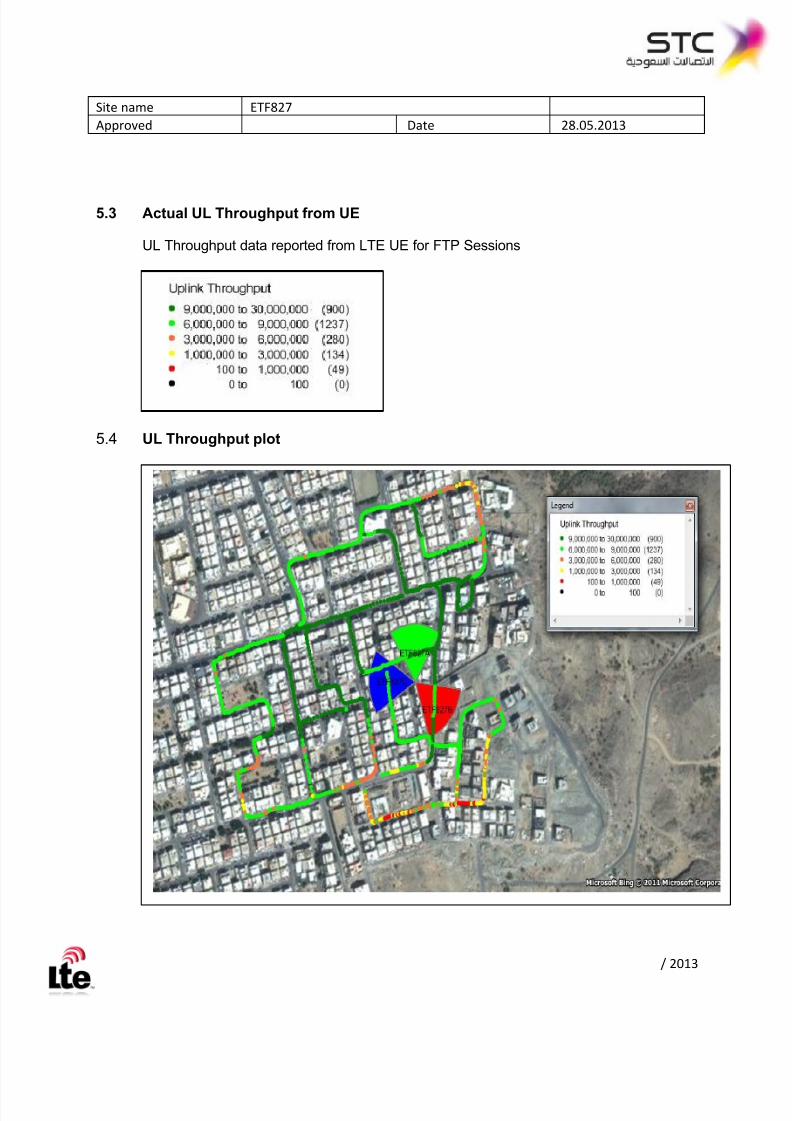
5.3 Actual UL Throughput from UE
UL Throughput data reported from LTE UE for FTP Sessions
5.4 UL Throughput plot
7/27/2019 FDD_SSV
http://slidepdf.com/reader/full/fddssv 21/25
Site name ETF827
Approved Date 28.05.2013
/ 2013
Figure 12: Cluster UL Throughput Plot [No Binning]
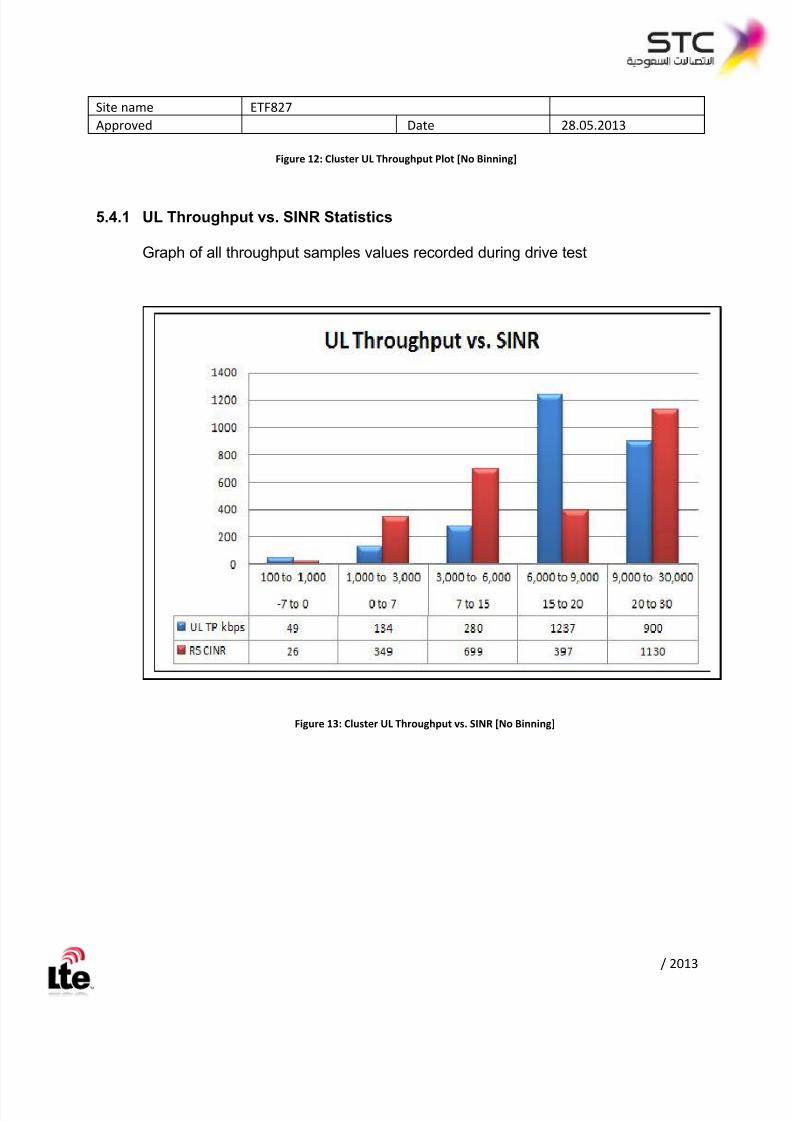
5.4.1 UL Throughput vs. SINR Statistics
Graph of all throughput samples values recorded during drive test
Figure 13: Cluster UL Throughput vs. SINR [No Binning]
7/27/2019 FDD_SSV
http://slidepdf.com/reader/full/fddssv 22/25
Site name ETF827
Approved Date 28.05.2013
/ 2013
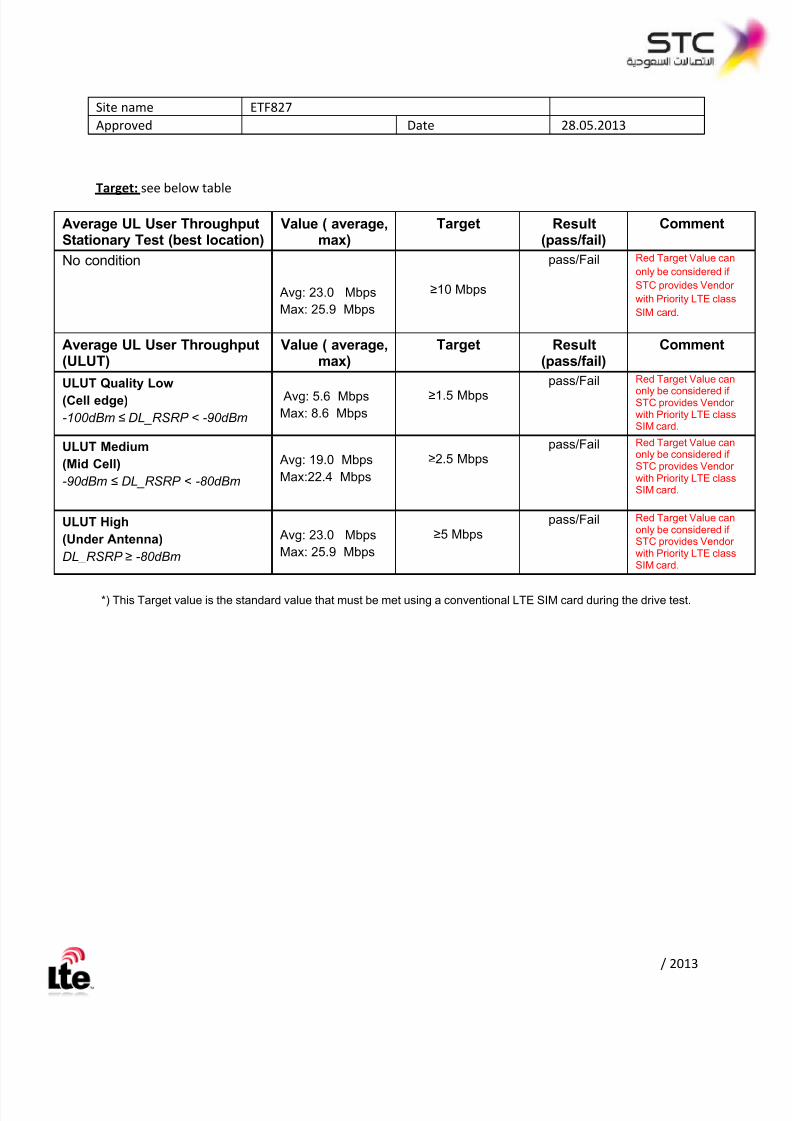
Target: see below table
Average UL User ThroughputStationary Test (best location)
Value ( average,max)
Target Result(pass/fail)
Comment
No condition
Avg: 23.0 Mbps
Max: 25.9 Mbps
≥10 Mbps
pass/Fail Red Target Value can
only be considered if
STC provides Vendor
with Priority LTE class
SIM card.
Average UL User Throughput(ULUT)
Value ( average,max)
Target Result(pass/fail)
Comment
ULUT Quality Low
(Cell edge)
-100dBm ≤ DL_RSRP < -90dBm
Avg: 5.6 Mbps
Max: 8.6 Mbps
≥1.5 Mbps
pass/Fail Red Target Value can
only be considered ifSTC provides Vendorwith Priority LTE classSIM card.
ULUT Medium
(Mid Cell)
-90dBm ≤ DL_RSRP < -80dBm
Avg: 19.0 Mbps
Max:22.4 Mbps
≥2.5 Mbpspass/Fail Red Target Value can
only be considered ifSTC provides Vendorwith Priority LTE classSIM card.
ULUT High
(Under Antenna)
DL_RSRP ≥ -80dBm
Avg: 23.0 Mbps
Max: 25.9 Mbps
≥5 Mbpspass/Fail Red Target Value can
only be considered ifSTC provides Vendorwith Priority LTE classSIM card.
*) This Target value is the standard value that must be met using a conventional LTE SIM card during the drive test.

7/27/2019 FDD_SSV
http://slidepdf.com/reader/full/fddssv 23/25
Site name ETF827
Approved Date 28.05.2013
/ 2013
5.4.2 End to End Latency Statistics RTT (Round Trip Time)
All RTT values recorded by the second UE during drive test
Target: see below table
Round Trip Time RTT (msec) Stationary Value (min,average,)
Target Result(pass/fail)
No condition (32 bytes data)RAN located at different geographicalarea as the EPC there is a large
distance between the two entities.
14 ms
15 ms
≤35 ms
≤45 ms
pass/Fail
Round Trip Time (RTT) Mobile
DL_SINR>0dB
DL_RSRP>-100dBm
Excluding the worst 2..5% of RTT values.
RAN located at the same geographicalarea as the EPC
≤35ms Pass/fail
Round Trip Time (RTT) Mobile
DL_SINR>0dB
DL_RSRP>-100dBm
Excluding the worst 2..5% of RTT
≤45ms Pass/fail
Values.
RAN located at different geographical area as
the EPC there is a large distance between the
two entities.
6 Trouble Spots and areas
<Insert any considerable difficulties faced during drive test as well as during the initial tuning ofthe cluster and where Vendor might need support from STC >
<Insert technical remedies and solutions in order to enhance the quality of the RSRP, RSRQ,SINR, DL TP and UL TP…etc at these particular trouble spots and areas>.
<Insert any comment related to these particular trouble spots and areas that you want to sharewith the Optimization Responsible at STC>.

7/27/2019 FDD_SSV
http://slidepdf.com/reader/full/fddssv 24/25
Site name ETF827
Approved Date 28.05.2013
/ 2013
Figure 14: Trouble Spot/Area Map
7 Change Requests
List of all change requests made during the initial tuning activities
7.1 Physical Change Requests
<Insert Physical Change requests Tracker for cluster/ Site>
Site ID Changes Old value New value Comment
7.2 Parameter Change Requests
<Insert Cluster/ Site wide parameter changes>
Site ID Parameter Previous value New Value Comment
Getting interference in Sec-B
7/27/2019 FDD_SSV
http://slidepdf.com/reader/full/fddssv 25/25
Site name ETF827
Approved Date 28.05.2013
7.3 Drive test Diary
<Insert drive test diary as xls object if needed>
7.4 Alarm Details
<Insert alarm printout for alarms checked during drive>
Site ID Alarm type Cause of the Alarm Date of clearance Comment
8 Appendixes
<Insert any valuable appendix>
TEMS log files, Cluster list of sites …
9 Distribution List
For your Information
1. xx
2. xx
3. xx
Receiver
1. xx
2. xx
3. xx