fc-g receptor polymorphisms, cetuximab therapy, and...
TRANSCRIPT
Personalized Medicine and Imaging
Fc-g Receptor Polymorphisms, CetuximabTherapy, and Survival in the NCIC CTG CO.17Trial of Colorectal CancerGeoffrey Liu1, Dongsheng Tu2, Marcia Lewis3, Dangxiao Cheng1, Leslie A. Sullivan3,Zhuo Chen1, Eric Morgen1, John Simes4, Timothy J. Price5, Niall C. Tebbutt6,Jeremy D. Shapiro7, G. Mark Jeffery8, J. Daniel Mellor9, Thomas Mikeska9,10,11,Shakeel Virk2, Lois E. Shepherd2, Derek J. Jonker12, Christopher J. O'Callaghan2,John R. Zalcberg9, Christos S. Karapetis13, and Alexander Dobrovic9,10,11
Abstract
Purpose: Two germline Fc-g receptor (FCGR) polymorphisms,rs1801274 [FCGR2A;His(H)131Arg(R)] and rs396991 [FCGR3A;Phe(F)158Val(V)] produce altered proteins through amino acidsubstitutions; both are reported to be associated with cetuximab-related outcomes. We performed a validation of these polymorph-isms in NCIC CTG CO.17, a randomized trial of cetuximab mono-therapy in refractory, metastatic colorectal cancer expressing EGFR.
Experimental Design:DNA extracted from formalin-fixed par-affin-embedded tissue was genotyped. In addition to log-ranktests, Coxproportional hazardmodels assessed their relationshipswith overall (OS) and progression-free survival (PFS), adjustingfor clinically important prognostic factors, along with a polymor-phism–treatment arm interaction term.
Results: Somatic KRAS status was wild-type for exon 2 in153 (52%) of 293 patients, from whom tumor DNA was
available. For FCGR2A H/H, a genotype–treatment interactionfor KRAS wild-type patients was observed for OS (P ¼ 0.03). InKRAS wild-type patients carrying FCGR2A H/H, cetuximab (vs.no cetuximab) improved survival substantially, with adjustedHRs (aHR) of 0.36 (OS) and 0.19 (PFS) and absolute benefitsof 5.5 months (OS; P¼ 0.003) and 3.7 months (PFS; P¼ 0.02).In contrast, patients carrying FCGR2A R alleles (H/R or R/R)had aHRs of only 0.78 (OS; 2.8-month benefit) and 0.53 (PFS;1.6-month benefit). No relationships were found for rs396991(FCGR3A).
Conclusions: In the CO.17 trial, cetuximab worked best forpatients with KRAS wild-type colorectal cancers carryingFCGR2A H/H genotypes. Significantly lower benefits wereobserved in patients carrying germline FCGR2A R alleles. ClinCancer Res; 22(10); 2435–44. �2016 AACR.
IntroductionOnly a proportion of patients with colorectal cancer receiv-
ing cetuximab derive benefit from the drug (1). However, otherthan RAS and BRAF mutations, no biomarkers have been
identified as clinically useful predictors of response to cetux-imab (2, 3). As a therapeutic mAb, cetuximab contains anantigen-binding fragment (Fab) that binds to the extracellulardomain of the transmembrane EGFR, which is highly expressedin patients with colorectal cancer. Cetuximab also contains thecrystalline fragment (Fc) that binds the Fc-g receptor (FCGR) ona host effector cell, typically a natural killer cell, macrophage, ormonocyte, and thereby may induce tumor cell killing viaantibody-dependent cellular cytotoxicity (ADCC). This is ini-tiated when the Fab binds to EGFR while the Fc interacts withthe effector cell's FCGR, resulting in target cell recognition and alytic attack (4–6). Other potential mechanisms of actioninclude FCGR-mediated endocytosis and phagocytosis of anti-body-coated tumor cells that utilize tumor-directed T-cellimmunity (7). Three classes of FCGR exist, encoded by relatedgenes on the long arm of chromosome 1; FCGR1–CD64;FCGR2–CD32; and FCGR3–CD16 (8).
Two polymorphisms in the coding regions of the FCGR2Aand FCGR3A genes, respectively, appear to have clinical signi-ficance, correlating with responses to cetuximab. A coding poly-morphism in the extracellular domain of FCGR2A (rs1801274)changes the amino acid from histidine (H) to arginine (R;ref. 9). Although the FCGR2A receptor has highest affinity forhuman IgG1 and IgG3 (10), the H-to-R substitution is knownto affect binding to IgG2 (and not IgG1) in humans, with the R
1Princess Margaret Cancer Centre, Toronto, Canada. 2NCIC ClinicalTrials Group and Queen's University, Kingston, Canada. 3Transge-nomic, Inc., Omaha, Nebraska. 4University of Sydney, Sydney, Austra-lia. 5The Queen Elizabeth Hospital and University of Adelaide, Ade-laide, Australia. 6Austin Health, Melbourne, Australia. 7Cabrini Hospi-tal, Monash University, Melbourne, Australia. 8Canterbury RegionalCancer and Blood Service, Christchurch Hospital, Christchurch, NewZealand. 9Peter MacCallum Cancer Centre and University of Mel-bourne, Melbourne, Australia. 10Translational Genomics and Epige-nomics Laboratory, Olivia Newton-John Cancer Research Institute,Heidelberg,Victoria, Australia. 11School of Cancer Medicine, La TrobeUniversity, Bundoora,Victoria, Australia. 12The Ottawa Hospital, Otta-wa, Canada. 13Flinders Centre for Innovation in Cancer, FlindersUniversity, Adelaide, Australia.
Note: Supplementary data for this article are available at Clinical CancerResearch Online (http://clincancerres.aacrjournals.org/).
Corresponding Author: Geoffrey Liu, University of Toronto, 610 University Ave,7th Floor Rm 7-125, Toronto, Ontario M5G 2M9, Canada. Phone: 416-946-4501,ext. 3428; Fax: 416-946-6546; E-mail: [email protected]
doi: 10.1158/1078-0432.CCR-15-0414
�2016 American Association for Cancer Research.
ClinicalCancerResearch
www.aacrjournals.org 2435
on May 31, 2018. © 2016 American Association for Cancer Research. clincancerres.aacrjournals.org Downloaded from
form showing poor affinity (9). The rs396991 polymorphismof FCGR3A is also found in the extracellular domain, leadingeither to a phenylalanine (F) or valine (V); this FCGR3Apolymorphism interacts with the lower hinge region of IgG1(11, 12).
Prior studies evaluating the role of FCGR polymorphisms andthe efficacy of cetuximab in colorectal cancer (13–19) haveidentified associations for both polymorphisms that now requirevalidation. Furthermore, many prior studies had various limita-tions, which included (i) small study sizes; (ii) the use of conve-nient case series, rather than prospective, systematically collectedsamples; (iii) lack of consideration ofKRASmutation status in theanalysis; (iv) various concurrent therapies with cetuximab; and(v) technical issues with genotyping. None has involved theevaluation of a large, randomized controlled trial of cetuximabmonotherapy with a no-active-treatment control arm. Not sur-prisingly, results from these prior studies yielded conflictingresults. CO.17 is a unique validation dataset because it addressesa number of these limitations that allows us to analyze thepotential predictive effects of these polymorphisms on treatmentoutcome.
Our primary objective was to determine whether survival isaffected by a significant interaction between FCGR polymor-phism and cetuximab treatment after adjusting for other poten-tial prognostic factors. To address the known importance ofKRAS mutations on cetuximab efficacy, we performed separateanalyses by KRAS mutation status, as well as in all patients(adjusting for KRAS status). A secondary, exploratory objectivewas to determine whether these same polymorphisms wereassociated with general prognosis in patients untreated withcetuximab (i.e., those treated with best supportive care only),after adjusting for other potential prognostic factors.
Materials and MethodsStudy design and population
This retrospective, secondary analysis of two germline poly-morphisms, FCGR2A:H!R,(rs1801274) and FCGR3A:F!V,(rs396991), used available DNA samples from a multicenter,open-label, randomized (1:1), phase III trial of cetuximabmonotherapy versus best supportive care (NCIC-CTG CO.17;
BMS-CA225-025). Polymorphism–treatment arm interactionsfor each of the two polymorphisms on overall survival (OS)were evaluated as the primary endpoint. Secondary endpointsincluded treatment arm–specific subset analyses for each poly-morphism. REMARK guidelines were followed (20).
This trial was led by NCIC Clinical Trials Group (NCIC-CTG)in collaboration with the Australasian Gastro-Intestinal TrialsGroup (1). All patients received best supportive care, defined asthose measures designed to provide palliation of symptoms andimprove quality of life as much as possible. Patients had previ-ously treated, metastatic, EGFR immune-positive colorectal can-cer. The primary trial endpoint was survival. The final analysis forthis study was performed in 2006, demonstrating a significantsurvival advantage in the cetuximab arm with a median OS of6.1 versus 4.6months in the best supportive care group (HR, 0.77;P < 0.005). An analysis by somatic KRAS status found that thebenefits of cetuximab were restricted to patients with KRASwild-type versus KRAS-mutated tumors (median OS 9.5 vs. 4.8months; HR, 0.55; P < 0.001; ref. 2).
For the current analysis, this underlying trial populationwas used to generate the following defined datasets: (i) abiomarker dataset, henceforth described as "all patients",which were all subjects who were randomized and had suc-cessful genotyping for one or both of the two FCGR poly-morphisms; (ii) a KRAS wild-type biomarker dataset, whichincluded all randomized subjects with successful genotypingand a wild-type KRAS status; and (iii) a KRAS-mutant biomark-er dataset, which included all randomized subjects with suc-cessful genotyping and KRAS-mutant status.
Clinical data and outcomesThe NCIC-CTG trial database was used for all analyses.
Clinical outcomes were defined as per RECIST 1.0 and includedOS and progression-free survival (PFS). OS was defined as thetime from study entry until death or censored at last follow-up,if alive. PFS was defined as the time from study entry until firstprogression of disease, death, or censored at last follow-up.There were too few objective clinical responses for interactionanalyses; hence, best clinical response was not evaluated as anoutcome.
DNA extraction and genotyping methodFormalin-fixed and paraffin-embedded (FFPE) normal and
tumor tissue samples from local sites were archived at theNCIC-CTG central tumor bank (Queen's University, Kingston,Canada), where a single 1.2-mm diameter core was taken fromeach block. Extracting DNA from glass slides (some over a decadeold) yielded highly variable success; thus, only DNAs obtainedfrom cores were analyzed. DNA was extracted using the QiagenFFPE DNA Kit. DNA quantity (spectrophotometry) and quality(polymerase chain reactions) were checked. DNA was genotypedblindly by Transgenomic, Inc. using Sanger sequencing. Replicatesequencing was performed in the laboratories of G. Liu (Sangersequencing) and A. Dobrovic (pyrosequencing). All samples weretested in at least two different laboratories, and any discrepantresults were genotyped in the third laboratory. Primer sequencesare presented in Supplementary Table S1. FCGR3A genotyping isespecially challenging because of the presence of a pseudogene.We utilized two different sets of unique primers across two ormore laboratories to ensure accuracy and reproducibility and
Translational Relevance
This study evaluates the pharmacogenetic predictive asso-ciation between polymorphisms in the Fc-g receptor (FCGR)genes and treatment outcomes involving cetuximab, a targetedtherapy for metastatic colorectal cancer. Prior studies haveidentified possible candidates associated with cetuximabresponse, but many have no control arms or are confoundedby therapy with cetuximab in combination with other che-motherapeutic agents. This study evaluated the role of thesepolymorphisms in the NCIC CTG CO.17 trial, one of thedefinitive registration trials that also helped define a predictiverole of KRAS mutation. In our study, the role of the FCGR2Apolymorphism is clearly demonstrated, leading to strongrationale for prospective trials testing the clinical utility ofthis germline biomarker.
Liu et al.
Clin Cancer Res; 22(10) May 15, 2016 Clinical Cancer Research2436
on May 31, 2018. © 2016 American Association for Cancer Research. clincancerres.aacrjournals.org Downloaded from
further checked results using Hardy–Weinberg equilibrium test-ing (21). Germline DNA extracted from lymphocytes of indivi-duals with known FCGR genotypes was used as controls. KRASmutations were identified previously (2).
Statistical analysisThe characteristics of all patients in the original trial and in
the subset of patients with genotyping results were tabulatedand compared. OS and PFS were assessed using Kaplan–Meiercurves, log-rank tests (univariable analyses), and Cox propor-tional hazard models in multivariable analyses, adjusting forclinically relevant factors identified in the original trial analysis(1). The primary analyses utilized two approaches to geneticinheritance: (i) additive genetic models used for screeninganalyses; and (ii) additional analyses using other models ofinheritance, particularly dominant, codominant, and recessivemodels. It should be noted that a priori data suggested adominant model for both FCGR2A and FCGR3A polymorph-isms, and thus, the dominant model was adopted as the main
secondary analysis. Tests of assumption of proportionalhazards were performed. SAS software v.9.1 was used for allanalyses.
ResultsBaseline patient and genotyping characteristics
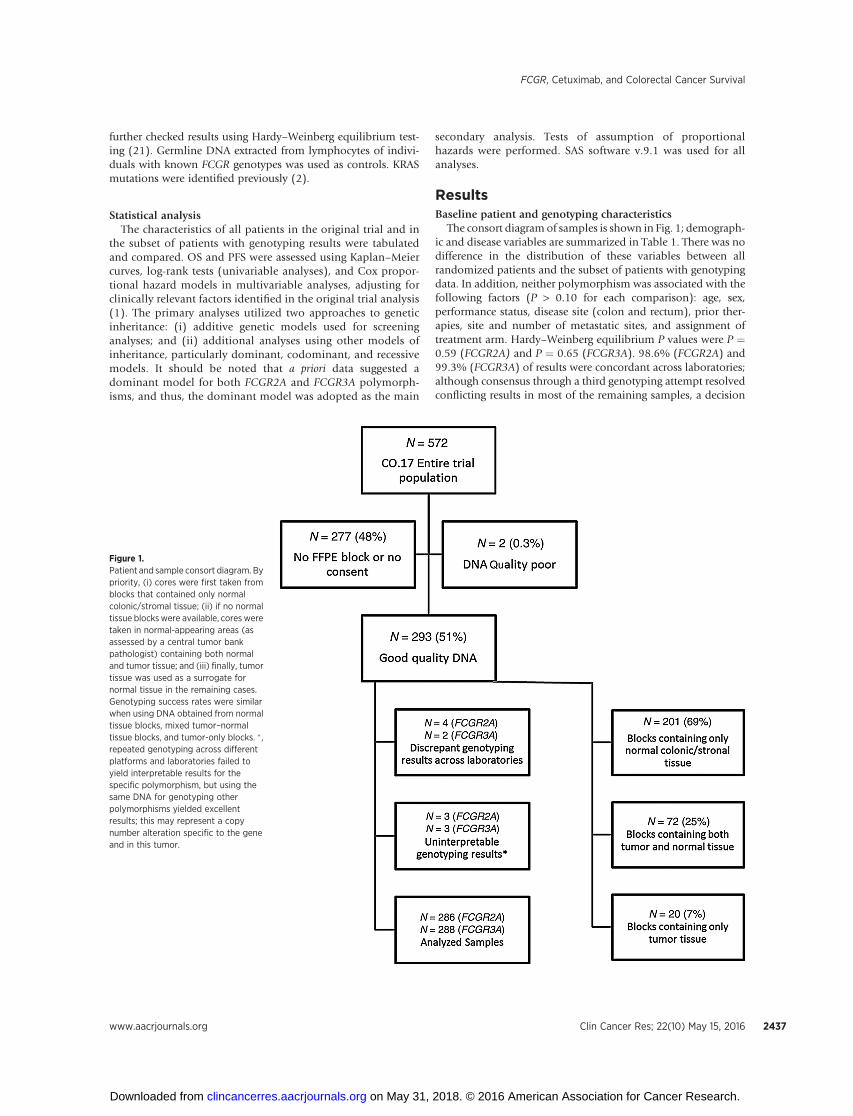
The consort diagram of samples is shown in Fig. 1; demograph-ic and disease variables are summarized in Table 1. There was nodifference in the distribution of these variables between allrandomized patients and the subset of patients with genotypingdata. In addition, neither polymorphism was associated with thefollowing factors (P > 0.10 for each comparison): age, sex,performance status, disease site (colon and rectum), prior ther-apies, site and number of metastatic sites, and assignment oftreatment arm. Hardy–Weinberg equilibrium P values were P ¼0.59 (FCGR2A) and P ¼ 0.65 (FCGR3A). 98.6% (FCGR2A) and99.3% (FCGR3A) of results were concordant across laboratories;although consensus through a third genotyping attempt resolvedconflicting results in most of the remaining samples, a decision
Figure 1.Patient and sample consort diagram. Bypriority, (i) cores were first taken fromblocks that contained only normalcolonic/stromal tissue; (ii) if no normaltissue blockswere available, cores weretaken in normal-appearing areas (asassessed by a central tumor bankpathologist) containing both normaland tumor tissue; and (iii) finally, tumortissue was used as a surrogate fornormal tissue in the remaining cases.Genotyping success rates were similarwhen using DNA obtained from normaltissue blocks, mixed tumor–normaltissue blocks, and tumor-only blocks. � ,repeated genotyping across differentplatforms and laboratories failed toyield interpretable results for thespecific polymorphism, but using thesame DNA for genotyping otherpolymorphisms yielded excellentresults; this may represent a copynumber alteration specific to the geneand in this tumor.
FCGR, Cetuximab, and Colorectal Cancer Survival
www.aacrjournals.org Clin Cancer Res; 22(10) May 15, 2016 2437
on May 31, 2018. © 2016 American Association for Cancer Research. clincancerres.aacrjournals.org Downloaded from
was made to exclude these small number of discrepant samplesfrom further analyses.
Interaction between cetuximab therapy and FCGR2Apolymorphism
In all Cox models, the assumption of proportional hazardswas never violated. Table 2 presents the interaction analysisbetween treatment arm and genotype of the FCGR2A polymor-phism on survival, which was performed under a screeningadditive genetic model. Three sets of comparisons were per-formed: in the KRAS wild-type subset of patients (primaryanalysis); for comparison purposes, data were also reported forKRAS-mutant patients; and in all patients (irrespective of KRASmutation status). In all three comparisons, the same associationwas observed: patients carrying theH/H genotype (31% of KRASwild-type; 28% of all patients irrespective of KRAS status)benefited greatly from cetuximab, whereas those carrying H/Ror R/R benefited much less. For OS (Table 2, top), cetuximabhad an approximate 3-fold benefit in both KRAS wild-type andKRAS-mutant patients (together or separately) carrying the H/Hgenotype. H/H patients also had improved PFS when comparedwith R allele carriers. For PFS (Table 2, bottom), an associationwas observed most prominently in the KRAS wild-type patients,where carrying the H/H genotype resulted in cetuximab yieldinga 5-fold survival benefit with an adjusted HR (aHR) ¼ 0.19,comparing cetuximab-treated patients with patients on no activetreatment. In contrast, carrying the R allele meant that receiving
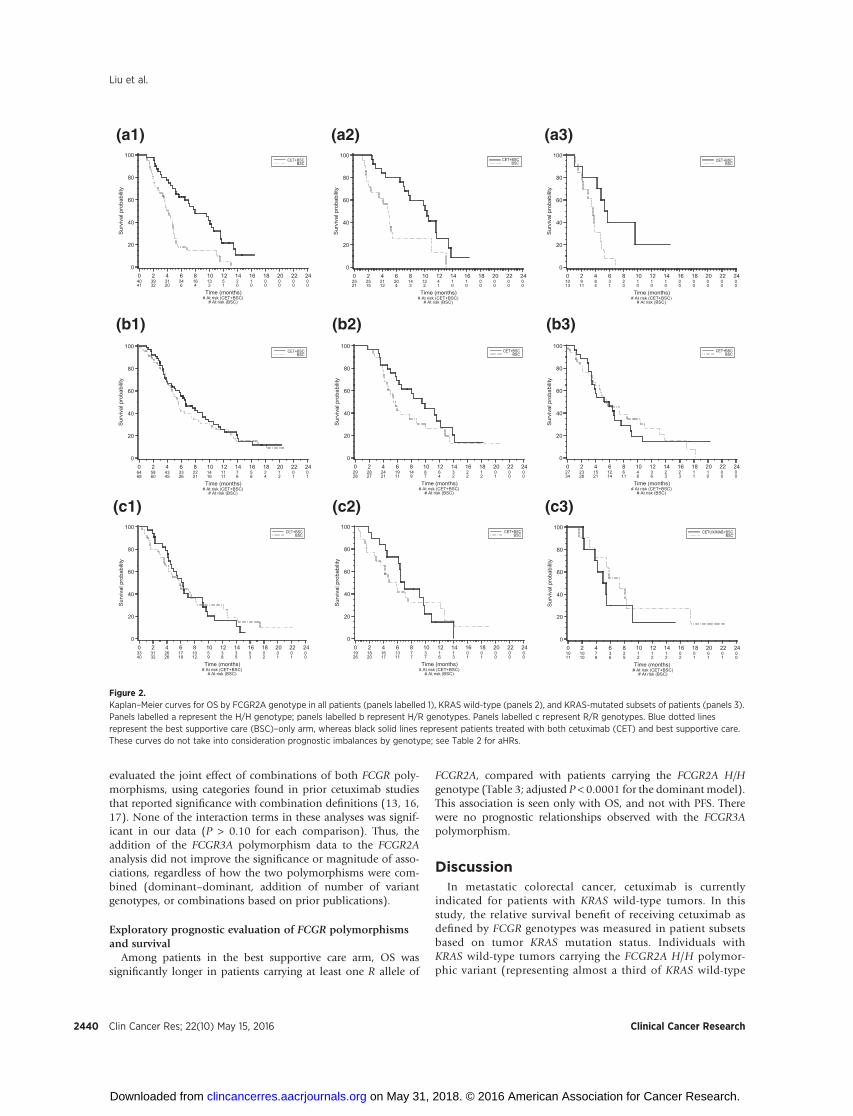
cetuximab approximately doubled PFS. This association was notobserved in KRAS-mutant patients (aHRs comparing treated vs.untreated of 0.65 for H/H and 0.70 for R/R genotypes). In aseparate analysis of the entire population, which adjusted forclinically relevant covariates including KRAS, the interactionbetween genotype and benefit from cetuximab therapy hadP values of 0.005 (OS) and 0.06 (PFS). Kaplan–Meier curvesare shown in Fig. 2 (OS) and Fig. 3 (PFS).
In our study, alternative genetic inheritance assumptions wereprespecified and integral. No recessive or codominant inheritancemodels demonstrated significant (P > 0.05) interactions. How-ever, significant interactions existed between cetuximab andFCGR2A for the dominant genetic models (Table 2, top, right-indented data). Although for patients carrying theH/H genotype,treatment with cetuximab conferred a 3-fold improved OS, thebenefit of receiving cetuximab was diminished for patients car-rying at least one R allele with aHRs of 0.78 (KRAS wild type; P >0.05) and 1.14 (KRAS mutant; P > 0.05). Results were similarwhen considering PFS as the outcome (Table 2, bottom); eventhough there was benefit in all genotype groups, the strongestbenefit was found in the patients carrying the H/H genotype.
Interaction between cetuximab therapy and FCGR3Apolymorphisms and combined effects of both FCGRpolymorphisms
There were no significant interactive relationships betweencarrying FCGR3A and cetuximab therapy on OS or PFS. We also
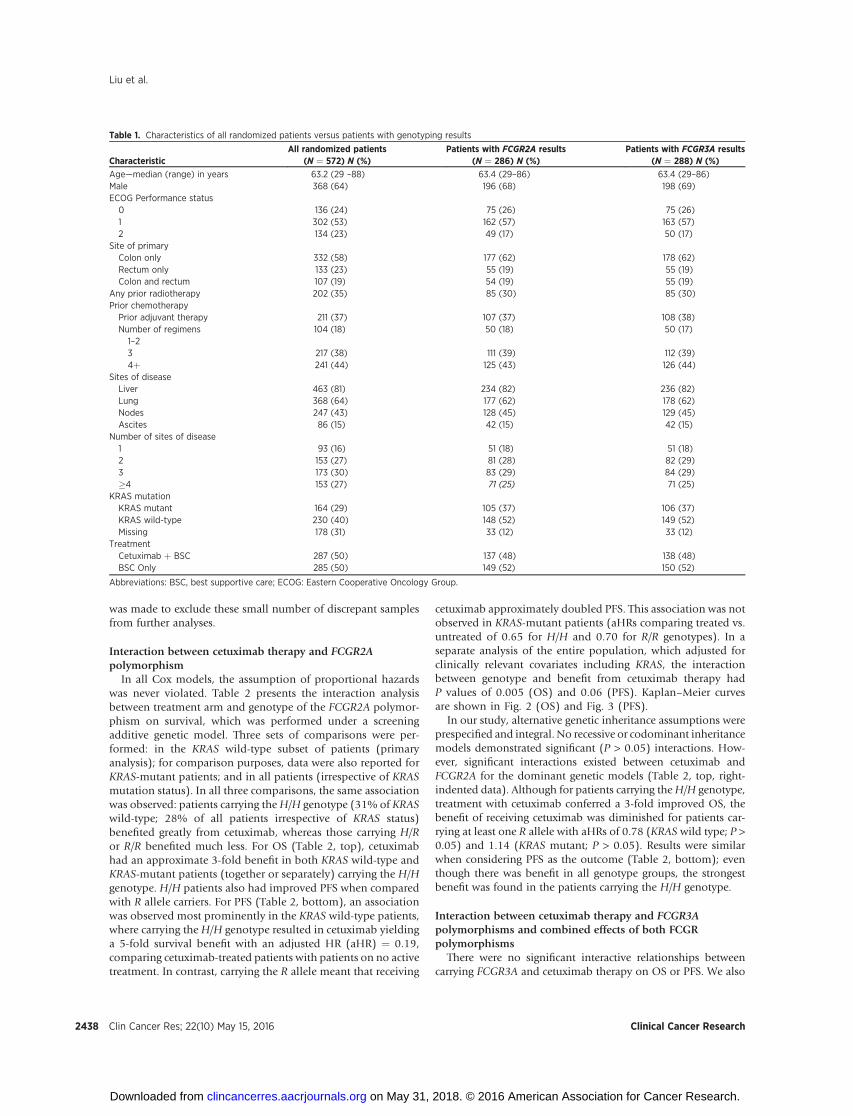
Table 1. Characteristics of all randomized patients versus patients with genotyping results
CharacteristicAll randomized patients
(N ¼ 572) N (%)Patients with FCGR2A results
(N ¼ 286) N (%)Patients with FCGR3A results
(N ¼ 288) N (%)
Age—median (range) in years 63.2 (29 –88) 63.4 (29–86) 63.4 (29–86)Male 368 (64) 196 (68) 198 (69)ECOG Performance status0 136 (24) 75 (26) 75 (26)1 302 (53) 162 (57) 163 (57)2 134 (23) 49 (17) 50 (17)
Site of primaryColon only 332 (58) 177 (62) 178 (62)Rectum only 133 (23) 55 (19) 55 (19)Colon and rectum 107 (19) 54 (19) 55 (19)
Any prior radiotherapy 202 (35) 85 (30) 85 (30)Prior chemotherapyPrior adjuvant therapy 211 (37) 107 (37) 108 (38)Number of regimens1–2
104 (18) 50 (18) 50 (17)
3 217 (38) 111 (39) 112 (39)4þ 241 (44) 125 (43) 126 (44)
Sites of diseaseLiver 463 (81) 234 (82) 236 (82)Lung 368 (64) 177 (62) 178 (62)Nodes 247 (43) 128 (45) 129 (45)Ascites 86 (15) 42 (15) 42 (15)
Number of sites of disease1 93 (16) 51 (18) 51 (18)2 153 (27) 81 (28) 82 (29)3 173 (30) 83 (29) 84 (29)�4 153 (27) 71 (25) 71 (25)
KRAS mutationKRAS mutant 164 (29) 105 (37) 106 (37)KRAS wild-type 230 (40) 148 (52) 149 (52)Missing 178 (31) 33 (12) 33 (12)
TreatmentCetuximab þ BSC 287 (50) 137 (48) 138 (48)BSC Only 285 (50) 149 (52) 150 (52)
Abbreviations: BSC, best supportive care; ECOG: Eastern Cooperative Oncology Group.
Liu et al.
Clin Cancer Res; 22(10) May 15, 2016 Clinical Cancer Research2438
on May 31, 2018. © 2016 American Association for Cancer Research. clincancerres.aacrjournals.org Downloaded from
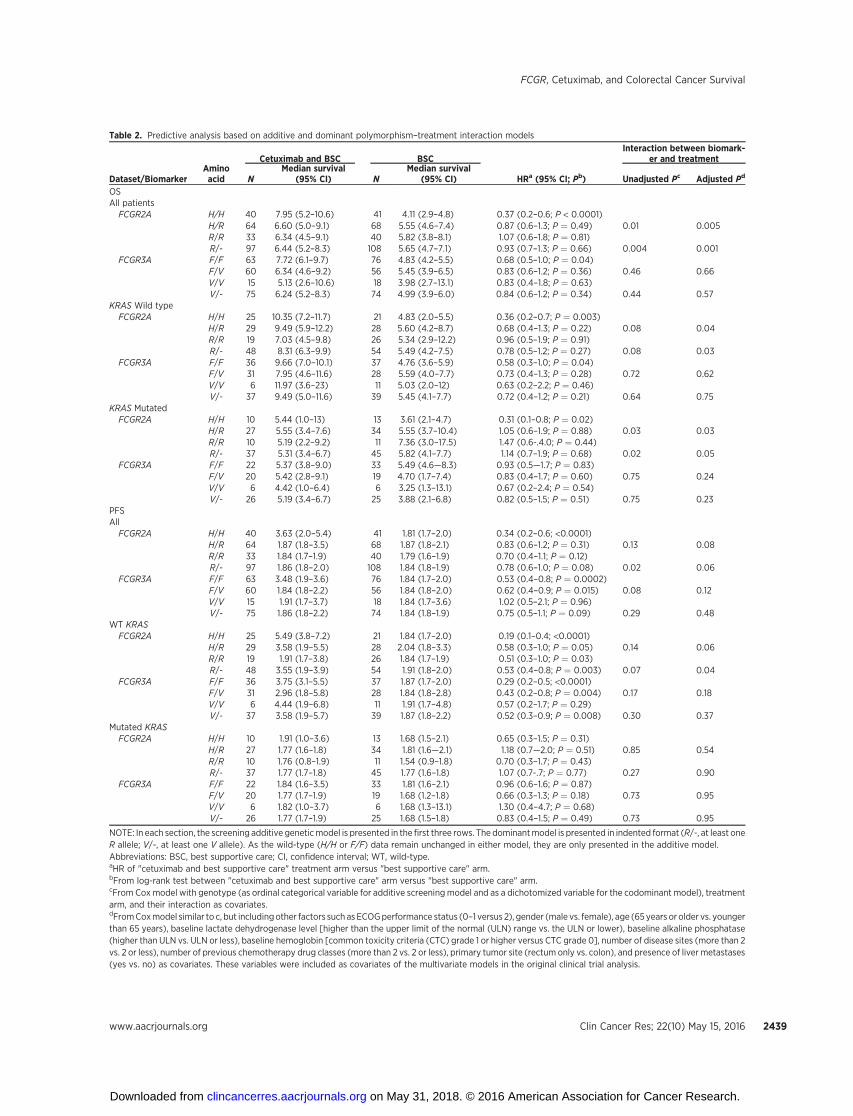
Table 2. Predictive analysis based on additive and dominant polymorphism–treatment interaction models
Cetuximab and BSC BSCInteraction between biomark-
er and treatment
Dataset/BiomarkerAminoacid N
Median survival(95% CI) N
Median survival(95% CI) HRa (95% CI; Pb) Unadjusted Pc Adjusted Pd
OSAll patientsFCGR2A H/H 40 7.95 (5.2–10.6) 41 4.11 (2.9–4.8) 0.37 (0.2–0.6; P < 0.0001)
H/R 64 6.60 (5.0–9.1) 68 5.55 (4.6–7.4) 0.87 (0.6–1.3; P ¼ 0.49) 0.01 0.005R/R 33 6.34 (4.5–9.1) 40 5.82 (3.8–8.1) 1.07 (0.6–1.8; P ¼ 0.81)R/- 97 6.44 (5.2–8.3) 108 5.65 (4.7–7.1) 0.93 (0.7–1.3; P ¼ 0.66) 0.004 0.001
FCGR3A F/F 63 7.72 (6.1–9.7) 76 4.83 (4.2–5.5) 0.68 (0.5–1.0; P ¼ 0.04)F/V 60 6.34 (4.6–9.2) 56 5.45 (3.9–6.5) 0.83 (0.6–1.2; P ¼ 0.36) 0.46 0.66V/V 15 5.13 (2.6–10.6) 18 3.98 (2.7–13.1) 0.83 (0.4–1.8; P ¼ 0.63)V/- 75 6.24 (5.2–8.3) 74 4.99 (3.9–6.0) 0.84 (0.6–1.2; P ¼ 0.34) 0.44 0.57
KRAS Wild typeFCGR2A H/H 25 10.35 (7.2–11.7) 21 4.83 (2.0–5.5) 0.36 (0.2–0.7; P ¼ 0.003)
H/R 29 9.49 (5.9–12.2) 28 5.60 (4.2–8.7) 0.68 (0.4–1.3; P ¼ 0.22) 0.08 0.04R/R 19 7.03 (4.5–9.8) 26 5.34 (2.9–12.2) 0.96 (0.5–1.9; P ¼ 0.91)R/- 48 8.31 (6.3–9.9) 54 5.49 (4.2–7.5) 0.78 (0.5–1.2; P ¼ 0.27) 0.08 0.03
FCGR3A F/F 36 9.66 (7.0–10.1) 37 4.76 (3.6–5.9) 0.58 (0.3–1.0; P ¼ 0.04)F/V 31 7.95 (4.6–11.6) 28 5.59 (4.0–7.7) 0.73 (0.4–1.3; P ¼ 0.28) 0.72 0.62V/V 6 11.97 (3.6–23) 11 5.03 (2.0–12) 0.63 (0.2–2.2; P ¼ 0.46)V/- 37 9.49 (5.0–11.6) 39 5.45 (4.1–7.7) 0.72 (0.4–1.2; P ¼ 0.21) 0.64 0.75
KRAS MutatedFCGR2A H/H 10 5.44 (1.0–13) 13 3.61 (2.1–4.7) 0.31 (0.1–0.8; P ¼ 0.02)
H/R 27 5.55 (3.4–7.6) 34 5.55 (3.7–10.4) 1.05 (0.6–1.9; P ¼ 0.88) 0.03 0.03R/R 10 5.19 (2.2–9.2) 11 7.36 (3.0–17.5) 1.47 (0.6-.4.0; P ¼ 0.44)R/- 37 5.31 (3.4–6.7) 45 5.82 (4.1–7.7) 1.14 (0.7–1.9; P ¼ 0.68) 0.02 0.05
FCGR3A F/F 22 5.37 (3.8–9.0) 33 5.49 (4.6—8.3) 0.93 (0.5—1.7; P ¼ 0.83)F/V 20 5.42 (2.8–9.1) 19 4.70 (1.7–7.4) 0.83 (0.4–1.7; P ¼ 0.60) 0.75 0.24V/V 6 4.42 (1.0–6.4) 6 3.25 (1.3–13.1) 0.67 (0.2–2.4; P ¼ 0.54)V/- 26 5.19 (3.4–6.7) 25 3.88 (2.1–6.8) 0.82 (0.5–1.5; P ¼ 0.51) 0.75 0.23
PFSAllFCGR2A H/H 40 3.63 (2.0–5.4) 41 1.81 (1.7–2.0) 0.34 (0.2–0.6; <0.0001)
H/R 64 1.87 (1.8–3.5) 68 1.87 (1.8–2.1) 0.83 (0.6–1.2; P ¼ 0.31) 0.13 0.08R/R 33 1.84 (1.7–1.9) 40 1.79 (1.6–1.9) 0.70 (0.4–1.1; P ¼ 0.12)R/- 97 1.86 (1.8–2.0) 108 1.84 (1.8–1.9) 0.78 (0.6–1.0; P ¼ 0.08) 0.02 0.06
FCGR3A F/F 63 3.48 (1.9–3.6) 76 1.84 (1.7–2.0) 0.53 (0.4–0.8; P ¼ 0.0002)F/V 60 1.84 (1.8–2.2) 56 1.84 (1.8–2.0) 0.62 (0.4–0.9; P ¼ 0.015) 0.08 0.12V/V 15 1.91 (1.7–3.7) 18 1.84 (1.7–3.6) 1.02 (0.5–2.1; P ¼ 0.96)V/- 75 1.86 (1.8–2.2) 74 1.84 (1.8–1.9) 0.75 (0.5–1.1; P ¼ 0.09) 0.29 0.48
WT KRASFCGR2A H/H 25 5.49 (3.8–7.2) 21 1.84 (1.7–2.0) 0.19 (0.1–0.4; <0.0001)
H/R 29 3.58 (1.9–5.5) 28 2.04 (1.8–3.3) 0.58 (0.3–1.0; P ¼ 0.05) 0.14 0.06R/R 19 1.91 (1.7–3.8) 26 1.84 (1.7–1.9) 0.51 (0.3–1.0; P ¼ 0.03)R/- 48 3.55 (1.9–3.9) 54 1.91 (1.8–2.0) 0.53 (0.4–0.8; P ¼ 0.003) 0.07 0.04
FCGR3A F/F 36 3.75 (3.1–5.5) 37 1.87 (1.7–2.0) 0.29 (0.2–0.5; <0.0001)F/V 31 2.96 (1.8–5.8) 28 1.84 (1.8–2.8) 0.43 (0.2–0.8; P ¼ 0.004) 0.17 0.18V/V 6 4.44 (1.9–6.8) 11 1.91 (1.7–4.8) 0.57 (0.2–1.7; P ¼ 0.29)V/- 37 3.58 (1.9–5.7) 39 1.87 (1.8–2.2) 0.52 (0.3–0.9; P ¼ 0.008) 0.30 0.37
Mutated KRASFCGR2A H/H 10 1.91 (1.0–3.6) 13 1.68 (1.5–2.1) 0.65 (0.3–1.5; P ¼ 0.31)
H/R 27 1.77 (1.6–1.8) 34 1.81 (1.6—2.1) 1.18 (0.7—2.0; P ¼ 0.51) 0.85 0.54R/R 10 1.76 (0.8–1.9) 11 1.54 (0.9–1.8) 0.70 (0.3–1.7; P ¼ 0.43)R/- 37 1.77 (1.7–1.8) 45 1.77 (1.6–1.8) 1.07 (0.7-.7; P ¼ 0.77) 0.27 0.90
FCGR3A F/F 22 1.84 (1.6–3.5) 33 1.81 (1.6–2.1) 0.96 (0.6–1.6; P ¼ 0.87)F/V 20 1.77 (1.7–1.9) 19 1.68 (1.2–1.8) 0.66 (0.3–1.3; P ¼ 0.18) 0.73 0.95V/V 6 1.82 (1.0–3.7) 6 1.68 (1.3–13.1) 1.30 (0.4–4.7; P ¼ 0.68)V/- 26 1.77 (1.7–1.9) 25 1.68 (1.5–1.8) 0.83 (0.4–1.5; P ¼ 0.49) 0.73 0.95
NOTE: In each section, the screening additive geneticmodel is presented in the first three rows. The dominantmodel is presented in indented format (R/-, at least oneR allele; V/-, at least one V allele). As the wild-type (H/H or F/F) data remain unchanged in either model, they are only presented in the additive model.Abbreviations: BSC, best supportive care; CI, confidence interval; WT, wild-type.aHR of "cetuximab and best supportive care" treatment arm versus "best supportive care" arm.bFrom log-rank test between "cetuximab and best supportive care" arm versus "best supportive care" arm.cFrom Cox model with genotype (as ordinal categorical variable for additive screening model and as a dichotomized variable for the codominant model), treatmentarm, and their interaction as covariates.dFromCoxmodel similar to c, but includingother factors such as ECOGperformance status (0–1 versus 2), gender (male vs. female), age (65 years or older vs. youngerthan 65 years), baseline lactate dehydrogenase level [higher than the upper limit of the normal (ULN) range vs. the ULN or lower), baseline alkaline phosphatase(higher than ULN vs. ULN or less), baseline hemoglobin [common toxicity criteria (CTC) grade 1 or higher versus CTC grade 0], number of disease sites (more than 2vs. 2 or less), number of previous chemotherapy drug classes (more than 2 vs. 2 or less), primary tumor site (rectum only vs. colon), and presence of liver metastases(yes vs. no) as covariates. These variables were included as covariates of the multivariate models in the original clinical trial analysis.
FCGR, Cetuximab, and Colorectal Cancer Survival
www.aacrjournals.org Clin Cancer Res; 22(10) May 15, 2016 2439
on May 31, 2018. © 2016 American Association for Cancer Research. clincancerres.aacrjournals.org Downloaded from
evaluated the joint effect of combinations of both FCGR poly-morphisms, using categories found in prior cetuximab studiesthat reported significance with combination definitions (13, 16,17). None of the interaction terms in these analyses was signif-icant in our data (P > 0.10 for each comparison). Thus, theaddition of the FCGR3A polymorphism data to the FCGR2Aanalysis did not improve the significance or magnitude of asso-ciations, regardless of how the two polymorphisms were com-bined (dominant–dominant, addition of number of variantgenotypes, or combinations based on prior publications).
Exploratory prognostic evaluation of FCGR polymorphismsand survival
Among patients in the best supportive care arm, OS wassignificantly longer in patients carrying at least one R allele of
FCGR2A, compared with patients carrying the FCGR2A H/Hgenotype (Table 3; adjusted P < 0.0001 for the dominant model).This association is seen only with OS, and not with PFS. Therewere no prognostic relationships observed with the FCGR3Apolymorphism.
DiscussionIn metastatic colorectal cancer, cetuximab is currently
indicated for patients with KRAS wild-type tumors. In thisstudy, the relative survival benefit of receiving cetuximab asdefined by FCGR genotypes was measured in patient subsetsbased on tumor KRAS mutation status. Individuals withKRAS wild-type tumors carrying the FCGR2A H/H polymor-phic variant (representing almost a third of KRAS wild-type
Sur
viva
l pro
babi
lity
0
20
40
60
80
100
Time (months) # At risk (CET+BSC)
# At risk (BSC)
0 4041
2 3932
4 3120
6 246
8 164
10133
1251
1420
1610
1800
2000
2200
2400
CET+BSCBSC
(a1)
Sur
viva
l pro
babi
lity
0
20
40
60
80
100
Time (months) # At risk (CET+BSC)
# At risk (BSC)
0 2521
2 2515
4 2112
6 204
8 143
10122
1241
1410
1610
1800
2000
2200
2400
CET+BSCBSC
(a2)
Sur
viva
l pro
babi
lity
0
20
40
60
80
100
Time (months) # At risk (CET+BSC)
# At risk (BSC)
0 1013
2 9
11
4 84
6 31
8 20
1010
1210
1410
1600
1800
2000
2200
2400
CET+BSCBSC
(a3)S
urvi
val p
roba
bilit
y
0
20
40
60
80
100
Time (months) # At risk (CET+BSC)
# At risk (BSC)
0 6468
2 5860
4 4345
6 3326
8 2221
101416
121111
1476
1656
1824
2012
2201
2401
CET+BSCBSC
(b1)S
urvi
val p
roba
bilit
y
0
20
40
60
80
100
Time (months) # At risk (CET+BSC)
# At risk (BSC)
0 2928
2 2827
4 2421
6 1911
8 149
1087
1264
1432
1622
1812
2001
2200
2400
CET+BSCBSC
(b2)
Sur
viva
l pro
babi
lity
0
20
40
60
80
100
Time (months) # At risk (CET+BSC)
# At risk (BSC)
0 2734
2 2328
4 1521
6 1214
8 6
11
1048
1236
1423
1623
1811
2010
2200
2400
CET+BSCBSC
(b3)
Sur
viva
l pro
babi
lity
0
20
40
60
80
100
Time (months) # At risk (CET+BSC)
# At risk (BSC)
0 3340
2 3132
4 2626
6 1718
8 1012
1059
1238
1435
1603
1802
2001
2201
2400
CET+BSCBSC
(c1)
Sur
viva
l pro
babi
lity
0
20
40
60
80
100
Time (months) # At risk (CET+BSC)
# At risk (BSC)
0 1926
2 1820
4 1617
6 1311
8 77
1037
1216
1413
1601
1801
2000
2200
2400
CET+BSCBSC
(c2)
Sur
viva
l pro
babi
lity
0
20
40
60
80
100
Time (months) # At risk (CET+BSC)
# At risk (BSC)
0 1011
2 1010
4 78
6 36
8 25
1012
1212
1412
1602
1801
2001
2201
2400
CETUXIMAB+BSCBSC
(c3)
Figure 2.Kaplan–Meier curves for OS by FCGR2A genotype in all patients (panels labelled 1), KRAS wild-type (panels 2), and KRAS-mutated subsets of patients (panels 3).Panels labelled a represent the H/H genotype; panels labelled b represent H/R genotypes. Panels labelled c represent R/R genotypes. Blue dotted linesrepresent the best supportive care (BSC)–only arm, whereas black solid lines represent patients treated with both cetuximab (CET) and best supportive care.These curves do not take into consideration prognostic imbalances by genotype; see Table 2 for aHRs.
Liu et al.
Clin Cancer Res; 22(10) May 15, 2016 Clinical Cancer Research2440
on May 31, 2018. © 2016 American Association for Cancer Research. clincancerres.aacrjournals.org Downloaded from
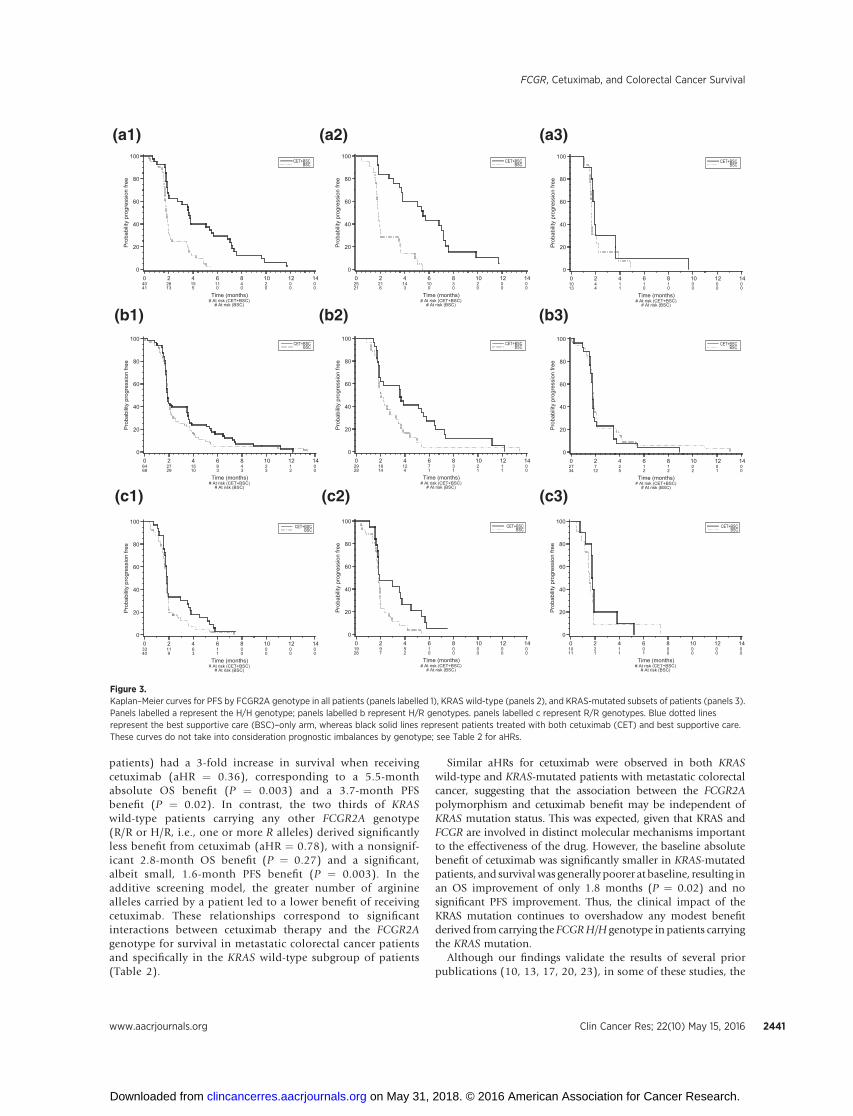
patients) had a 3-fold increase in survival when receivingcetuximab (aHR ¼ 0.36), corresponding to a 5.5-monthabsolute OS benefit (P ¼ 0.003) and a 3.7-month PFSbenefit (P ¼ 0.02). In contrast, the two thirds of KRASwild-type patients carrying any other FCGR2A genotype(R/R or H/R, i.e., one or more R alleles) derived significantlyless benefit from cetuximab (aHR ¼ 0.78), with a nonsignif-icant 2.8-month OS benefit (P ¼ 0.27) and a significant,albeit small, 1.6-month PFS benefit (P ¼ 0.003). In theadditive screening model, the greater number of argininealleles carried by a patient led to a lower benefit of receivingcetuximab. These relationships correspond to significantinteractions between cetuximab therapy and the FCGR2Agenotype for survival in metastatic colorectal cancer patientsand specifically in the KRAS wild-type subgroup of patients(Table 2).
Similar aHRs for cetuximab were observed in both KRASwild-type and KRAS-mutated patients with metastatic colorectalcancer, suggesting that the association between the FCGR2Apolymorphism and cetuximab benefit may be independent ofKRAS mutation status. This was expected, given that KRAS andFCGR are involved in distinct molecular mechanisms importantto the effectiveness of the drug. However, the baseline absolutebenefit of cetuximab was significantly smaller in KRAS-mutatedpatients, and survival was generally poorer at baseline, resulting inan OS improvement of only 1.8 months (P ¼ 0.02) and nosignificant PFS improvement. Thus, the clinical impact of theKRAS mutation continues to overshadow any modest benefitderived from carrying the FCGRH/H genotype in patients carryingthe KRAS mutation.
Although our findings validate the results of several priorpublications (10, 13, 17, 20, 23), in some of these studies, the
Pro
babi
lity
prog
ress
ion
free
0
20
40
60
80
100
Time (months) # At risk (CET+BSC)
# At risk (BSC)
0 4041
2 2613
4 155
6 110
8 40
1020
1200
1400
CET+BSCBSC
(a1)
Pro
babi
lity
prog
ress
ion
free
0
20
40
60
80
100
Time (months) # At risk (CET+BSC)
# At risk (BSC)
0 2521
2 216
4 143
6 100
8 30
1020
1200
1400
CET+BSCBSC
(a2)
Pro
babi
lity
prog
ress
ion
free
0
20
40
60
80
100
Time (months) # At risk (CET+BSC)
# At risk (BSC)
0 1013
2 44
4 11
6 10
8 10
1000
1200
1400
CET+BSCBSC
(a3)P
roba
bilit
y pr
ogre
ssio
n fre
e
0
20
40
60
80
100
Time (months) # At risk (CET+BSC)
# At risk (BSC)
0 6468
2 2729
4 1510
6 93
8 43
1023
1212
1400
CET+BSCBSC
(b1)P
roba
bilit
y pr
ogre
ssio
n fre
e
0
20
40
60
80
100
Time (months) # At risk (CET+BSC)
# At risk (BSC)
0 2928
2 1814
4 124
6 71
8 31
1021
1211
1400
CET+BSCBSC
(b2)
Pro
babi
lity
prog
ress
ion
free
0
20
40
60
80
100
Time (months) # At risk (CET+BSC)
# At risk (BSC)
0 2734
2 7
12
4 25
6 12
8 12
1002
1201
1400
CET+BSCBSC
(b3)
Pro
babi
lity
prog
ress
ion
free
0
20
40
60
80
100
Time (months) # At risk (CET+BSC)
# At risk (BSC)
0 3340
2 119
4 63
6 11
8 00
1000
1200
1400
CET+BSCBSC
(c1)
Pro
babi
lity
prog
ress
ion
free
0
20
40
60
80
100
Time (months) # At risk (CET+BSC)
# At risk (BSC)
0 1926
2 97
4 52
6 10
8 00
1000
1200
1400
CET+BSCBSC
(c2)
Pro
babi
lity
prog
ress
ion
free
0
20
40
60
80
100
Time (months) # At risk (CET+BSC)
# At risk (BSC)
0 1011
2 21
4 11
6 01
8 00
1000
1200
1400
CET+BSCBSC
(c3)
Figure 3.Kaplan–Meier curves for PFS by FCGR2A genotype in all patients (panels labelled 1), KRAS wild-type (panels 2), and KRAS-mutated subsets of patients (panels 3).Panels labelled a represent the H/H genotype; panels labelled b represent H/R genotypes. panels labelled c represent R/R genotypes. Blue dotted linesrepresent the best supportive care (BSC)–only arm, whereas black solid lines represent patients treated with both cetuximab (CET) and best supportive care.These curves do not take into consideration prognostic imbalances by genotype; see Table 2 for aHRs.
FCGR, Cetuximab, and Colorectal Cancer Survival
www.aacrjournals.org Clin Cancer Res; 22(10) May 15, 2016 2441
on May 31, 2018. © 2016 American Association for Cancer Research. clincancerres.aacrjournals.org Downloaded from

Table 3. Prognostic analysis based on additive and dominant genetic models in the BSC arm only
Univariable analysis Multivariable analysisa
Dataset/Biomarker Amino acid N Median survival (months) HRb (95% CI) Pc HRb (95% CI) Pc
OSAllFCGR2A H/H 41 4.11 1 1
H/R 68 5.55 0.71 (0.6–0.9) 0.01 0.72 (0.5–1.0) 0.03R/R 40 5.82 0.51 (0.3–0.9) 0.51 (0.3–0.9)R/- 108 5.65 052 (0.3–0.8) <0.0001 0.48 (0.3–0.7) <0.0001
FCGR3A F/F 76 4.83 1 1F/V 56 5.45 1.00 (0.8–1.3) 0.99 1.00 (0.8–1.3) 0.99V/V 18 3.98 1.00 (0.6–1.7) 1.00 (0.6–1.8)V/- 74 4.99 0.99 (0.7–1.4) 0.95 1.03 (0.7–1.5) 0.87
WT KRASFCGR2A H/H 21 4.83 1 0.34 1 0.55
H/R 28 5.60 0.85 (0.6–1.2) 0.87 (0.6–1.4)R/R 26 5.34 0.72 (0.4,-1.4) 0.76 (0.3–1.8)R/- 54 5.49 0.65 (0.4–1.2) 0.15 0.59 (0.3–1.2) 0.13
FCGR3A F/F 37 4.76 1 0.48 1 0.40F/V 28 5.59 0.88 (0.6–1.3) 0.82 (0.5–1.3)V/V 11 5.03 0.77 (0.4–1.6) 0.68 (0.3–1.7)V/- 39 5.45 0.91 (0.6–1.5) 0.73 0.90 (0.5–1.7) 0.77
Mutated KRASFCGR2A H/H 13 3.61 1 0.01 1 0.05
H/R 34 5.55 0.49 (0.3–0.8) 0.55 (0.3–1.0)R/R 11 7.36 0.24 (0.1- 0.7) 0.30 (0.1–1.0)R/- 45 5.82 0.31 (0.2–0.6) <0.0001 0.44 (0.2–1.0) 0.05
FCGR3A F/F 33 5.49 1 0.13 1 0.02F/V 19 4.70 1.39 (0.9–2.1) 1.88 (1.1–3.2)V/V 6 3.25 1.92 (0.8–4.5) 3.52 (1.2–10.0)R/- 25 3.88 1.36 (0.8–2.4) 0.28 1.92 (1.0–3.8) 0.07
PFSAllFCGR2A H/H 41 1.81 1 0.46 1 0.30
H/R 68 1.87 1.09 (0.9–1.4) 1.14 (0.9–1.5)R/R 40 1.79 1.20 (0.8–1.9) 1.31 (0.8–2.2)R/- 108 1.84 1.10 (0.8–1.6) 0.61 1.01 (0.7–1.5) 0.97
FCGR3A F/F 76 1.84 1 0.22 1 0.29F/V 56 1.84 0.87 (0.7–1.1) 0.87 (0.7–1.1)V/V 18 1.84 0.75 (0.5–1.2) 0.76 (0.5–1.3)V/- 74 1.84 0.85 (0.6–1.2) 0.52 0.85 (0.-1.5) 0.57
WT KRASFCGR2A H/H 21 1.84 1 0.37 1 0.92
H/R 28 2.04 1.16 (0.8–1.6) 1.02 (0.7–1.5)R/R 26 1.84 1.34 (0.7–2.5) 1.04 (0.5–2.2)R/- 54 1.91 1.20 (0.8–1.7) 0.88 1.02 (0.7–1.6) 0.61
FCGR3A F/F 37 1.87 1 0.16 1 0.26F/V 28 1.84 0.79 (0.6–1.1) 0.80 (0.5–1.2)V/V 11 1.91 0.62 (0.3–1.2) 0.64 (0.3–1.4)V/- 39 1.87 0.75 (0.5–1.2) 0.23 0.78 (0.5–1.4) 0.42
Mutated KRASFCGR2A H/H 13 1.68 1 0.71 1 0.53
H/R 34 1.81 1.09 (0.7–1.7) 1.19 (0.7–2.1)R/R 11 1.54 1.19 (0.5–3.0) 1.42 (0.5–4.2)R/- 45 1.77 1.10 (0.4–1.6) 0.57 1.20 (0.7–2.3) 0.79
FCGR3A F/F 33 1.81 1 0.64 1 0.60F/V 19 1.68 1.09 (0.8–1.6) 1.12 (0.7–1.7)V/V 6 1.68 1.18 (0.6–2.4) 1.25 (0.5–2.9)V/- 25 1.68 1.10 (0.8–1.6) 0.39 1.15 (0.6–1.9) 0.47
NOTE: In each section, the codominantmodel is presented in the first three rows. Then, the dominantmodel is presented in indented format (R/-, at least oneR allele;V/-, at least one V allele). As the wild-type (H/H or F/F) data remain unchanged in either model, they are only presented with the codominant model.Abbreviations: BSC, best supportive care; CI, confidence interval; WT, wild type.aCox regression adjusted for the following factors: ECOG performance status (0–1 vs. 2), gender (male vs. female), age (65 years or older vs. younger than 65 years),baseline lactate dehydrogenase level [higher than the upper limit of the normal (ULN) range vs. ULN or lower], baseline alkaline phosphatase (higher than ULN vs.ULN or less), baseline hemoglobin [common toxicity criteria (CTC) grade 1 or higher vs. CTC grade 0], number of disease sites (more than 2 vs. 2 or less), number ofprevious chemotherapy drug classes (more than 2 vs. 2 or less), primary tumor site (rectumonly vs. colon), and presence of livermetastases (yes vs. no) as covariates.These variables were included as covariates of the multivariate models in the original clinical trial analysis.bHR comparing each group over first category, the reference, which is labeled "1."cFrom the global test for the polymorphism variable.
Liu et al.
Clin Cancer Res; 22(10) May 15, 2016 Clinical Cancer Research2442
on May 31, 2018. © 2016 American Association for Cancer Research. clincancerres.aacrjournals.org Downloaded from
identified relationship involved a combination of FCGR2A andFCGR3A polymorphisms, rather than with the FCGR2A poly-morphism alone. A recent consortium analysis of over a thou-sand cases, however, did not find any FCGR2A relationships(24). What sets our study apart is the confirmation that theFCGR2A relationships are predictive of cetuximab outcome ina pure randomized cetuximab versus no cetuximab setting,which is a key critical point in determining the clinical impactof a biomarker. The idea that the FCGR2A polymorphism statusof a patient might modify the effect of cetuximab on survival isbiologically plausible. Musolino and colleagues (10) studiedtrastuzumab (another therapeutic monoclonal IgG1 antibody)and identified greater ADCC-related cytotoxicity in patientswith the H/H genotype, when compared with other patients.Importantly, in a study of patients treated with trastuzumab,Tamura and colleagues (2011) also reported that the FCGR2AH/H genotype had favorable outcomes of pathologic completeresponse to trastuzumab in a neoadjuvant setting and PFS in ametastatic setting (22).
In our original analysis plan, we prespecified a standard screen-ing genetic additive model. In retrospect, based on functionaltesting (10) andpublications (10, 13, 17, 20), thebulkof evidencenow points to dominant genetic model of FCGR2A. It is alsounder this dominant genetic model that CO.17 demonstratesthe strongest interaction and greatest significance for OS/PFS (byinteraction P value). The results of this analysis are of significantinterest, as other trials are unlikely to be used for a similarinteraction analysis, either because there is no comparablenon-cetuximab arm, or the arms will be confounded by concur-rent therapy with other antineoplastic agents.
The interpretation of the FCGR3A data is more complex. Asreviewed by Mellor and colleagues (21), there have been equalnumbers of studies that found that the V allele was beneficial asstudies that found that the F allele was beneficial. For example,although Zhang and colleagues (18) demonstrated a favorableoutcome association with the F allele of FCGR3A, Musolino andcolleagues (10) reported a favorable association of the oppositeFCGR3A V allele. In contrast, both studies reported that theFCGR2A H/H genotype had favorable outcome characteristics,consistent with the results of this study. It is therefore notsurprising that in our analyses, we found no relationship betweenthe FCGR3A polymorphism and outcome in either the cetuximabwith best supportive care or the best supportive care alone arms;furthermore, we found no evidence of a polymorphism–treat-ment arm interaction.
A major concern has been the appropriate genotyping of theFCGR3A polymorphism, which has high homology with aknown pseudogene that contains a specific sequence that affectsthe detectability of this polymorphism (21). By utilizing threedifferent blinded laboratories, and three different sets of pri-mers/techniques, the risk of incorrectly genotyping this poly-morphism was minimized. Furthermore, unlike other studies(13, 19), the FCGR3A polymorphism in our study was inHardy–Weinberg equilibrium (P > 0.20), consistent with accu-rate genotyping.
In an exploratory analysis, carrying the R/R or H/R geno-types of the FCGR2A polymorphism was observed to haveimproved OS (i.e., a prognostic relationship, unrelated tocetuximab administration), but not PFS, after adjustment forimportant covariates. We report this prognostic association asbeing hypothesis generating and to better understand the
underlying relationships between FCGR polymorphisms andoutcome in this particular trial population. This prognosticobservation should be replicated in other colorectal cancerpopulations and possibly in other cancers, such as breast canceror lymphoma, before being generalized into other settings.
Strengths of this study include (i) the presence of a random-ized nondrug comparison arm, enabling interaction analysis;(ii) the relatively large sample size compared with prior studies;and (iii) having uniformly defined patient management andclinically relevant outcomes. However, there are a number oflimitations related to genotyping. First, only 51% of the parti-cipants in the original trial provided adequate tissue for geno-typing. Although the genotyped group was similar in all keyclinical and demographic characteristics when compared withthe entire trial population (Table 1), some undetected bias mayremain. Second, DNA in a minority (7%) of cases was derivedfrom tumor tissue; however, a sensitivity analyses found nochange in conclusions when excluding DNA derived fromtumor tissue. Third, because of sample size, there was insuffi-cient power to exclude subtle interactive effects between cetux-imab therapy and the FCGR3A polymorphism. Fourth, theKRAS wild-type subset was defined based on the assessmentof lack of mutations seen in exon 2; the effect of other,significantly rarer RAS and BRAF mutations on this polymor-phism–outcome association is unknown.
In summary, through Cox proportional hazards models ofpatient survival, we have validated a biologically plausiblerelationship between a dominant genetic model of the FCGR2Apolymorphism and monotherapy with cetuximab. In NCIC-CTG CO.17 patients, cetuximab was associated with a greatersurvival benefit in FCGR2A H/H patients with KRAS wild-typecolorectal cancers. Significantly lower benefit was observed inpatients carrying FCGR2A R alleles. The criteria for withholdinga potentially beneficial therapy in colorectal cancer must bequite stringent; because all genotypic groups benefited, but todifferent extents, we cannot recommend withholding cetuxi-mab therapy solely on the basis of FCGR2A genotyping results;standard recommendations based on RAS/BRAF mutationsshould remain. Nonetheless, our findings in CO.17, in additionto those from Kjerson et al (23), provide compelling evidencethat warrants prospective studies evaluating the utility of theFCGR2A polymorphism as a marker in clinical management.That the Geva and collegues' (24) retrospective analysis ofobservational cohorts is negative further raises the need for aprospective analysis. Such studies should also evaluate the roleof rarer RAS and BRAF mutations in this polymorphism–out-come relationship, where the clinical comparison would be tooffer KRAS wild-type patients carrying the R allele cetuximabversus alternative therapy, possibly in the context of a multiarmmolecular targeting trial.
Disclosure of Potential Conflicts of InterestT.J. Price is a consultant/advisory board member for AMGEN and Merck, N.
C. Tebbutt andC.S. Karapetis are consultant/advisory boardmembers forMerckSerono, and J.R. Zalcberg reports receiving commercial research grants fromMerck Serono. No potential conflicts of interest were disclosed by the otherauthors.
Authors' ContributionsConception and design: G. Liu, D. Tu, M. Lewis, J. Simes, D.J. Jonker, J.R.Zalcberg, C.S. Karapetis, A. Dobrovic
FCGR, Cetuximab, and Colorectal Cancer Survival
www.aacrjournals.org Clin Cancer Res; 22(10) May 15, 2016 2443
on May 31, 2018. © 2016 American Association for Cancer Research. clincancerres.aacrjournals.org Downloaded from
Development of methodology: G. Liu, M. Lewis, D. Cheng, L.A. Sullivan, J.D.Mellor, T. Mikeska, D.J. Jonker, C.J. O'Callaghan, C.S. Karapetis, A. DobrovicAcquisition of data (provided animals, acquired and managed patients,provided facilities, etc.): G. Liu, T.J. Price, N.C. Tebbutt, J.D. Shapiro, G.M.Jeffery, J.D. Mellor, T. Mikeska, S. Virk, L.E. Shepherd, D.J. Jonker, C.J. O'Call-aghan, C.S. Karapetis, A. DobrovicAnalysis and interpretation of data (e.g., statistical analysis, biostatistics,computational analysis): G. Liu, D. Tu, E. Morgen, J. Simes, T.J. Price, N.C.Tebbutt, J.D. Shapiro, J.D. Mellor, T. Mikeska, L.E. Shepherd, C.J. O'Callaghan,J.R. Zalcberg, C.S. KarapetisWriting, review, and/or revision of the manuscript: G. Liu, D. Tu, E. Morgen,J. Simes, T.J. Price, N.C. Tebbutt, J.D. Shapiro, G.M. Jeffery, J.D. Mellor,T. Mikeska, S. Virk, L.E. Shepherd, D.J. Jonker, C.J. O'Callaghan, J.R. Zalcberg,C.S. Karapetis, A. DobrovicAdministrative, technical, or material support (i.e., reporting or organizingdata, constructing databases): G. Liu, Z. Chen, E. Morgen, J.D. Mellor, S. Virk,C.J. O'CallaghanStudy supervision: T.J. Price, G.M. Jeffery, C.J. O'Callaghan, J.R. Zalcberg,C.S. Karapetis, A. Dobrovic
Grant SupportThis research was supported by an OICR High Impact Clinical Trial Small
Project Grant and by an unrestricted grant from Transgenomic, Inc. G. Liuwas supported by the Alan B. Brown Chair in Molecular Genomics and theCancer Care Ontario Chair in Experimental Therapeutics and PopulationStudies, E. Morgen was supported by a CIHR Banting and Best CanadaGraduate Scholarship, and J.D. Mellor was supported by a grant from thePeter MacCallum Cancer Centre Research Foundation. This work was alsosupported by the NCIC Clinical Trials Group Tumour Tissue Data Repository(TTDR). The NCIC CTG TTDR is a member of the Canadian TumourRepository Network.
The costs of publication of this article were defrayed in part by thepayment of page charges. This article must therefore be hereby markedadvertisement in accordance with 18 U.S.C. Section 1734 solely to indicatethis fact.
Received March 5, 2015; revised November 20, 2015; accepted December 3,2015; published online May 13, 2016.
References1. Jonker DJ, O'Callaghan CJ, Karapetis Zalcberg JR, Tu D, Au HJ, et al.
Cetuximab for the treatment of colorectal cancer. N Engl J Med 2007;357:2040–8.
2. Karapetis CS, Khambata-Ford S, Jonker DJ, O'Callaghan CJ, Tu D, TebbuttNC, Simes RJ, et al. K-ras mutations and benefit from cetuximab inadvanced colorectal cancer. N Engl J Med 2008;359:1757–65.
3. Qiu LX, Mao C, Zhang J, Zhu XD, Liao RY, Xue K, et al. Predictive andprognostic value of KRASmutations inmetastatic colorectal cancer patientstreated with cetuximab: a meta-analysis of 22 studies. Eur J Cancer 2010;46:2781–7.
4. Alderson KL, Sondel PM. Clinical cancer therapy by NK cells via antibody-dependent cell-mediated cytotoxicity. J Biomed Biotechnol 2011;2011:379123.
5. Clynes RA, Towers TL, Presta LG, et al. Inhibitory Fc receptors modulate invivo cytoxicity against tumor targets. Nat Med 2000;6:443–6.
6. Weiner LM, Surana R, Wang S. Monoclonal antibodies: versatile platformsfor cancer immunotherapy. Nat Rev Immunol 2010;10:317–27.
7. Clynes R. Antitumor antibodies in the treatment of cancer. Fc receptors linkopsonic antibody with cellular immunity. Hematol Oncol Clin North Am2006;20:585–612.
8. Gessner JE, Heiken H, Tamm A, Schmidt RE. The IgG Fc receptor family.Ann Hematol 1998;76:231–48.
9. Warmerdam PA, van de Winkel JG, Vlug A, Vlug A, Westerdaal NA,Capel PJ. A single amino acid in the second Ig-like domain of the humanFc gamma receptor II is critical for human IgG2 binding. J Immunol1991;147:1338–43.
10. Musolino A, Naldi N, Bortesi B, Pezzuolo D, Capelletti M, Missale G, et al.Immunoglobulin G Fragment C receptor polymorphisms and clinicalefficacy of trastuzumab-based therapy in patients withHER-2/neu-positivemetastatic breast cancer. J Clin Oncol 2008;26:1789–96.
11. Radaev S,Motyka S, FridmanWH, Sautes-FridmanC, SunPD. The structureof a human type III Fcgamma receptor in complex with Fc. J Biol Chem2001;276:16469–77.
12. SondermannP,Huber R,Oosthuizen V, JacobU. The 3.2-A crystal structureof the human IgG1 Fc fragment-Fc gammaRIII complex. Nature 2000;406:267–73.
13. Bibeau F, Lopez-Crapez E, Di Fiore F, Thezenas S, Ychou M, Blanchard F,et al. Impact of Fc-gamma-RIIa-Fc-gamma-RIIIa polymorphisms andKRAS mutations on the clinical outcome of patients with metastaticcolorectal cancer treated with cetuximab plus irinotecan. J Clin Oncol2009;27:1122–9.
14. Dahan L, Norguet E, Etienne-Grimaldi MC, Formento JL, Gasmi M, NanniI, et al. Pharmacogenetic profiling and cetuximab outcome in patients withadvanced colorectal cancer. BMC Cancer 2011;11:496.
15. Etienne-Grimaldi MC, Bennouna J, Formento JL, Douillard JY, Fran-coual M, Hennebelle I, et al. Multifactorial pharmacogenetic analysisin colorectal cancer patients receiving 5-fluorouracil-based therapytogether with cetuximab-irinotecan. Br J Clin Pharmacol 2012;73:776–85.
16. Paez D, Pare L, Espinosa I, Salazar J, del Rio E, Barnadas A, et al.Immunoglobulin G fragment C receptor polymorphisms and KRASmutations: are they useful biomarkers of clinical outcome in advancedcolorectal cancer treated with anti-EGFR-based therapy? Cancer Sci2010;101:2048–53.
17. Rodriguez J, Zarate R, Bandres E, Boni V, Hern�andez A, Sola JJ, et al.Fc gamma receptor polymorphisms as predictive markers ofCetuximab efficacy in epidermal growth factor receptor down-stream-mutated metastatic colorectal cancer. Eur J Cancer 2012;48:1774–80.
18. Zhang W, Gordon M, Schultheis AM, Yang DY, Nagashima F, Azuma M,et al. FCGR2A and FCGR3A polymorphisms associated with clinicaloutcome of epidermal growth factor receptor expressing metastatic colo-rectal cancer patients treated with single-agent cetuximab. J Clin Oncol2007;25:3712–8.
19. ZhangW, AzumaM, Lurje G, GordonMA, Yang D, Pohl A, et al. Molecularpredictors of combination targeted therapies (cetuximab, bevacizumab) inirinotecan-refractory colorectal cancer (BOND-2 study). Anticancer Res2010;30:4209–17.
20. McShane LM, AltmanDG, Sauerbrei W, Taube SE, GionM, Clark GM, et al.Reporting recommendations for tumor marker prognostic studies. J ClinOncol 2005;23:9067–72.
21. Mellor JD, Brown MP, Irving HR, Zalcberg JR, Dobrovic A. A criticalreview of the role of Fc gamma receptor polymorphisms in theresponse to monoclonal antibodies in cancer. J Hematol Oncol2013;6:1.
22. Tamura K, Shimizu C, Hojo T, Akashi-Tanaka S, Kinoshita T, Yone-mori K, et al. FcgammaR2A and 3A polymorphisms predict clinicaloutcome of trastuzumab in both neoadjuvant and metastatic settingsin patients with HER2-positive breast cancer. Ann Oncol 2011;22:1302–7.
23. Kjersem JB, Skovlund E, Ikdahl T, Guren T, Kersten C, Dalsgaard AM, et al.FCGR2A and FCGR3A polymorphisms and clinical outcome in metastaticcolorectal cancer patients treated with first-line 5-fluorouracil/folinicacid and oxaliplatin þ/� cetuximab. BMC Cancer . 2014;14:340.
24. Geva R, Vecchione L, Kalogeras KT, Jensen BV, Lenz HJ, Yoshino T, et al.FCGR polymorphisms and cetuximab efficacy in chemorefractory meta-static colorectal cancer: an international consortium study. Gut 2015;64:921–8.
Clin Cancer Res; 22(10) May 15, 2016 Clinical Cancer Research2444
Liu et al.
on May 31, 2018. © 2016 American Association for Cancer Research. clincancerres.aacrjournals.org Downloaded from
2016;22:2435-2444. Clin Cancer Res Geoffrey Liu, Dongsheng Tu, Marcia Lewis, et al. the NCIC CTG CO.17 Trial of Colorectal Cancer
Receptor Polymorphisms, Cetuximab Therapy, and Survival inγFc-
Updated version
http://clincancerres.aacrjournals.org/content/22/10/2435
Access the most recent version of this article at:
Material
Supplementary
http://clincancerres.aacrjournals.org/content/suppl/2016/05/12/22.10.2435.DC1
Access the most recent supplemental material at:
Cited articles
http://clincancerres.aacrjournals.org/content/22/10/2435.full#ref-list-1
This article cites 24 articles, 7 of which you can access for free at:
Citing articles
http://clincancerres.aacrjournals.org/content/22/10/2435.full#related-urls
This article has been cited by 4 HighWire-hosted articles. Access the articles at:
E-mail alerts related to this article or journal.Sign up to receive free email-alerts
Subscriptions
Reprints and
To order reprints of this article or to subscribe to the journal, contact the AACR Publications Department at
Permissions
Rightslink site. Click on "Request Permissions" which will take you to the Copyright Clearance Center's (CCC)
.http://clincancerres.aacrjournals.org/content/22/10/2435To request permission to re-use all or part of this article, use this link
on May 31, 2018. © 2016 American Association for Cancer Research. clincancerres.aacrjournals.org Downloaded from