fatty acid oxidation-driven src links mitochondrial energy ... · mitochondrial energy...
TRANSCRIPT

Cell Reports, Volume 14
Supplemental Information
Fatty Acid Oxidation-Driven Src Links
Mitochondrial Energy Reprogramming and Oncogenic
Properties in Triple-Negative Breast Cancer
Jun Hyoung Park, Sajna Vithayathil, Santosh Kumar, Pi-Lin Sung, Lacey ElizabethDobrolecki, Vasanta Putluri, Vadiraja B. Bhat, Salil Kumar Bhowmik, VineetGupta, Kavisha Arora, Danli Wu, Efrosini Tsouko, Yiqun Zhang, SumanMaity, Taraka R. Donti, Brett H. Graham, Daniel E. Frigo, Cristian Coarfa, PatriciaYotnda, Nagireddy Putluri, Arun Sreekumar, Michael T. Lewis, Chad J.Creighton, Lee-Jun C. Wong, and Benny Abraham Kaipparettu

Figure S1
C-SUM159 C-A1N4
C D
E
pSrc (Y419) pSrc (Y530)
pSrc (Y530)
BA

Figure S1. Related to Figure 1. (A) Soft agar colony formation of parental mitochondria donor cells usedfor cybrid generation. (B) In vivo growth of tumor cybrids. C-SUM159 or C-A1N4 cybrids weretransplanted into the fourth mammary fat pads (both sides) of SCID/Beige mice. While control cybridswith mitochondria from SUM159 cells generated tumors in both sides, no tumors formed in mice that weretransplanted with cybrids containing mitochondria from benign A1N4 cells. Transplantation sites aremarked with a red arrow. (C-E) RPPA analysis of PDX with (red) and without (green) distant metastatic(DM) potential. Relative expression of pSrc (Y419) (C) and (Y530) (D) of individual PDX lines areshown. There was no significant difference in pSrc (Y530) expression between DM and No DM PDX (E).

Figure S2
C-MDA231
G
MDA231A
Dasatinib
PP2
20 hrs
20 hrs
24 hrs
C-MDA231
C-SUM159
MDA231
Control PP2
SUM159 C-MDA231C-SUM159
B C
D E F

Figure S2. Related to Figure 2. (A) Western blot analysis showing pSrc (Y419) expression. pSrc (Y419)of cybrids with cancer mitochondria is decreased after treatment with Dasatinib. (B-F) Soft agar colonyformation assay. Dasatinib (B and C) or PP2 (D-F) dose-dependently decreased the colony formationpotential of parental cells (B and D) and cybrids (C, E, and F). (G) Wound-healing migration assay.Overnight treatment with Src inhibitor PP2 (10 µM) decreased the metastatic potential (wound healingproperty) of C-SUM159 and C-MDA231 cybrids as well as MDA231 parental cells.

MDA231 SUM159
Src
Lck
Hck
pSrc (Y419)
pSrc (Y530)
pLck (Y394)
pHck (Y411)
β-actin
A
β-actin
β-actin
Figure S3
T= Total cell lysate, M=Mitochondrial fraction, and C=Cytoplasmic fraction
B
C

Figure S3. Related to Figure 2. (A) Western blot analysis of total levels of Src family member proteins(Src, Fyn, Lck, Lyn, Yes, Fgr, and CSK) in the mitochondrial and cytoplasmic fractions of MDA231 andSUM159 cells. α-tubulin, Tim23, and Lamin B are makers for cytosol, mitochondria, and nucleusrespectively. (B) Western blot analysis of cybrids using all the available phospho SFK antibodies [pSrc(Y419), pSrc (Y530), pLck (Y394), pHck(Y411)]. Compared to control C-SUM159, only pSrc (Y419)expression showed major reduction in cybrids with benign mitochondria. (C) Percentage of pSFK/SFKratio from four independent WB experiments. Ratio in C-SUM159 is taken as 100% and error barrepresents SE of four experiments. * Represent p<0.05 compared to C-SUM159.
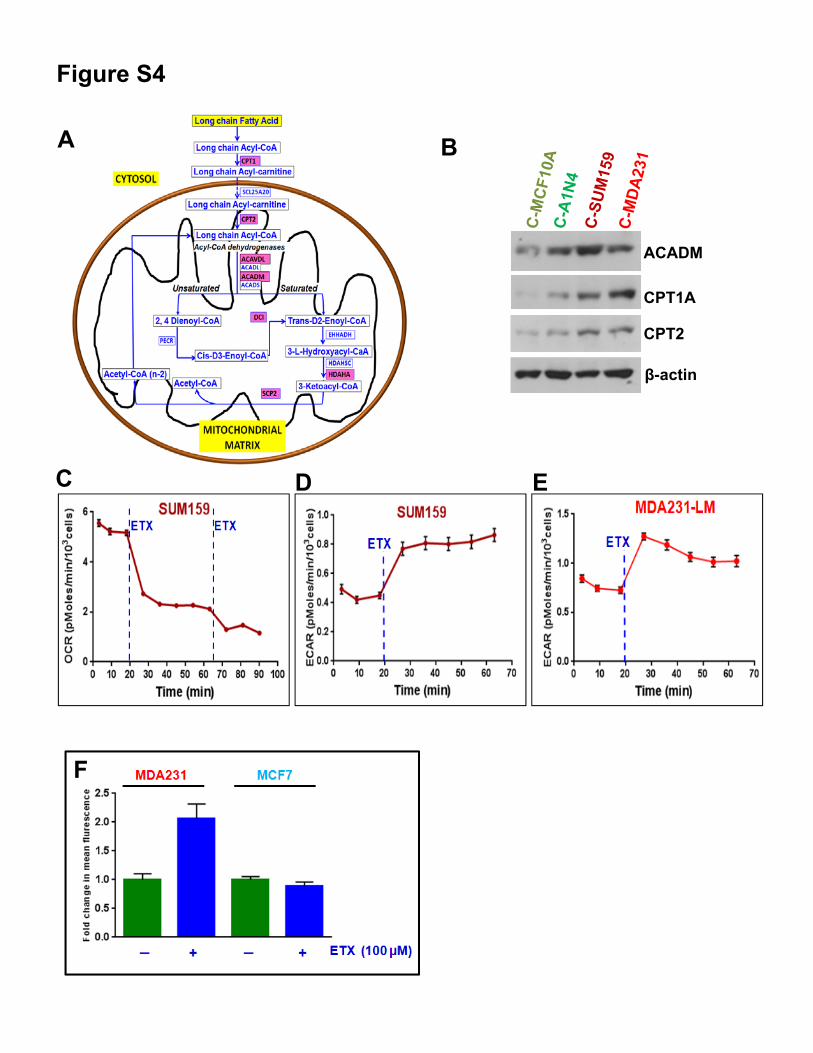
Figure S4
CPT2
ACADM
CPT1A
β-actin
A B
C D E
F

Figure S4. Related to Figure 4. (A) Illustration of proteomic data for mitochondrial fatty acid β-oxidationpathway generated from WebGestalt web site (http://bioinfo.vanderbilt.edu/webgestalt/) inputting alteredβ-oxidation related proteins. Several proteins involved in the β-oxidation pathway are upregulated (labeledin red boxes) in cybrids with mitochondria from TNBC cells compared to cybrids with mitochondria frombenign cells. (B) Western blot of selected proteins identified in the cybrid proteomics data analysis. (C)Basal cellular respiration is inhibited by ETX (100 µM) in Seahorse analysis. (D and E) Inhibition of β-oxidation using ETX (100 µM) enhances glycolysis measured by extracellular acidification rate (ECAR).(F) Inhibition of β-oxidation using ETX induces neutral lipid staining in a TNBC cell line (MDA231) butnot in ER+ MCF7 cells.

Figure S5
C-SUM159 C-MDA231
______
Control
Mitosox
Mitosox + Antimycin-A
A
C-MDA231
B C
++
++
C-MDA231
β-Actin
H2O2 (50 µM)
NAC (10 mM)
pSrc (Y419)
Src

Figure S5. Related to Figure 5. (A) Flow cytometry analysis of cybrids after Antimycin-A treatment.Antimycin-A enhanced mitochondrial ROS measured by mitosox in C-SUM159 and C-MDA231. (B)Flow cytometry analysis of cybrids with DCFDA after H2O2, NAC, and combination treatments. (C) NACtreatment reversed the H2O2-mediated inhibition of pSrc (Y419).

Figure S6
A B
C D
E

Figure S6. Related to Figure 6. (A) Western blot analysis of Src and related protein expressions inMDA231 and SUM159 cells with and without ETX treatment. ETX treatment down-regulated pSrc(Y419) and the phosphorylation of its target gene FAK. However, it did not affect the expression of pSrc(Y530) and other Src regulatory or binding proteins like PTPN13, CSK, SHP1, SHP2, PTP1B, andp62DOK. (B) Western blot analysis in Scrambled, CPT1, and CPT2 shRNA-transfected MDA231 cellsusing the total and phospho SFK antibodies after treatment with or without ETX. (C) Percentage ofpSFK/SFK ratio from three independent WB experiments. Ratio in shScr is taken as 100% and error barrepresents SEM. (D) Percentage of pSrc(Y419)/Src from three independent WB experiments. Vehicletreated cells are taken as 100% and error bars represent SEM. (E) Wound healing assay in scrambled,CPT1, and CPT2 shRNA transfected MDA231 cells after treatment with vehicle or CPT1 inhibitors ETX(100 µM) and PHX (5 µM). Percentage of wound distance at different time points relative to the wounddistance measured at 0 hour.

Figure S7
A B
C
D E
pSrc (Y419) pSrc (Y530)

Figure S7. Related to Figure 7. (A) TCGA data analysis showing lack of significant correlation betweenCPT1A and pSrc (Y419) expression in unselected BCa. (B) TCGA data analysis showing lack ofsignificant correlation between CPT1A and pSrc (Y530) expression in TNBC. (C) In vivo tumor growth ofPDX after ETX treatment after one week of PDX transplantation. ETX-treated days are marked withyellow box. (D) MDA231 cells (1.5 x 10⁵) were injected into the tail vein of NOD SCID Gamma mice.Vehicle or ETX (50 mg/kg) was administered every day. Bioluminescence imaging after three weeksshowed decreased metastasis in ETX-treated mice (lower panel) compared to the vehicle treated mice(upper panel). An expression scale of luminescence has been added to the side of the panel. (E)Quantification of lung metastatic nodules.

Experimental Procedures Cells, Cybrids, and PDX MCF10A, A1N4, T47D, MCF-7, ZR75-1, MDA231, and MDA-MB-468 cells were from the American Type Culture Collection (ATCC), SUM159 from Asterand Bioscience provided by Dr. Dave, HMLE cells provided by Dr. Mani, and lung metastatic MDA231 (MDA231-LM) was kindly provided by Dr. Zhang. Transmitochondrial cybrids (C-MCF10A, C-A1N4, C-SUM159, and C-MDA231) were generated as previously described (Vithayathil et al., 2012). SUM159 ρ0 cells were used as nuclear donor and MCF10A, A1N4, SUM 159, and MDA231 cells were used as mitochondrial donor cells. pGIPZ lentivirus shRNAs for CPT1 and CPT2 were purchased from the C-BASS core at Baylor College of Medicine. Mitochondrial isolation was using the Qproteome Mitochondria Isolation Kit (Qiagen). Soft Agar Colony Formation, Wound Healing, and Transwell Migration Analysis Soft agar colony formation assay was performed as previously published (Kajiwara et al., 2008; Lee et al., 2012) with minor modifications. Cells (5-10 × 103 cells/well) were resuspended in 2 ml of 0.35% agarose solution in respective culture medium and overlayed onto the bottom agar layer (0.5%) in six-well plates. Colonies were counted at different time intervals using the GelCount™ colony counting system (Oxford Optronix, Oxford, UK) according to the manufacturer’s instructions. For wound healing assay, two methods were used: 1. Image analysis of 6-well cell culture plates after generating a scratch in confluent cells (Wang et al., 2014). 2. IncuCyte ZOOM (Essen Bioscience) technique. For the IncuCyte assay, 5 X 10⁴ cells were seeded into ImageLock 96-well plates (Essen Bioscience) and incubated overnight. Wounds were created using the IncuCyte™ Cell Migration Kit (Essen Bioscience), and relative wound density or wound width was analyzed using the IncuCyte ZOOM software (Essen Bioscience) (Kopp et al., 2014; Stewart et al., 2015). Migration assay was performed using 5 X 10⁴ cells in 24-well Transwell inserts (Corning) (Park et al., 2008). Medium containing 10% FBS was used as the chemo-attractant in the lower chamber. Cells which have migrated through the membrane were fixed with 100% methanol, stained with 1% crystal violet, and counted. Western Blotting Antibodies used were rabbit anti-pSrc (Y419), rabbit anti-pSrc (Y530), mouse anti-Src, rabbit anti-β-actin, rabbit anti-complex IV subunit II, rabbit anti-CSK, rabbit anti-pFAK (Y576/577), rabbit anti-FAK, rabbit anti-α-tubulin, rabbit anti-PARP N, rabbit anti-CPT1 antibody (Cell Signaling) and rabbit anti-CPT2 (Santa Cruz Biotechnology). Detection was conducted by horseradish peroxidase-conjugated secondary antibodies using the ECL method (Gendepot). Mitochondrial complex activities were inhibited using treatment with Rotenone [0.01-10 μM for 4 h, (Li et al., 2003)], antimycin-A [0.1-20 μM for 24 h, (Wang et al., 2013)], and oligomycin [0.01-5 μg/ml for 4 h, (Gong and Agani, 2005)]. Glycolysis was inhibited by DCA [0-400 μM for 24 h, (Babu et al., 2011)] and 3-BP [0-100 μM for 24 h, (Wu et al., 2014)]. The glutamine pathway was inhibited by AOA [0.1-10 μM for 24 h, (Oja and Kontro, 1988)]. FAO was inhibited by ETX [50-300 μM for 24 h, (Estan et al., 2014; Pike et al., 2011; Roy et al., 2014; Samudio et al., 2010; Schlaepfer et al., 2015) or Perhexiline [0.1-10 μM for 24 h, (Agren et al., 2014)]. FAO was induced by fatty acid-BSA [10 μM for 24 h, (Oswal et al., 2014)] or L-carnitine [10 mM for 24 h, (Seiler et al., 2014)]. ROS was scavenged by NAC [1-20 mM for 4 h, (Gong and Agani, 2005)]. Src activity was inhibited by PP2 [5-10 μM for 24 h, (Fan et al., 2013)] and dasatinib [10-50 nM for 24 h (Pichot et al., 2009)]. Cytotoxicity and cell viability Cell viability was monitored after different drug treatment using the standard 3-(4, 5-Dimethyl-2-thiazolyl)-2, 5-diphenyl-2H-tetrazolium bromide (MTT) assay and validated using the sulforhodamine B (SRB) based colorimetric assay (Vichai and Kirtikara, 2006) (to rule out artifacts from mitochondrial alterations in MTT activity). Experiments under hypoxia are performed as described before (Wu and Yotnda, 2011). In vitro ATP Autophosphorylation Assay In vitro autophosphorylation assay of recombinant human Src (R&D Systems ; 4595-KS) was conducted by the methods previously described (Osusky et al., 1995) with minor modifications. Recombinant human Src was incubated in kinase buffer (25 mM MOPS, pH7.2, 12.5 β-glycerolphosphate, 20 mM MgCl2, 12.5 mM MnCl2, 5 mM EGTA, 2 mM EDTA, and 0.25 mM DTT) with various concentration of ATP for 15 min at 30oC. Kinase activity was stopped by adding SDS sample buffer and was assessed by SDS-PAGE and western blotting. Intensity of each band was quantified using ImageQuant software (GE Healthcare Life Sciences).

Reactive Oxygen Species (ROS) Assay ROS was measured using CM-H2DCFDA (Life Technologies; C6827) and MitoSox (Invitrogen; M36008) and analyzed using flow cytometry. CO2 Trap Assay CO2 trap assay was performed according to the protocol recently published using 14C radiolabeled oleate complexed with BSA (Tennakoon et al., 2014; Tsouko et al., 2014). Cell Respiratory Assay OCR and ECAR were measured using the XF24 extracellular flux analyzer (Seahorse Biosciences) as previously described (Donti et al., 2014). XF Palmitate-BSA FAO Substrate (Seahorse Biosciences) was used for the FAO assay. In vivo Experiments All animal studies were conducted in accordance with the standard procedures approved by the Baylor College of Medicine Institutional Animal Care and Use Committee. For mammary transplantation assay, 2 x 10⁵ cells or cybrids with Firefly luciferase were transplanted into the fourth mammary fat pads of 4-5 week old SCID/Beige female mice (Harlan Laboratories). For PDX models, small tumor pieces from PDX (BCM-2147 and BCM-4013) were transplanted (Zhang et al., 2013). In the ETX treatment study, the mice were treated with vehicle or ETX (50 mg/kg body weight, IP) every two days. Tumors were monitored by manual observation and luciferase bioluminescence imaging (IVIS Lumina XR) (Minn et al., 2005). For metastatic study by the tail vein injection, 1.5 x 10⁵ MDA231 cells pretreated for 48 hours with vehicle or ETX were injected into the tail veins of 4-5 week old NOD SCID Gamma mice. ETX treatment continued in mice for one more week (50 mg/kg body weight, IP). Metastasis was analyzed as described above. Shotgun Proteomics Analysis After protein extraction, 200 μg of each protein sample was reduced, alkylated, and double-trypsin digested. Dried peptides were reconstituted in 0.1% formic acid and 25 µg of tryptic peptides was injected onto a 2.1 × 250 mm Agilent AdvanceBio Peptide Mapping column using UHPLC at 0.2 mL/min flow rate. All the samples were analyzed in triplicate on an Agilent 1290 UHPLC/AJS-dual ion Funnel 6550 Q-TOF mass spectrometer using a 100 min gradient. The LC-MS/MS data was searched against the SwissProt Human database using the Spectrum Mill bioinformatics tool. Lipid Staining Assay Cells were treated with vehicle or ETX overnight and stained using LipidTOX™ Red (Life Technologies). Lipid storage was analyzed by flow cytometry. CPT1 Activity Assay CPT1 activity in total cell lysates and isolated mitochondria was analyzed using previously published protocols (Bieber et al., 1972; Setoyama et al., 2013). Microarray and Src Gene Signature Analysis The mRNA expression profile was assessed using the U133plus 2.0 at UCLA's Clinical Microarray Core, University of California, Los Angeles, CA. Microarray datasets were processed and analyzed as previously described (Kaipparettu et al., 2013). A transcriptional signature of Src activation, previously defined elsewhere (Creighton, 2008), was examined in its entirety in our expression profiling datasets. The definition of basal-like samples within the breast tumor expression profile dataset from Kessler et al (Kessler et al., 2012) was as previously described (Creighton, 2012), with survival data capped at 15 years. TCGA BC RPPA data were analyzed for Src, pSrc (Y419), and pSrc (Y530) and correlated with gene expression data for CPT1A by Pearson’s correlation. mtDNA sequencing mtDNAs from original cell lines used for the generation of cybrids were sequenced to identify mtDNA sequence variants (Cui et al., 2013).
Statistical Analysis Unless stated otherwise, data are mean ± SEM of at least three independent experiments, and the two-tailed unpaired Student’s t test was used to assess statistical significance with p < 0.05 being regarded as significant. Animal experiments used groups of six mice.
References Agren, R., Mardinoglu, A., Asplund, A., Kampf, C., Uhlen, M., and Nielsen, J. (2014). Identification of anticancer drugs for hepatocellular carcinoma through personalized genome-scale metabolic modeling. Molecular systems biology 10, 721. Babu, E., Ramachandran, S., CoothanKandaswamy, V., Elangovan, S., Prasad, P. D., Ganapathy, V., and Thangaraju, M. (2011). Role of SLC5A8, a plasma membrane transporter and a tumor suppressor, in the antitumor activity of dichloroacetate. Oncogene 30, 4026-4037. Bieber, L. L., Abraham, T., and Helmrath, T. (1972). A rapid spectrophotometric assay for carnitine palmitoyltransferase. Analytical biochemistry 50, 509-518. Creighton, C. J. (2008). Multiple oncogenic pathway signatures show coordinate expression patterns in human prostate tumors. PLoS One 3, e1816. Creighton, C. J. (2012). The molecular profile of luminal B breast cancer. Biologics : targets & therapy 6, 289-297. Cui, H., Li, F., Chen, D., Wang, G., Truong, C. K., Enns, G. M., Graham, B., Milone, M., Landsverk, M. L., Wang, J., et al. (2013). Comprehensive next-generation sequence analyses of the entire mitochondrial genome reveal new insights into the molecular diagnosis of mitochondrial DNA disorders. Genetics in medicine : official journal of the American College of Medical Genetics 15, 388-394. Donti, T. R., Stromberger, C., Ge, M., Eldin, K. W., Craigen, W. J., and Graham, B. H. (2014). Screen for abnormal mitochondrial phenotypes in mouse embryonic stem cells identifies a model for succinyl-CoA ligase deficiency and mtDNA depletion. Disease models & mechanisms 7, 271-280. Estan, M. C., Calvino, E., Calvo, S., Guillen-Guio, B., Boyano-Adanez Mdel, C., de Blas, E., Rial, E., and Aller, P. (2014). Apoptotic efficacy of etomoxir in human acute myeloid leukemia cells. Cooperation with arsenic trioxide and glycolytic inhibitors, and regulation by oxidative stress and protein kinase activities. PLoS One 9, e115250. Fan, P., Griffith, O. L., Agboke, F. A., Anur, P., Zou, X., McDaniel, R. E., Creswell, K., Kim, S. H., Katzenellenbogen, J. A., Gray, J. W., and Jordan, V. C. (2013). c-Src modulates estrogen-induced stress and apoptosis in estrogen-deprived breast cancer cells. Cancer research 73, 4510-4520. Gong, Y., and Agani, F. H. (2005). Oligomycin inhibits HIF-1alpha expression in hypoxic tumor cells. American journal of physiology Cell physiology 288, C1023-1029. Kaipparettu, B. A., Ma, Y., Park, J. H., Lee, T. L., Zhang, Y., Yotnda, P., Creighton, C. J., Chan, W. Y., and Wong, L. J. (2013). Crosstalk from non-cancerous mitochondria can inhibit tumor properties of metastatic cells by suppressing oncogenic pathways. PLoS One 8, e61747. Kajiwara, Y., Panchabhai, S., and Levin, V. A. (2008). A new preclinical 3-dimensional agarose colony formation assay. Technology in cancer research & treatment 7, 329-334. Kessler, J. D., Kahle, K. T., Sun, T., Meerbrey, K. L., Schlabach, M. R., Schmitt, E. M., Skinner, S. O., Xu, Q., Li, M. Z., Hartman, Z. C., et al. (2012). A SUMOylation-dependent transcriptional subprogram is required for Myc-driven tumorigenesis. Science 335, 348-353. Kopp, F., Hermawan, A., Oak, P. S., Herrmann, A., Wagner, E., and Roidl, A. (2014). Salinomycin treatment reduces metastatic tumor burden by hampering cancer cell migration. Molecular cancer 13, 16. Lee, J., Bartholomeusz, C., Krishnamurthy, S., Liu, P., Saso, H., Lafortune, T. A., Hortobagyi, G. N., and Ueno, N. T. (2012). PEA-15 unphosphorylated at both serine 104 and serine 116 inhibits ovarian cancer cell tumorigenicity and progression through blocking beta-catenin. Oncogenesis 1, e22. Li, N., Ragheb, K., Lawler, G., Sturgis, J., Rajwa, B., Melendez, J. A., and Robinson, J. P. (2003). Mitochondrial complex I inhibitor rotenone induces apoptosis through enhancing mitochondrial reactive oxygen species production. The Journal of biological chemistry 278, 8516-8525. Minn, A. J., Gupta, G. P., Siegel, P. M., Bos, P. D., Shu, W., Giri, D. D., Viale, A., Olshen, A. B., Gerald, W. L., and Massague, J. (2005). Genes that mediate breast cancer metastasis to lung. Nature 436, 518-524. Oja, S. S., and Kontro, P. (1988). Effect of aminooxyacetic acid on the release of preloaded [3H]GABA and radioactive metabolites from slices of developing mouse brain. Neurochemical research 13, 923-928. Osusky, M., Taylor, S. J., and Shalloway, D. (1995). Autophosphorylation of purified c-Src at its primary negative regulation site. The Journal of biological chemistry 270, 25729-25732.

Oswal, D. P., Alter, G. M., Rider, S. D., Jr., and Hostetler, H. A. (2014). A single amino acid change humanizes long-chain fatty acid binding and activation of mouse peroxisome proliferator-activated receptor alpha. Journal of molecular graphics & modelling 51, 27-36. Park, J. H., Park, S. M., Park, S. H., Cho, K. H., and Lee, S. T. (2008). Cleavage and functional loss of human apolipoprotein E by digestion of matrix metalloproteinase-14. Proteomics 8, 2926-2935. Pichot, C. S., Hartig, S. M., Xia, L., Arvanitis, C., Monisvais, D., Lee, F. Y., Frost, J. A., and Corey, S. J. (2009). Dasatinib synergizes with doxorubicin to block growth, migration, and invasion of breast cancer cells. British journal of cancer 101, 38-47. Pike, L. S., Smift, A. L., Croteau, N. J., Ferrick, D. A., and Wu, M. (2011). Inhibition of fatty acid oxidation by etomoxir impairs NADPH production and increases reactive oxygen species resulting in ATP depletion and cell death in human glioblastoma cells. Biochimica et biophysica acta 1807, 726-734. Roy, D., Mondal, S., Wang, C., He, X., Khurana, A., Giri, S., Hoffmann, R., Jung, D. B., Kim, S. H., Chini, E. N., et al. (2014). Loss of HSulf-1 promotes altered lipid metabolism in ovarian cancer. Cancer & metabolism 2, 13. Samudio, I., Harmancey, R., Fiegl, M., Kantarjian, H., Konopleva, M., Korchin, B., Kaluarachchi, K., Bornmann, W., Duvvuri, S., Taegtmeyer, H., and Andreeff, M. (2010). Pharmacologic inhibition of fatty acid oxidation sensitizes human leukemia cells to apoptosis induction. The Journal of clinical investigation 120, 142-156. Schlaepfer, I. R., Glode, L. M., Hitz, C. A., Pac, C. T., Boyle, K. E., Maroni, P., Deep, G., Agarwal, R., Lucia, S. M., Cramer, S. D., et al. (2015). Inhibition of Lipid Oxidation Increases Glucose Metabolism and Enhances 2-Deoxy-2-[(18)F]Fluoro-D-Glucose Uptake in Prostate Cancer Mouse Xenografts. Molecular imaging and biology : MIB : the official publication of the Academy of Molecular Imaging 17, 529-538. Seiler, S. E., Martin, O. J., Noland, R. C., Slentz, D. H., DeBalsi, K. L., Ilkayeva, O. R., An, J., Newgard, C. B., Koves, T. R., and Muoio, D. M. (2014). Obesity and lipid stress inhibit carnitine acetyltransferase activity. Journal of lipid research 55, 635-644. Setoyama, D., Fujimura, Y., and Miura, D. (2013). Metabolomics reveals that carnitine palmitoyltransferase-1 is a novel target for oxidative inactivation in human cells. Genes to cells : devoted to molecular & cellular mechanisms 18, 1107-1119. Stewart, H., Bartlett, C., Ross-Thriepland, D., Shaw, J., Griffin, S., and Harris, M. (2015). A novel method for the measurement of hepatitis C virus infectious titres using the IncuCyte ZOOM and its application to antiviral screening. Journal of virological methods 218, 59-65. Tennakoon, J. B., Shi, Y., Han, J. J., Tsouko, E., White, M. A., Burns, A. R., Zhang, A., Xia, X., Ilkayeva, O. R., Xin, L., et al. (2014). Androgens regulate prostate cancer cell growth via an AMPK-PGC-1alpha-mediated metabolic switch. Oncogene 33, 5251-5261. Tsouko, E., Khan, A. S., White, M. A., Han, J. J., Shi, Y., Merchant, F. A., Sharpe, M. A., Xin, L., and Frigo, D. E. (2014). Regulation of the pentose phosphate pathway by an androgen receptor-mTOR-mediated mechanism and its role in prostate cancer cell growth. Oncogenesis 3, e103. Vichai, V., and Kirtikara, K. (2006). Sulforhodamine B colorimetric assay for cytotoxicity screening. Nature protocols 1, 1112-1116. Vithayathil, S. A., Ma, Y., and Kaipparettu, B. A. (2012). Transmitochondrial cybrids: tools for functional studies of mutant mitochondria. Methods Mol Biol 837, 219-230. Wang, L. T., Chen, B. L., Wu, C. T., Huang, K. H., Chiang, C. K., and Hwa Liu, S. (2013). Protective role of AMP-activated protein kinase-evoked autophagy on an in vitro model of ischemia/reperfusion-induced renal tubular cell injury. PLoS One 8, e79814. Wang, Y., Bu, F., Royer, C., Serres, S., Larkin, J. R., Soto, M. S., Sibson, N. R., Salter, V., Fritzsche, F., Turnquist, C., et al. (2014). ASPP2 controls epithelial plasticity and inhibits metastasis through beta-catenin-dependent regulation of ZEB1. Nature cell biology 16, 1092-1104. Wu, D., and Yotnda, P. (2011). Induction and testing of hypoxia in cell culture. Journal of visualized experiments : JoVE. Wu, L., Xu, J., Yuan, W., Wu, B., Wang, H., Liu, G., Wang, X., Du, J., and Cai, S. (2014). The reversal effects of 3-bromopyruvate on multidrug resistance in vitro and in vivo derived from human breast MCF-7/ADR cells. PLoS One 9, e112132. Zhang, X., Claerhout, S., Prat, A., Dobrolecki, L. E., Petrovic, I., Lai, Q., Landis, M. D., Wiechmann, L., Schiff, R., Giuliano, M., et al. (2013). A renewable tissue resource of phenotypically stable, biologically and ethnically diverse, patient-derived human breast cancer xenograft models. Cancer research 73, 4885-4897.

SUM159 MCF10A A1N4 MDA231
152T>C 73A>G 73A>G 73A>G
263A>G 185G>A 152T>C 153A>G
311insC 228G>A 217T>C 195T>C
739C>T 263A>G 263A>G 225G>T
750A>G 295C>T 310dupC 226T>C
1438A>G 300_301het_insCC 508A>G 263A>G
4769A>G 310T>C 637C>CT 311insC
8592G>A 462C>T 750A>G 750A>G
8860A>G 489T>C 1154A>T 1438A>G
15326A>G 750A>G 1438A>G 1719G>A
15340A>G 1438A>G 1811A>G 2706A>G
16519T>C 2706A>G 2706A>G 4769A>G
3010G>A 3107delX 6221T>C
4216T>C 3720A>G 6371C>T
4769A>G 3865A>G 7028C>T
6249G>A 4769A>G 8860A>G
7028C>T 5390A>G 11719G>A
8860A>G 5426T>C 12705C>T
10084T>C 6045C>T 13966A>G
11251A>G 6152T>C 14470T>A
11719G>A 7028C>T 14766C>T
12612A>G 8860A>G 15326A>G
13708G>A 10876A>G 16021C>T
16069C>T 11016G>A 16126T>C
16126T>C 11467A>G 16189T>C
16319G>A 11719G>A 16223C>T
12308A>G 16278C>T
12372G>A 16519T>C
13020T>C
13734T>C
14766C>T
15326A>G
15454T>C
15731G>A
15732C>T
15907A>G
16051A>G
16129G>C
16179C>T
16182A>C
16183A>C
16189T>C
16362T>C
16519T>C
Table S1: mtDNA sequence variations of parental cells used for cybrid generation (compared with the Revised Cambridge Reference Sequence, rCRS NC_012920), Related to Figure 1.