biochimica et biophysica acta - startseite bba 14.pdf · mitochondrial membrane also contains a...
TRANSCRIPT
Biochimica et Biophysica Acta 1838 (2014) 2036–2045
Contents lists available at ScienceDirect
Biochimica et Biophysica Acta
j ourna l homepage: www.e lsev ie r .com/ locate /bbamem
Effect of cytochrome c on the phase behavior of chargedmulticomponentlipid membranes
Salome Pataraia a, Yonggang Liu a,b, Reinhard Lipowsky a, Rumiana Dimova a,⁎a Department of Theory and Bio-Systems, Max Planck Institute of Colloids and Interfaces, Science Park Golm, 14424 Potsdam, Germanyb State Key Laboratory of Polymer Physics and Chemistry, Changchun Institute of Applied Chemistry, Chinese Academy of Sciences, 130022 Changchun, China
⁎ Corresponding author. Tel.: +49 331 5679615; fax: +E-mail address: [email protected] (R. D
http://dx.doi.org/10.1016/j.bbamem.2014.04.0190005-2736/© 2014 Elsevier B.V. All rights reserved.
a b s t r a c t
a r t i c l e i n f oArticle history:Received 9 December 2013Received in revised form 14 April 2014Accepted 18 April 2014Available online 26 April 2014
Keywords:Giant vesiclesPhase diagram (Gibbs triangle)Egg sphingomyelinDOPGCholesterolConfocal microscopy
We studied the effect of submicromolar concentrations of cytochrome c (cyt c) on the phase behavior of ternarylipid membranes composed of charged dioleoylphosphatidylglycerol, egg sphingomyelin and cholesterol. Theprotein was found to induce micron-sized domains in membranes belonging to the single-fluid-phase regionof the protein-free ternary mixture and, as a result, to expand the region of coexistence of liquid ordered (Lo)and liquid disordered (Ld) phases. Direct observations on individual vesicles revealed that protein adsorptionincreases the area of Ld domains. Measurements using a fluorescent analog of cyt c showed that the proteinpreferentially adsorbs onto domains belonging to the Ld phase. The adsorption was quantitatively characterizedin terms of partitioning ratios between the Ld and the Lo phases. The protein was also found to induce vesicleleakage even at relatively low concentrations. In eukaryotic cells under normal physiological conditions, cyt cis localized within the intermembrane space of mitochondria. During cell apoptotis, cyt c is released into the cy-tosol and its adsorption to intracellular membranes may strongly perturb the lipid distribution within thesemembranes as suggested by our results.
© 2014 Elsevier B.V. All rights reserved.
1. Introduction
Interactions of water-soluble proteins with membranes play an im-portant role in many biological processes, such as signal transductionand transport processes [1]. A good example for such a water-solubleprotein is the peripheral membrane protein cytochrome c (cyt c),which is a globular heme protein with a diameter of about 3.4 nm,carrying approximately 4 effective positive charges. With its well char-acterized structure and many important biological functions, cyt c is asuitablemodel macromolecule for studying the association and interac-tion of peripheral proteins with lipid membranes.
In general, upon adsorption to a membrane composed of negativelycharged and neutral lipids, a peripheral positively charged protein mayinduce local changes in lipid composition. A number of theoreticalstudies have considered this problem, see e.g. [2,3], but experimentalevidence for adsorption-induced lipid demixing is rather limited.Mainly single- and two-component lipid membranes in the presenceof cyt c have been studied [4–11]. The role of protein adsorptionon the stability of liquid ordered and liquid disordered phases inmembranes has not been addressed in detail.
Lipid rafts have been proposed as functionally important com-ponents of cell membranes. A number of studies indicate their in-volvement in processes such as protein and lipid sorting and signal
49 331 5679612.imova).
transduction, cholesterol transport, membrane trafficking, cytoskeletonadhesion, fusion and fission, endocytosis and apoptosis; see e.g. refer-ences [12–18]. A newdevelopment inmolecularmedicine called “mem-brane-lipid therapy” relies on the interaction of proteins with lipiddomains to modulate the cell activity, thus providing a possible treat-ment of human diseases [19,20]. Because of the resolution limitationsof optical microscopy, it is difficult to detect nanometer-sized mem-brane domains enriched in saturated lipids, cholesterol and specific pro-teins, and the existence of such domains in living cells still a matter ofdebate [21]. On the other hand,model systems such as giant unilamellarvesicles (GUVs) [22,23] containing cholesterol and sphingolipids canserve as a powerful tool to visualize raft-like liquid ordered domainsfor characterizing biologically relevant phenomena; see e.g. references[24–28]. In membranes composed of mixtures of saturated and unsatu-rated lipids with cholesterol at room temperature, one can observephase separation and domain formation on themicron scale. Dependingon the membrane composition and with the help of fluorescentlylabeled lipids, one can then visualize domains in GUVs by confocal mi-croscopy [29]. Recently, it has been demonstrated that phase separationand domain formation can be visualized not only in membranescontaining mixtures of zwitterionic lipids but also for ternary mixtureswith anionic lipids [30–32], which in turn opens new possibilitiesfor investigating systems relevant to biological membranes. In par-ticular, the inner leaflet of the plasma membrane as well as themembranes of many cellular organelles which have been proposedto exhibit raft-like domains contain charged lipids [33–35]. The
2037S. Pataraia et al. / Biochimica et Biophysica Acta 1838 (2014) 2036–2045
mitochondrial membrane also contains a number of charged lipids,such as phosphatidylinositols, fatty acids and cardiolipin, whose totalfraction is of the order of a few tens weight percent [36].
In this work, we used cyt c as amodel protein to address the effect ofadsorption of a positively charged protein to negatively charged mem-branes with several fluid domains. The latter membranes containedboth zwitterionic and anionic lipids. The interaction of cyt c with theselipids involves a number of different factors. Several studies indicatethat the peripheral or integral binding of cyt c to charged lipid mem-branes depends on the lipid-to-protein (L/P) molar ratio. It has beenshown that for low L/P ratios below approximately 8, horse heart cyt cbinds electrostatically to pure dioleoylphosphatidylglycerol (DOPG)vesicles, whereas at higher L/P ratios above approximately 18, partialpenetration of cyt c into the lipid bilayer takes place [4]. Furthermore,the absorption of cyt c to negatively charged lipid membranes is highlydependent on the ionic strength of the solutions. On the one hand, atlow ionic strength and high (horse heart) cyt c concentrations, the pro-tein might even insert into DOPG lipid bilayers [5,6]. On the other hand,binding of cyt c to membranes containing a fraction of the charged lipidcardiolipin, was shown toweaken in solutions of low ionic strength. Col-lapse of cardiolipin-rich domains was also observed [7]. Binding of cyt c tosingle-component membranes composed of anionic lipids also leads tochanges in the phase behavior of the lipids: Upon binding, cyt c lowersthe phase transition temperature and broadens the transition of chargedphosphatidylglycerol lipids [8]. Lateral lipid redistribution of two-component membranes made of anionic and neutral lipids has also beenobserved; see e.g. [9–11] and references therein. Large micrometer-sizeddomains in phosphatidylcholine vesicles containing a small fraction ofphosphatidic acid were detected [9]. However, the effect of cyt c on thephase state ofmembraneswithmore complex lipid composition exhibitingphase separation has not been explored so far.
In this study, the interaction of yeast cyt c with three-componentlipid membranes was investigated by measuring the changes inthe phase behavior of these membranes. The preferential partitioningof cyt c between different membrane domains was quantitatively char-acterized as well as the change in the domain area fractions uponadsorption of the protein. GUVs composed of the mixture DOPG, eggsphingomyelin (eSM) and cholesterol (Chol) were used as a model sys-tem, where DOPG is a negatively charged unsaturated lipid, mimickingthe lipid environment of cyt c in the cell. Indeed, phosphatidylglycerol(PG) was chosen as a mimic for the charged lipids in the mitochondrialmembrane because of its relatively low pKa (around 3). The low pKa
implies that PGs remain charged in unbuffered or weakly bufferedsolutions even when local effects caused by salt or changes in the lipidenvironment are taken into account [37,38]. Furthermore, PGs areused as a precursor for cardiolipin synthesis in the inner membrane ofmitochondria [39] and can substitute for cardiolipin in a number ofmitochondrial functions [40]. Cholesterol and saturated lipids are alsopresent in mitochondrial membranes, with a larger fraction in theouter mitochondrial membrane [36].
We characterized the phase diagram of the ternary mixture DOPG/eSM/Chol in the absence and presence of cyt c using confocal microsco-py to image the GUVs. Changes in the domain areas and vesicle leakageupon cyt c adsorption to phase separated membranes were investigat-ed. The partitioning of cyt c between liquid-disordered and liquid-ordered domains was quantitatively determined and the role of theoverall membrane composition explored.
2. Materials and methods
2.1. Materials
The lipids DOPG (1,2-dioleoyl-sn-glycero-3-phospho-[1′-rac-glycerol], sodium salt), eSM and cholesterol were purchased fromAvanti Polar Lipids (Alabaster, AL). The fluorescent labels 1,1′-dioctadecyl-3,3,3′,3′-tetramethylindocarbocyanine perchlorate (DiIC18)
and 1,2-distearoyl-sn-glycero-3-phosphoethanolamine-N-[poly(ethyl-ene glycol) 2000-N′-carboxyfluorescein] (DSPE-PEG2000-CF) wereobtained from Molecular Probes (Eugene, OR) and Avanti Polar Lipids,respectively. Yeast cyt c (Saccharomyces cerevisiae), HEPES (4-(2-hydroxyethyl)-1-piperazineethanesulfonic acid) and EDTA (ethylenedi-aminetetraacetic acid disodium salt dehydrate) were purchased fromSigma Aldrich (Steinheim, Germany). Alexa Fluor 633 carboxylic acidsuccinimidyl ester for fluorescent labeling of cyt c was purchased fromInvitrogen (Darmstadt, Germany). Labeling was performed accordingto the protocol of the manufacturer. The final concentration of the fluo-rescently labeled protein was checked with UV/VIS spectroscopy.
2.2. Vesicle formation
GUVs composed of DOPG/eSM/Chol mixtures were prepared by themethod of electroformation [41] with some modifications [30]. Briefly,10 μl of 2 mg/ml of the lipid mixture in chloroform was spread on con-ductive glasses coated with indium tin oxide (ITO). The lipid mixturescontained 0.4 mol.% of the fluorescent dyes DiIC18 and/or DSPE-PEG2000-CF. In order to remove the organic solvent, the ITO glasseswere dried at 60 °C under high vacuum for 2 h. A chamber was formedby inserting a rectangular Teflon spacer between two opposing ITOcoated glasses with the conductive sides facing each other. About 2 mlof preheated 100 mM sucrose solution in a 2 mM HEPES/1 mM EDTAbuffer at pH 7.5 was injected into the chamber. In the following, wewill refer to the 2 mM HEPES/1 mM EDTA buffer at pH 7.5 simply asto the buffer. The chamber was then placed in an oven at 60 °C. An ACfield with amplitude of 1.0 V (peak-to-peak) and frequency of 10 Hzwas applied for 2 h. Afterwards, the chamber was removed fromthe oven and left at room temperature (~23 °C) for equilibration. Thevesicle suspension was then diluted with a solution of 110 mM glucosein buffer at room temperature.
2.3. Confocal laser scanning microscopy
The GUV solution was placed in a sealed chamber, and the top-viewvesicle observation was done by Leica TCS SP5 confocal microscope(Heidelberg GmbH, Germany) with a 63× water immersion objective.The dyes DiIC18 and DSPE-PEG2000-CF were excited with a diode-pumped solid-state laser at 561 nm and an argon laser at 488 nm, re-spectively. The emission signals were collected separately in the ranges571–671 nm and 500–600 nm, respectively. To reduce artifacts due tolight-induced domain formation [42,43] illuminationwith low intensityof the laser source was used.
Fluorescently labeled yeast cyt c stock solution at a concentration of7.4 μMwas prepared in buffer. The glass slides of the observation cham-ber were pretreated with unlabeled cyt c solution at a concentration of4 mM to avoid vesicle adhesion and bursting. After coating, the glassslides were rinsed with distilled water and dried. This step also ensuredthat there is noprotein loss due to adhesion of the positively charged cytc to the negatively charged glasswalls of the chamber. After introducingthe GUV suspension, the protein solution was added drop-wise up to afinal protein concentration of 0.56 μM. Samples were left for at least30 min to ensure that the adsorption of protein to the vesicles hasreached equilibrium; see Fig. S1 in the Supporting Information. Yeastcyt c was excited with a laser source of 633 nm and fluorescenceemission was collected between 642 nm and 720 nm. Bleaching of theprotein dye within the typical observation times was not detected; seeFig. S2 in the Supporting Information.
2.4. UV/VIS spectroscopy
A Helios Gamma UV/VIS spectrophotometer (Fisher ScientificGmBH, Germany) was used to measure the absorbance spectra of theunlabeled yeast cyt c in quartz cuvettes with a path length of 1 cm.The absorption was measured at concentrations between 1 and 5 μM

2038 S. Pataraia et al. / Biochimica et Biophysica Acta 1838 (2014) 2036–2045
in buffer for the wavelength range of 300–600 nm. The spectra wereused to determine the extinction coefficient of cyt c at 410 nm.
2.5. Flow chamber measurements
A flow chamber made in house was used for single vesicle observa-tion to resolve changes in the domain area fraction before and after theaddition of cyt c. The flow chamber consisted of a nylon frame withholes on both sides connected to Tygon tubing for fluid exchange. Thenylon frame was sealed from above and below with glass slides usingsilicone grease. The chamber was carefully filled with buffer avoidingbubble formation. Then the vesicle solution was introduced. The cham-ber was left to rest for approximately 40min to allow for the vesicles tosettle at the chamber bottom. Afterwards, the cyt c solutionwas injectedinto the system with a programmable VIT-FIT syringe pump (LAMBDACZ s.r.o., Czech Republic) at sufficiently low speed that did not disturbthe system by fluid flow and allowed to monitor a selected vesicle.The amount of the introduced cyt c solution exceeded the chambervolume 4 times. Then the system was left to equilibrate for a minimumof 30 min. During the injection and resting time, the vesicles wereobserved with phase contrast using laser illumination at 633 nm toavoid artifacts associated with oxidation of the fluorescent dye. The3D images were recorded with bidirectional scanning using the DPSSlaser at 561 nm.
3. Results and discussion
3.1. Phase diagram of the ternary mixture DOPG/eSM/Chol
WecharacterizedGUVs composed of DOPG,which represents anun-saturated lipid with a low melting temperature carrying a net negative
Fig. 1. Phase diagramof theDOPG/eSM/Chol ternarymixture obtained from confocal laser scannsucrose (inside)/110mM glucose solution (outside) in 2 mMHEPES/1 mM EDTA buffer at pH 7into the Ld phase. The images, representing 3D projections, were used to identify different phasshown. One should note that the domain patterns for Lo–Ld coexistence as shown for the composabout twohours and always leads to afinal patternwith only two large domains as in Fig. 3A. Foin buffer-free sugar solutions as obtained in Ref. [30]. The different symbols correspond to the nocoexistence. Scale bars represent 10 μm.
charge, eSM, a high melting temperature lipid, and cholesterol. Thetransition temperature of DOPG is −18 °C. Thus, at room temperature,this lipid is in thefluid phase. At room temperature, eSM is still in the gelphase and enters the fluid phase only at 39 °C. Thus, at room tempera-ture membranes composed of the DOPG/eSM/Chol mixture can exhibitimmiscibility depending on the specific membrane composition. Thiswas already demonstrated in a previous study, where vesicles made ofthis mixture and in glucose/sucrose solutions were shown to exhibitphase separation and domain formation depending on the particularmembrane composition [30]; see inset in Fig. 1 for data on the phasestate of DOPG/eSM/Chol vesicles in buffer-free solution. To provideprotein-friendly conditions with pH control, here we investigated thephase behavior of this ternary mixture in a 2 mM HEPES/1 mM EDTAbuffer at pH 7.5, which is typically used for studies involving cyt c. It isknown that the phase state of membranes is sensitive to small changesin the environment, e.g., in pH, temperature or ions [44]. As we willshow below, indeed the presence of the buffer results in a number ofchanges in the phase diagram of the DOPG/eSM/Chol mixture, com-pared to the phase diagram of the samemixture in buffer-free solution.
Confocal microscopywas used to explore in detail more than 70 dif-ferent membrane compositions in the Gibbs triangle of the DOPG/eSM/Chol mixture in buffer at room temperature (~23 °C) after an equilibra-tion time of approximately 2 h. Our first aim was to locate the coexis-tence region of liquid ordered (Lo) and liquid disordered (Ld) phases,which is biologically relevant [45]. The fluorescently labeled lipidDiIC18 used in our studies is known to preferentially partition into theLd phase and to be excluded from Lo and solid ordered (S) domains[46]. The marker DSPE-PEG2000-CF preferentially partitions into theLo phase. Our measurements suggested that it is sufficient to use onlythe dye DiIC18 in order to characterize the phase diagram of DOPG/eSM/Chol from confocal images of GUVs. The following domain features
ingmicroscopyobservations onGUVs at (23±1)°C. TheGUV solutions usedwere 100mM.5. The vesicles were labeled with DiIC18 (green false color) which partitions preferentiallye regions in the Gibbs triangle; see text for details. For clarity, only single vesicle halves areition 30/50/20 represent transient patterns after about 20 minutes. Full equilibration takesr comparison, the inset in the upper right part shows the phase diagram of DOPG/eSM/Choltation in themain legend. The hatched area in the inset indicates the region of Lo–Ld phase
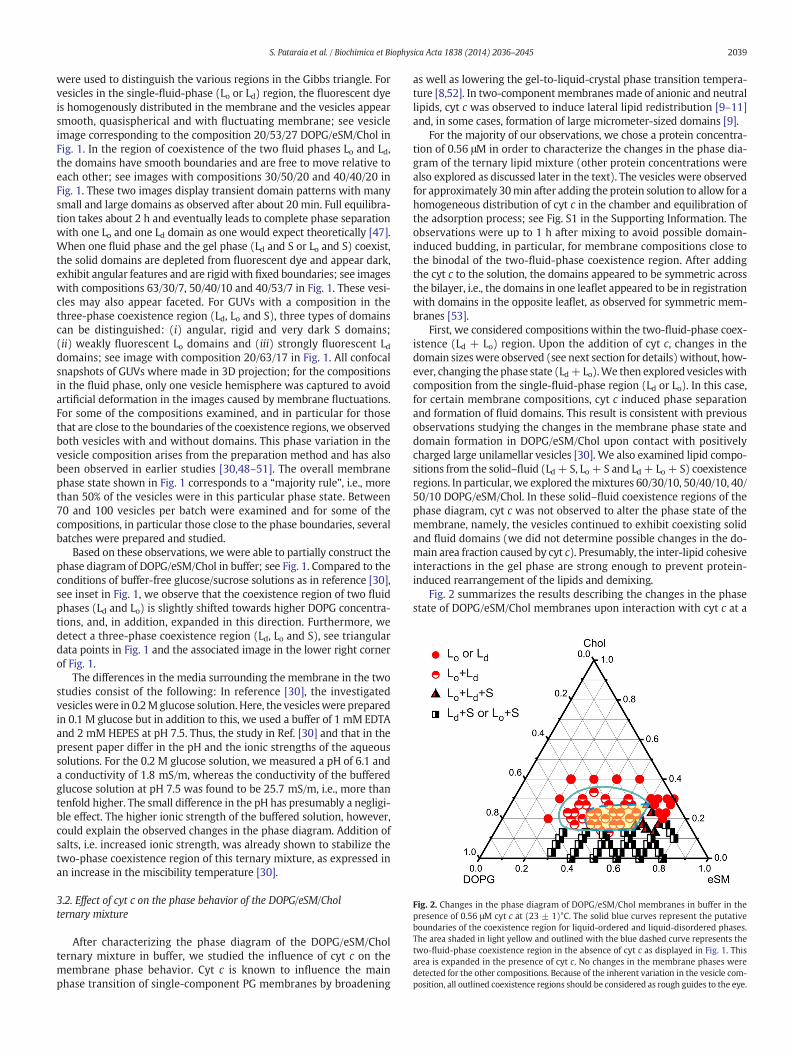
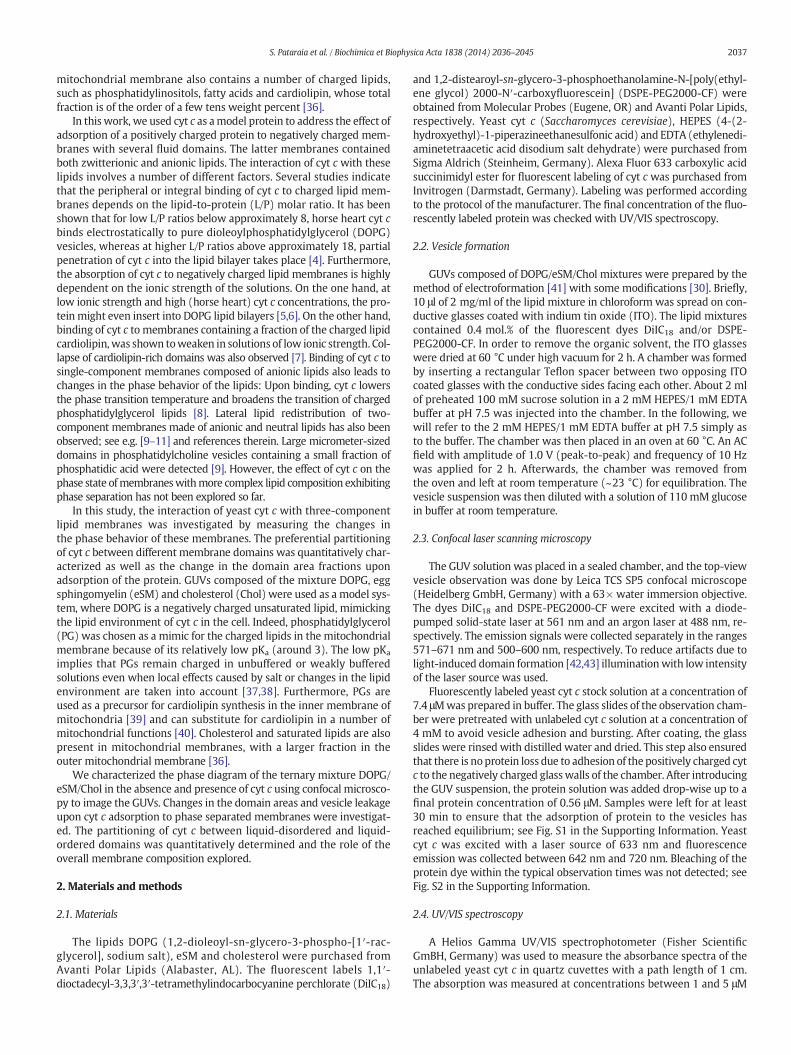
Fig. 2. Changes in the phase diagram of DOPG/eSM/Chol membranes in buffer in thepresence of 0.56 μM cyt c at (23 ± 1)°C. The solid blue curves represent the putativeboundaries of the coexistence region for liquid-ordered and liquid-disordered phases.The area shaded in light yellow and outlined with the blue dashed curve represents thetwo-fluid-phase coexistence region in the absence of cyt c as displayed in Fig. 1. Thisarea is expanded in the presence of cyt c. No changes in the membrane phases weredetected for the other compositions. Because of the inherent variation in the vesicle com-position, all outlined coexistence regions should be considered as rough guides to the eye.
2039S. Pataraia et al. / Biochimica et Biophysica Acta 1838 (2014) 2036–2045
were used to distinguish the various regions in the Gibbs triangle. Forvesicles in the single-fluid-phase (Lo or Ld) region, the fluorescent dyeis homogenously distributed in the membrane and the vesicles appearsmooth, quasispherical and with fluctuating membrane; see vesicleimage corresponding to the composition 20/53/27 DOPG/eSM/Chol inFig. 1. In the region of coexistence of the two fluid phases Lo and Ld,the domains have smooth boundaries and are free to move relative toeach other; see images with compositions 30/50/20 and 40/40/20 inFig. 1. These two images display transient domain patterns with manysmall and large domains as observed after about 20 min. Full equilibra-tion takes about 2 h and eventually leads to complete phase separationwith one Lo and one Ld domain as one would expect theoretically [47].When one fluid phase and the gel phase (Ld and S or Lo and S) coexist,the solid domains are depleted from fluorescent dye and appear dark,exhibit angular features and are rigidwith fixed boundaries; see imageswith compositions 63/30/7, 50/40/10 and 40/53/7 in Fig. 1. These vesi-cles may also appear faceted. For GUVs with a composition in thethree-phase coexistence region (Ld, Lo and S), three types of domainscan be distinguished: (i) angular, rigid and very dark S domains;(ii) weakly fluorescent Lo domains and (iii) strongly fluorescent Lddomains; see image with composition 20/63/17 in Fig. 1. All confocalsnapshots of GUVs where made in 3D projection; for the compositionsin the fluid phase, only one vesicle hemisphere was captured to avoidartificial deformation in the images caused by membrane fluctuations.For some of the compositions examined, and in particular for thosethat are close to the boundaries of the coexistence regions, we observedboth vesicles with and without domains. This phase variation in thevesicle composition arises from the preparation method and has alsobeen observed in earlier studies [30,48–51]. The overall membranephase state shown in Fig. 1 corresponds to a “majority rule”, i.e., morethan 50% of the vesicles were in this particular phase state. Between70 and 100 vesicles per batch were examined and for some of thecompositions, in particular those close to the phase boundaries, severalbatches were prepared and studied.
Based on these observations, we were able to partially construct thephase diagram of DOPG/eSM/Chol in buffer; see Fig. 1. Compared to theconditions of buffer-free glucose/sucrose solutions as in reference [30],see inset in Fig. 1, we observe that the coexistence region of two fluidphases (Ld and Lo) is slightly shifted towards higher DOPG concentra-tions, and, in addition, expanded in this direction. Furthermore, wedetect a three-phase coexistence region (Ld, Lo and S), see triangulardata points in Fig. 1 and the associated image in the lower right cornerof Fig. 1.
The differences in the media surrounding the membrane in the twostudies consist of the following: In reference [30], the investigatedvesicleswere in 0.2Mglucose solution. Here, the vesicleswere preparedin 0.1 M glucose but in addition to this, we used a buffer of 1 mM EDTAand 2 mM HEPES at pH 7.5. Thus, the study in Ref. [30] and that in thepresent paper differ in the pH and the ionic strengths of the aqueoussolutions. For the 0.2 M glucose solution, we measured a pH of 6.1 anda conductivity of 1.8 mS/m, whereas the conductivity of the bufferedglucose solution at pH 7.5 was found to be 25.7 mS/m, i.e., more thantenfold higher. The small difference in the pH has presumably a negligi-ble effect. The higher ionic strength of the buffered solution, however,could explain the observed changes in the phase diagram. Addition ofsalts, i.e. increased ionic strength, was already shown to stabilize thetwo-phase coexistence region of this ternary mixture, as expressed inan increase in the miscibility temperature [30].
3.2. Effect of cyt c on the phase behavior of the DOPG/eSM/Cholternary mixture
After characterizing the phase diagram of the DOPG/eSM/Cholternary mixture in buffer, we studied the influence of cyt c on themembrane phase behavior. Cyt c is known to influence the mainphase transition of single-component PG membranes by broadening
as well as lowering the gel-to-liquid-crystal phase transition tempera-ture [8,52]. In two-componentmembranes made of anionic and neutrallipids, cyt c was observed to induce lateral lipid redistribution [9–11]and, in some cases, formation of large micrometer-sized domains [9].
For the majority of our observations, we chose a protein concentra-tion of 0.56 μM in order to characterize the changes in the phase dia-gram of the ternary lipid mixture (other protein concentrations werealso explored as discussed later in the text). The vesicles were observedfor approximately 30min after adding the protein solution to allow for ahomogeneous distribution of cyt c in the chamber and equilibration ofthe adsorption process; see Fig. S1 in the Supporting Information. Theobservations were up to 1 h after mixing to avoid possible domain-induced budding, in particular, for membrane compositions close tothe binodal of the two-fluid-phase coexistence region. After addingthe cyt c to the solution, the domains appeared to be symmetric acrossthe bilayer, i.e., the domains in one leaflet appeared to be in registrationwith domains in the opposite leaflet, as observed for symmetric mem-branes [53].
First, we considered compositions within the two-fluid-phase coex-istence (Ld + Lo) region. Upon the addition of cyt c, changes in thedomain sizeswere observed (see next section for details)without, how-ever, changing the phase state (Ld+ Lo).We then explored vesicleswithcomposition from the single-fluid-phase region (Ld or Lo). In this case,for certain membrane compositions, cyt c induced phase separationand formation of fluid domains. This result is consistent with previousobservations studying the changes in the membrane phase state anddomain formation in DOPG/eSM/Chol upon contact with positivelycharged large unilamellar vesicles [30]. We also examined lipid compo-sitions from the solid–fluid (Ld+ S, Lo+ S and Ld+ Lo+ S) coexistenceregions. In particular, we explored themixtures 60/30/10, 50/40/10, 40/50/10 DOPG/eSM/Chol. In these solid–fluid coexistence regions of thephase diagram, cyt c was not observed to alter the phase state of themembrane, namely, the vesicles continued to exhibit coexisting solidand fluid domains (we did not determine possible changes in the do-main area fraction caused by cyt c). Presumably, the inter-lipid cohesiveinteractions in the gel phase are strong enough to prevent protein-induced rearrangement of the lipids and demixing.
Fig. 2 summarizes the results describing the changes in the phasestate of DOPG/eSM/Chol membranes upon interaction with cyt c at a
2040 S. Pataraia et al. / Biochimica et Biophysica Acta 1838 (2014) 2036–2045
concentration of 0.56 μM. The region of two-fluid-phase coexistence isenlarged at the expense of the single-fluid-phase region; see the blueboundary of the phase coexistence region in Fig. 2. Thus, we concludethat the adsorption of cyt c leads to an extension or enlargement ofthe Ld–Lo coexistence region. In the absence and presence of cyt c, theestimated Ld–Lo phase boundary is given by the broken blue curve andthe solid blue curve in Fig. 2, respectively.
Because the phase boundaries were deduced from optical microsco-py, one could imagine that the formationofmicron-sized domainswith-in the new cyt c-induced extension of the Ld–Lo coexistence regionarises from the coalescence of submicron domains that exist already inthe absence of cyt c. However, such a scenario is rather unlikely because,in the absence of cyt c, the deduced Ld–Lo coexistence region corre-sponds to complete phase separation characterized by the formationof two large domains after an equilibration time of about 2 h. Therefore,we would need a molecular mechanism that stabilizes the submicrondomains and prevents their coalescence within the extension of theLd–Lo coexistence region but is ineffective within the original Ld–Locoexistence region of the protein-free system. Such a mechanism ishard to imagine because this mechanism would apply, for any chosentie-line, only to some segment of this tie-line, even though themateri-al parameters characterizing the two membrane domains have con-stant values along the whole tie-line. On the other hand, one couldspeculate that local segregation and molecular clustering in the mem-brane are initiated upon adsorption of cyt c, which would induce theformation of Ld and Lo domains in regions of the phase diagramwhere only single (Lo or Ld) phases are observed in the absence ofthe protein.
As mentioned in the introduction, the effect of cyt c on the mem-brane depends on the lipid-to-protein (L/P) molar ratio in the system.Thus,we expected that the vesicle response should depend on the over-all protein concentration. We investigated the phase state changes inDOPG/eSM/Chol vesicles brought into contact with solutions of cyt c atvarious concentrations in the range from 1 nM to 1.39 μM. At very lowconcentrations, 6.5 nM and lower, no changes in the phase state ofthe membranes in the one-fluid-phase region were detected underthe microscope (membranes with the following compositions weremonitored: 50/30/20, 40/30/30 and 30/40/30). At very high proteinconcentrations, 1.2 μM and higher, the changes induced on the mem-brane phase state were difficult to characterize because the vesiclesappeared unstable upon adding the protein solution and ruptured in abursting fashion or collapsed in a way similar to events reported forcardiolipin doped membranes [7]. (Note that these protein concentra-tions are comparable to typical lipid concentrations in GUV systems.)For intermediate concentrations, we observed changes associated withthe phase state of the membrane (as illustrated by the phase diagramin Fig. 2 for a cyt c concentration of 0.56 μM) and changes in the domainsizes for membrane compositions belonging to the region of two-fluid-phase coexistence.
Several studies in the literature have explored the effect of factorssuch as the L/P ratio and the ionic strength on the mode of interactionof cyt cwith themembrane. Thus, we estimated the L/P ratio for our sys-temat a protein concentration of 0.56 μM. For this purpose, we assumedthat there was no lipid loss during the preparation of the vesiclesand their transfer to the observation chamber. If we consider the totallipid and not only the external leaflet of the membrane immediatelyaccessible to cyt c in the bulk, the L/P ratio is approximately 16. Forsuch an L/P ratio and low ionic strength of the solution (as in oursystem), the predominant protein–membrane interactions are of elec-trostatic nature [4]. Let us note however, that the studies in reference[4] have been performed on pure DOPG vesicles, while in our system,the fraction of DOPG in the membrane is lower and varies. In addition,we cannot fully exclude the possibility that cyt c interacts with eSM,for which studies are not available in the literature to the best of ourknowledge. Thus, interactions of non-electrostatic nature cannot beentirely excluded.
3.3. Changes in the domain areas upon binding of cyt c
We evaluated the area change of fluid domains upon adsorption ofcyt c using a flow chamber to introduce the protein at a concentrationof 0.56 μM.We used two ways of monitoring the domain area changes,both of which have advantages and disadvantages: (i) We selected avesicle and directly followed the changes upon introducing the proteinsolution. Such experiments are laborious because of the long observa-tion times and the difficulty of following a single vesicle during theexchange of solutions in the observation chamber. Thus, only a few ves-icles per membrane composition were observed. (ii) We examined apopulation of vesicles before introducing cyt c, and then investigatedanother vesicle population after adding the protein. The advantage ofin this approach is that the results are statistically averaged over manyvesicles. However, the history of the individual vesicles is not knownand frequent vesicle budding during the solution exchange, leading tosystematic shifts in the vesicle compositions, is to be expected. In bothapproaches, there are concerns about the exact membrane compositionof the vesicles. It is known that for multicomponent lipid mixtures, thecomposition of vesicles in a batch can vary drastically from vesicle tovesicle depending on the individual vesicle history during the prepara-tion step. Particularly strong deviations in the vesicle compositionare observed for multicomponent lipid mixtures which are not fullymiscible at the temperature of observation [30,48,51]. One importantadvantage of the first approach, however, is that each explored vesiclehas the same initial and final lipid composition, whereas studies ofvesicle populations involve averages over different components.
Below, we present results using both approaches. The vesicles werelabeledwith DiIC18which partitions into the Ld phase. For the areamea-surements, we chose spherical vesicles exhibiting only two domains.Apart from being well equilibrated (the phase separation and domaincoalescence are completed), calculating the domain areas in suchvesicles is simple. The domains have the shapes of spherical caps andthe domain area can be estimates from measurements of the projecteddomain diameter and the vesicle radius.
We chose to examine three different membrane compositionswhich exhibit two-fluid-phase (Ld/Lo) coexistence in the absence ofcyt c: 20/60/20, 30/50/20 and 40/40/20; see also Fig. 6B. The cardiolipinconcentration in the inner membrane of mitochondria ranges from 18%to 24% of the lipid content [36]. Taking into account that cardiolipinpossesses two negative charges compared to PG, which carries onlyone net charge, the compositions we have chosen are a suitable mimicfor the mitochondrial membrane in terms of the membrane surfacecharge.
Fig. 3A gives an example for the behavior of a single vesicle upon ad-dition of cyt c. Themembrane composition is 30/50/20DOPG/eSM/Chol.The initial area fraction of the Ld domain is (21.05 ± 0.75)% and, afterthe addition of the protein solution, it increases to (26.12 ± 0.70)%.The error represents standard deviation from image processing. Mea-surements on two other vesicles with this membrane compositionyielded change by 7.31% and 1.75%. The sizes of the vesicles werenot observed to change. Observations on three other vesicles made of40/40/20 and 20/60/20 DOPG/eSM/Chol yielded similar changes in theLd domain area fraction, namely an increase between 3 and 5%. Nodependence on the area increase as a function of themembrane compo-sition was observed. Statistical measurements over populations ofvesicles made of 30/50/20 DOPG/eSM/Chol yielded an increase of theLd area fraction of approximately 3.5%; see Fig. 3B.
Even though the error for the area changes when averaged overvesicle populations is large and the difference between the cases withand without cyt c is small, we are confident that the effect is present.The measurements on individual vesicles unequivocally show that theLd area fraction increases in the presence of the protein. In general,measurements over vesicle populations should be always backed upby direct tests on individual vesicles. Note that if themajority of the ves-icles exhibits budding during the addition of the protein, systematic
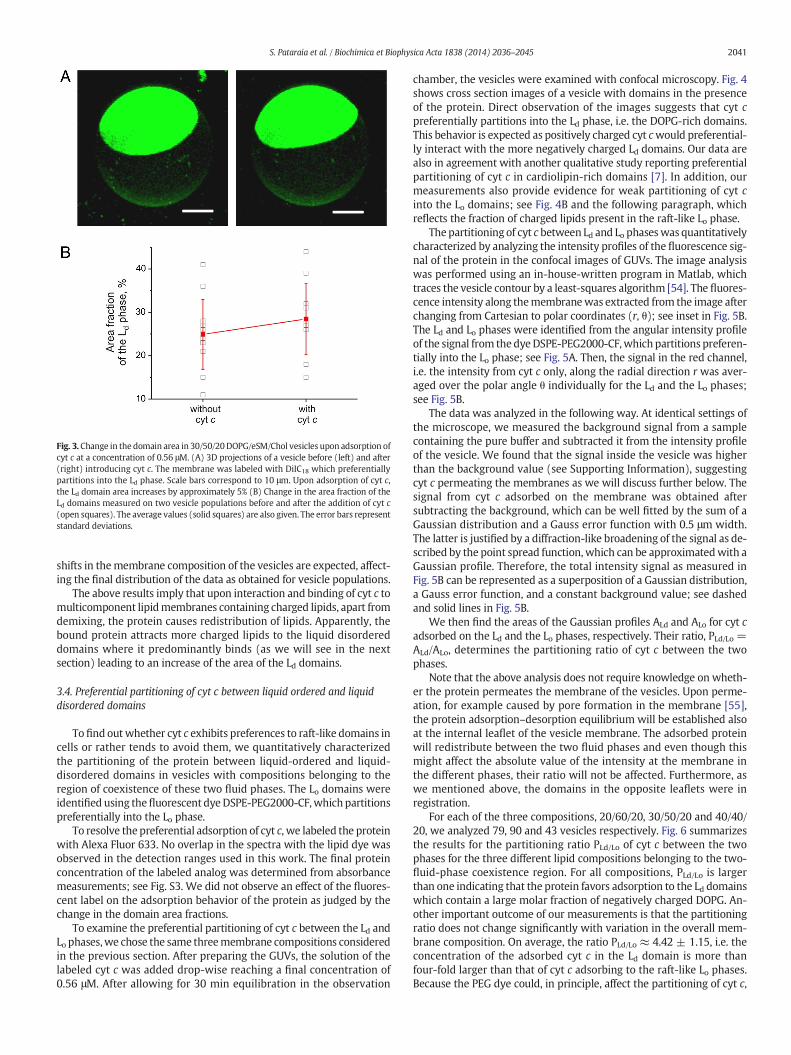
Fig. 3. Change in the domain area in 30/50/20DOPG/eSM/Chol vesicles upon adsorption ofcyt c at a concentration of 0.56 μM. (A) 3D projections of a vesicle before (left) and after(right) introducing cyt c. The membrane was labeled with DiIC18 which preferentiallypartitions into the Ld phase. Scale bars correspond to 10 μm. Upon adsorption of cyt c,the Ld domain area increases by approximately 5% (B) Change in the area fraction of theLd domains measured on two vesicle populations before and after the addition of cyt c(open squares). The average values (solid squares) are also given. The error bars representstandard deviations.
2041S. Pataraia et al. / Biochimica et Biophysica Acta 1838 (2014) 2036–2045
shifts in themembrane composition of the vesicles are expected, affect-ing the final distribution of the data as obtained for vesicle populations.
The above results imply that upon interaction and binding of cyt c tomulticomponent lipidmembranes containing charged lipids, apart fromdemixing, the protein causes redistribution of lipids. Apparently, thebound protein attracts more charged lipids to the liquid disordereddomains where it predominantly binds (as we will see in the nextsection) leading to an increase of the area of the Ld domains.
3.4. Preferential partitioning of cyt c between liquid ordered and liquiddisordered domains
Tofind outwhether cyt c exhibits preferences to raft-like domains incells or rather tends to avoid them, we quantitatively characterizedthe partitioning of the protein between liquid-ordered and liquid-disordered domains in vesicles with compositions belonging to theregion of coexistence of these two fluid phases. The Lo domains wereidentified using thefluorescent dyeDSPE-PEG2000-CF,whichpartitionspreferentially into the Lo phase.
To resolve the preferential adsorption of cyt c, we labeled the proteinwith Alexa Fluor 633. No overlap in the spectra with the lipid dye wasobserved in the detection ranges used in this work. The final proteinconcentration of the labeled analog was determined from absorbancemeasurements; see Fig. S3. We did not observe an effect of the fluores-cent label on the adsorption behavior of the protein as judged by thechange in the domain area fractions.
To examine the preferential partitioning of cyt c between the Ld andLo phases,we chose the same threemembrane compositions consideredin the previous section. After preparing the GUVs, the solution of thelabeled cyt c was added drop-wise reaching a final concentration of0.56 μM. After allowing for 30 min equilibration in the observation
chamber, the vesicles were examined with confocal microscopy. Fig. 4shows cross section images of a vesicle with domains in the presenceof the protein. Direct observation of the images suggests that cyt cpreferentially partitions into the Ld phase, i.e. the DOPG-rich domains.This behavior is expected as positively charged cyt cwould preferential-ly interact with the more negatively charged Ld domains. Our data arealso in agreement with another qualitative study reporting preferentialpartitioning of cyt c in cardiolipin-rich domains [7]. In addition, ourmeasurements also provide evidence for weak partitioning of cyt cinto the Lo domains; see Fig. 4B and the following paragraph, whichreflects the fraction of charged lipids present in the raft-like Lo phase.
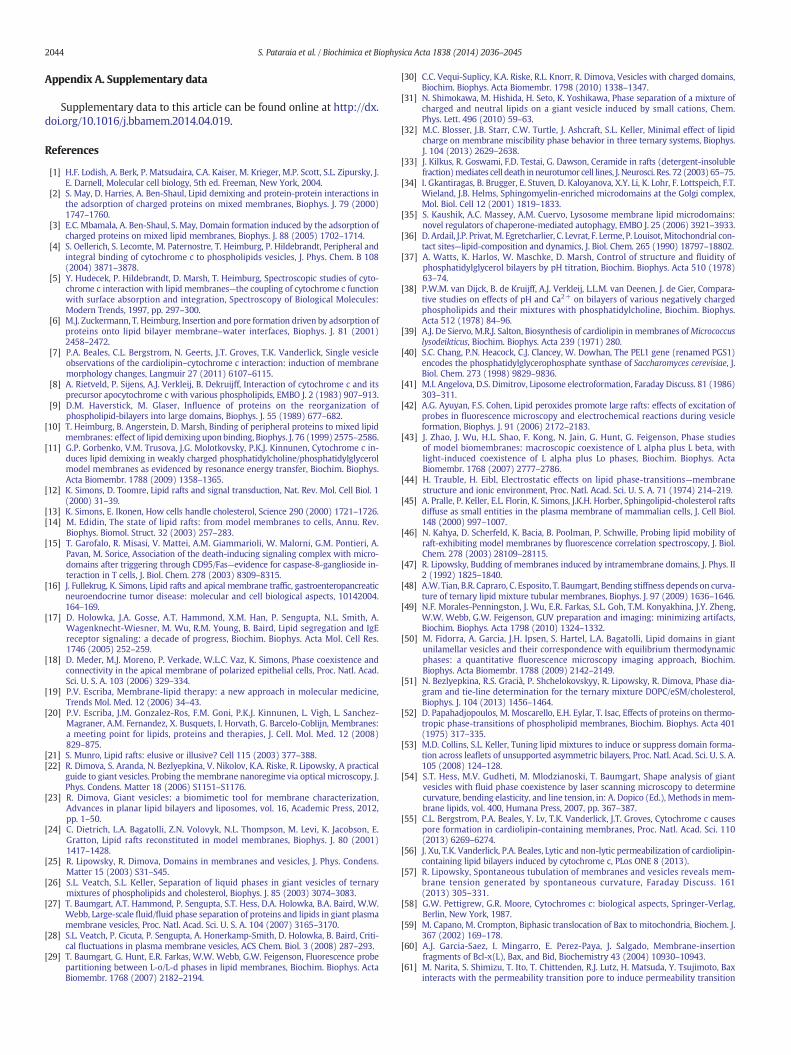
The partitioning of cyt c between Ld and Lo phaseswas quantitativelycharacterized by analyzing the intensity profiles of the fluorescence sig-nal of the protein in the confocal images of GUVs. The image analysiswas performed using an in-house-written program in Matlab, whichtraces the vesicle contour by a least-squares algorithm [54]. The fluores-cence intensity along themembranewas extracted from the image afterchanging from Cartesian to polar coordinates (r, θ); see inset in Fig. 5B.The Ld and Lo phases were identified from the angular intensity profileof the signal from the dyeDSPE-PEG2000-CF,whichpartitions preferen-tially into the Lo phase; see Fig. 5A. Then, the signal in the red channel,i.e. the intensity from cyt c only, along the radial direction r was aver-aged over the polar angle θ individually for the Ld and the Lo phases;see Fig. 5B.
The data was analyzed in the following way. At identical settings ofthe microscope, we measured the background signal from a samplecontaining the pure buffer and subtracted it from the intensity profileof the vesicle. We found that the signal inside the vesicle was higherthan the background value (see Supporting Information), suggestingcyt c permeating the membranes as we will discuss further below. Thesignal from cyt c adsorbed on the membrane was obtained aftersubtracting the background, which can be well fitted by the sum of aGaussian distribution and a Gauss error function with 0.5 μm width.The latter is justified by a diffraction-like broadening of the signal as de-scribed by the point spread function,which can be approximatedwith aGaussian profile. Therefore, the total intensity signal as measured inFig. 5B can be represented as a superposition of a Gaussian distribution,a Gauss error function, and a constant background value; see dashedand solid lines in Fig. 5B.
We then find the areas of the Gaussian profiles ALd and ALo for cyt cadsorbed on the Ld and the Lo phases, respectively. Their ratio, PLd/Lo =ALd/ALo, determines the partitioning ratio of cyt c between the twophases.
Note that the above analysis does not require knowledge on wheth-er the protein permeates the membrane of the vesicles. Upon perme-ation, for example caused by pore formation in the membrane [55],the protein adsorption–desorption equilibrium will be established alsoat the internal leaflet of the vesicle membrane. The adsorbed proteinwill redistribute between the two fluid phases and even though thismight affect the absolute value of the intensity at the membrane inthe different phases, their ratio will not be affected. Furthermore, aswe mentioned above, the domains in the opposite leaflets were inregistration.
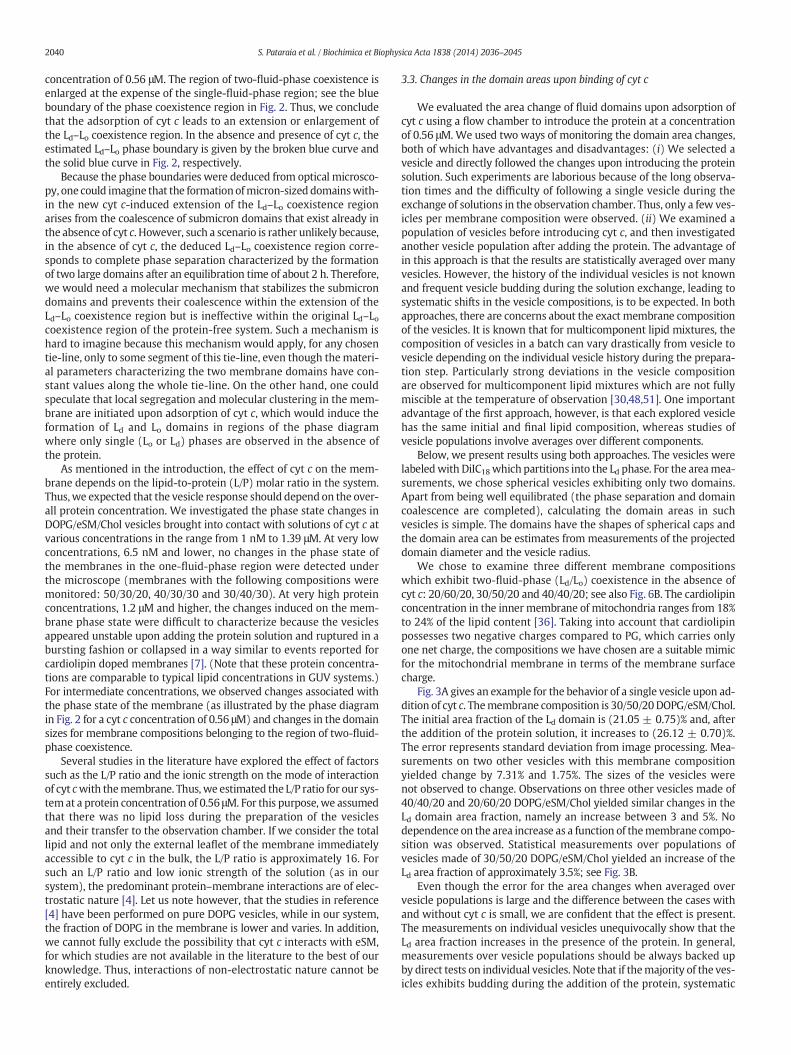
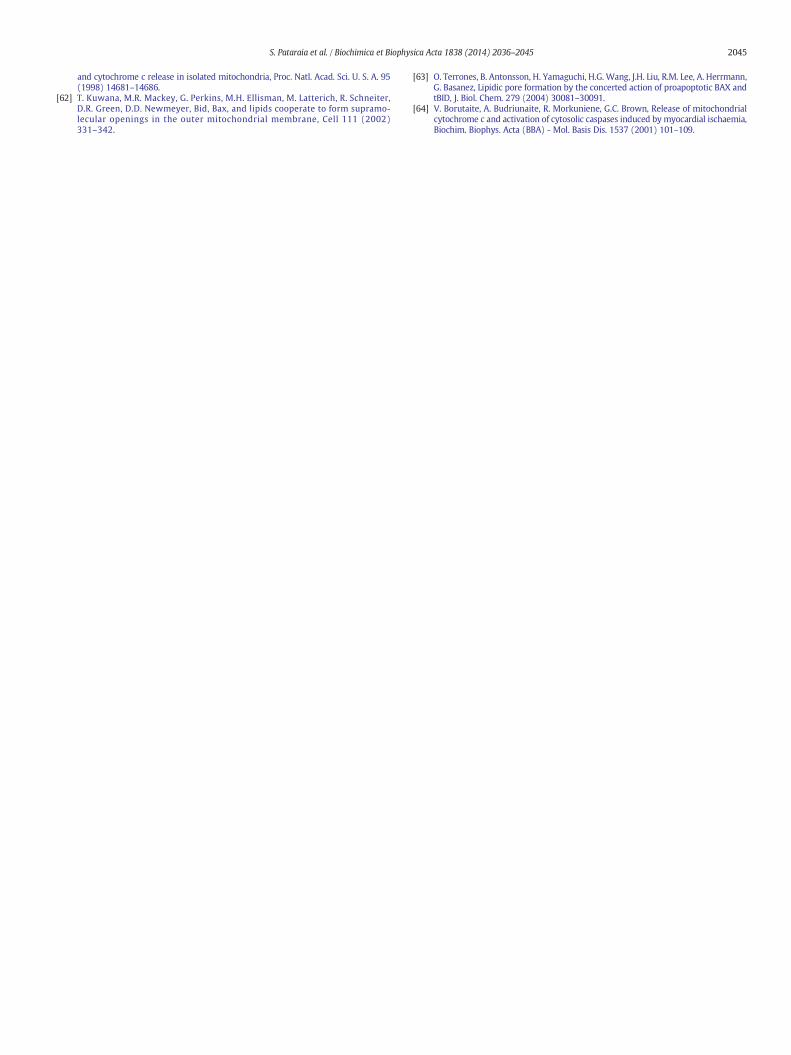
For each of the three compositions, 20/60/20, 30/50/20 and 40/40/20, we analyzed 79, 90 and 43 vesicles respectively. Fig. 6 summarizesthe results for the partitioning ratio PLd/Lo of cyt c between the twophases for the three different lipid compositions belonging to the two-fluid-phase coexistence region. For all compositions, PLd/Lo is largerthan one indicating that the protein favors adsorption to the Ld domainswhich contain a large molar fraction of negatively charged DOPG. An-other important outcome of our measurements is that the partitioningratio does not change significantly with variation in the overall mem-brane composition. On average, the ratio PLd/Lo ≈ 4.42 ± 1.15, i.e. theconcentration of the adsorbed cyt c in the Ld domain is more thanfour-fold larger than that of cyt c adsorbing to the raft-like Lo phases.Because the PEG dye could, in principle, affect the partitioning of cyt c,
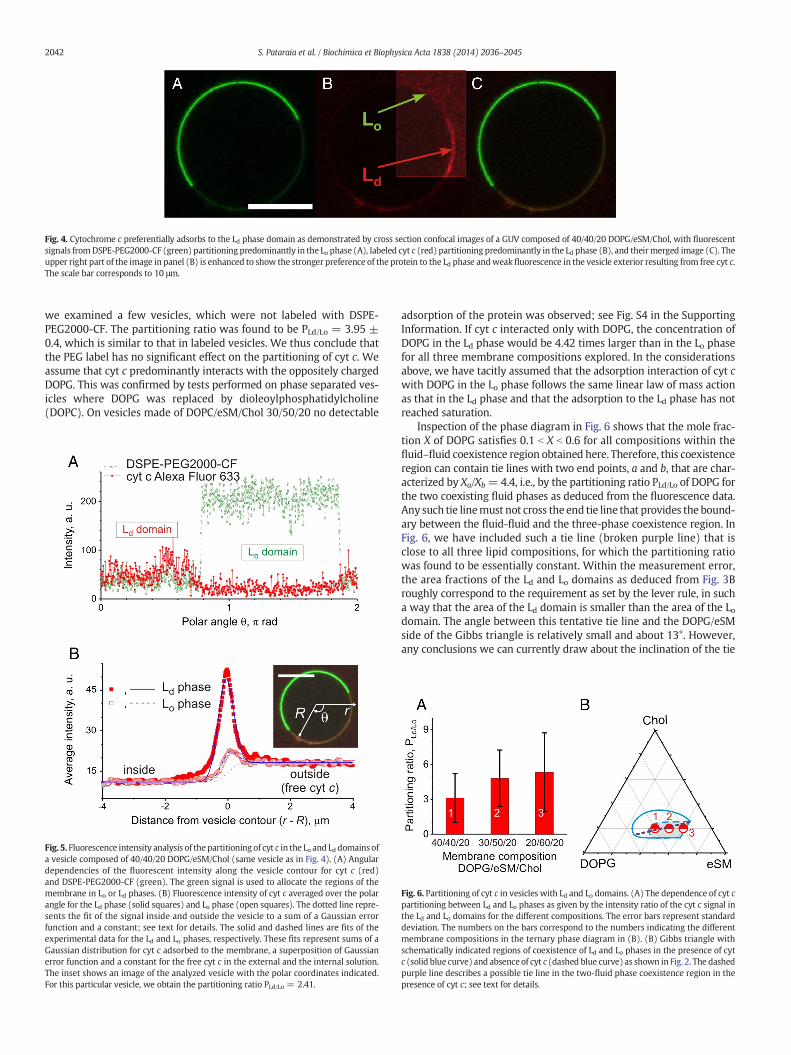
Fig. 4. Cytochrome c preferentially adsorbs to the Ld phase domain as demonstrated by cross section confocal images of a GUV composed of 40/40/20 DOPG/eSM/Chol, with fluorescentsignals fromDSPE-PEG2000-CF (green) partitioning predominantly in the Lo phase (A), labeled cyt c (red) partitioning predominantly in the Ld phase (B), and theirmerged image (C). Theupper right part of the image in panel (B) is enhanced to show the stronger preference of the protein to the Ld phase andweak fluorescence in the vesicle exterior resulting from free cyt c.The scale bar corresponds to 10 μm.
2042 S. Pataraia et al. / Biochimica et Biophysica Acta 1838 (2014) 2036–2045
we examined a few vesicles, which were not labeled with DSPE-PEG2000-CF. The partitioning ratio was found to be PLd/Lo = 3.95 ±0.4, which is similar to that in labeled vesicles. We thus conclude thatthe PEG label has no significant effect on the partitioning of cyt c. Weassume that cyt c predominantly interacts with the oppositely chargedDOPG. This was confirmed by tests performed on phase separated ves-icles where DOPG was replaced by dioleoylphosphatidylcholine(DOPC). On vesicles made of DOPC/eSM/Chol 30/50/20 no detectable
Fig. 5. Fluorescence intensity analysis of the partitioningof cyt c in the Lo and Ld domains ofa vesicle composed of 40/40/20 DOPG/eSM/Chol (same vesicle as in Fig. 4). (A) Angulardependencies of the fluorescent intensity along the vesicle contour for cyt c (red)and DSPE-PEG2000-CF (green). The green signal is used to allocate the regions of themembrane in Lo or Ld phases. (B) Fluorescence intensity of cyt c averaged over the polarangle for the Ld phase (solid squares) and Lo phase (open squares). The dotted line repre-sents the fit of the signal inside and outside the vesicle to a sum of a Gaussian errorfunction and a constant; see text for details. The solid and dashed lines are fits of theexperimental data for the Ld and Lo phases, respectively. These fits represent sums of aGaussian distribution for cyt c adsorbed to the membrane, a superposition of Gaussianerror function and a constant for the free cyt c in the external and the internal solution.The inset shows an image of the analyzed vesicle with the polar coordinates indicated.For this particular vesicle, we obtain the partitioning ratio PLd/Lo = 2.41.
adsorption of the protein was observed; see Fig. S4 in the SupportingInformation. If cyt c interacted only with DOPG, the concentration ofDOPG in the Ld phase would be 4.42 times larger than in the Lo phasefor all three membrane compositions explored. In the considerationsabove, we have tacitly assumed that the adsorption interaction of cyt cwith DOPG in the Lo phase follows the same linear law of mass actionas that in the Ld phase and that the adsorption to the Ld phase has notreached saturation.
Inspection of the phase diagram in Fig. 6 shows that the mole frac-tion X of DOPG satisfies 0.1 b X b 0.6 for all compositions within thefluid–fluid coexistence region obtained here. Therefore, this coexistenceregion can contain tie lines with two end points, a and b, that are char-acterized by Xa/Xb =4.4, i.e., by the partitioning ratio PLd/Lo of DOPG forthe two coexisting fluid phases as deduced from the fluorescence data.Any such tie linemust not cross the end tie line that provides the bound-ary between the fluid-fluid and the three-phase coexistence region. InFig. 6, we have included such a tie line (broken purple line) that isclose to all three lipid compositions, for which the partitioning ratiowas found to be essentially constant. Within the measurement error,the area fractions of the Ld and Lo domains as deduced from Fig. 3Broughly correspond to the requirement as set by the lever rule, in sucha way that the area of the Ld domain is smaller than the area of the Lodomain. The angle between this tentative tie line and the DOPG/eSMside of the Gibbs triangle is relatively small and about 13°. However,any conclusions we can currently draw about the inclination of the tie
Fig. 6. Partitioning of cyt c in vesicles with Ld and Lo domains. (A) The dependence of cyt cpartitioning between Ld and Lo phases as given by the intensity ratio of the cyt c signal inthe Ld and Lo domains for the different compositions. The error bars represent standarddeviation. The numbers on the bars correspond to the numbers indicating the differentmembrane compositions in the ternary phase diagram in (B). (B) Gibbs triangle withschematically indicated regions of coexistence of Ld and Lo phases in the presence of cytc (solid blue curve) and absence of cyt c (dashed blue curve) as shown in Fig. 2. The dashedpurple line describes a possible tie line in the two-fluid phase coexistence region in thepresence of cyt c; see text for details.

2043S. Pataraia et al. / Biochimica et Biophysica Acta 1838 (2014) 2036–2045
line are highly speculative in view of the poor precision of the phaseboundaries of the two-fluid phase coexistence region that we havesketched in Figs. 2 and 6.
3.5. Cyt c permeation through the membrane
From the confocal images of some of the vesicles, we visuallyobserved weak fluorescence from cyt c both in the vesicle exterior andin the vesicle interior (see Fig. 4B). To quantify the signal inside thevesicle and to find out whether it arises from cyt c present in the vesicleinterior or representing some background noise, we also measured thefluorescence intensity of a sample containing only the buffer and usingidentical settings of the laser intensity and the image acquisition. Thisbackgroundnoisewas found lower than the intensity in the vesicle inte-rior for all images. This suggests that in all cases cyt c has permeated themembrane, i.e., the vesicles have leaked, however to a different degree.
To determine the degree of leakage, we performed the followinganalysis. The background noise (a constant estimated from the mea-surementwith buffer only)was subtracted from themeasured intensityprofiles. We then compared the fluorescence intensities measuredoutside the vesicle, Iex, and inside the vesicle, Iin, far from the vesiclemembrane; see Fig. 7A. The intensity reflecting the concentration offree cyt c outside the vesicles, Iex, was approximately the same forimages acquiredwith identical settings of themicroscope. This is under-standable, because the bulk concentration of cyt c was the same in allmeasurements. The degree of leakage was characterized in terms ofthe ratio L ≡ Iin/Iex. For L = 100%, the vesicles have fully leaked, whilefor lower values of L, partial leakage has occurred. The leakage data forvesicles with different compositions are given in Fig. 7B. Between 43and 90 vesicles per composition were examined.
Despite the scatter in the data, some rough conclusions can bedrawn. The vesicles with composition 30/50/20 DOPG/eSM/Cholexhibited the strongest leakage. About 65% of these vesicles have fullyleaked, while the remaining ones exhibit partial leakage with a peakaround L=60%. Themajority of the vesicles from the other two compo-sitions showed partial leakage around L = 40%. The compositional de-pendence of the degree of leakage may suggest that the successfulpore formation requires certain stoichiometry between the proteinand the membrane composition, and, in particular, the fraction of thecharged lipid.
Leakage of vesicles upon adsorption of cyt c has been observed formembranes made of phosphocholine and cardiolipin (and, in somecases, cholesterol) [55]. The leakage was ascribed to pore formationinduced by negative spontaneous curvature, resulting from theadsorption of the protein, and subsequent unfolding. In reference [55]however, relatively high concentrations of the protein were used
Fig. 7. Vesicle leakage. (A) Schematic illustration for the analysis on leakage: The back-ground signal (green) as measured on samples containing buffer only is compared tothe intensity profile (red). The background value is subtracted from the intensity mea-sured inside and outside the vesicle yielding the values Iin and Iex, respectively, as indicatedin the sketch. The ratio Iin/Iex represents the degree of leakage. (B) Histogramof the degreeof leakage Iin/Iex for membranes with different composition. The bin size was set to 20%.
corresponding to L/P ratios between approximately 0.1 and 2. Here, theprotein concentration is much lower (L/P = 16), which explains thelower degree of leakage compared to that observed in [55]. Indeed, wealso roughly estimated the amount of the bound protein finding that ap-proximately 50% of the protein in solution was adsorbed to GUVs for alllipid compositions; see the Supporting Information. Very recently, thesame group explored a broader range of protein concentrations [56].However, the membrane composition was somewhat different fromthat studied here and the measured permeability represented the per-meability of the membrane to ions and not necessarily to cyt c. Anotherdifference compared to themeasurements performed in reference [55] isthe asymmetry between the solution enclosed in the vesicles (sucroseonly) and the bathingmedia (salt solution), whichmight be an addition-al source of tension in the membrane arising from spontaneous curva-ture [57]. This asymmetry was lacking in our vesicles.
Our results on vesicle leakage combined with the finding on thestrong partitioning of cyt c in the liquid disordered phase may implythat during apoptosis and cyt c release, the protein effectively destabi-lizes not only the mitochondrial membrane but also other chargedintracellular membranes that it encounters as we discuss in more detailin the concluding section.
4. Conclusions
The phase diagram of the ternary mixture DOPG/eSM/Chol wascharacterized in buffered conditions. Compared to the buffer-free solu-tion [30], we found a number of differences in the phase behavior of themembranes. The two-fluid-phase coexistence region is expanded andshifted towards higher fractions of DOPG, and a three-phase coexistenceregion could be identified. The addition of cyt c at relatively lowsubmicromolar concentrations was shown to induce phase separationfor compositions belonging to the single-fluid-phase region in theabsence of the protein and, thus, to expand the two-fluid-phase coexis-tence region.
Under physiological conditions, cyt c plays an important role in therespiratory chain of eukaryotic cells and acts to transfer electrons be-tween two transmembrane complexes in the inner membrane of mito-chondria. During this process, the positively charged cyt c stays incontinuous contact with anionic lipids [58]. In addition, cyt c alsoplays a role in apoptosis, which.
Involves movement of pro-apoptotic proteins from the cytosol to themitochondrial membranes [59,60]. Several studies have indicated thatthese non-residential proteins induce cyt c release from themitochondriaby channel formation or activation of permeability transition pores[61–63]. The resulting concentrations of cytosolic cyt c in rat heart wereestimated to be on the order of 10 μM [64]. As argued in [55], cyt c mayeven orchestrate its own release into the cytosol by forming membranepores.
Indeed,we observed these processes already for cyt c concentrationsbelow 1 μM, i.e., for concentrations that are much smaller than the esti-mated concentrations of cytosolic cyt c during apoptotis. Therefore, thereadsorption of cytosolic cyt c ontomitochondrial or non-mitochondrialmembranes may lead to lipid redistribution and domain formationwithin these membranes as well. In this way, cyt c can generate addi-tional perturbations of the signal transduction and metabolic pathwaysin the cell, perturbations that are likely to enhance the process ofapoptosis.
Acknowledgments
This study was supported by the Deutsche Forschungsgemeinschaft(DFG) via IGRTG 1524 on “Self-Assembled Soft Matter Nano-Structuresat Interfaces”. YL is partially supported by the grant of the MPG-CASPartner Group Program.
2044 S. Pataraia et al. / Biochimica et Biophysica Acta 1838 (2014) 2036–2045
Appendix A. Supplementary data
Supplementary data to this article can be found online at http://dx.doi.org/10.1016/j.bbamem.2014.04.019.
References
[1] H.F. Lodish, A. Berk, P. Matsudaira, C.A. Kaiser, M. Krieger, M.P. Scott, S.L. Zipursky, J.E. Darnell, Molecular cell biology, 5th ed. Freeman, New York, 2004.
[2] S. May, D. Harries, A. Ben-Shaul, Lipid demixing and protein-protein interactions inthe adsorption of charged proteins on mixed membranes, Biophys. J. 79 (2000)1747–1760.
[3] E.C. Mbamala, A. Ben-Shaul, S. May, Domain formation induced by the adsorption ofcharged proteins on mixed lipid membranes, Biophys. J. 88 (2005) 1702–1714.
[4] S. Oellerich, S. Lecomte, M. Paternostre, T. Heimburg, P. Hildebrandt, Peripheral andintegral binding of cytochrome c to phospholipids vesicles, J. Phys. Chem. B 108(2004) 3871–3878.
[5] Y. Hudecek, P. Hildebrandt, D. Marsh, T. Heimburg, Spectroscopic studies of cyto-chrome c interaction with lipid membranes—the coupling of cytochrome c functionwith surface absorption and integration, Spectroscopy of Biological Molecules:Modern Trends, 1997, pp. 297–300.
[6] M.J. Zuckermann, T. Heimburg, Insertion and pore formation driven by adsorption ofproteins onto lipid bilayer membrane–water interfaces, Biophys. J. 81 (2001)2458–2472.
[7] P.A. Beales, C.L. Bergstrom, N. Geerts, J.T. Groves, T.K. Vanderlick, Single vesicleobservations of the cardiolipin–cytochrome c interaction: induction of membranemorphology changes, Langmuir 27 (2011) 6107–6115.
[8] A. Rietveld, P. Sijens, A.J. Verkleij, B. Dekruijff, Interaction of cytochrome c and itsprecursor apocytochrome c with various phospholipids, EMBO J. 2 (1983) 907–913.
[9] D.M. Haverstick, M. Glaser, Influence of proteins on the reorganization ofphospholipid-bilayers into large domains, Biophys. J. 55 (1989) 677–682.
[10] T. Heimburg, B. Angerstein, D. Marsh, Binding of peripheral proteins to mixed lipidmembranes: effect of lipid demixing uponbinding, Biophys. J. 76 (1999) 2575–2586.
[11] G.P. Gorbenko, V.M. Trusova, J.G. Molotkovsky, P.K.J. Kinnunen, Cytochrome c in-duces lipid demixing in weakly charged phosphatidylcholine/phosphatidylglycerolmodel membranes as evidenced by resonance energy transfer, Biochim. Biophys.Acta Biomembr. 1788 (2009) 1358–1365.
[12] K. Simons, D. Toomre, Lipid rafts and signal transduction, Nat. Rev. Mol. Cell Biol. 1(2000) 31–39.
[13] K. Simons, E. Ikonen, How cells handle cholesterol, Science 290 (2000) 1721–1726.[14] M. Edidin, The state of lipid rafts: from model membranes to cells, Annu. Rev.
Biophys. Biomol. Struct. 32 (2003) 257–283.[15] T. Garofalo, R. Misasi, V. Mattei, A.M. Giammarioli, W. Malorni, G.M. Pontieri, A.
Pavan, M. Sorice, Association of the death-inducing signaling complex with micro-domains after triggering through CD95/Fas—evidence for caspase-8-ganglioside in-teraction in T cells, J. Biol. Chem. 278 (2003) 8309–8315.
[16] J. Fullekrug, K. Simons, Lipid rafts and apical membrane traffic, gastroenteropancreaticneuroendocrine tumor disease: molecular and cell biological aspects, 10142004.164–169.
[17] D. Holowka, J.A. Gosse, A.T. Hammond, X.M. Han, P. Sengupta, N.L. Smith, A.Wagenknecht-Wiesner, M. Wu, R.M. Young, B. Baird, Lipid segregation and IgEreceptor signaling: a decade of progress, Biochim. Biophys. Acta Mol. Cell Res.1746 (2005) 252–259.
[18] D. Meder, M.J. Moreno, P. Verkade, W.L.C. Vaz, K. Simons, Phase coexistence andconnectivity in the apical membrane of polarized epithelial cells, Proc. Natl. Acad.Sci. U. S. A. 103 (2006) 329–334.
[19] P.V. Escriba, Membrane-lipid therapy: a new approach in molecular medicine,Trends Mol. Med. 12 (2006) 34–43.
[20] P.V. Escriba, J.M. Gonzalez-Ros, F.M. Goni, P.K.J. Kinnunen, L. Vigh, L. Sanchez-Magraner, A.M. Fernandez, X. Busquets, I. Horvath, G. Barcelo-Coblijn, Membranes:a meeting point for lipids, proteins and therapies, J. Cell. Mol. Med. 12 (2008)829–875.
[21] S. Munro, Lipid rafts: elusive or illusive? Cell 115 (2003) 377–388.[22] R. Dimova, S. Aranda, N. Bezlyepkina, V. Nikolov, K.A. Riske, R. Lipowsky, A practical
guide to giant vesicles. Probing themembrane nanoregime via optical microscopy, J.Phys. Condens. Matter 18 (2006) S1151–S1176.
[23] R. Dimova, Giant vesicles: a biomimetic tool for membrane characterization,Advances in planar lipid bilayers and liposomes, vol. 16, Academic Press, 2012,pp. 1–50.
[24] C. Dietrich, L.A. Bagatolli, Z.N. Volovyk, N.L. Thompson, M. Levi, K. Jacobson, E.Gratton, Lipid rafts reconstituted in model membranes, Biophys. J. 80 (2001)1417–1428.
[25] R. Lipowsky, R. Dimova, Domains in membranes and vesicles, J. Phys. Condens.Matter 15 (2003) S31–S45.
[26] S.L. Veatch, S.L. Keller, Separation of liquid phases in giant vesicles of ternarymixtures of phospholipids and cholesterol, Biophys. J. 85 (2003) 3074–3083.
[27] T. Baumgart, A.T. Hammond, P. Sengupta, S.T. Hess, D.A. Holowka, B.A. Baird, W.W.Webb, Large-scale fluid/fluid phase separation of proteins and lipids in giant plasmamembrane vesicles, Proc. Natl. Acad. Sci. U. S. A. 104 (2007) 3165–3170.
[28] S.L. Veatch, P. Cicuta, P. Sengupta, A. Honerkamp-Smith, D. Holowka, B. Baird, Criti-cal fluctuations in plasma membrane vesicles, ACS Chem. Biol. 3 (2008) 287–293.
[29] T. Baumgart, G. Hunt, E.R. Farkas, W.W. Webb, G.W. Feigenson, Fluorescence probepartitioning between L-o/L-d phases in lipid membranes, Biochim. Biophys. ActaBiomembr. 1768 (2007) 2182–2194.
[30] C.C. Vequi-Suplicy, K.A. Riske, R.L. Knorr, R. Dimova, Vesicles with charged domains,Biochim. Biophys. Acta Biomembr. 1798 (2010) 1338–1347.
[31] N. Shimokawa, M. Hishida, H. Seto, K. Yoshikawa, Phase separation of a mixture ofcharged and neutral lipids on a giant vesicle induced by small cations, Chem.Phys. Lett. 496 (2010) 59–63.
[32] M.C. Blosser, J.B. Starr, C.W. Turtle, J. Ashcraft, S.L. Keller, Minimal effect of lipidcharge on membrane miscibility phase behavior in three ternary systems, Biophys.J. 104 (2013) 2629–2638.
[33] J. Kilkus, R. Goswami, F.D. Testai, G. Dawson, Ceramide in rafts (detergent-insolublefraction)mediates cell death in neurotumor cell lines, J. Neurosci. Res. 72 (2003) 65–75.
[34] I. Gkantiragas, B. Brugger, E. Stuven, D. Kaloyanova, X.Y. Li, K. Lohr, F. Lottspeich, F.T.Wieland, J.B. Helms, Sphingomyelin-enriched microdomains at the Golgi complex,Mol. Biol. Cell 12 (2001) 1819–1833.
[35] S. Kaushik, A.C. Massey, A.M. Cuervo, Lysosome membrane lipid microdomains:novel regulators of chaperone-mediated autophagy, EMBO J. 25 (2006) 3921–3933.
[36] D. Ardail, J.P. Privat,M. Egretcharlier, C. Levrat, F. Lerme, P. Louisot,Mitochondrial con-tact sites—lipid-composition and dynamics, J. Biol. Chem. 265 (1990) 18797–18802.
[37] A. Watts, K. Harlos, W. Maschke, D. Marsh, Control of structure and fluidity ofphosphatidylglycerol bilayers by pH titration, Biochim. Biophys. Acta 510 (1978)63–74.
[38] P.W.M. van Dijck, B. de Kruijff, A.J. Verkleij, L.L.M. van Deenen, J. de Gier, Compara-tive studies on effects of pH and Ca2+ on bilayers of various negatively chargedphospholipids and their mixtures with phosphatidylcholine, Biochim. Biophys.Acta 512 (1978) 84–96.
[39] A.J. De Siervo, M.R.J. Salton, Biosynthesis of cardiolipin in membranes ofMicrococcuslysodeikticus, Biochim. Biophys. Acta 239 (1971) 280.
[40] S.C. Chang, P.N. Heacock, C.J. Clancey, W. Dowhan, The PEL1 gene (renamed PGS1)encodes the phosphatidylglycerophosphate synthase of Saccharomyces cerevisiae, J.Biol. Chem. 273 (1998) 9829–9836.
[41] M.I. Angelova, D.S. Dimitrov, Liposome electroformation, Faraday Discuss. 81 (1986)303–311.
[42] A.G. Ayuyan, F.S. Cohen, Lipid peroxides promote large rafts: effects of excitation ofprobes in fluorescence microscopy and electrochemical reactions during vesicleformation, Biophys. J. 91 (2006) 2172–2183.
[43] J. Zhao, J. Wu, H.L. Shao, F. Kong, N. Jain, G. Hunt, G. Feigenson, Phase studiesof model biomembranes: macroscopic coexistence of L alpha plus L beta, withlight-induced coexistence of L alpha plus Lo phases, Biochim. Biophys. ActaBiomembr. 1768 (2007) 2777–2786.
[44] H. Trauble, H. Eibl, Electrostatic effects on lipid phase-transitions—membranestructure and ionic environment, Proc. Natl. Acad. Sci. U. S. A. 71 (1974) 214–219.
[45] A. Pralle, P. Keller, E.L. Florin, K. Simons, J.K.H. Horber, Sphingolipid-cholesterol raftsdiffuse as small entities in the plasma membrane of mammalian cells, J. Cell Biol.148 (2000) 997–1007.
[46] N. Kahya, D. Scherfeld, K. Bacia, B. Poolman, P. Schwille, Probing lipid mobility ofraft-exhibiting model membranes by fluorescence correlation spectroscopy, J. Biol.Chem. 278 (2003) 28109–28115.
[47] R. Lipowsky, Budding of membranes induced by intramembrane domains, J. Phys. II2 (1992) 1825–1840.
[48] A.W. Tian, B.R. Capraro, C. Esposito, T. Baumgart, Bending stiffness depends on curva-ture of ternary lipid mixture tubular membranes, Biophys. J. 97 (2009) 1636–1646.
[49] N.F. Morales-Penningston, J. Wu, E.R. Farkas, S.L. Goh, T.M. Konyakhina, J.Y. Zheng,W.W. Webb, G.W. Feigenson, GUV preparation and imaging: minimizing artifacts,Biochim. Biophys. Acta 1798 (2010) 1324–1332.
[50] M. Fidorra, A. Garcia, J.H. Ipsen, S. Hartel, L.A. Bagatolli, Lipid domains in giantunilamellar vesicles and their correspondence with equilibrium thermodynamicphases: a quantitative fluorescence microscopy imaging approach, Biochim.Biophys. Acta Biomembr. 1788 (2009) 2142–2149.
[51] N. Bezlyepkina, R.S. Gracià, P. Shchelokovskyy, R. Lipowsky, R. Dimova, Phase dia-gram and tie-line determination for the ternary mixture DOPC/eSM/cholesterol,Biophys. J. 104 (2013) 1456–1464.
[52] D. Papahadjopoulos, M. Moscarello, E.H. Eylar, T. Isac, Effects of proteins on thermo-tropic phase-transitions of phospholipid membranes, Biochim. Biophys. Acta 401(1975) 317–335.
[53] M.D. Collins, S.L. Keller, Tuning lipid mixtures to induce or suppress domain forma-tion across leaflets of unsupported asymmetric bilayers, Proc. Natl. Acad. Sci. U. S. A.105 (2008) 124–128.
[54] S.T. Hess, M.V. Gudheti, M. Mlodzianoski, T. Baumgart, Shape analysis of giantvesicles with fluid phase coexistence by laser scanning microscopy to determinecurvature, bending elasticity, and line tension, in: A. Dopico (Ed.), Methods inmem-brane lipids, vol. 400, Humana Press, 2007, pp. 367–387.
[55] C.L. Bergstrom, P.A. Beales, Y. Lv, T.K. Vanderlick, J.T. Groves, Cytochrome c causespore formation in cardiolipin-containing membranes, Proc. Natl. Acad. Sci. 110(2013) 6269–6274.
[56] J. Xu, T.K. Vanderlick, P.A. Beales, Lytic and non-lytic permeabilization of cardiolipin-containing lipid bilayers induced by cytochrome c, PLos ONE 8 (2013).
[57] R. Lipowsky, Spontaneous tubulation of membranes and vesicles reveals mem-brane tension generated by spontaneous curvature, Faraday Discuss. 161(2013) 305–331.
[58] G.W. Pettigrew, G.R. Moore, Cytochromes c: biological aspects, Springer-Verlag,Berlin, New York, 1987.
[59] M. Capano, M. Crompton, Biphasic translocation of Bax to mitochondria, Biochem. J.367 (2002) 169–178.
[60] A.J. Garcia-Saez, I. Mingarro, E. Perez-Paya, J. Salgado, Membrane-insertionfragments of Bcl-x(L), Bax, and Bid, Biochemistry 43 (2004) 10930–10943.
[61] M. Narita, S. Shimizu, T. Ito, T. Chittenden, R.J. Lutz, H. Matsuda, Y. Tsujimoto, Baxinteracts with the permeability transition pore to induce permeability transition
2045S. Pataraia et al. / Biochimica et Biophysica Acta 1838 (2014) 2036–2045
and cytochrome c release in isolated mitochondria, Proc. Natl. Acad. Sci. U. S. A. 95(1998) 14681–14686.
[62] T. Kuwana, M.R. Mackey, G. Perkins, M.H. Ellisman, M. Latterich, R. Schneiter,D.R. Green, D.D. Newmeyer, Bid, Bax, and lipids cooperate to form supramo-lecular openings in the outer mitochondrial membrane, Cell 111 (2002)331–342.
[63] O. Terrones, B. Antonsson, H. Yamaguchi, H.G. Wang, J.H. Liu, R.M. Lee, A. Herrmann,G. Basanez, Lipidic pore formation by the concerted action of proapoptotic BAX andtBID, J. Biol. Chem. 279 (2004) 30081–30091.
[64] V. Borutaite, A. Budriunaite, R. Morkuniene, G.C. Brown, Release of mitochondrialcytochrome c and activation of cytosolic caspases induced by myocardial ischaemia,Biochim. Biophys. Acta (BBA) - Mol. Basis Dis. 1537 (2001) 101–109.
1
SUPPORTING INFORMATION
Effect of cytochrome c on the phase behavior of charged multicomponent lipid membranes
Salome Pataraia1, Yonggang Liu1,2, Reinhard Lipowsky1, Rumiana Dimova1,*
1 Department of Theory and Bio-Systems, Max Planck Institute of Colloids and Interfaces, Science Park Golm,
14424 Potsdam, Germany
2 State Key Laboratory of Polymer Physics and Chemistry, Changchun Institute of Applied Chemistry, Chinese
Academy of Sciences, 130022 Changchun, China
* Address correspondence to [email protected], Tel: +49 331 5679615, Fax: +49 331 5679612.
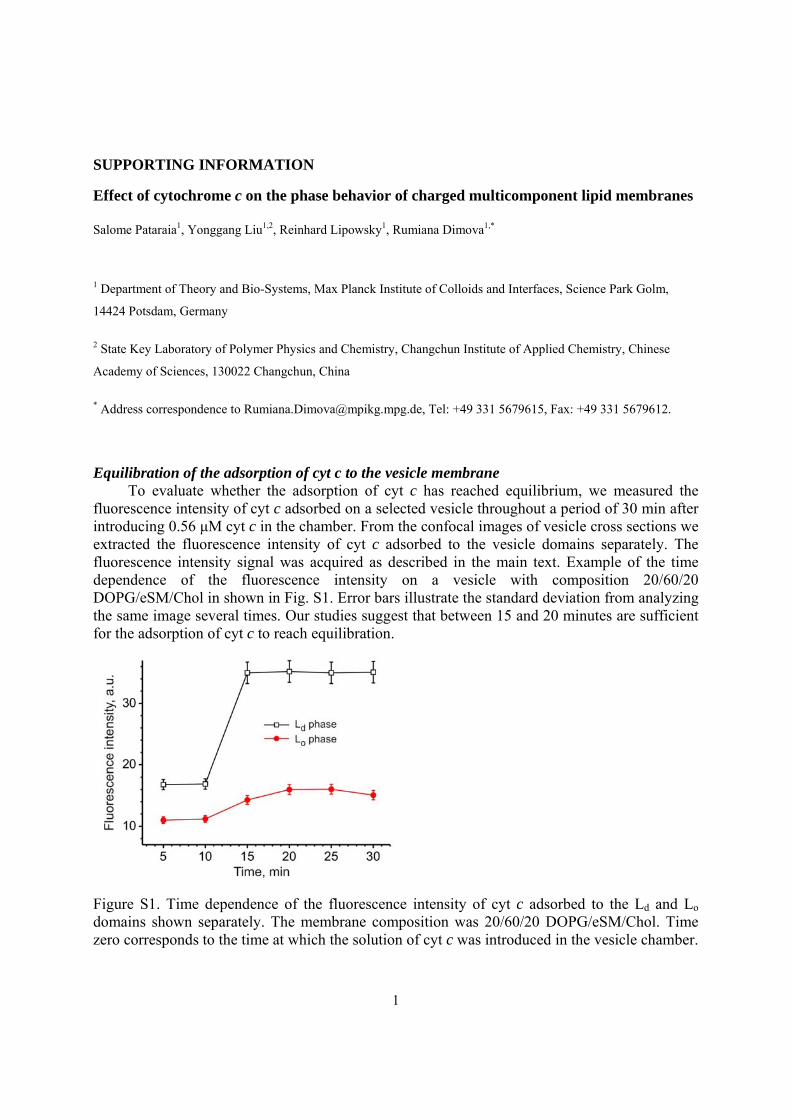
Equilibration of the adsorption of cyt c to the vesicle membrane To evaluate whether the adsorption of cyt c has reached equilibrium, we measured the
fluorescence intensity of cyt c adsorbed on a selected vesicle throughout a period of 30 min after introducing 0.56 μM cyt c in the chamber. From the confocal images of vesicle cross sections we extracted the fluorescence intensity of cyt c adsorbed to the vesicle domains separately. The fluorescence intensity signal was acquired as described in the main text. Example of the time dependence of the fluorescence intensity on a vesicle with composition 20/60/20 DOPG/eSM/Chol in shown in Fig. S1. Error bars illustrate the standard deviation from analyzing the same image several times. Our studies suggest that between 15 and 20 minutes are sufficient for the adsorption of cyt c to reach equilibration.
Figure S1. Time dependence of the fluorescence intensity of cyt c adsorbed to the Ld and Lo domains shown separately. The membrane composition was 20/60/20 DOPG/eSM/Chol. Time zero corresponds to the time at which the solution of cyt c was introduced in the vesicle chamber.

2
Bleaching of the used fluorescence dyes We tested whether significant bleaching of the fluorescent label of cyt c by laser exposure
occurs during the time required for capturing of consecutive images (altogether not longer than 3 minutes). The fluorescence intensity signal was acquired as described in the main text. Example of the fluorescence intensity measured on consecutive snapshots on a vesicle with composition 20/60/20 DOPG/eSM/Chol is shown in Fig. S2. Both the signal from the fluorescently labeled cyt c (Alexa Fluor 633) and one of the lipid dyes (DSPE-PEG200-CF) are shown. As demonstrated in Fig. S2, during the time necessary for image capturing, the signal from the fluorescently labeled cyt c does not change significantly. Thus, the intensity values measured for the estimate of the protein partitioning in the two phases are not influenced by bleaching of the dye. In contrast, the lipid dye bleaches significantly. However, this is not important in our case, as for the calculation of the partitioning ratios we use the fluorescence intensity of the labeled cyt c only.
Figure S2. Bleaching of the fluorescent dyes during laser source exposure shown by intensity data for the labeled cyt c and lipids. The data was measured separately for the two phases. Error bars illustrate the standard deviation from analyzing the same image several times.
UV/VIS spectroscopy measurements and protein fluorescence To resolve the preferential adsorption of cyt c, we considered using the fluorescence of the protein. Under the conditions used in this work, we detected weak fluorescence signal from cyt c in the wavelength region between 540 nm to 620 nm. However, because of the weak emission and the necessity to work at relatively high concentration of the protein (in the millimolar range), as well as the overlap of the spectrum with that of the lipid dye DSPE-PEG2000-CF, using the fluorescence of cyt c turned inefficient for quantitative characterization of the protein adsorption.
We measured the absorption spectra of the unlabeled yeast cyt c under the conditions used in this work in the wavelength range of 300 – 600 nm. On the basis of the spectra we built a calibration curve, see Fig. S3, which was used subsequently to estimate the concentration of the protein after performing the procedures for fluorescent labeling. The absorbance spectra were measured at concentrations between 1 and 5 μM in a 2 mM HEPES/1 mM EDTA buffer (pH 7.5). The absorption spectra were recorded. The molar extinction coefficient measured at 410 nm was found to be ε410 = 74000 M-1cm-1.

3
Figure S3. Absorption of yeast cyt c at 410 nm in 2 mM HEPES/1mM EDTA (pH 7.5) buffer at various concentrations between 1 and 5 μM. The solid line is a linear fit. No adsorption of cyt c on DOPC/eSM/Chol membranes
Figure S4. Evidence for no adsorption of cyt c to the membrane of DOPC/eSM/Chol 30/50/20 vesicles (A, B) compared to DOPG/eSM/Chol 30/50/20 vesicles (C, D): phase contrast micrographs (A, C) and confocal microscopy cross sections (B, D). Both vesicle types were incubated in 0.56 μM cyt c in buffer and the images were acquired at identical settings of the microscope. No protein fluorescence (red) is detected on the DOPC/eSM/Chol vesicle membrane (B). Furthermore, while the protein permeates the DOPG/eSM/Chol membranes, it does not
4
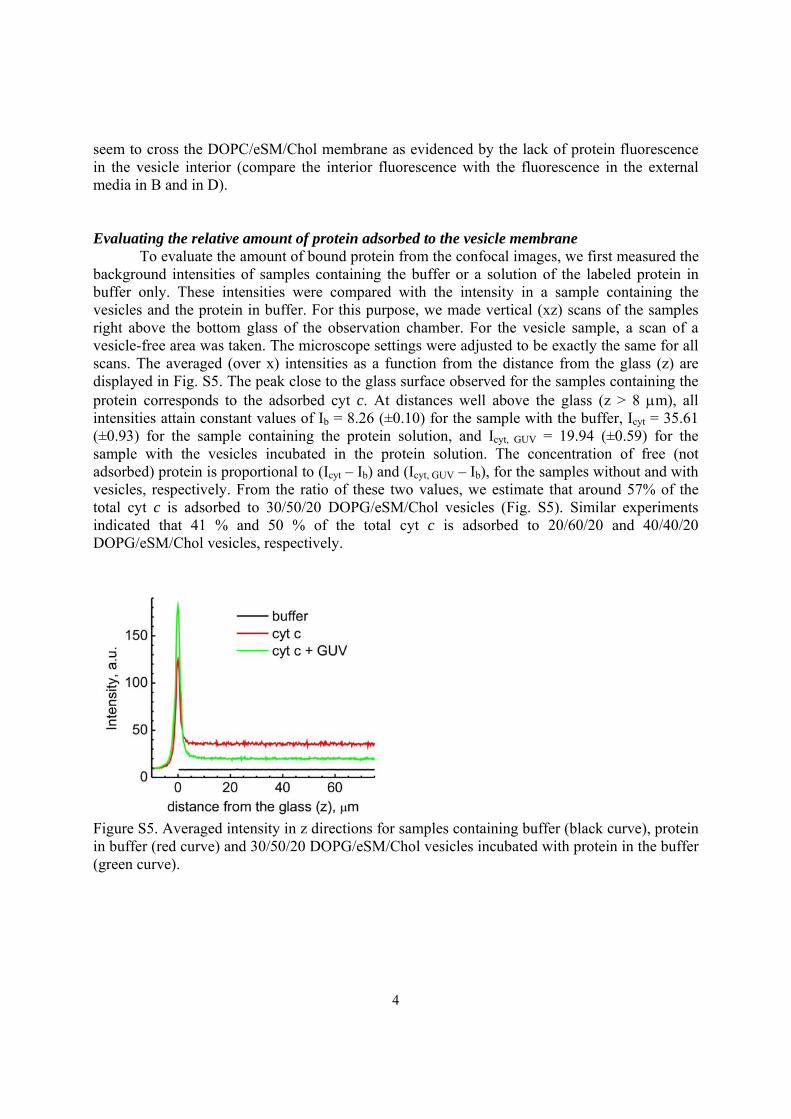
seem to cross the DOPC/eSM/Chol membrane as evidenced by the lack of protein fluorescence in the vesicle interior (compare the interior fluorescence with the fluorescence in the external media in B and in D). Evaluating the relative amount of protein adsorbed to the vesicle membrane To evaluate the amount of bound protein from the confocal images, we first measured the background intensities of samples containing the buffer or a solution of the labeled protein in buffer only. These intensities were compared with the intensity in a sample containing the vesicles and the protein in buffer. For this purpose, we made vertical (xz) scans of the samples right above the bottom glass of the observation chamber. For the vesicle sample, a scan of a vesicle-free area was taken. The microscope settings were adjusted to be exactly the same for all scans. The averaged (over x) intensities as a function from the distance from the glass (z) are displayed in Fig. S5. The peak close to the glass surface observed for the samples containing the protein corresponds to the adsorbed cyt c. At distances well above the glass (z > 8 μm), all intensities attain constant values of Ib = 8.26 (±0.10) for the sample with the buffer, Icyt = 35.61 (±0.93) for the sample containing the protein solution, and Icyt, GUV = 19.94 (±0.59) for the sample with the vesicles incubated in the protein solution. The concentration of free (not adsorbed) protein is proportional to (Icyt – Ib) and (Icyt, GUV – Ib), for the samples without and with vesicles, respectively. From the ratio of these two values, we estimate that around 57% of the total cyt c is adsorbed to 30/50/20 DOPG/eSM/Chol vesicles (Fig. S5). Similar experiments indicated that 41 % and 50 % of the total cyt c is adsorbed to 20/60/20 and 40/40/20 DOPG/eSM/Chol vesicles, respectively.
Figure S5. Averaged intensity in z directions for samples containing buffer (black curve), protein in buffer (red curve) and 30/50/20 DOPG/eSM/Chol vesicles incubated with protein in the buffer (green curve).