fatigue strength of fibrillated polypropylene fiber...
TRANSCRIPT
36 TRANSPORTA TION RESEARCH RECORD 1226
Fatigue Strength of Fibrillated Polypropylene Fiber Reinforced Concretes
M. NAGABHUSHANAM, V. RAMAKRISHNAN, AND GARY VONDRAN
This paper presents the results of an experimental investigation to determine the flexural fatigue strength of concrete reinforced with three different concentrations of fibrillated polypropylene fibers. The properties and the performance of fresh and hardened concretes with and without fibers are compared. The test program included the evaluation of I) Flexural fatigue strength and endurance limit; 2) hardened concrete properties, such as compressive strength, static modulus, pulse velocity, modulus of rupture, and toughness indexes; and 3) fresh concrete properties, including slump, vebe time, inverted cone time, air content, and concrete temperature. The test results indicated an appreciable increase in postcrack energy absorption capacity and ductility due to the addition of fibers. When compared with corresponding plain concrete, the flexural fatigue strength and the endurance limit (for 2 million cycles) significantly increased. The static flexural strength increased after being subjected to fatigue loading.
Concrete is one of the most important and widely used construction materials in the world. It has many advantages, including relatively low cost, general availability, and usage of local materials . It is also among the most variable with regard to material properties. The low tensile strength and brittle failure tendency are, however, two major design problems. In an attempt to increase concrete ductility and energy absorption, a relatively new technology of fiber reinforced concrete (FRC) has been introduced. (1-4). In FRC, millions of fibers are introduced into the concrete as it is mixed. These fibers are dispersed randomly throughout the concrete and thus improve concrete properties in all directions. Because of their discontinuity and random distribution, they are not intended to replace the function of conventional reinforcement . The random and uniform distribution of fibers throughout the concrete mass also helps to eliminate temperature and shrinkage cracks. Other advantages include the increase in pre-crack tensile strength, fatigue strength, impact strength, and shock resistance.
Fiber has been used in shotcrete for rockfill stabilization and tunnel and canal linings. It is also rapidly gaining acceptance as a suitable material for repair and rehabilitation of concrete structures. In many applications, particularly in pavement and bridge deck overlays, flexural fatigue strength and endurance limit are considered important design parameters, mainly because these structures are subjected to the fatigue load cycles (1,4,5) .
M. Nagabhushanam and V. Ramakrishnan, South Dakota School of Mines & Technology, Rapid City, S.D. 57701. Gary Vondran, Fibermesh Company, 1550 F Dell Ave, Campbell, Calif. 95008.
Several fiber materials in various sizes and shapes have been developed for use in FRC. Fibrillated polypropylene has been one of the most successful due to some unique properties that make it suitable for reinforcement in concrete. The fibers have very high tensile strength. Further, their high elongation enhances energy absorption and leads to improved ductility, higher fatigue strength, and higher impact resistance of concrete (1 ,5) .
OBJECTIVES
The primary objectives of this inverstigation were to determine the behavior of fibrillated polypropylene FRC when subjected to nonreversed fatigue bending and to determine the effect of fiber concentration. Other objectives of this investigation were to
• Determine the behavior of fibrillated polypropylene fibers during and after mixing;
• Determine the properties of the fresh concrete reinforced with three different concentrations of fibrillated polypropylene fibers; and
• Determine the characteristics of hardened concrete, such as compressive strength, static modulus, unit weight, pulse velocity, modulus of rupture, and toughness indexes for concretes with and without fibers but otherwise identical mixes.
MATERIALS, MIXES, AND TEST SPECIMENS
Materials
Type I portland cement satisfying the requirements of ASTM C150 was used for all mixes. The fine aggregate used was natural sand that had a saturated surface dry specific gravity of 2.63 and an absorption of 1.64 percent. The coarse aggregate used was crushed limestone with a maximum size of % in., a saturated surface dry specific gravity of 2.68 and an absorption of 0.54 percent. Both coarse and fine aggregates satisfied grading requirements of ASTM C33 .
Tap water from the Rapid City municipal water supply system was used. The air-entraining admixture was a neutralized vinsol resin , satisfying ASTM C260, and the superplasticizers used conformed with Type F ASTM C494 specifications .
The fibrillated polypropylene fibers used in this study were commercially available under the brand name Fibermesh.
Nagabhushanam et a/.
During mixing, the small bundles in the mesh separate into individual multifilament fibers. These fibers are rectangular in cross section with fibril links to other main fibers. This geometry , with branching of fibers into spurs or fibrils, enhances bonding and provides excellent mechanical anchoring. Other polypropylene and synthetic fibers may not offer these bonding characteristics. Thus, the results are only applicable to the specific fiber tested. For this investigation , a %-in. fiber was used, having a specific gravity of 0. 91, a modulus of elasticity of 500 ksi , and a yield tensile strength of 80 to 100 ksi.
Mixes
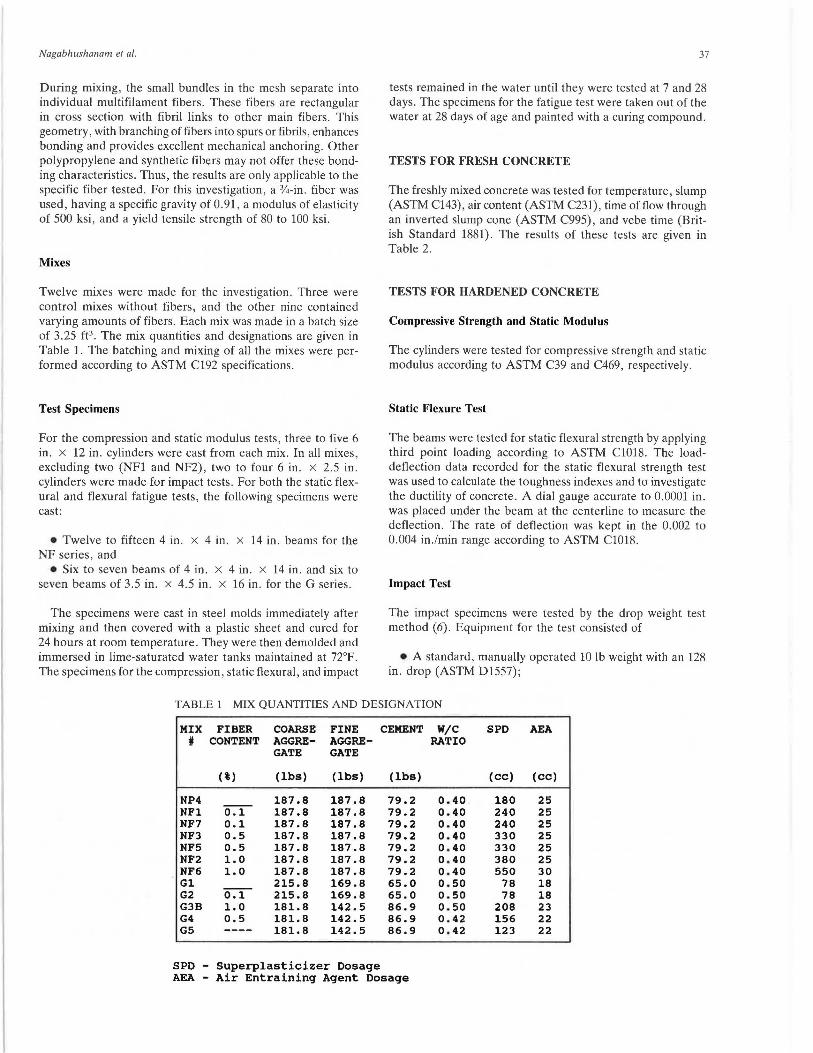
Twelve mixes were made for the investigation. Three were control mixes without fibers, and the other nine contained varying amounts of fibers. Each mix was made in a batch size of 3.25 ft3 • The mix quantities and designations are given in Table 1. The batching and mixing of all the mixes were performed according to ASTM C192 specifications.
Test Specimens
For the compression and static modulus tests, three to five 6 in. x 12 in . cylinders were cast from each mix. In all mixes, excluding two (NFl and NF2), two to four 6 in. x 2.5 in. cylinders were made for impact tests. For both the static flexural and flexural fatigue tests, the following specimens were cast:
• Twelve to fifteen 4 in. x 4 in . x 14 in. beams for the NF series , and
• Six to seven beams of 4 in . x 4 in. x 14 in . and six to seven beams of 3.5 in. x 4.5 in. x 16 in. for the G series .
The specimens were cast in steel molds immediately after mixing and then covered with a plastic sheet and cured for 24 hours at room temperature. They were then demolded and immersed in lime-saturated water tanks maintained at 72°F. The specimens for the compression, static flexural, and impact
37
tests remained in the water until they were tested at 7 and 28 days . The specimens for the fatigue test were taken out of the water at 28 days of age and painted with a curing compound.
TESTS FOR FRESH CONCRETE
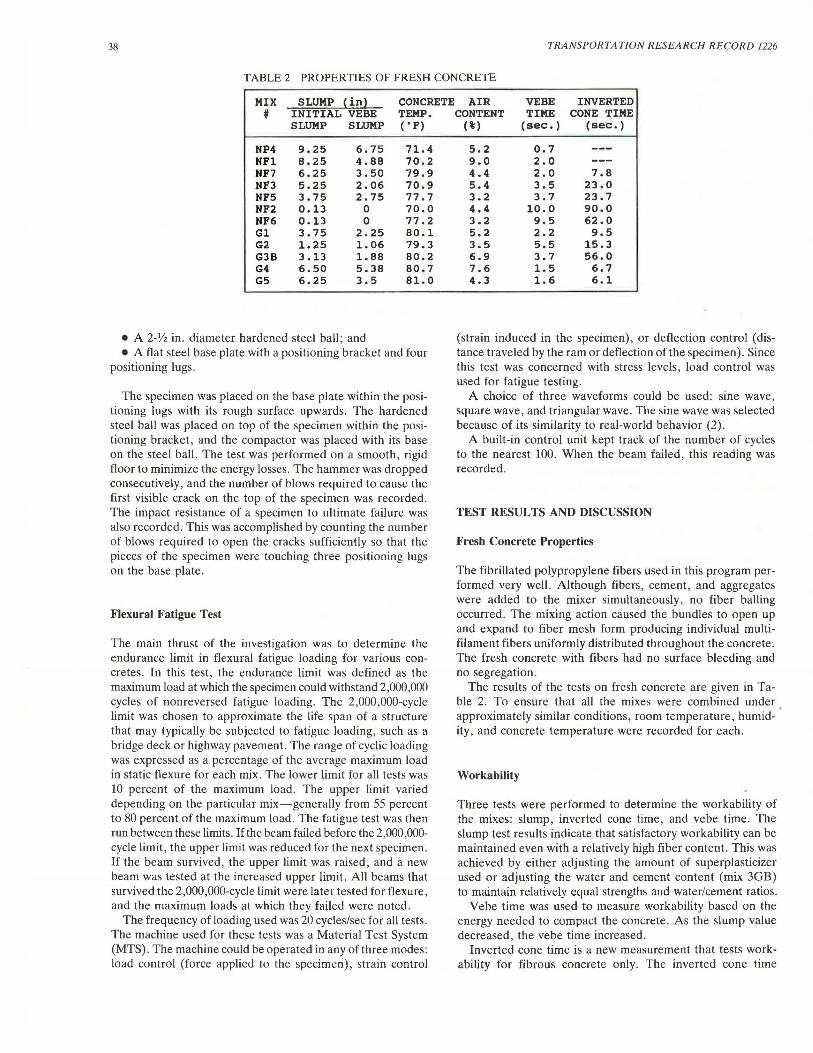
The freshly mixed concrete was tested for temperature, slump (ASTM C143), air content (ASTM C231), time of flow through an inverted slump cone (ASTM C995), and vebe time (British Standard 1881). The results of these tests are given in Table 2.
TESTS FOR HARDENED CONCRETE
Compressive Strength and Static Modulus
The cylinders were tested for compressive strength and static modulus according to ASTM C39 and C469, respectively .
Static Flexure Test
The beams were tested for static flexural strength by applying third point loading according to ASTM Cl018. The loaddeflection data recorded for the static flexural strength test was used to calculate the toughness indexes and to investigate the ductility of concrete. A dial gauge accurate to 0.0001 in. was placed under the beam at the centerline to measure the deflection. The rate of deflection was kept in the 0.002 to 0.004 in ./min range according to ASTM Cl018.
Impact Test
The impact specimens were iested by the drop weight test method (6). Equipment for the test consisted of
• A standard, manually operated 10 lb weight with an 128 in. drop (ASTM D1557);
TABLE 1 MIX QUANTITIES AND DESIGNATION
MIX FIBER COARSE FINE CEMENT # CONTENT AGGRE- AGGRE-
GATE GATE
(%) (lbs) (lbs) (lbs)
NP4 187.8 187.8 79.2 NFl ~ 187.8 187.8 79.2 NF7 0.1 187.8 187.8 79.2 NF3 0.5 187.8 187.8 79.2 NFS 0.5 187.8 187.8 79.2 NF2 1.0 187.8 187.8 79.2 NF6 1.0 187.8 187.8 79.2 Gl 215.8 169.8 65.0 G2 ~ 21S.8 169.8 6S . O G3B 1.0 181.8 142.5 86.9 G4 0.5 181.8 142.5 86.9 GS ---- 181. 8 142.5 86.9
SPD - Superplasticizer Dosage AEA - Air Entraining Agent Dosage
W/C SPD AEA RATIO
(cc) (cc)
0.40 180 25 0.40 240 25 0 . 40 240 25 0.40 330 25 0.40 330 25 0.40 380 25 0.40 550 30 0.50 78 18 a.so 78 18 0 . 50 208 23 0.42 1S6 22 0.42 123 22
38 TRANSPORTATION RESEARCH RECORD 1226
TABLE 2 PROPERTIES OF FRESH CONCRETE
MIX SLUMP (in} CONCRETE # INITIAL VEBE TEMP.
SLUMP SLUMP ( • F)
NP4 9.25 6.75 71.4 NFl 8 . 25 4.88 70.2 NF7 6.25 3.50 79.9 NF3 5 . 25 2.06 70.9 NF5 3.75 2.75 77.7 NF2 0.13 0 70.0 NF6 0.13 0 77.2 Gl 3.75 2.25 80.1 G2 1. 25 1.06 79.3 G3B 3.13 1.88 80.2 G4 6.50 5.38 80 . 7 G5 6.25 3.5 81. 0
• A 2- 1/2 in. diameter hardened steel ball; and
• A flat steel base plate with a positioning bracket and four positioning lugs.
The specimen was placed on the base plate within the positioning lugs with its rough surface upwards. The hardened steel ball was placed on top of the specimen within the positioning bracket, and the compactor was placed with its base on the steel ball . The test was performed on a smooth, rigid floor to minimize the energy losses. The hammer was dropped consecutively, and the number of blows required to cause the first visible crack on the top of the specimen was recorded. The impact resistance of a specimen to ultimate failure was also recorded. This was accomplished by counting the number of blows required to open the cracks sufficiently so that the pieces of the specimen were touching three positioning lugs on the base plate.
Flexural Fatigue Test
The main thrust of the investigation was to determine the endurance limit in flexural fatigue loading for various concretes. In this test, the endurance limit was defined as the maximum load at which the specimen could withstand 2,000,000 cycles of nonreversed fatigue loading. The 2,000,000-cycle limit was chosen to approximate the life span of a structure that may typically be subjected to fatigue loading, such as a bridge deck or highway pavement . The range of cyclic loading was expressed as a percentage of the average maximum load in static flexure for each mix. The lower limit for all tests was 10 percent of the maximum load. The upper limit varied depending on the particular mix-generally from 55 percent to 80 percent of the maximum load. The fatigue test was then run between these limits. If the beam failed before the 2,000,000-cycle limit, the upper limit was reduced for the next specimen. If the beam survived, the upper limit was raised, and a new beam was tested at the increased upper limit. All beams that survived the 2,000,000-cycle limit were later tested for flexure, and the maximum loads at which they failed were noted.
The frequency of loading used was 20 cycles/sec for all tests. The machine used for these tests was a Material Test System (MTS). The machine could be operated in any of three modes: load control (force applied to the specimen), strain control
AIR VEBE INVERTED CONTENT TIME CONE TIME
(%) (sec.) (sec.)
5.2 0.7 ---9.0 2.0 ---4.4 2.0 7.8 5.4 3.5 23.0 3.2 3.7 23.7 4.4 10.0 90.0 3.2 9.5 62.0 5.2 2.2 9.5 3.5 5.5 15.3 6.9 3.7 56.0 7.6 1.5 6.7 4.3 1. 6 6.1
(strain induced in the specimen), or deflection control (distance traveled by the ram or deflection ofthe specimen). Since this test was concerned with stress levels, load control was used for fatigue testing.
A choice of three waveforms could be used: sine wave, square wave, and triangular wave. The sine wave was selected because of its similarity to real-world behavior (2).
A built-in control unit kept track of the number of cycles to the nearest 100. When the beam failed , this reading was recorded.
TEST RESULTS AND DISCUSSION
Fresh Concrete Properties
The fibrillated polypropylene fibers used in this program performed very well. Although fibers, cement, and aggregates were added to the mixer simultaneously, no fiber balling occurred. The mixing action caused the bundles to open up and expand to fiber mesh form producing individual multifilament fibers uniformly distributed throughout the concrete. The fresh concrete with fibers had no surface bleeding and no segregation.
The results of the tests on fresh concrete are given in Table 2. To ensure that all the mixes were combined under approximately similar conditions, room temperature, humidity, and concrete temperature were recorded for each.
WorkabiJity
Three tests were performed to determine the workability of the mixes: slump, inverted cone time, and vebe time. The slump test results indicate that satisfactory workability can be maintained even with a relatively high fiber content. This was achieved by either adjusting the amount of superplasticizer used or adjusting the water and cement content (mix 3GB) to maintain relatively equal strengths and water/cement ratios.
Vebe time was used to measure workability based on the energy needed to compact the concrete. As the slump value decreased, the vebe time increased .
Inverted cone time is a new measurement that tests workability for fibrous concrete only. The inverted cone time
Nagabhushanam et al.
increased with a decrease in slump . Further, as vebe time increased, inverted cone time rose as well.
Finishability
A table vibrator was used to form a layer of mortar on the surface of the member; this made finishing easier. In general , the slump, air content, and concrete temperatures all varied slightly within the allowable variation normally obtained in concrete research . The variations in the fresh concrete properties did not significantly affect the hardened concrete properties.
Fiber Factor
Two higher quantities beyond the fiber manufacturer's recommended amount of 1.5 lb/yd3 (0.1 percent by volume) were selected: 7.5 lb/yd3 (0.5 percent by volume) and 15.0 lb/yd3
(1.0 percent by volume) . For the NF series (mixes NFl to NF7), the water/cement ratio and the mix proportions were maintained at a constant. Fibers in different quantities were added without considering the fiber factor. A higher volume of fibers reduced the slump because of the added surface area of the fibers. The compressive strength and the modulus of rupture values also decreased. Obviously, the same mix proportions could not be used for higher volumes of fibers; fiber factor adjustments are necessary to balance proportions for suitable workability, placeability, appearance, and strength. Optimum mixture proportions should be obtained by trial mixes when using higher fiber volumes.
HARDENED CONCRETE PROPERTIES
Compressive Strength
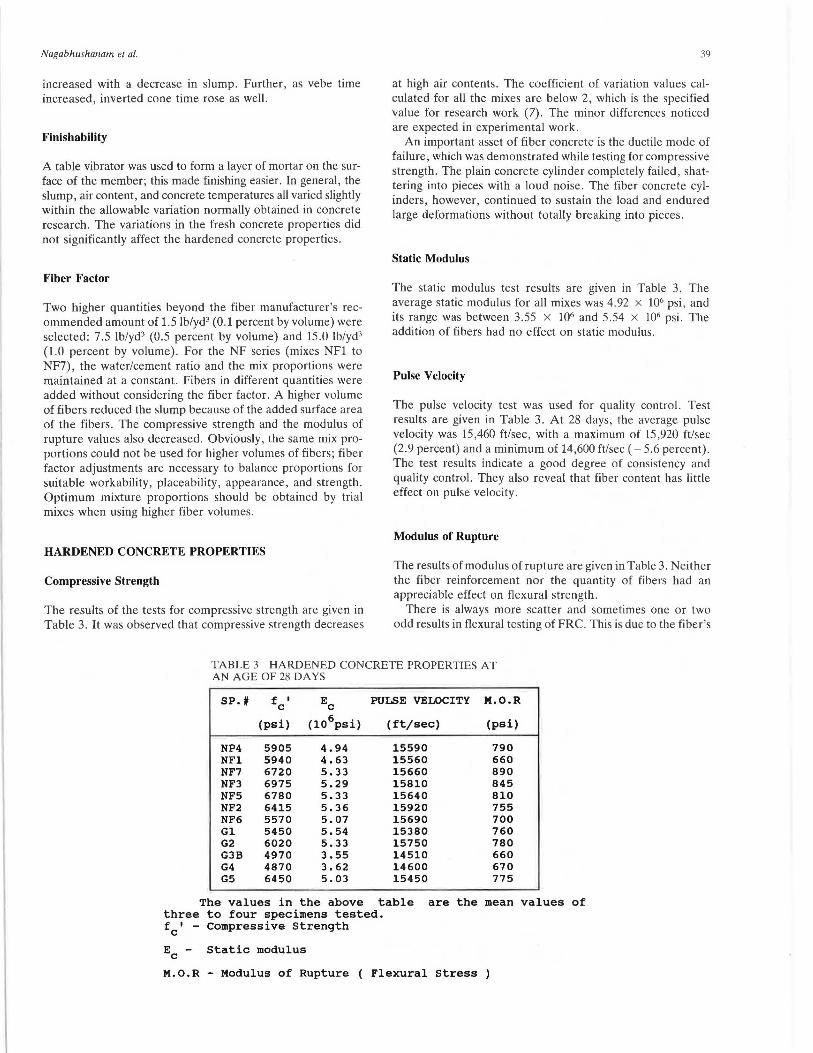
The results of the tests for compressive strength are given in Table 3. It was observed that compressive strength decreases
39
at high air contents . The coefficient of variation values calculated for all the mixes are below 2, which is the specified value for research work (7). The minor differences noticed are expected in experimental work .
An important asset of fiber concrete is the ductile mode of failure, which was demonstrated while testing for compressive strength. The plain concrete cylinder completely failed , shattering into pieces with a loud noise . The fiber concrete cylinders, however, continued to sustain the load and endured large deformations without totally breaking into pieces.
Static Modulus
The static modulus test results are given in Table 3. The average static modulus for all mixes was 4. 92 x 106 psi, and its range was between 3.55 x 10⁶ and 5.54 x 10⁶ psi. The addition of fibers had no effect on static modulus.
Pulse Velocity
The pulse velocity test was used for quality control. Test results are given in Table 3. At 28 days, the average pulse velocity was 15,460 ft/sec, with a maximum of 15,920 ft/sec (2 .9 percent) and a minimum of 14,600 ft/sec (-5.6 percent) . The test results indicate a good degree of consistency and quality control. They also reveal that fiber content has little effect on pulse velocity.
Modulus of Rupture
The results of modulus of rupture are given in Table 3. Neither the fiber reinforcement nor the quantity of fibers had an appreciable effect on fl exural strength.
There is always more scatter and sometimes one or two odd results in flexural testing of FRC. This is due to the fiber 's
TABLE 3 HARDENED CONCRETE PROPERTIES AT AN AGE OF 28 DAYS
SP.# f I c EC PULSE VELOCIT'i M.O.R
(psi) (10 6psi) (ft/sec) (psi)
NP4 S90S 4.94 1SS90 790 NFl S940 4.63 1SS60 660 NF7 6720 S.33 1S660 890 NF3 697S S.29 1S810 84S NFS 6780 S.33 1S640 810 NF2 641S S.36 1S920 7SS NF6 SS70 S.07 1S690 700 Gl S4SO S.S4 1S380 760 G2 6020 S.33 1S7SO 780 G3B 4970 3.SS 14S10 660 G4 4870 3.62 14600 670 GS 64SO S.03 1S4SO 77S
The values in the above table are the mean values of three to four specimens tested. fc' - Compressive Strength
Ec Static modulus
M.O.R - Modulus of Rupture ( Flexural stress )
40
random orientation and possible nonuniform distribution of aggregate in small specimens, particularly in the tension zone.
Toughness Index
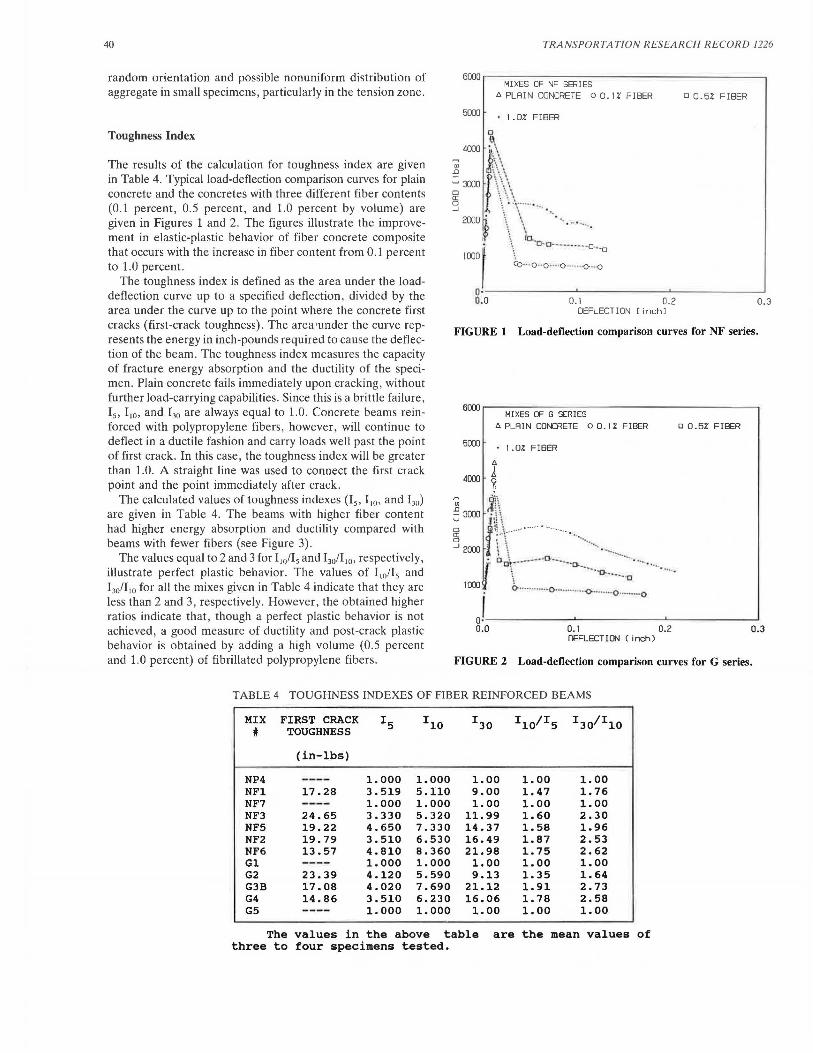
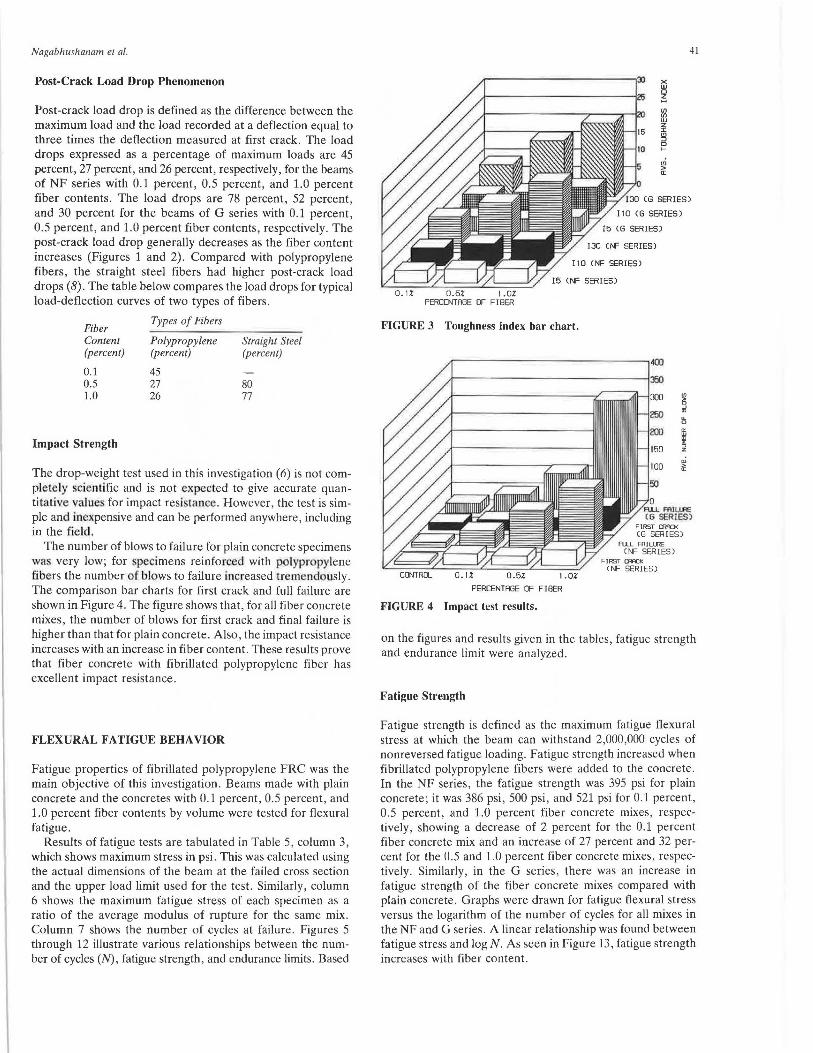
The results of the calculation for toughness index are given in Table 4. Typical load-deflection comparison curves for plain concrete and the concretes with three different fiber contents (0.1 percent, 0.5 percent, and 1.0 percent by volume) are given in Figures 1 and 2. The figures illustrate the improvement in elastic-plastic behavior of fiber concrete composite that occurs with the increase in fiber content from 0.1 percent to 1.0 percent .
The toughness index is defined as the area under the loaddeflection curve up to a specified deflection , divided by the area under the curve up to the point where the concrete first cracks (first-crack toughness). The area •under the curve represents the energy in inch-pounds required to cause the deflection of the beam. The toughness index measures the capacity of fracture energy absorption and the ductility of the specimen. Plain concrete fails immediately upon cracking, without further load-carrying capabilities. Since this is a brittle failure, 15 , 110 , and 130 are always equal to 1.0. Concrete beams reinforced with polypropylene fibers, however, will continue to deflect in a ductile fashion and carry loads well past the point of first crack. In this case , the toughness index will be greater th;in 1 .0. A straight line was used to connect the first crack point and the point immediately afler crack.
The calculated values of toughness indexes (15 , I 10 , and 130)
are given in Table 4. The beams with higher fiber content had higher energy absorption and ductility compared with beams with fewer fibers (see Figure 3).
The values equal to 2 and 3for110/15 and130 /1 10 , respectively, illustrate perfect plastic behavior. The values of 110/15 and 130/110 for all the mixes given in Table 4 indicate that they are less than 2 and 3, respectively . However, the obtained higher ratios indicate that, though a perfect plastic behavior is not achieved, a good measure of ductility and post-crack plastic behavior is obtained by adding a high volume (0 .5 percent and 1.0 percent) of fibrillated polypropylene fibers.
TRANSPORTATION RESEARCH RECORD 1226
MIXES OF NF SERIES 6 PLAIN CONCRETE o O.IZ FIBER
5000
a I;\
· I .OT. FIBER
4000 ~ \ ~ ~· \
~ f\\\ ~ 3000 \'\\ er: ; ; '• '3 \ · y ...... ·.
2000 • \ \ . \ \ ········· :, fo.. \ D·o---- ~· - -- -o ·-o : CO·· · O··O···· O····· ··o .. o
0.1 0.2 DEFLECTION Cinch]
o 0.5Z FIBER
0.3
FIGURE 1 Load-deflection comparison curves for NF series.
6000 .---~~~~~~~~~~~~~~~~~~~-,
MIXES OF G SERIES 6 PLAIN CONCRETE o 0. 1% FIBER
5000 I .OZ FIBER 6
4000 l ?,
~ 91\ ~ 3000 ~\\
~ 2000 ll\····•""' . -........ ·--······-·---·-.... . oor-----Q.· -- ~o... .. _ .
1000
\. "'(]. • ._ __ 'Cl
D 0.5Z FIBER
. .... . O·····- ··· ··o·······-··<>········O··-·····o
) _ __. _ __. __ 0.0 0.1 0.2 0.3
DEFLECTION Cinch)
FIGURE 2 Load-deflection comparison curves for G series.
TABLE 4 TOUGHNESS INDEXES OF FIBER REINFORCED BEAMS
MIX FIRST CRACK I5 IlO I30 IlO/I5 I3011 10 # TOUGHNESS
(in-lbs)
NP4 ---- 1.000 1.000 l.00 l. 00 l.00 NFl 17.28 3.519 5.110 9.00 l. 47 l. 76 NF7 ---- l.000 l. 000 l. 00 l.00 l.00 NF3 24.65 3.330 5.320 11.99 l.60 2.30 NF5 19.22 4.650 7.330 14.37 l.58 1.96 NF2 19.79 3.510 6.530 16.49 1.87 2.53 NF6 13.57 4.810 8.360 21.98 1. 75 2.62 Gl ---- l.000 1.000 l. 00 1.00 1.00 G2 23.39 4.120 5.590 9.13 1. 35 1. 64 G3B 17.08 4.020 7.690 21.12 1.91 2.73 G4 14.86 3.510 6.230 16.06 1. 78 2.58 G5 ---- l.000 l.000 l. 00 l. 00 1.00
The values in the above table are the mean values of three to four specimens tested.
Nagabhushanam el al.
Post-Crack Load Drop Phenomenon
Post-crack load drop is defined as the difference between the maximum load and the load recorded at a deflection equal to three times the deflection measured at first crack. The load drops expressed as a percentage of maximum loads are 45 percent, 27 percent, and 26 percent, respectively, for the beams of NF series with 0.1 percent, 0.5 percent, and 1.0 percent fiber contents. The load drops are 78 percent, 52 percent, and 30 percent for the beams of G series with 0.1 percent, 0.5 percent, and 1.0 percent fiber contents, respectively. The post-crack load drop generally decreases as the fiber content increases (Figures 1 and 2). Compared with polypropylene fibers, the straight steel fibers had higher post-crack load drops (8). The table below compares the load drops for typical load-deflection curves of two types of fibers.
Fiber Types of Fibers
Content Polypropylene Straight Steel (percent) (percent) (percent)
0.1 45 0.5 27 80 1.0 26 77
Impact Strength
The drop-weight test used in this investigation (6) is not completely scientific and is not expected to give accurate quantitative value for impact resistance. However, the test is simple and inexpensive and can be performed anywhere, including in the field.
The number of blows to failure for plain concrete specimens wa very low; for pecimens reinforced with polypropylene fibers the number of blows to failure increased tremendously. The comparison bar charts for first crack and full failure are shown in Figure 4. The figure shows that, for all fiber concrete mixes, the number of blows for first crack and final failure is higher than that for plain concrete. Also, the impact resistance increases with an increase in fiber content. These results prove that fiber concrete with fibrillated polypropylene fiber has excellent impact resistance.
FLEXURAL FATIGUE BEHAVIOR
Fatigue properties of fibrillated polypropylene FRC was the main objective of this investigation. Beams made with plain concrete and the concretes with 0.1 percent, 0.5 percent, and 1.0 percent fiber contents by volume were tested for flexural fatigue.
Results of fatigue tests are tabulated in Table 5, column 3, which shows maximum stress in psi. This was calculated using the actual dimensions of the beam at the failed cross section and the upper load limit used for the test. Similarly, column 6 shows the maximum fatigue stress of each specimen as a ratio of the average modulus of rupture for the same mix. Column 7 shows the number of cycles at failure. Figures 5 through 12 illustrate various relationships between the number of cycles (N), fatigue strength, and endurance limits. Based
41
3:) x w 25
D
~ en en w 1: g D >-
tO > a:
I 10 <r-F SERIES>
O. IZ 0.5Z I .OZ PERCENTAGE OF FIBER
FIGURE 3 Toughness index bar chart.
PERCENTAGE OF FIBER
FIGURE 4 Impact test results.
on the figures and results given in the tables, fatigue strength and endurance limit were analyzed.
Fatigue Strength
Fatigue strength is defined as the maximum fatigue flexural stress at which the beam can withstand 2,000,000 cycles of nonreversed fatigue loading. Fatigue strength increased when fibrillated polypropylene fibers were added to the concrete. In the NF series, the fatigue strength was 395 psi for plain concrete; it was 386 psi, 500 psi, and 521 psi for 0.1 percent, 0.5 percent, and 1.0 percent fiber concrete mixes, respectively, showing a decrease of 2 percent for the 0.1 percent fiber concrete mix and an increase of 27 percent and 32 percent for the 0.5 and 1.0 percent fiber concrete mixes, respectively. Similarly, in the G series, there was an increase in fatigue strength of the fiber concrete mixes compared with plain concrete. Graphs were drawn for fatigue flexural stress versus the logarithm of the number of cycles for all mixes in the NF and G series. A linear relationship was found between fatigue stress and log N. As seen in Figure 13, fatigue strength increases with fiber content.
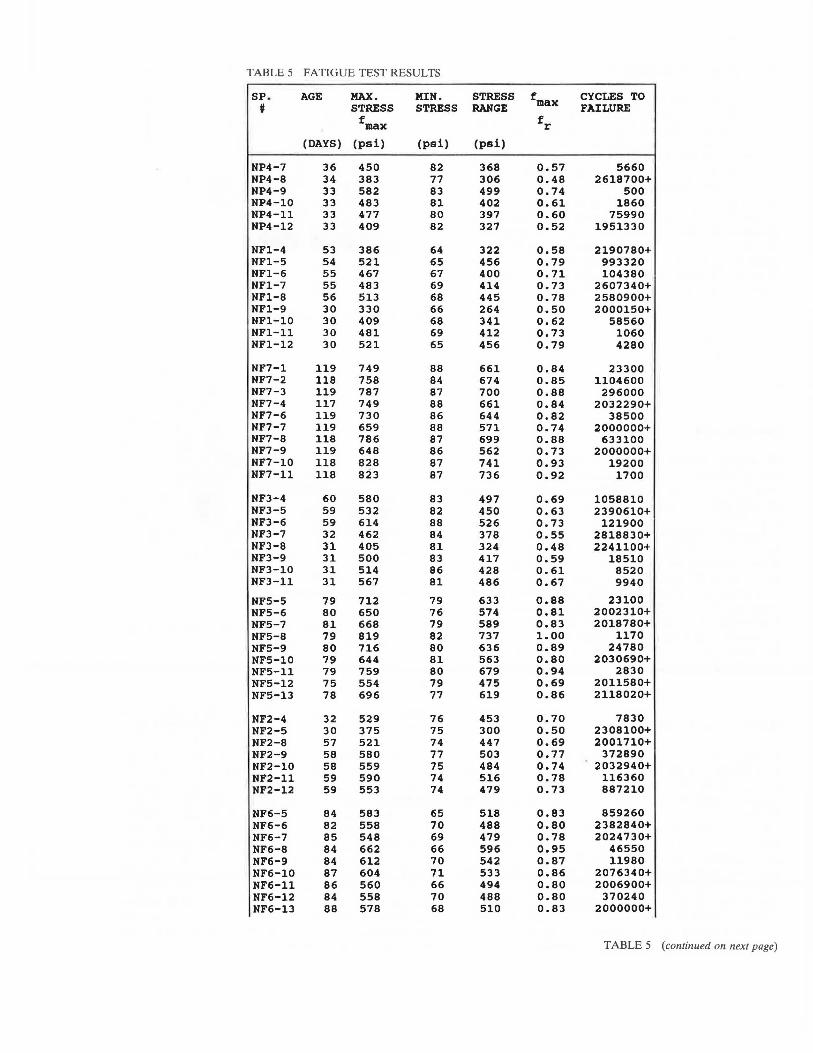
TABLE 5 FATIGUE TEST RESULTS
SP. AGE MAX. MIN. STRESS fmax CYCLES TO # STRESS STRESS RANGE FAILURE
fmax fr
(DAYS) (psi) (psi) (psi)
NP4-7 36 450 82 368 0.57 5660 NP4-8 34 383 77 306 0.48 2618700+ NP4-9 33 582 83 499 0.74 500 NP4-10 33 483 81 402 0.61 1860 NP4-11 33 477 80 397 0.60 75990 NP4-12 33 409 82 327 0.52 1951330
NFl-4 53 386 64 322 0.58 2190780+ NFl-5 54 521 65 456 0.79 993320 NFl-6 55 467 67 400 0.71 104380 NFl-7 55 483 69 414 0.73 2607340+ NFl-8 56 513 68 445 0.78 2580900+ NFl-9 30 330 66 264 0.50 2000150+ NFl-10 30 409 68 341 0.62 58560 NFl-11 30 481 69 412 0.73 1060 NFl-12 30 521 65 456 0.79 4280
NF7-1 119 749 88 661 0.84 23300 NF7-2 118 758 84 674 0.85 1104600 NF7-3 119 787 87 700 0.88 296000 NF7-4 117 749 88 661 0.84 2032290+ NF7-6 119 730 86 644 0.82 38500 NF7-7 119 659 88 571 0.74 2000000+ NF7-8 118 786 87 699 0.88 633100 NF7-9 119 648 86 562 0.73 2000000+ NF7-10 118 828 87 741 0.93 19200 NF7-11 118 823 87 736 0.92 1700
NF3-4 60 580 83 497 0.69 1058810 NF3-5 59 532 82 450 0.63 2390610+ NF3-6 59 614 88 526 0.73 121900 NF3-7 32 462 84 378 0.55 2818830+ NF3-8 31 405 81 324 0.48 2241100+ NF3-9 31 500 83 417 0.59 18510 NF3-10 31 514 86 428 0.61 8520 NF3-ll 31 567 81 486 0.67 9940
NF5-5 79 712 79 633 0.88 23100 NF5-6 80 650 76 574 0.81 2002310+ NF5-7 81 668 79 589 0.83 2018780+ NF5-8 79 819 82 737 1.00 1170 NF5-9 80 716 80 636 0.89 24780 NF5-10 79 644 81 563 0.80 2030690+ NF5-11 79 759 80 679 0.94 2830 NF5-12 75 554 79 475 0.69 2011580+ NF5-13 78 696 77 619 0.86 2118020+
NF2-4 32 529 76 453 0.70 7830 NF2-5 30 375 75 300 0.50 2308100+ NF2-8 57 521 74 447 0.69 2001710+ NF2-9 58 580 77 503 o. 77 372890 NF2-10 58 559 75 484 0.74 2032940+ NF2-11 59 590 74 516 0.78 116360 NF2-12 59 553 74 479 0.73 887210
NF6-5 84 583 65 518 0.83 859260 NF6-6 82 558 70 488 0.80 2382840+ NF6-7 85 548 69 479 0.78 2024730+ NF6-8 84 662 66 596 0.95 46550 NF6-9 84 612 70 542 0.87 11980 NF6-10 87 604 71 533 0.86 2076340+ NF6-11 86 560 66 494 0.80 2006900+ NF6-12 84 558 70 488 0.80 370240 NF6-13 88 578 68 510 0.83 2000000+
TABLE 5 (continued on next page)
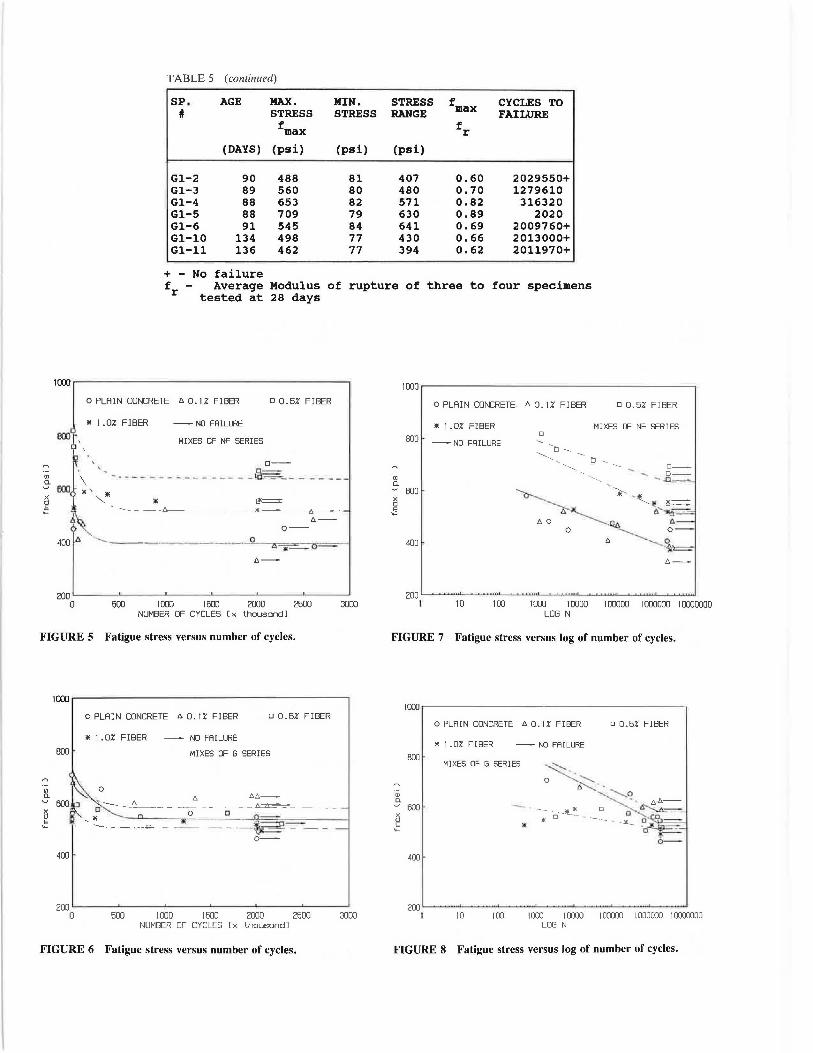
TABLE 5 (continued)
SP. AGE MAX. MIN. STRESS fmax CYCLES TO # STRESS STRESS RANGE FAILURE
fmax fr
(DAYS) (psi) (psi) (psi)
Gl-2 90 488 81 407 0.60 2029550+ Gl-3 89 560 80 480 0.70 1279610 Gl-4 88 653 82 571 0.82 316320 Gl-5 88 709 79 630 0.89 2020 Gl-6 91 545 84 641 0.69 2009760+ Gl-10 134 498 77 430 0.66 2013000+ Gl-11 136 462 77 394 0.62 2011970+
+ - No failure fr te!~:~a~~ ~~d~!~: of rupture of three to four specimens
o PLAIN CONCRETE A 0. lZ FIBER o 0.5Z FIBER
" 1 .OZ FIBER -- NO FAILURE
'· 80lt, '_ MIXES OF NF SERIES
;E~ fXXlt'>----.------ ---- -="- -- --- m If.- ' -- - - _a,..__ - - - -- _,. __ - -----fl-- -
A-o--
400 A ------_ 0 6 • &=
A--
200 ~--~---~--~---~---~--~
0 500 1000 1500 2000 2500 :xioo NUMBER OF CYCLES [x thousand]
FIGURE 5 Fatigue stress versus number of cycles.
1000 .------------------------,
O PLAIN CONCRETE A 0. lZ FIBER o 0.5Z FIBER
" 1 .OZ FIBER NO FAILURE 800 MIXES OF G SERIES
(I) 0 a. ~ 600-~ ~
A AA--
- - A a ------ - -----~-o 0
' " -- - - ----a- - -- ---~ 0-=--- -o--
400
200 ~--~---~--~---~---~--~
0 500 1000 1500 2000 2500 :xioo NUMBER OF CYCLES [x thousand]
FIGURE 6 Fatigue stress versus number of cycles.
(I) a.
800
o PLAIN CONCRETE A 0. lZ FIBER
" 1 .oz FIBER 0
-- NO FAILURE
o 0.5Z FIBER
MIXES OF NF SERIES
D--0-
- -Q._~
~ 600 it- • llE
] AO
0
400
-...__ .. --A~
A 0
0
A--
200 ......... ~~.___~.......,..__~~.u._~~"'-~~....__~~...._~~~
I 10 100 I 000 1 0000 1 00000 I 000000 10000000 LOG N
FIGURE 7 Fatigue stress versus log of number of cycles.
(I)
..9-~ E
"""
lOOJ---------------------
o PLAIN CONCRETE A O.lZ FIBER o 0.57. FIBER
" 1 .OZ FIBER - N'.l FAILURE sm
MIXES OF G SERIES
600
400
200~--......... -~ ......... -~--~--~--~--~ I 10 100 1 OOJ 1 0000 1 OOOOJ I OOOOOJ 1 0000000
LOG N
FIGURE 8 Fatigue stress versus log of number of cycles.
44
o PLAIN CONCRETE ll 0. I Z FIBER o 0.5Z FIBER
* I .OZ FIBER -- NO FAILURE
MIXES OF NF SERIES
o--o--
- - tr - - - - - - - ED~ __ 6
==--= _ :<-- ll--
---------~-
0. ------ ---- -- -- -- --.:I.~ --
0 o--
0.4 ~--~---._--~---~--~---~
0 500 1 ODO 1500 2000 2600 3100 NUMBER OF CYCLES [x thousand]
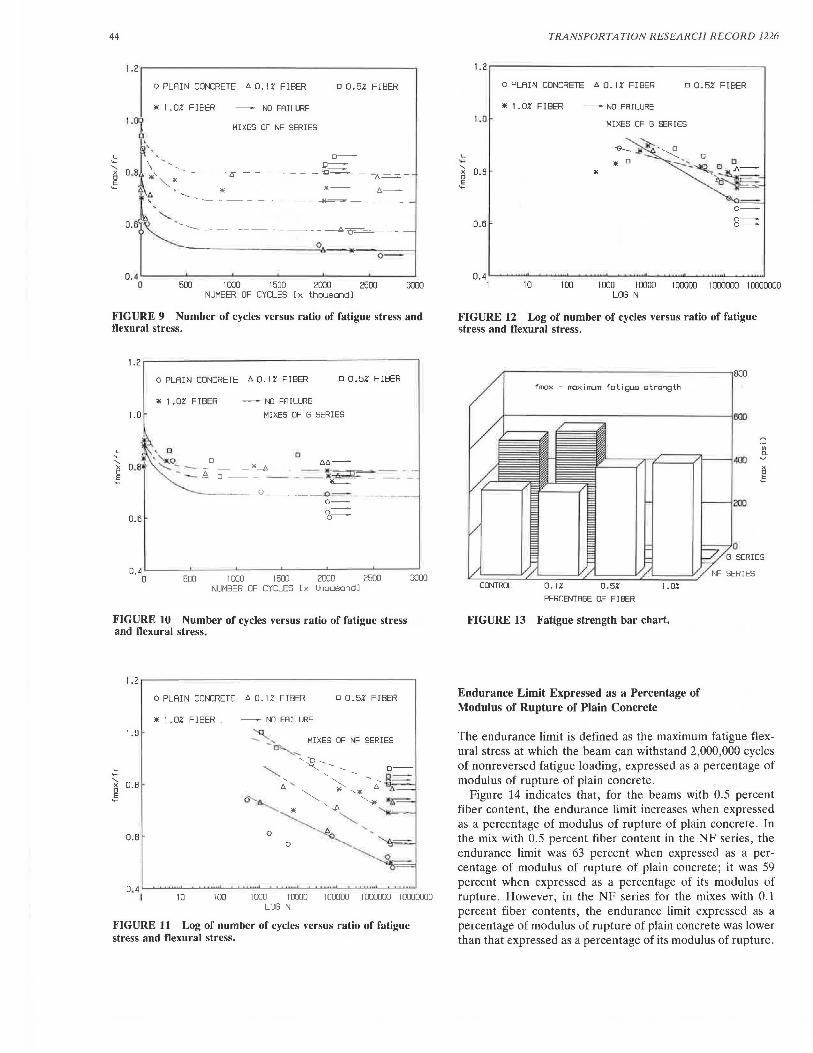
FIGURE 9 Number of cycles versus ratio of fatigue stress and flexural stress.
1.2 ~---------------------,
o PLAIN CONCRETE ll 0. IZ FIBER o 0.52' FIBER
* 1 .OZ FIBER - NO FflILURE
1.0 MIXES OF G SERIES
0 llll--
- *-f.I.__ - - ,. ~___,._ -- - -0 -- - -- - -- '"L-- - - -
----· _Q_ ------ __ -().,-. -0--
O.B i-
0.4 '------'-----'----'-----'----~---~ 0 500 I 000 1500 2000 2600 3100
NUMBER OF CYCLES [x thousondl
FIGURE 10 Number of cycles versus ratio of fatigue stress and llexural stress.
'.....
1.2 .----------------------~
o PLAIN CONCRETE ll 0. IZ FIBER o 0.5Z FIBER
* 1 .OZ FIBER _ -- NO FAILURE
1.0
' ~ O.B E .....
0.6
D . 4.____.~~.__~....._._........, ...... ._~~.._.._._........,...._~ ............ ~ I 10 100 1 000 10000 1 DODOO I 000000 10000000
LOG N
FIGURE 11 Log of number of cycles versus ratio of fatigue stress and flexural stress.
TRANSPORTATION RESEARCH RECORD 1226
o PLAIN CONCRETE ll 0. IZ FIBER o 0.52' FIBER
* 1 .OZ FIBER -- NO FAILURE
1.0 MIXES OF G SERIES
..
o--
D.B 8==
0.4'----~~"---~~.._~~..._~~...__~~....___~~""-~ ....... _, I 10 100 I 000 1 0000 1 DODOO I 000000 1 0000000
LOG N
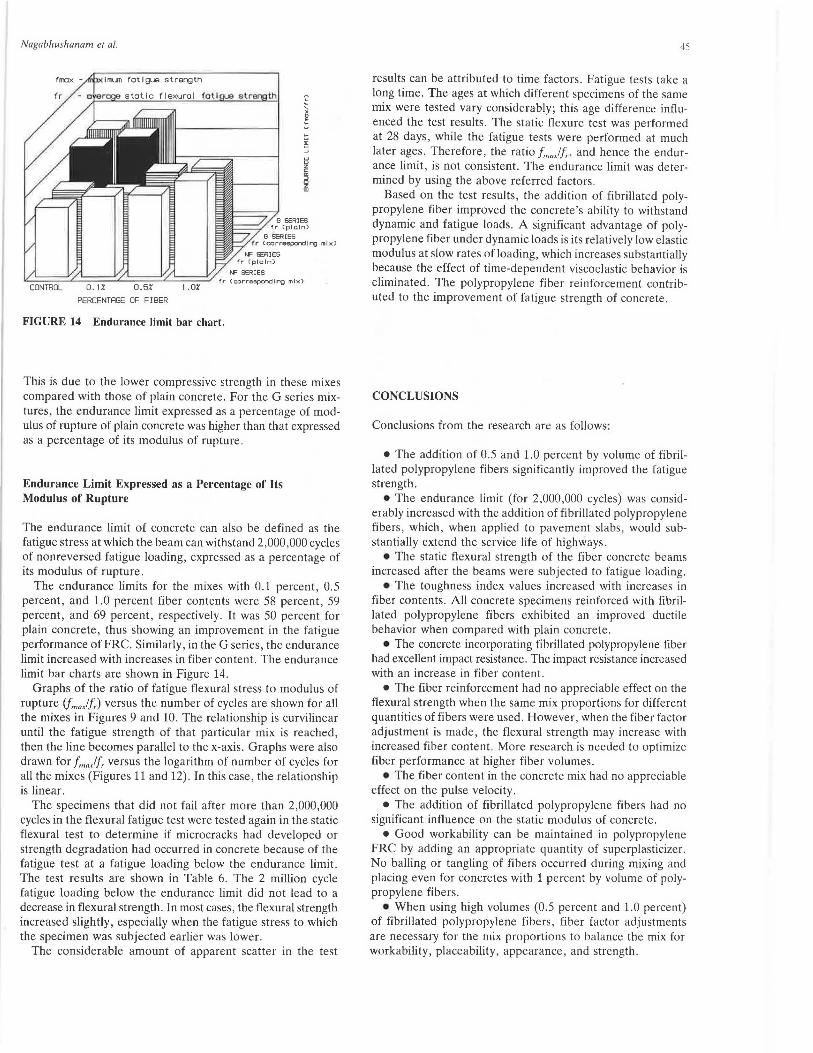
FIGURE 12 Log of number of cycles versus ratio of fatigue stress and flexural stress.
fmox - maxirrum fatigue strength
CONTROL 0.5% I .OZ
PERCENTAGE OF FI BER
FIGURE 13 Fatigue strength bar chart.
Endurance Limit Expressed as a Percentage of Modulus of Rupture of Plain Concrete
800
600
200
00
-9-11 .!:
The endurance limit is defined as the maximum fatigue flexural stress at which the beam can withstand 2,000,000 cycles of nonreversed fatigue loading, expressed as a percentage of modulus of rupture of plain concrete.
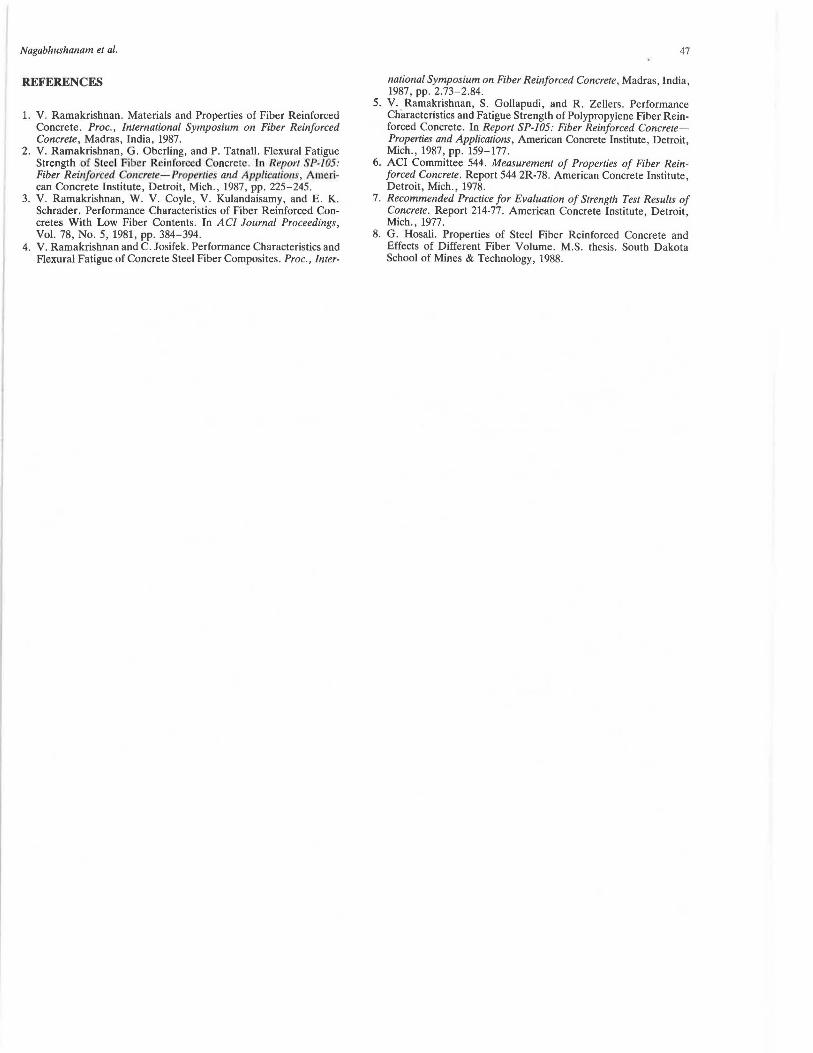
Figure 14 indicates that, for the beams with 0.5 percent fiber content, the endurance limit increases when expressed as a percentage of modulus of rupture of plain concrete. In the mix with 0.5 percent fiber content in the NF series, the endurance limit was 63 percent when expressed as a percentage of modulus of rupture of plain concrete; it was 59 percent when expressed as a percentage of its modulus of rupture. However, in the NF series for the mixes with 0.1 percent fiber contents, the endurance limit expressed as a percentage of modulus of rupture of plain concrete was lower than that expressed as a percentage of its modulus of rupture.
Nagabhushanam el al.
~===.c~==~===.c-'::::=-=:/fr <correspcndlng mi x ) CONTROL 0. I Z 0.5Z I .OZ
PERCENTAGE OF FIBER
FIGURE 14 Endurance limit bar chart.
This is due to the lower compressive strength in these mixes compared with those of plain concrete. For the G series mixtures, the endurance limit expressed as a percentage of modulus of rupture of plain concrete was higher than that expressed as a percentage of its modulus of rupture.
Endurance Limit Expressed as a Percentage of Its Modulus of Rupture
The endurance limit of concrete can also be defined as the fatigue stress at which the beam can withstand 2,000,000 cycles of nonreversed fatigue loading, expressed as a percentage of its modulus of rupture.
The endurance limits for the mixes with 0.1 percent, 0.5 percent, and 1.0 percent fiber contents were 58 percent, 59 percent, and 69 percent, respectively. It was 50 percent for plain concrete, thus showing an improvement in the fatigue performance ofFRC. Similarly, in the G series, the endurance limit increased with increases in fiber content. The endurance limit bar charts are shown in Figure 14.
Graphs of the ratio of fatigue flexural stress to modulus of rupture (fma)f,) versus the number of cycles are shown for all the mixes in Figures 9 and 10. The relationship is curvilinear until the fatigue strength of that particular mix is reached, then the line becomes parallel to the x-axis. Graphs were also drawn for fma./f, versus the logarithm of number of cycles for all the mixes (Figures 11and12) . In this case, the relationship is linear.
The specimens that did not fail after more than 2,000,000 cycles in the flexural fatigue test were tested again in the static flexural test to determine if microcracks had developed or strength degradation had occurred in concrete because of the fatigue test at a fatigue loading below the endurance limit. The test results are shown in Table 6. The 2 million cycle fatigue loading below the endurance limit did not lead to a decrease in flexural strength. In most cases, the flexural strength increased slightly, especially when the fatigue stress to which the specimen was subjected earlier was lower.
The considerable amount of apparent scatter in the test
45
results can be attributed to time factors. Fatigue tests take a long time. The ages at which different specimens of the same mix were tested vary considerably; this age difference influenced the test results. The static flexure test was performed at 28 days , while the fatigue tests were performed at much later ages. Therefore, the ratio f,,,
0)f,, and hence the endur
ance limit, is not consistent. The endurance limit was determined by using the above referred factors.
Based on the test results, the addition of fibrillated polypropylene fiber improved the concrete's ability to withstand dynamic and fatigue loads. A significant advantage of polypropylene fiber under dynamic loads is its relatively low elastic modulus at slow rates of loading, which increases substantially because the effect of time-dependent viscoelastic behavior is eliminated. The polypropylene fiber reinforcement contributed to the improvement of fatigue strength of concrete.
CONCLUSIONS
Conclusions from the research are as follows :
• The addition of 0.5 and 1.0 percent by volume of fibrillated polypropylene fibers significantly improved the fatigue strength.
• The endurance limit (for 2,000,000 cycles) was considerably increased with the addition of fibrillated polypropylene fibers, which, when applied to pavement slabs, would substantially extend the service life of highways.
• The static flexural strength of the fiber concrete beams increased after the beams were subjected to fatigue loading.
• The toughness index values increased with increases in fiber contents. All concrete specimens reinforced with fibrillated polypropylene fibers exhibited an improved ductile behavior when compared with plain concrete.
• The concrete incorporating fibrillated polypropylene fiber had excellent impact resistance. The impact resistance increased with an increase in fiber content.
• The fiber reinforcement had no appreciable effect on the flexural strength when the same mix proportions for different quantities of fibers were used. However, when the fiber factor adjustment is made, the flexural strength may increase with increased fiber content. More research is needed to optimize fiber performance at higher fiber volumes.
• The fiber content in the concrete mix had no appreciable effect on the pulse velocity.
• The addition of fibrillated polypropylene fibers had no significant influence on the static modulus of concrete.
• Good workability can be maintained in polypropylene FRC by adding an appropriate quantity of superplasticizer. No balling or tangling of fibers occurred during mixing and placing even for concretes with 1 percent by volume of polypropylene fibers.
• When using high volumes (0.5 percent and 1.0 percent) of fibrillated polypropylene fibers, fiber factor adjustments are necessary for the mix proportions to balance the mix for workability, placeability, appearance, and strength .
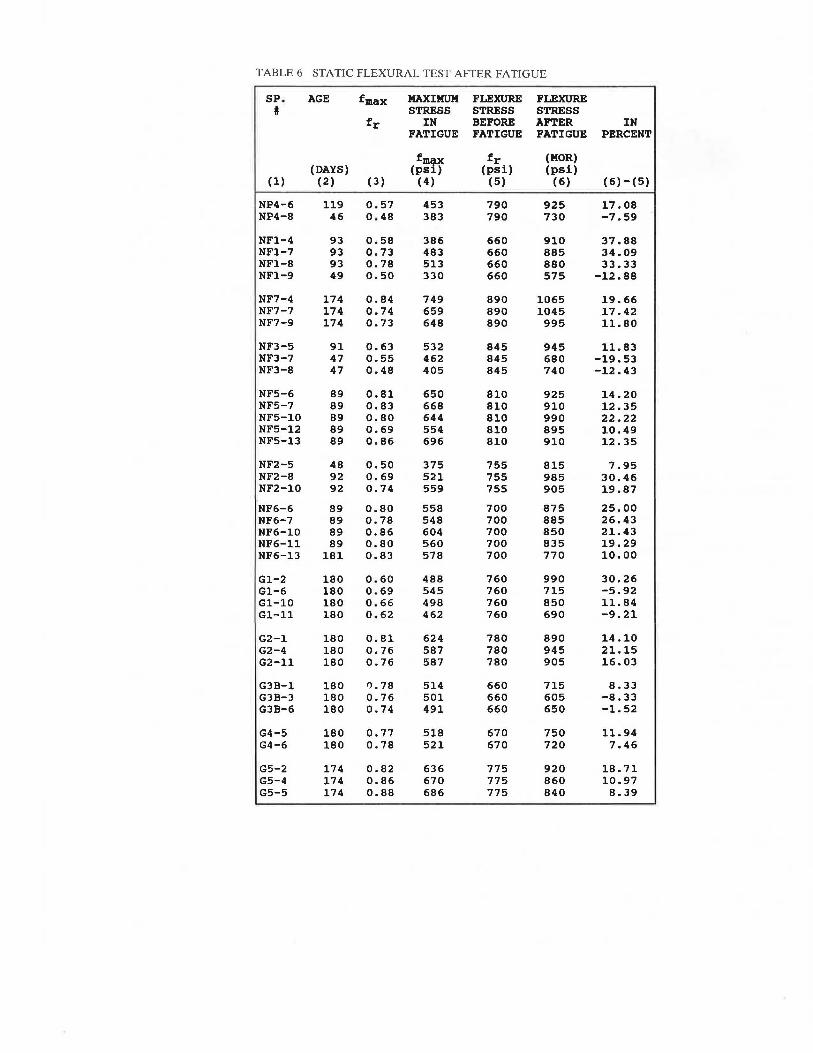
TABLE 6 STATIC FLEXURAL TEST AFTER FATIGUE
SP. AGE fmax MAXIMUM FLEXURE FLEXURE # STRESS STRESS STRESS
fr IN BEFORE AFTER IN FATIGUE FATIGUE FATIGUE PERCENT
fmax fr (MOR) (DAYS) (psi) (psi) (psi)
(1) (2) (3) (4) (5) (6) (6)-(5)
NP4-6 119 0.57 453 790 925 17.08 NP4-8 46 0.48 383 790 730 -7.59
NFl-4 93 0.58 386 660 910 37.88 NFl-7 93 0.73 483 660 885 34.09 NFl-8 93 0.78 513 660 880 33.33 NFl-9 49 0.50 330 660 575 -12.88
NF7-4 174 0.84 749 890 1065 19.66 NF7-7 174 0.74 659 890 1045 17.42 NF7-9 174 0.73 648 890 995 11.80
NF3-5 91 0.63 532 845 945 11.83 NF3-7 47 0.55 462 845 680 -19.53 NF3-8 47 0.48 405 845 740 -12.43
NF5-6 89 0.81 650 810 925 14.20 NF5-7 89 0.83 668 810 910 12.35 NF5-10 89 0.80 644 810 990 22.22 NF5-12 89 0.69 554 810 895 10.49 NF5-13 89 0.86 696 810 910 12.35
NF2-5 48 0.50 375 755 815 7.95 NF2-8 92 0.69 521 755 985 30.46 NF2-10 92 0.74 559 755 905 19.87
NF6-6 89 0.80 558 700 875 25.00 NF6-7 89 0.78 548 700 885 26.43 NF6-10 89 0.86 604 700 850 21.43 NF6-ll 89 0.80 560 700 835 19.29 NF6-13 181 0.83 578 700 770 10.00
Gl-2 180 0 . 60 488 760 990 30.26 Gl-6 180 0.69 545 760 715 -5.92 Gl-10 180 0 . 66 498 760 850 11.84 Gl-11 180 0.62 462 760 690 -9.21
G2-l 180 0.81 624 780 890 14.10 G2-4 180 0.76 587 780 945 21.15 G2-ll 180 0.76 587 780 905 16.03
G3B-l 180 1).78 514 660 715 8.33 G3B-3 180 0.76 501 660 605 -8.33 G3B-6 180 0.74 491 660 650 -1.52
G4-5 180 0.77 518 670 750 11.94 G4-6 180 0.78 521 670 720 7.46
G5-2 174 0.82 636 775 920 18.71 G5-4 174 0.86 670 775 860 10.97 G5-5 174 0.88 686 775 840 8.39
Nagabhushanam et al.
REFERENCES
1. V. Ramakrishnan. Materials and Properties of Fiber Reinforced Concrete . Proc. , International Symposium on Fiber Reinforced Concrete, Madras, India, 1987.
2. V. Ramakrishnan, G. Oberling, and P. Tatnall. Flexural Fatigue Strength of Steel Piber Reinforced Concrete . 111 Report SP-105: Fiber Reinforced Concrete- Properlie and Applict1/io11s , American Concrete Institute, Detroit, Mich., 1987, pp. 225- 245.
3. V. Ramakrishnan, W. V. Coyle, V. Kulandaisamy , and E. K. Schrader. Performance Characteristics of Fiber Reinforced Concretes With Low Fiber Contents. In AC/ Journal Proceedings, Vol. 78, No. 5, 1981, pp. 384-394.
4. V. Ramakrishnan and C. Josifek. Performance Characteristics and Flexural Fatigue of Concrete Steel Fiber Composites. Proc., Inter-
47
national Symposium on Fiber Reinforced Concrete, Madras , India , 1987, pp. 2.73-2.84.
5. V. Ramakrishnan, S. Gollapudi, and R. Zellers . Performance Characteristics and Fatigue Strength of Polypropylene Fiber Reinforced Concrete. In Report SP-105: Fiber Reinforced ConcreteProperties and Applications, American Concrete Institute, Detroit, Mich., 1987, pp. 159-177.
6. ACI Committee 544. Measurement of Properties of Fiber Reinforced Concrete . Report 544 2R-78. American Concrete Institute, Detroit, Mich., 1978.
7. Recommended Practice for Evaluation of Strength Test Results of Concrete. Report 214-77. American Concrete Institute, Detroit, Mich ., 1977.
8. G. Hosali. Properties of Steel Fiber Reinforced Concrete and Effects of Different Fiber Volume. M.S. thesis. South Dakota School of Mines & Technology, 1988.