fatigue assessment of stern ramps - chalmers...
TRANSCRIPT
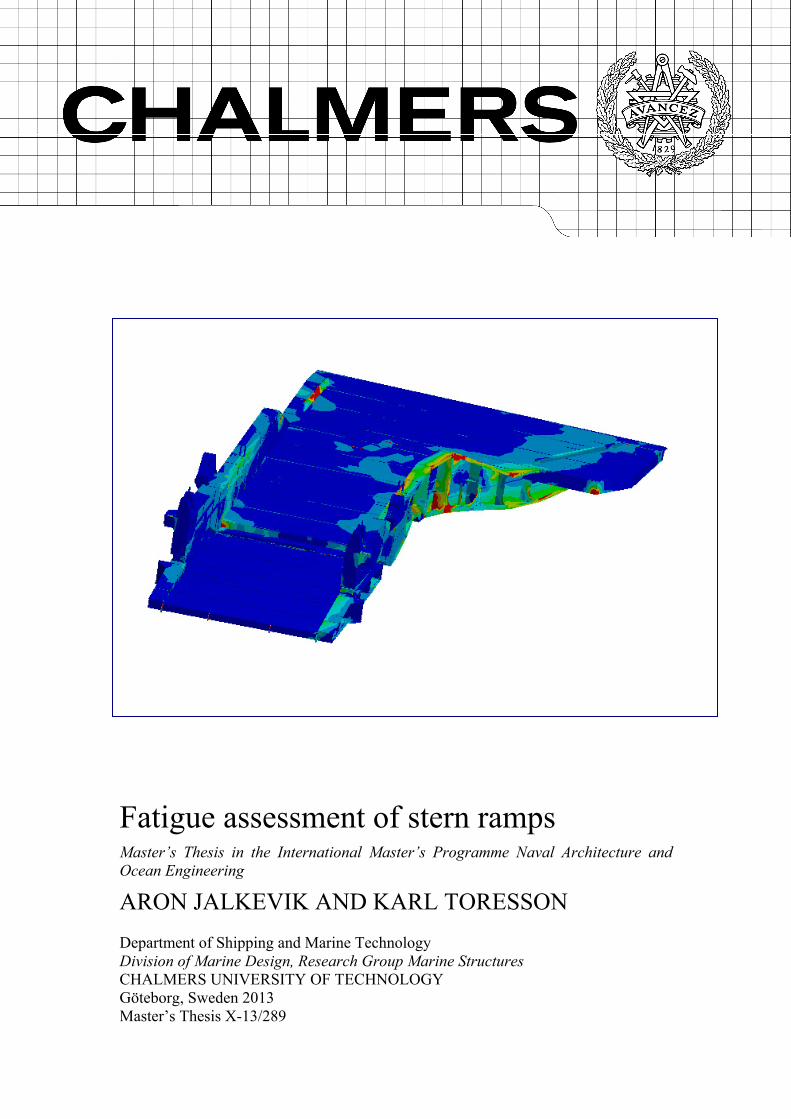
Fatigue assessment of stern ramps Master’s Thesis in the International Master’s Programme Naval Architecture and Ocean Engineering
ARON JALKEVIK AND KARL TORESSON Department of Shipping and Marine Technology Division of Marine Design, Research Group Marine Structures CHALMERS UNIVERSITY OF TECHNOLOGY Göteborg, Sweden 2013 Master’s Thesis X-13/289

MASTER’S THESIS IN THE INTERNATIONAL MASTER’S PROGRAMME IN NAVAL ARCHITECTURE AND OCEAN ENGINEERING
Fatigue assessment of stern ramps
ARON JALKEVIK AND KARL TORESSON
Department of Shipping and Marine Technology Division of Marine Design
Research Group Marine Structures CHALMERS UNIVERSITY OF TECHNOLOGY
Göteborg, Sweden 2013
Fatigue assessment of stern ramps ARON JALKEVIK AND KARL TORESSON
© ARON JALKEVIK AND KARL TORESSON, 2013
Master’s Thesis X-13/289 ISSN 1652-8557 Department of Shipping and Marine Technology Division of Marine Design Research Group Marine Structures Chalmers University of Technology SE-412 96 Göteborg Sweden Telephone: + 46 (0)31-772 1000 Printed by Chalmers Reproservice Göteborg, Sweden 2013
CHALMERS, Shipping and Marine Technology, Master’s Thesis X-13/289 I
Fatigue assessment of stern ramps Master’s Thesis in the International Master’s Programme in Naval Architecture and Ocean Engineering ARON JALKEVIK AND KARL TORESSON Department of Shipping and Marine Technology Division of Marine Design, Research Group Marine Structures Chalmers University of Technology
ABSTRACT
RoRo ships are an important ship type in transports at sea today. Reliable designs of their loading ramps are required to ensure the safe and efficient loading and unloading of cargo. Today, most ramps are designed against ultimate strength despite the fact that they are subjected to repeated loading from rolling cargo. The class rules, however, do not take fatigue damage into consideration.
In this thesis, two RoRo ramps have been investigated from a fatigue point of view. An existing method for performing fatigue assessment and life estimations is to be modified to suit RoRo ramps in the future.
The ramps investigated are a straight stern ramp and a quarter ramp. Two different methods have been used for investigating these ramps. On the straight stern ramp, fatigue damage has been found in the form of cracks in a specific area. Focus has therefore been on investigations of this area. First by stress analyses and subsequently by fatigue analyses based on these stresses. On the quarter ramp no such area is known and therefore a global stress analysis of the ramp has been performed to identify areas with stress concentrations and subsequently sub-models of these areas have been created to get more accurate stress levels in these areas. After the local stresses have been calculated, the stresses are used for estimating the fatigue life of the structure. For the fatigue assessment of the ramps, mainly the stress-based approach has been applied. The number of cycles to failure has been calculated and estimations of the load spectrum were made in order to give an approximation of the fatigue life.
In Case Study 1, it was found that the stresses in the ramp were above the yield limit and close to the ultimate strength, which made the estimated fatigue life especially short. In order to perform more accurate lifetime calculations the actual load spectrum needs to be specified.
In Case Study 2, a number of potential critical areas was found and sub-models of these areas have been investigated and evaluated from a fatigue point of view. The critical areas have been further investigated with various motivations, for instance high local stresses in the global model and geometry study in order to find local stress concentrations. The stresses obtained in the investigated areas were used to perform fatigue life estimations. In Case 2, it has been shown that the fatigue life was adequate.
Key words: Fatigue, FEM, loading ramp, local stress, RoRo, strain-based approach, stern ramp, stress-based approach, stress concentration, vehicle, quarter ramp.

CHALMERS, Shipping and Marine Technology, Master’s Thesis X-13/289 II
CHALMERS, Shipping and Marine Technology, Master’s Thesis X-13/289 III
Contents ABSTRACT I
CONTENTS III
PREFACE V
ABBREVIATIONS VII
NOTATIONS VII
1 INTRODUCTION AND MOTIVATION OF WORK 1
1.1 Background 1
1.2 Objectives 2
1.3 Methodology 2
1.4 Limitations 4
2 CALCULATION PROCEDURES AND APPROACHES 7
2.1 Ramp design method according to class 7
2.2 Fatigue theory 7 2.2.1 The stress-based approach 8 2.2.2 The strain-based approach 10
2.3 Fatigue methodology in the current study 12 2.3.1 Welds 13
2.4 FEM 14 2.4.1 Global model mesh 15 2.4.2 Local model mesh 15
2.5 Loads and boundary conditions 15
2.6 Material description and representation 17
3 CASE STUDY 1 - STRAIGHT STERN RAMP 21
3.1 FE-model 22
3.2 Geometry 22
3.3 Mesh 25
3.4 Boundary conditions 27
3.5 Stress-cycle analysis 28
3.6 Lifetime calculation 29
CHALMERS, Shipping and Marine Technology, Master’s Thesis X-13/289 IV
4 CASE STUDY 2 - QUARTER RAMP 35
4.1 FE-model 35
4.2 Geometry 35
4.3 Loads 37
4.4 Boundary conditions 37
4.5 Sub-models 38 4.5.1 Sub-model 1 38 4.5.2 Sub-model 2 39 4.5.3 Sub-model 3 42
5 CONCLUSIONS 47
6 FUTURE WORK 51
7 REFERENCES 53
APPENDIX A: PHOTOS OF RAMPS A1
APPENDIX B: CALCULATION OF TYRE FOOTPRINT AND PRESSURE B1
APPENDIX C: STRESS RESPONSE IN STRAIGHT STERN RAMP C1
APPENDIX D: TYRE FOOTPRINT USED IN CASE STUDY 2 D1
APPENDIX E: LOAD STEPS USED IN CASE STUDY 2 E1
APPENDIX F: STRESS AND STRAIN PLOTS - HOT SPOT METHOD F1

CHALMERS, Shipping and Marine Technology, Master’s Thesis X-13/289 V
Preface This thesis is a part of the requirements for the master's degree in Naval Architecture and Ocean Engineering at Chalmers University of Technology, Göteborg, and has been carried out at the Division of Marine Design, Department of Shipping and Marine Technology, Chalmers University of Technology in cooperation with MacGREGOR between January and June of 2013.
We would like to acknowledge and thank our examiner and supervisor, Professor Jonas Ringsberg at the Department of Shipping and Marine Technology and our supervisor Daniel Gustafsson at MacGREGOR for their supervision.
We would also like to thank Mattias Gunnarsson, Pontus Dahlström and Jonas Pedersen at MacGREGOR, Göteborg, Sweden, for their support and assistance during the project.
Göteborg, June, 2013 Aron Jalkevik and Karl Toresson

CHALMERS, Shipping and Marine Technology, Master’s Thesis X-13/289 VI
CHALMERS, Shipping and Marine Technology, Master’s Thesis X-13/289 VII
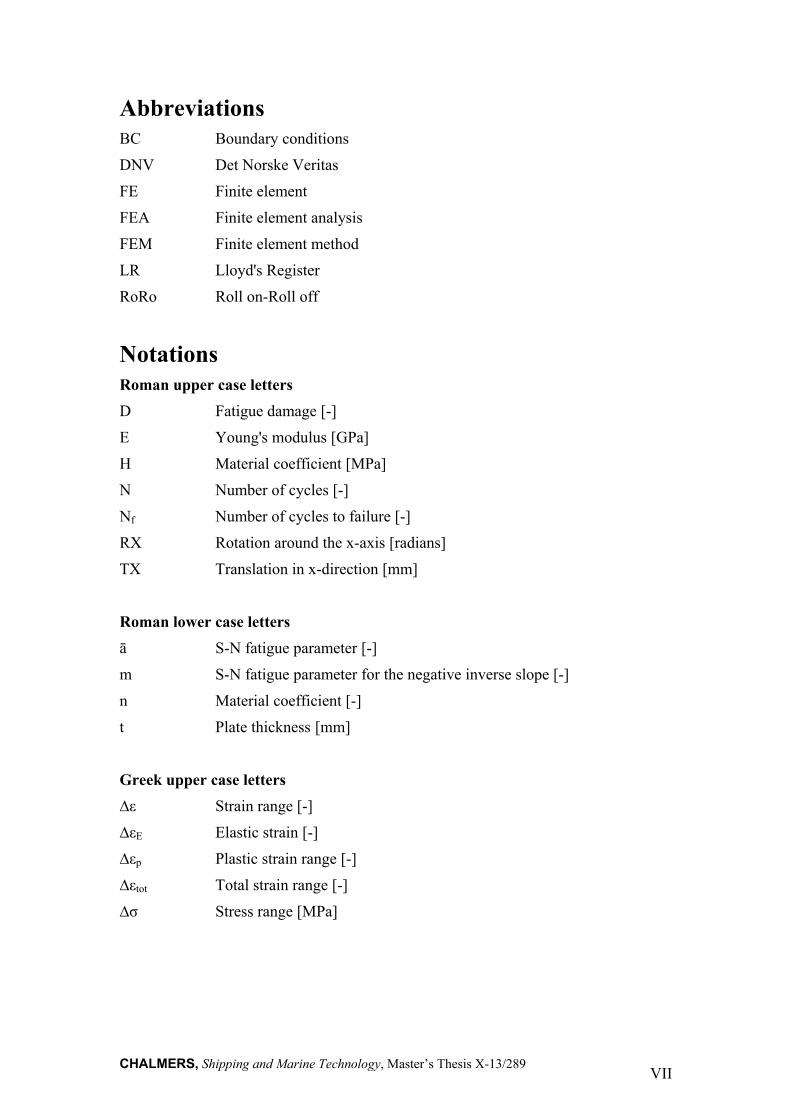
Abbreviations BC Boundary conditions
DNV Det Norske Veritas
FE Finite element
FEA Finite element analysis
FEM Finite element method
LR Lloyd's Register
RoRo Roll on-Roll off
Notations Roman upper case letters
D Fatigue damage [-]
E Young's modulus [GPa]
H Material coefficient [MPa]
N Number of cycles [-]
Nf Number of cycles to failure [-]
RX Rotation around the x-axis [radians]
TX Translation in x-direction [mm]
Roman lower case letters
ā S-N fatigue parameter [-]
m S-N fatigue parameter for the negative inverse slope [-]
n Material coefficient [-]
t Plate thickness [mm]
Greek upper case letters
∆ε Strain range [-]
∆εE Elastic strain [-]
∆εp Plastic strain range [-]
∆εtot Total strain range [-]
∆σ Stress range [MPa]
CHALMERS, Shipping and Marine Technology, Master’s Thesis X-13/289 VIII
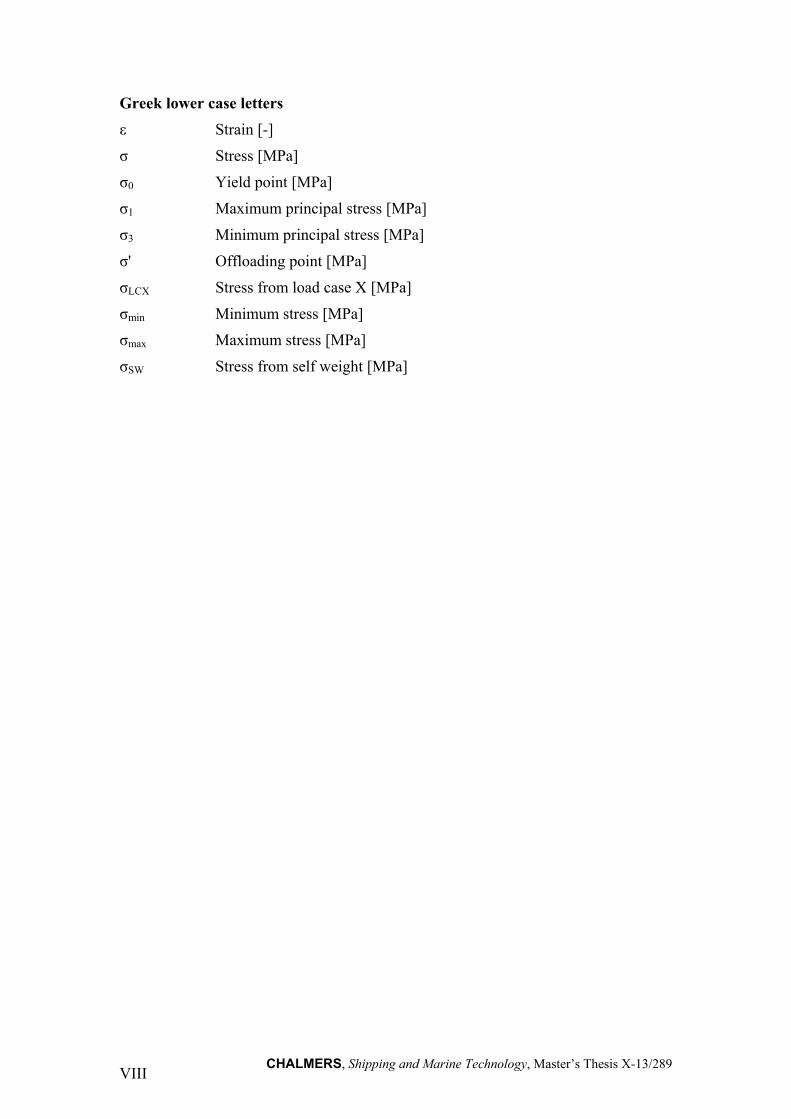
Greek lower case letters
ε Strain [-]
σ Stress [MPa]
σ0 Yield point [MPa]
σ1 Maximum principal stress [MPa]
σ3 Minimum principal stress [MPa]
σ' Offloading point [MPa]
σLCX Stress from load case X [MPa]
σmin Minimum stress [MPa]
σmax Maximum stress [MPa]
σSW Stress from self weight [MPa]
CHALMERS, Shipping and Marine Technology, Master’s Thesis X-13/289 1
1 Introduction and motivation of work In this introductory chapter of the thesis the background with a motivation for the study is stated together with the purpose of the thesis and the method for how the study has been carried out.
1.1 Background RoRo ships are widely used in transports of cars, trucks and containers, among other things. The standard concept with a RoRo ship is a ship with a movable ramp which is used for loading and offloading. Therefore, the ramps on the RoRo ships are subjected to various dynamic and static loading during their lifetime and may as a result be subjected to fatigue damage. While in its stowed position, the ramp acts as a part of the hull and contributes to the structural integrity of the ship. Because of this, the ramp is also designed to withstand an external sea pressure due to waves.
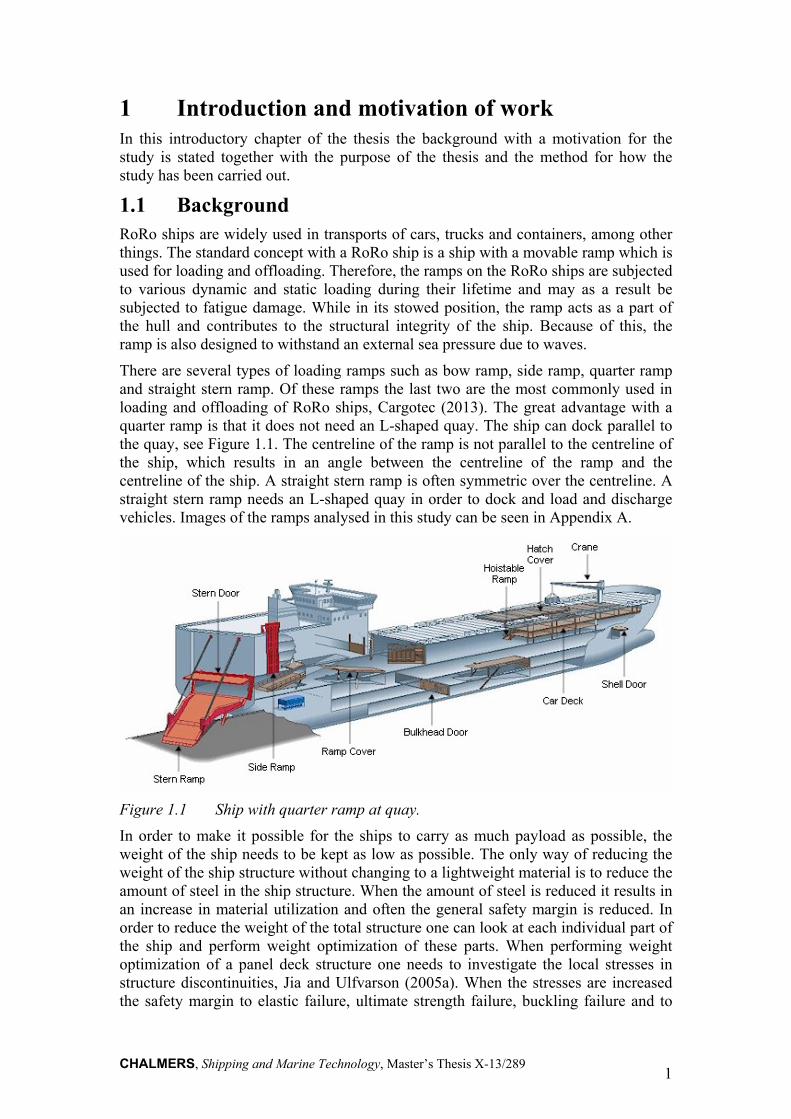
There are several types of loading ramps such as bow ramp, side ramp, quarter ramp and straight stern ramp. Of these ramps the last two are the most commonly used in loading and offloading of RoRo ships, Cargotec (2013). The great advantage with a quarter ramp is that it does not need an L-shaped quay. The ship can dock parallel to the quay, see Figure 1.1. The centreline of the ramp is not parallel to the centreline of the ship, which results in an angle between the centreline of the ramp and the centreline of the ship. A straight stern ramp is often symmetric over the centreline. A straight stern ramp needs an L-shaped quay in order to dock and load and discharge vehicles. Images of the ramps analysed in this study can be seen in Appendix A.
Figure 1.1 Ship with quarter ramp at quay.
In order to make it possible for the ships to carry as much payload as possible, the weight of the ship needs to be kept as low as possible. The only way of reducing the weight of the ship structure without changing to a lightweight material is to reduce the amount of steel in the ship structure. When the amount of steel is reduced it results in an increase in material utilization and often the general safety margin is reduced. In order to reduce the weight of the total structure one can look at each individual part of the ship and perform weight optimization of these parts. When performing weight optimization of a panel deck structure one needs to investigate the local stresses in structure discontinuities, Jia and Ulfvarson (2005a). When the stresses are increased the safety margin to elastic failure, ultimate strength failure, buckling failure and to

CHALMERS, Shipping and Marine Technology, Master’s Thesis X-13/289 2
large deflections decreases. New problems of vibration and damping can also be expected due to change of the natural frequencies, Jia and Ulfvarson (2005b), where local stresses of a greater magnitude occur in structure discontinuities the risk of fatigue problems increases, Dowling (2012).
Today, a great deal of the world’s RoRo ramp design is carried out using a trial and error method. The loads and boundary conditions are applied in a model that gives rise to stresses in the beams. The section modulus in the beams is varied in order to find a stress level that is as close as possible to the maximum allowable stress, according to the class rules. This is done in order to utilize the material properties to the greatest possible degree and minimize the weight of the structure.
1.2 Objectives Neither DNV nor Lloyd's register, which are currently two commonly used classification societies for RoRo ramps, cover rules concerning the assessment of fatigue damage of external loading ramps today, LR (2009) and DNV (2012a). But since the damage results in increased repair costs and lower trust among the customers, it is of great interest to find a method for minimizing the fatigue damage.
Two ramps have been studied as two different case studies in this thesis in order to investigate and evaluate a method for fatigue assessment. These two ramps are designed by the company MacGREGOR in Göteborg, Sweden. The first ramp is a straight stern ramp with a weight of approximately 60 tonnes and is attached to a ship with a deadweight of 14,330 tonnes, MarineTraffic (2013). Cracks have been found in certain areas during inspections of this ramp. This ramp can be seen in Figure A1 and Figure A2 in Appendix A. The quarter ramp with a weight of about 95 tonnes is attached to a ship with a deadweight of 22,467 tonnes, Wallenius (2013). Images of this ramp can be seen Figures A3 and A4 in Appendix A.
The main objective with this study is to evaluate methods for fatigue evaluation of RoRo ramps. These methods are based on investigations of local stress concentrations, which, together with analyses of the load spectrum, should be used for making an evaluation of the structure from a fatigue perspective in order to estimate a life span for the ramps. The steps included in this study are:
Investigate a model on a global scale in order to find critical areas with a high local stress.
Investigate local stress concentrations. Evaluate the stress concentration areas from a fatigue point of view.
1.3 Methodology Two stern ramps have been investigated - both ramps have been proposed by MacGREGOR. The ramps have already been manufactured and are currently in service, which has made calculation bases available. Autodesk® Inventor® Professional 2013 has been used for creating the geometry of the straight stern ramp, Autodesk® (2013). The geometry of the quarter ramp has been provided by MacGREGOR. In order to adjust the geometries ANSYS® DesignModeler has been used, ANSYS® (2013).
Three-dimensional (3D) FEAs have been carried out in order to investigate the stresses and the stress concentrations in the ramps. ANSYS® Mechanical 14.5 software has been used for the FE-analyses, ANSYS® (2013). In order to evaluate the
CHALMERS, Shipping and Marine Technology, Master’s Thesis X-13/289 3
FE-results MATLAB® R2012B has been used, The MathWorks Inc (2012). The FE-analyses aim at determining local stresses and strains. In order to evaluate fatigue life, a fatigue evaluation method has to be used. In the study, the stress-based and the strain-based method has been used, which is described in more detail in Sections 2.2.1 and 2.2.2.
Two methods have been applied, one for each case study performed in this study. The method used in Case Study 1 aims at evaluating a known critical area. The applied method in Case Study 2 aims at detecting potential critical areas, and, furthermore, to evaluate the areas from a fatigue point of view.
In Case Study 1 an FE-analysis has been carried out in order to determine stresses and strains in the known critical area. The FE-model has been built up in such a way that the simulations have been performed on the full-size model and the known critical area has been modelled with a mesh size detailed enough to take local stress risers into account.
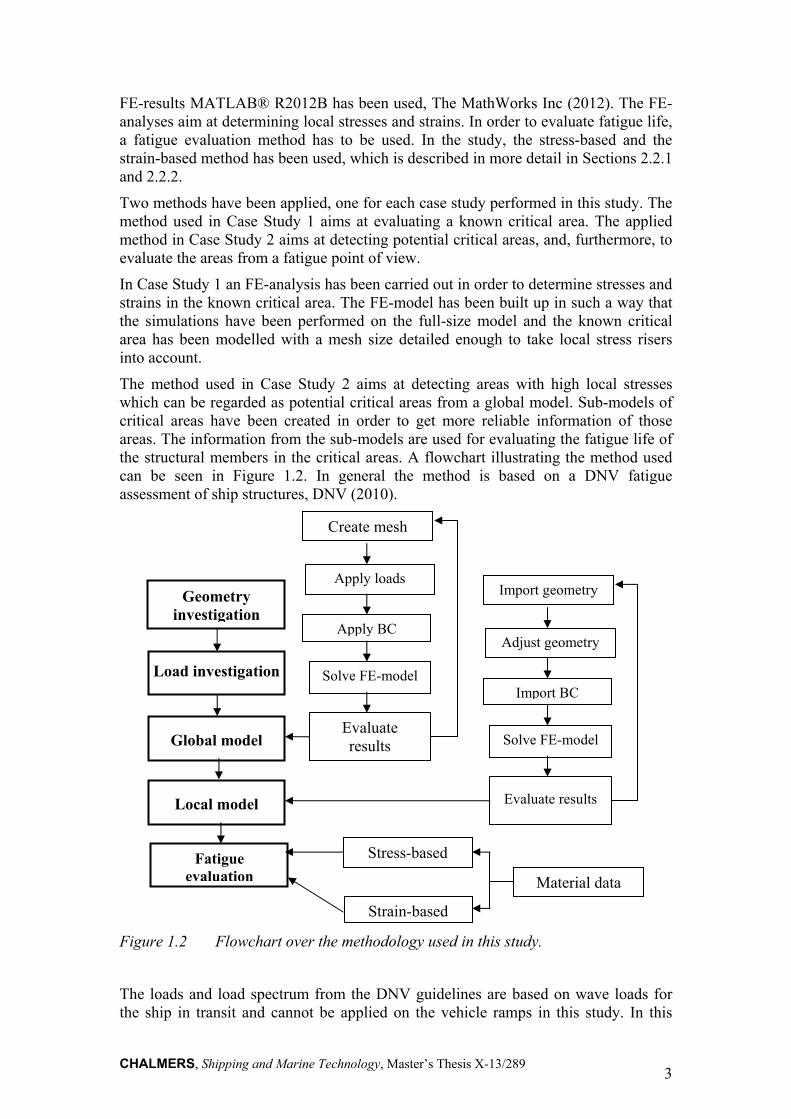
The method used in Case Study 2 aims at detecting areas with high local stresses which can be regarded as potential critical areas from a global model. Sub-models of critical areas have been created in order to get more reliable information of those areas. The information from the sub-models are used for evaluating the fatigue life of the structural members in the critical areas. A flowchart illustrating the method used can be seen in Figure 1.2. In general the method is based on a DNV fatigue assessment of ship structures, DNV (2010).
Figure 1.2 Flowchart over the methodology used in this study.
The loads and load spectrum from the DNV guidelines are based on wave loads for the ship in transit and cannot be applied on the vehicle ramps in this study. In this
Load investigation
Global model
Local model
Fatigue evaluation
Create mesh
Apply loads
Apply BC
Solve FE-model
Evaluate results
Import geometry
Adjust geometry
Import BC
Solve FE-model
Evaluate results
Stress-based
Strain-based
Material data
Geometry investigation

CHALMERS, Shipping and Marine Technology, Master’s Thesis X-13/289 4
study, the focus of the loads that the ramps are subjected to have been on vehicle-induced loads. The load spectrum for the two ramps is unknown in this case. The ramps are subjected to several cyclic loads during its lifetime. In the case studies, the maximum frequently occurring vehicle load has been used for the fatigue evaluation. The magnitude of the vehicle loads is stated in the requirement specifications from the customer of the ramps. How the design load is calculated is stated by the classification societies using the actual loads as input, LR (2009).
In order to obtain a realistic full stress cycle during one load cycle, the load has to be applied stepwise over the ramp. This has been carried out in order to represent the vehicle driving over the ramp.
In Case Study 1 it has been shown that plastic deformation takes place when applying the assumed most occurring load stated in the requirement specifications for the ramp. In these cases the load has to be applied cyclically in order to take material hardening into account. Simulating the hardening process with high resolution is a computational time-consuming process. In order to reduce the computation time it is of great importance to evaluate the stress cycle for the critical area and perform the simulations including hardening effects exclusively for the relevant load cases. The steps for performing such calculations are described here:
1. Apply the load stepwise over the ramp.
2. Evaluate the stress in the critical area as a function of the load steps.
3. Apply the load giving rise to maximum and minimum stress in the critical area.
4. Repeat the cyclic load until the stress-strain relation converges.
5. Evaluate the converged strain range.
These two methods have been performed on two ramps in order to investigate potential fatigue areas in two different external RoRo ramps. The methods are based on existing methods used in the marine industry for evaluating potential fatigue problems.
1.4 Limitations There are several types of RoRo ramps used on ships today, but the focus of this study has been on investigating two different concepts for the case studies, the straight stern ramp and the quarter ramp. These two ramps were chosen because they are commonly used ramps on RoRo ships. However, since the structure and function of many of the other existing loading ramps are similar, the findings and recommendations of this study may be applicable on other types of ramps as well.
The loads have been added on surfaces representing the tire print of the vehicles running over the ramp, with the tire prints applied in a path for the trucks to drive on. This path represents the driveway for the loading vehicles and is used for simulating that the loading vehicles are driven over the ramp. This is because the position of the load may influence the location and magnitude of the stress concentrations. Due to the design of the ramps it is assumed that the difference in the response of the ramp when the truck drives in a different path on the ramp is negligible. Therefore, only one drive path has been investigated on each ramp.
Effects from dynamic loading are important limiting factors in marine structures. Examples of such effects are damping and vibration effects. The vehicles running
CHALMERS, Shipping and Marine Technology, Master’s Thesis X-13/289 5
over the ramp may give rise to vibrations and a modal analysis should be carried out in order to determine that resonance frequencies are avoided. A modal analysis would have given the answer of how many stress cycles the structure is subjected to in each load cycle due to dynamic response in the structure. In this report, however, the only consideration of dynamic effects are from the dynamic factor from the classification societies. This factor is used to magnify the static loads in order to compensate for the vehicle accelerations which would otherwise not be taken into account.
The dynamic loads from the seagoing mode are not taken into consideration - only the loads in harbour conditions are considered in this study. Therefore, the only loads taken into account are loads applicable during operation of the ramp.
The ramps will be subjected to loads when manoeuvring the ramp, an example of this is the ramp slamming in to the quay. These types of loads due to manoeuvring of the ramp are not covered in this study since the frequency of these loads are low compared to the loads due to vehicle loading.
The ship and the quay may suffer from motions relative to each other due to ship motion. The friction between the quay and the ramp results in loads subjected to the ramp. The calculations performed in this study assume no relative motions and frictionless support between the quay and the ramp.
RoRo ramps are manufactured in several different qualities of steel and even some parts of one single ramp are sometimes created in different materials from the rest of the ramps. This report is limited to investigating ramps of one specific material for all ramps and for all parts of the ramps.
When the hinges of the ramp are subjected to a force, the hinge axle will transfer this load to the hinge ears. However, the mechanical behaviour of the hinge axle acting on the hinge ears has not been analyzed in this report since the report does not deal with contact mechanical behaviour.
In this study, the evaluation of stresses in welds has only considered the stress in the weld toe. Therefore, the fatigue evaluation of welds in this thesis has only taken weld toes into consideration.

CHALMERS, Shipping and Marine Technology, Master’s Thesis X-13/289 6
CHALMERS, Shipping and Marine Technology, Master’s Thesis X-13/289 7
2 Calculation procedures and approaches The ramps investigated in this study are two stern ramps installed on RoRo ships and are therefore subjected to heavy vehicles driving repeatedly over the ramps. This type of cyclic loading will give rise to fatigue damage. In this chapter, detailed descriptions of the theory behind the fatigue calculations, FEM, loads and material that have been used in this study can be found.
2.1 Ramp design method according to class The most commonly used design method for ramps investigated in Chapter 3 and Chapter 4 is stated here in order to give an understanding to the background of the problems with the ramps.
The two ramps that have been investigated in this study have been designed, by MacGREGOR, according to Lloyd's Register, LR (2009). In the class rules, design loads are stated that are based on the actual loads the ramp will be subjected to. The applied load location on the ramp is the assumed worst case. Furthermore, the class rules state allowable stress criteria, which will be taken into account together with the design loads, LR (2009). To ensure that the criteria in the class rules are fulfilled, strength calculations have been performed on the ramps. Mainly, the strength calculations have previously been performed using a beam theory. The geometry model is built up with vectors, which symbolizes the beams. Cross section properties are assigned to the vectors. Usually, the geometry in the model is significantly simplified. The strength calculation mostly takes global strength into account. Geometric discontinuities, for instance, are not modelled.
The performed strength calculation for the ramps considered in this study has been an iterative process where the cross section properties were adjusted in order to have moderate stresses in the beams. This is performed in order to obtain an appropriate ratio between strength and weight in the structure.
2.2 Fatigue theory In this section, general fatigue theory and terms used for fatigue calculations are presented. Knowledge of the content in this section is required in order to fully comprehend the content of this report. The applied method used in this study is presented in Section 2.3.
When engineering materials are subjected to cyclic loading fatigue damage will occur, which can lead to structure failure. The stress range that is dependent on the applied cyclic load may be significantly lower than the ultimate strength of the material. However, fatigue may still take place. It is of importance to distinguish between nominal stress and point stress. The point stress can be determined by calculating the nominal stress using a beam theory and a subsequent multiplication by a stress concentration factor. If more complex geometries where no stress concentration factor is available are to be evaluated, numerical methods like FEM should be used. The initiation of fatigue cracks may occur from very small local areas subjected to various stresses, Dowling (2012).
Fatigue methods which aim at predicting the occurrence of cracks are divided into a stress-based and a strain-based approach. If the maximum stress in the evaluated point is in the elastic region the stress-based approach is used, which is referred to as high-

CHALMERS, Shipping and Marine Technology, Master’s Thesis X-13/289 8
cycle fatigue. If plastic strain is the dominating strain in the material the strain-based approach is used, which is referred to as low-cycle fatigue.
2.2.1 The stress-based approach
The stress-based approach is a phenomenological method for evaluating fatigue behaviour of material subjected to cyclic loads. Linear elastic calculations assuming no plasticity are used in order to evaluate the stresses. The method used for performing a stress-based fatigue life estimation is illustrated in Figure 2.1. The number of cycles to failure is evaluated with the stress ranges as input in an S-N curve which is illustrated in Figure 2.2. The structure is subjected to various stress ranges, which is a reality for many cases. The Palmgren-Miner rule is used for fatigue-life estimation. The Palmgren-Miner rule is used for adding the contribution from several different stress ranges when estimating the total fatigue damage.
Figure 2.1 Flowchart of method for fatigue- life estimation.
Figure 2.2 Example of S-N curve with a logarithmic x-axis.
Linear stress evaluation
Fatigue damage evaluation (S-N curve)
Lifetime estimate (Palmgren-Miner rule)
CHALMERS, Shipping and Marine Technology, Master’s Thesis X-13/289 9
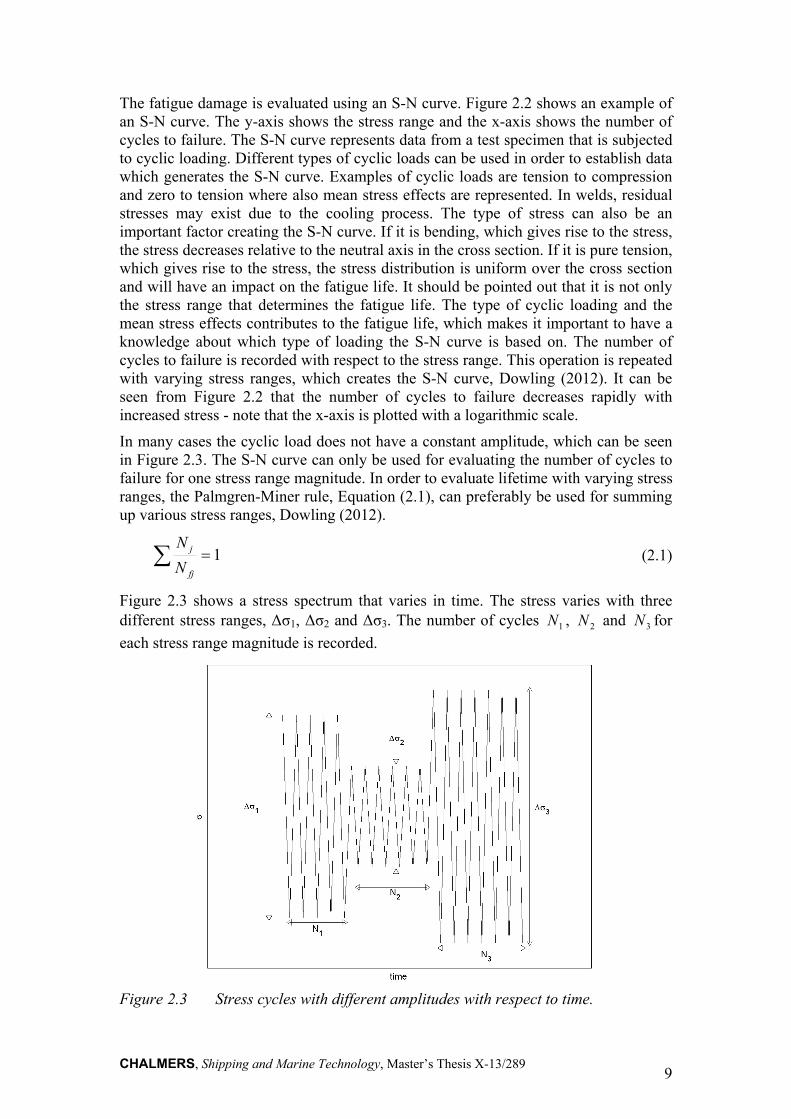
The fatigue damage is evaluated using an S-N curve. Figure 2.2 shows an example of an S-N curve. The y-axis shows the stress range and the x-axis shows the number of cycles to failure. The S-N curve represents data from a test specimen that is subjected to cyclic loading. Different types of cyclic loads can be used in order to establish data which generates the S-N curve. Examples of cyclic loads are tension to compression and zero to tension where also mean stress effects are represented. In welds, residual stresses may exist due to the cooling process. The type of stress can also be an important factor creating the S-N curve. If it is bending, which gives rise to the stress, the stress decreases relative to the neutral axis in the cross section. If it is pure tension, which gives rise to the stress, the stress distribution is uniform over the cross section and will have an impact on the fatigue life. It should be pointed out that it is not only the stress range that determines the fatigue life. The type of cyclic loading and the mean stress effects contributes to the fatigue life, which makes it important to have a knowledge about which type of loading the S-N curve is based on. The number of cycles to failure is recorded with respect to the stress range. This operation is repeated with varying stress ranges, which creates the S-N curve, Dowling (2012). It can be seen from Figure 2.2 that the number of cycles to failure decreases rapidly with increased stress - note that the x-axis is plotted with a logarithmic scale.
In many cases the cyclic load does not have a constant amplitude, which can be seen in Figure 2.3. The S-N curve can only be used for evaluating the number of cycles to failure for one stress range magnitude. In order to evaluate lifetime with varying stress ranges, the Palmgren-Miner rule, Equation (2.1), can preferably be used for summing up various stress ranges, Dowling (2012).
1fj
j
N
N (2.1)
Figure 2.3 shows a stress spectrum that varies in time. The stress varies with three different stress ranges, Δσ1, Δσ2 and Δσ3. The number of cycles 1N , 2N and 3N for
each stress range magnitude is recorded.
Figure 2.3 Stress cycles with different amplitudes with respect to time.
CHALMERS, Shipping and Marine Technology, Master’s Thesis X-13/289 10
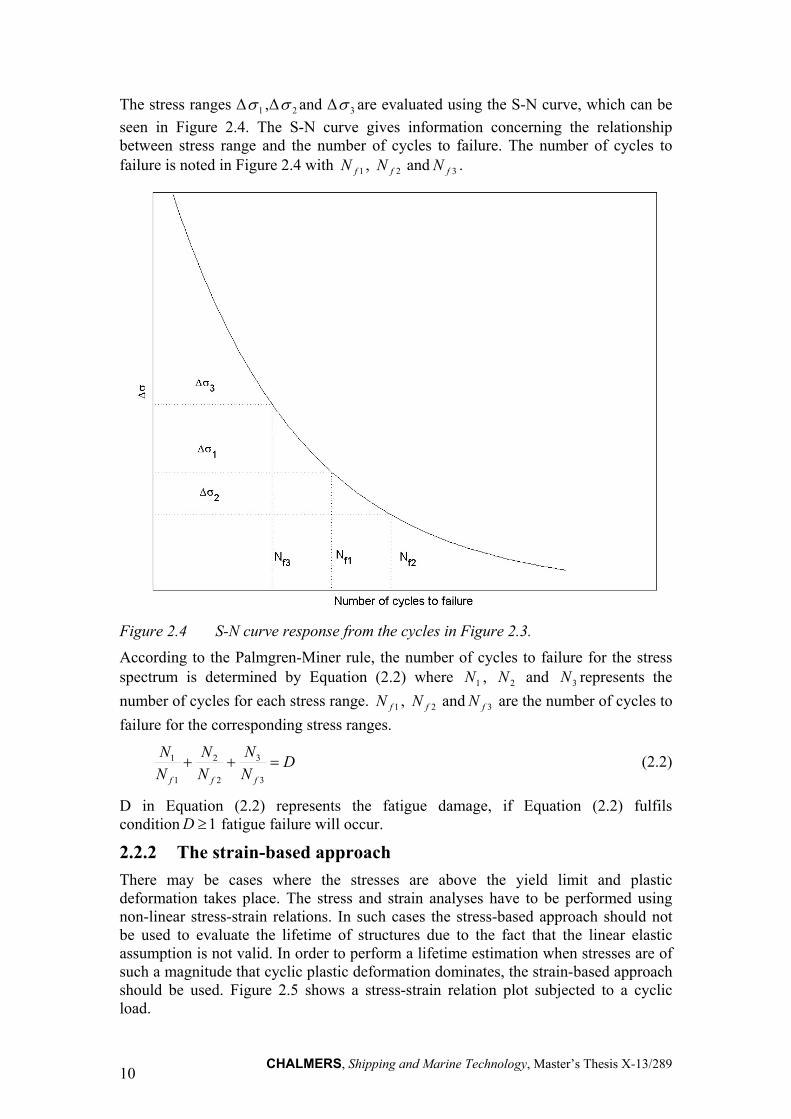
The stress ranges Δ 1 ,Δ 2 and Δ 3 are evaluated using the S-N curve, which can be
seen in Figure 2.4. The S-N curve gives information concerning the relationship between stress range and the number of cycles to failure. The number of cycles to failure is noted in Figure 2.4 with 1fN , 2fN and 3fN .
Figure 2.4 S-N curve response from the cycles in Figure 2.3.
According to the Palmgren-Miner rule, the number of cycles to failure for the stress spectrum is determined by Equation (2.2) where 1N , 2N and 3N represents the
number of cycles for each stress range. 1fN , 2fN and 3fN are the number of cycles to
failure for the corresponding stress ranges.
DN
N
N
N
N
N
fff
3
3
2
2
1
1 (2.2)
D in Equation (2.2) represents the fatigue damage, if Equation (2.2) fulfils condition 1D fatigue failure will occur.
2.2.2 The strain-based approach
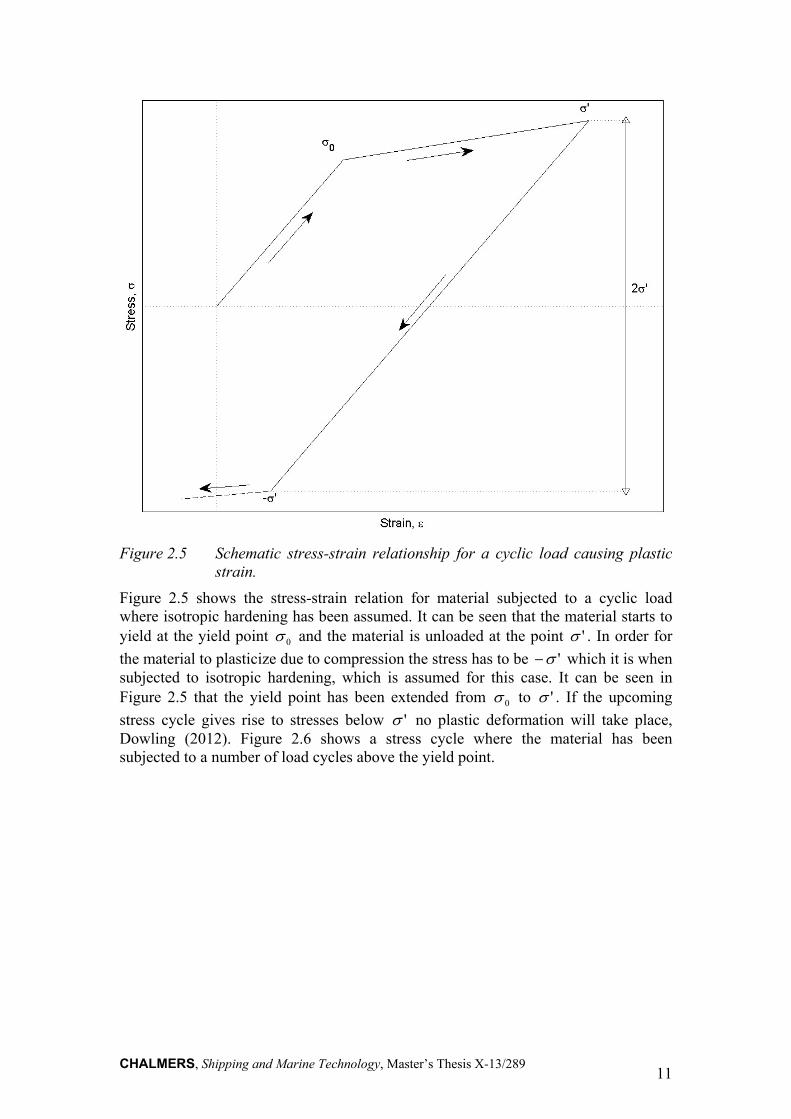
There may be cases where the stresses are above the yield limit and plastic deformation takes place. The stress and strain analyses have to be performed using non-linear stress-strain relations. In such cases the stress-based approach should not be used to evaluate the lifetime of structures due to the fact that the linear elastic assumption is not valid. In order to perform a lifetime estimation when stresses are of such a magnitude that cyclic plastic deformation dominates, the strain-based approach should be used. Figure 2.5 shows a stress-strain relation plot subjected to a cyclic load.
CHALMERS, Shipping and Marine Technology, Master’s Thesis X-13/289 11
Figure 2.5 Schematic stress-strain relationship for a cyclic load causing plastic strain.
Figure 2.5 shows the stress-strain relation for material subjected to a cyclic load where isotropic hardening has been assumed. It can be seen that the material starts to yield at the yield point 0 and the material is unloaded at the point ' . In order for
the material to plasticize due to compression the stress has to be ' which it is when subjected to isotropic hardening, which is assumed for this case. It can be seen in Figure 2.5 that the yield point has been extended from 0 to ' . If the upcoming
stress cycle gives rise to stresses below ' no plastic deformation will take place, Dowling (2012). Figure 2.6 shows a stress cycle where the material has been subjected to a number of load cycles above the yield point.
CHALMERS, Shipping and Marine Technology, Master’s Thesis X-13/289 12
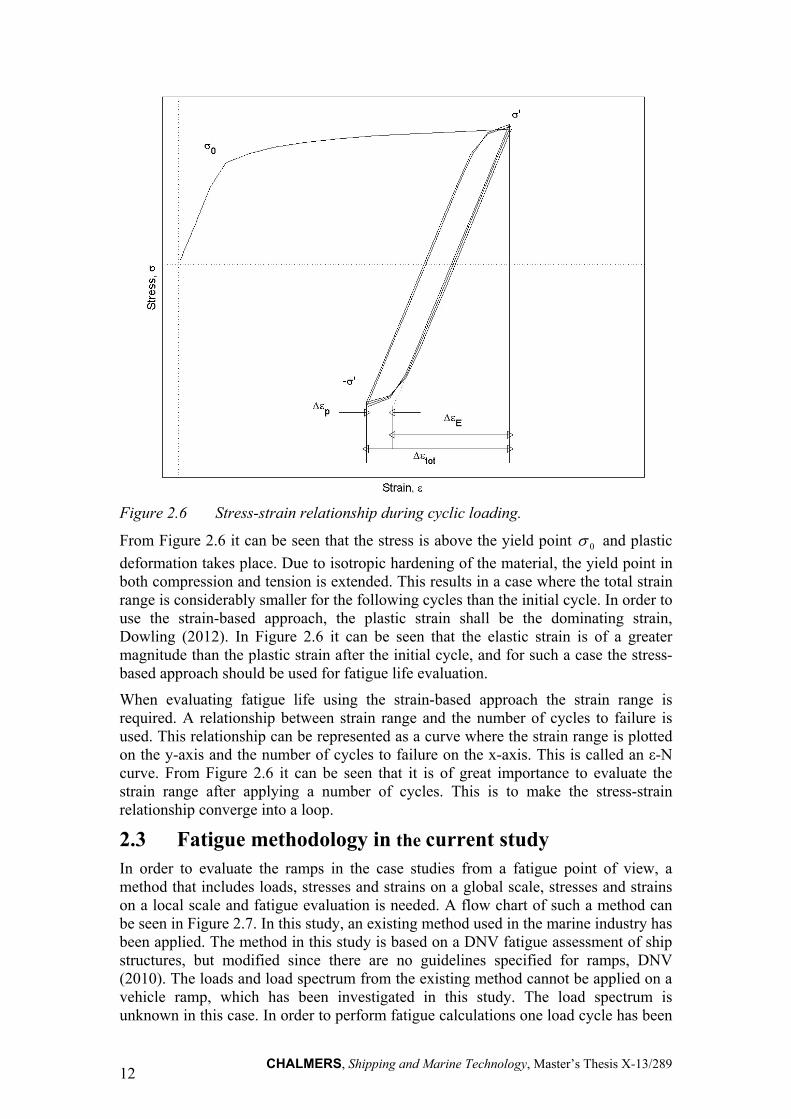
Figure 2.6 Stress-strain relationship during cyclic loading.
From Figure 2.6 it can be seen that the stress is above the yield point 0 and plastic
deformation takes place. Due to isotropic hardening of the material, the yield point in both compression and tension is extended. This results in a case where the total strain range is considerably smaller for the following cycles than the initial cycle. In order to use the strain-based approach, the plastic strain shall be the dominating strain, Dowling (2012). In Figure 2.6 it can be seen that the elastic strain is of a greater magnitude than the plastic strain after the initial cycle, and for such a case the stress-based approach should be used for fatigue life evaluation.
When evaluating fatigue life using the strain-based approach the strain range is required. A relationship between strain range and the number of cycles to failure is used. This relationship can be represented as a curve where the strain range is plotted on the y-axis and the number of cycles to failure on the x-axis. This is called an ε-N curve. From Figure 2.6 it can be seen that it is of great importance to evaluate the strain range after applying a number of cycles. This is to make the stress-strain relationship converge into a loop.
2.3 Fatigue methodology in the current study In order to evaluate the ramps in the case studies from a fatigue point of view, a method that includes loads, stresses and strains on a global scale, stresses and strains on a local scale and fatigue evaluation is needed. A flow chart of such a method can be seen in Figure 2.7. In this study, an existing method used in the marine industry has been applied. The method in this study is based on a DNV fatigue assessment of ship structures, but modified since there are no guidelines specified for ramps, DNV (2010). The loads and load spectrum from the existing method cannot be applied on a vehicle ramp, which has been investigated in this study. The load spectrum is unknown in this case. In order to perform fatigue calculations one load cycle has been

CHALMERS, Shipping and Marine Technology, Master’s Thesis X-13/289 13
assumed with respect to the loads stated in the requirement specifications of the ramp. The fatigue damage from one load cycle is calculated. It should be pointed out that in this project the maximum, frequently occurring, vehicle load has been used as the assumed load. All various loads that the ramps are subjected to are discussed in more detail in Section 2.5.
The FE solution indicates local stresses in critical areas. These stresses may be below the yield point, although the stresses can still cause damage on the structure in terms of fatigue. A fatigue evaluation that can provide information about the number of cycles to failure is required in order to perform good design work. In order to obtain the number of cycles to failure an S-N curve is used. The S-N curve provides information about the relationship between stress range and the number of cycles to failure. The stresses and strains from the FEA can in many cases not directly be used as the stress range input to the S-N curve. A deeper investigation of exactly which stress that is used for input to the S-N curve has to be performed.
Figure 2.7 Flowchart over fatigue method.
2.3.1 Welds
The hot spot method has been used in order to evaluate stresses in welds in structural intersection points. The hot spot method includes all geometrical stress risers except the weld itself, Hobbacher (2008). The hot spot method is based on two readout points where the stress is determined. The stress is extrapolated from these two points to the hot spot. The weld itself has not been generated in the geometry, DNV (2010). The points are located at t5.0 and t5.1 from the hot spot, where t is the plate thickness. These two points have been used to linearly extrapolate the stress to the hot spot, DNV (2010). Figure 2.8 shows an example of where the hot spot stress has been calculated in a weld toe. The weld itself has not been generated in this example. The solid line shows the stress calculated from the FEA and the dotted line shows the extrapolated hot spot stress. The stress is extrapolated to the structure intersection in order to avoid underestimation of the stress due to the missing stiffness from the weld, Hobbacher (2008). In cases where the weld is not located in a structural intersection the hot spot method has not been used. In such a case, the stress given by the FE-solution has been used directly.
Figure 2.8 Schematic of extrapolation of hot spot stress.
Load investigation Local model Global model Fatigue evaluation
CHALMERS, Shipping and Marine Technology, Master’s Thesis X-13/289 14
An S-N curve for welds has been used in order to obtain the relationship between stress range and number of cycles to failure. The S-N curve for welds includes the notch stress due to the weld, which makes it compatible with stresses where the notch stress from the weld is not included, see Section 2.6.
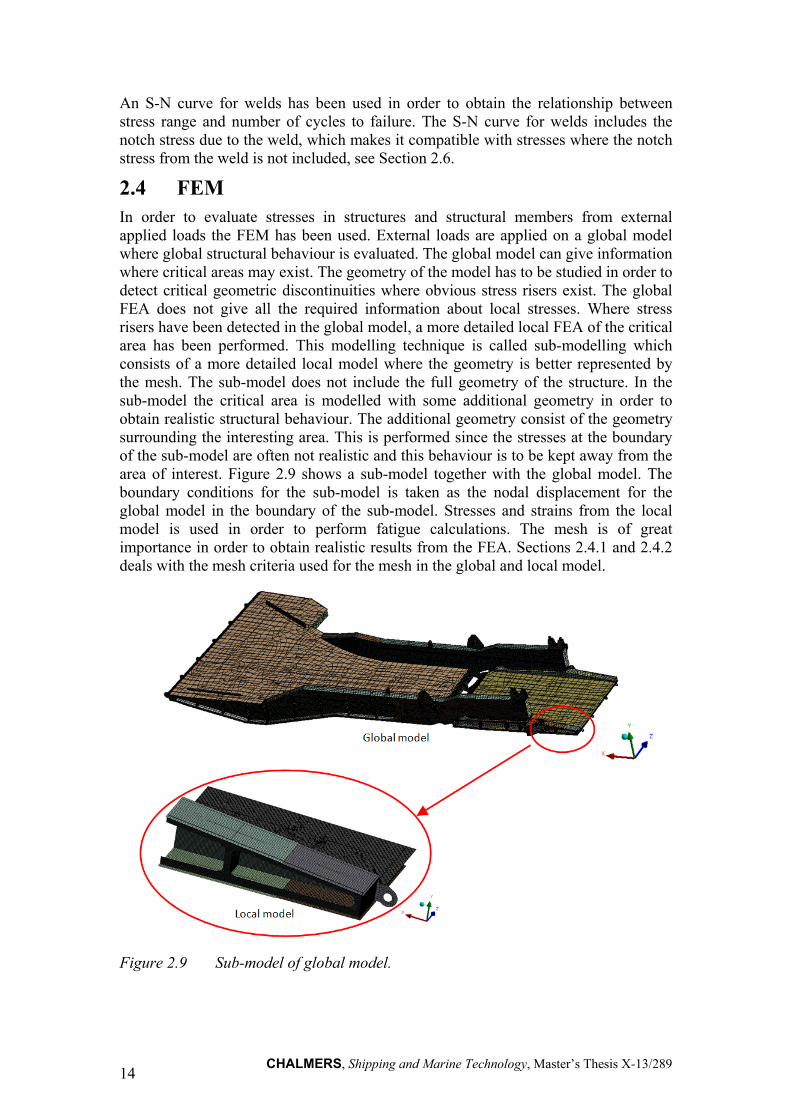
2.4 FEM In order to evaluate stresses in structures and structural members from external applied loads the FEM has been used. External loads are applied on a global model where global structural behaviour is evaluated. The global model can give information where critical areas may exist. The geometry of the model has to be studied in order to detect critical geometric discontinuities where obvious stress risers exist. The global FEA does not give all the required information about local stresses. Where stress risers have been detected in the global model, a more detailed local FEA of the critical area has been performed. This modelling technique is called sub-modelling which consists of a more detailed local model where the geometry is better represented by the mesh. The sub-model does not include the full geometry of the structure. In the sub-model the critical area is modelled with some additional geometry in order to obtain realistic structural behaviour. The additional geometry consist of the geometry surrounding the interesting area. This is performed since the stresses at the boundary of the sub-model are often not realistic and this behaviour is to be kept away from the area of interest. Figure 2.9 shows a sub-model together with the global model. The boundary conditions for the sub-model is taken as the nodal displacement for the global model in the boundary of the sub-model. Stresses and strains from the local model is used in order to perform fatigue calculations. The mesh is of great importance in order to obtain realistic results from the FEA. Sections 2.4.1 and 2.4.2 deals with the mesh criteria used for the mesh in the global and local model.
Figure 2.9 Sub-model of global model.
CHALMERS, Shipping and Marine Technology, Master’s Thesis X-13/289 15
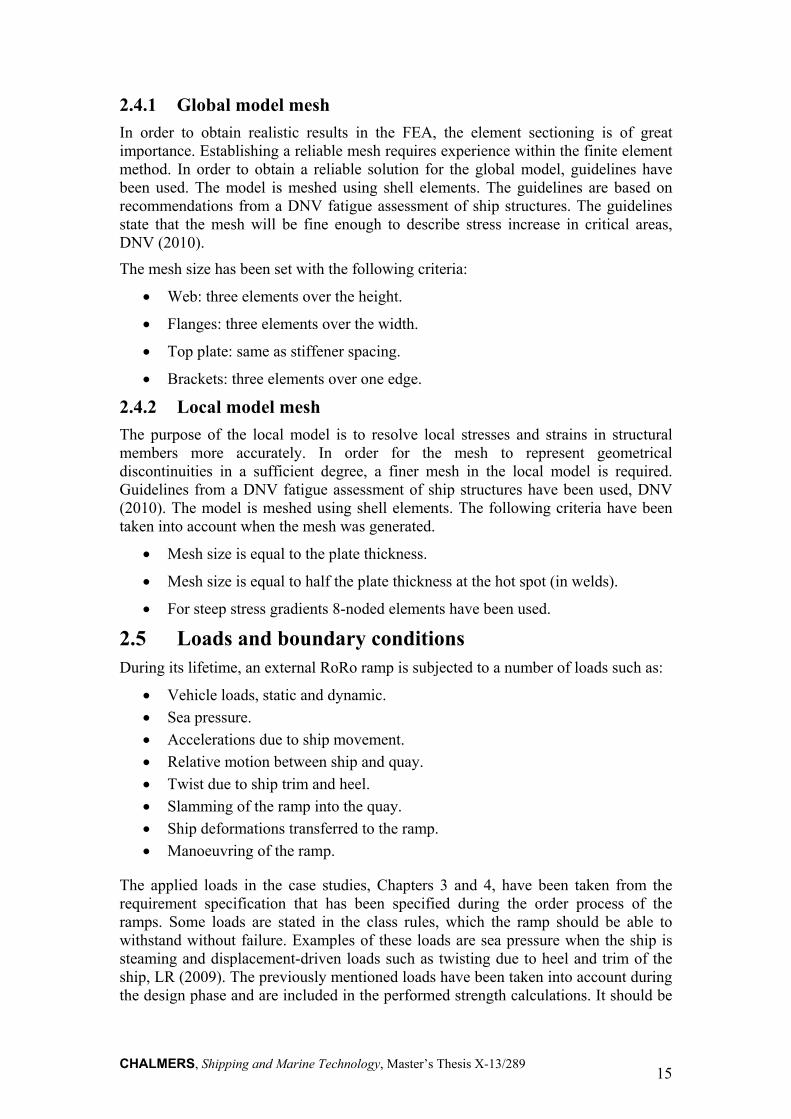
2.4.1 Global model mesh
In order to obtain realistic results in the FEA, the element sectioning is of great importance. Establishing a reliable mesh requires experience within the finite element method. In order to obtain a reliable solution for the global model, guidelines have been used. The model is meshed using shell elements. The guidelines are based on recommendations from a DNV fatigue assessment of ship structures. The guidelines state that the mesh will be fine enough to describe stress increase in critical areas, DNV (2010).
The mesh size has been set with the following criteria:
Web: three elements over the height.
Flanges: three elements over the width.
Top plate: same as stiffener spacing.
Brackets: three elements over one edge.
2.4.2 Local model mesh
The purpose of the local model is to resolve local stresses and strains in structural members more accurately. In order for the mesh to represent geometrical discontinuities in a sufficient degree, a finer mesh in the local model is required. Guidelines from a DNV fatigue assessment of ship structures have been used, DNV (2010). The model is meshed using shell elements. The following criteria have been taken into account when the mesh was generated.
Mesh size is equal to the plate thickness.
Mesh size is equal to half the plate thickness at the hot spot (in welds).
For steep stress gradients 8-noded elements have been used.
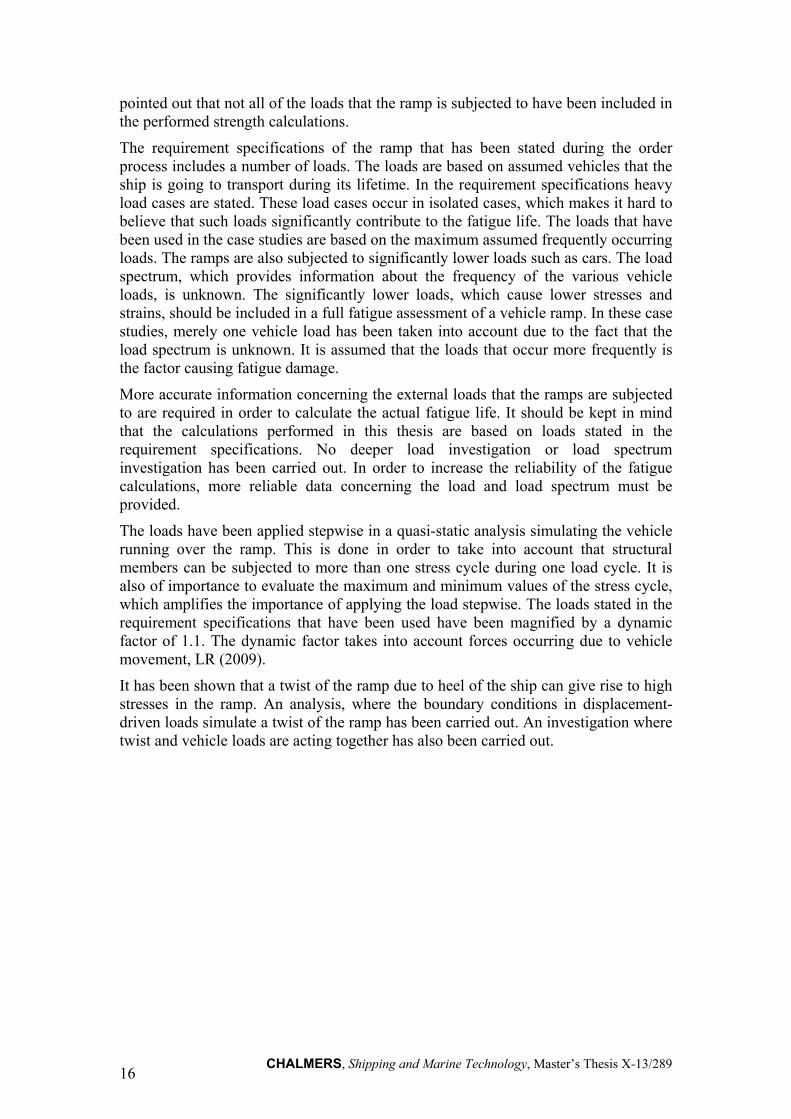
2.5 Loads and boundary conditions During its lifetime, an external RoRo ramp is subjected to a number of loads such as:
Vehicle loads, static and dynamic.
Sea pressure.
Accelerations due to ship movement.
Relative motion between ship and quay.
Twist due to ship trim and heel.
Slamming of the ramp into the quay.
Ship deformations transferred to the ramp.
Manoeuvring of the ramp.
The applied loads in the case studies, Chapters 3 and 4, have been taken from the requirement specification that has been specified during the order process of the ramps. Some loads are stated in the class rules, which the ramp should be able to withstand without failure. Examples of these loads are sea pressure when the ship is steaming and displacement-driven loads such as twisting due to heel and trim of the ship, LR (2009). The previously mentioned loads have been taken into account during the design phase and are included in the performed strength calculations. It should be
CHALMERS, Shipping and Marine Technology, Master’s Thesis X-13/289 16
pointed out that not all of the loads that the ramp is subjected to have been included in the performed strength calculations.
The requirement specifications of the ramp that has been stated during the order process includes a number of loads. The loads are based on assumed vehicles that the ship is going to transport during its lifetime. In the requirement specifications heavy load cases are stated. These load cases occur in isolated cases, which makes it hard to believe that such loads significantly contribute to the fatigue life. The loads that have been used in the case studies are based on the maximum assumed frequently occurring loads. The ramps are also subjected to significantly lower loads such as cars. The load spectrum, which provides information about the frequency of the various vehicle loads, is unknown. The significantly lower loads, which cause lower stresses and strains, should be included in a full fatigue assessment of a vehicle ramp. In these case studies, merely one vehicle load has been taken into account due to the fact that the load spectrum is unknown. It is assumed that the loads that occur more frequently is the factor causing fatigue damage.
More accurate information concerning the external loads that the ramps are subjected to are required in order to calculate the actual fatigue life. It should be kept in mind that the calculations performed in this thesis are based on loads stated in the requirement specifications. No deeper load investigation or load spectrum investigation has been carried out. In order to increase the reliability of the fatigue calculations, more reliable data concerning the load and load spectrum must be provided.
The loads have been applied stepwise in a quasi-static analysis simulating the vehicle running over the ramp. This is done in order to take into account that structural members can be subjected to more than one stress cycle during one load cycle. It is also of importance to evaluate the maximum and minimum values of the stress cycle, which amplifies the importance of applying the load stepwise. The loads stated in the requirement specifications that have been used have been magnified by a dynamic factor of 1.1. The dynamic factor takes into account forces occurring due to vehicle movement, LR (2009).
It has been shown that a twist of the ramp due to heel of the ship can give rise to high stresses in the ramp. An analysis, where the boundary conditions in displacement-driven loads simulate a twist of the ramp has been carried out. An investigation where twist and vehicle loads are acting together has also been carried out.
CHALMERS, Shipping and Marine Technology, Master’s Thesis X-13/289 17
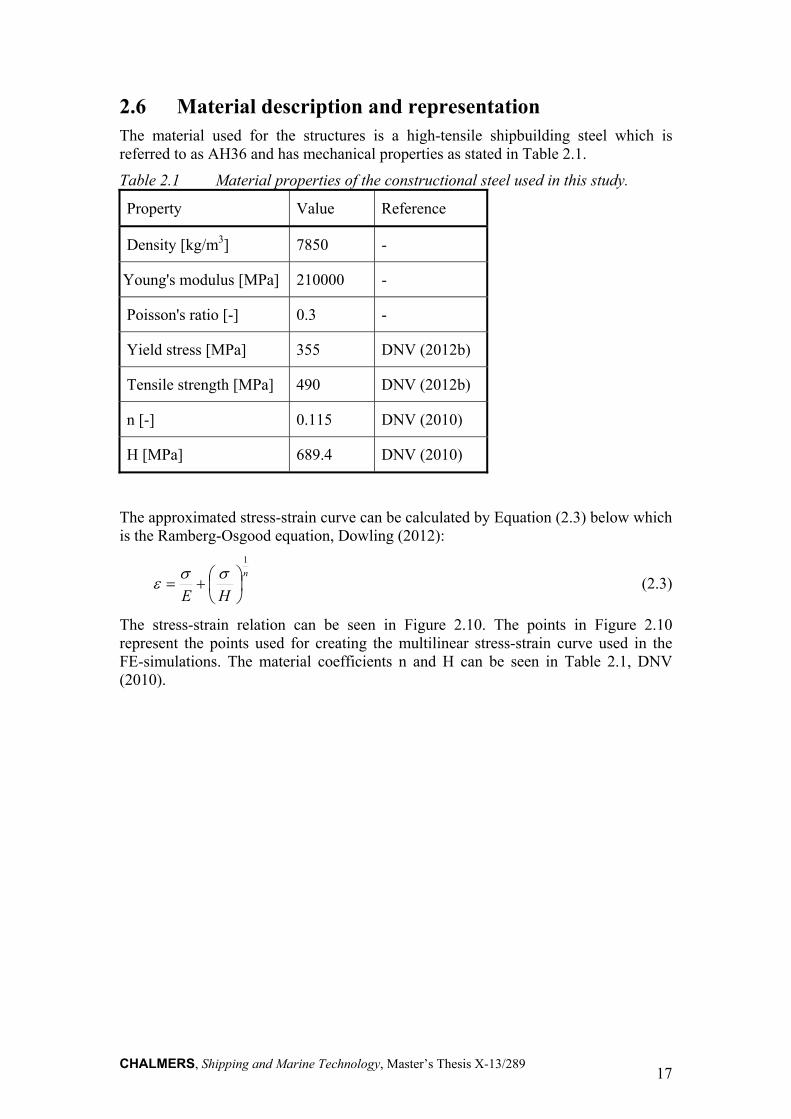
2.6 Material description and representation The material used for the structures is a high-tensile shipbuilding steel which is referred to as AH36 and has mechanical properties as stated in Table 2.1.
Table 2.1 Material properties of the constructional steel used in this study.
Property Value Reference
Density [kg/m3] 7850 -
Young's modulus [MPa] 210000 -
Poisson's ratio [-] 0.3 -
Yield stress [MPa] 355 DNV (2012b)
Tensile strength [MPa] 490 DNV (2012b)
n [-] 0.115 DNV (2010)
H [MPa] 689.4 DNV (2010)
The approximated stress-strain curve can be calculated by Equation (2.3) below which is the Ramberg-Osgood equation, Dowling (2012):
n
HE
1
(2.3)
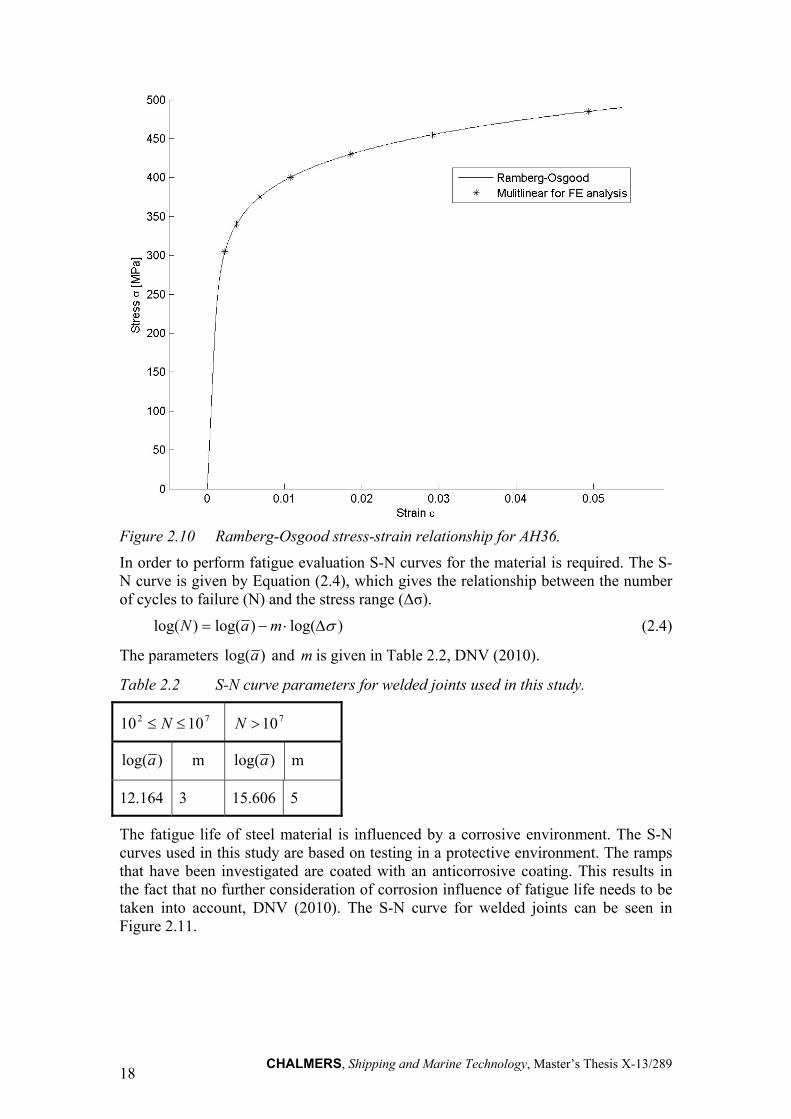
The stress-strain relation can be seen in Figure 2.10. The points in Figure 2.10 represent the points used for creating the multilinear stress-strain curve used in the FE-simulations. The material coefficients n and H can be seen in Table 2.1, DNV (2010).
CHALMERS, Shipping and Marine Technology, Master’s Thesis X-13/289 18
Figure 2.10 Ramberg-Osgood stress-strain relationship for AH36.
In order to perform fatigue evaluation S-N curves for the material is required. The S-N curve is given by Equation (2.4), which gives the relationship between the number of cycles to failure (N) and the stress range (Δσ).
)log()log()log( maN (2.4)
The parameters )log(a and m is given in Table 2.2, DNV (2010).
Table 2.2 S-N curve parameters for welded joints used in this study.
72 1010 N 710N
)log(a m )log(a m
12.164 3 15.606 5
The fatigue life of steel material is influenced by a corrosive environment. The S-N curves used in this study are based on testing in a protective environment. The ramps that have been investigated are coated with an anticorrosive coating. This results in the fact that no further consideration of corrosion influence of fatigue life needs to be taken into account, DNV (2010). The S-N curve for welded joints can be seen in Figure 2.11.

CHALMERS, Shipping and Marine Technology, Master’s Thesis X-13/289 19
Figure 2.11 S-N curve for welded joints plotted between 410 cycles and 1010 cycles
The local stress due to the weld notch is included in the S-N curve for welded joints, DNV (2010).
The S-N curve parameters that are stated in Table 2.2 are valid from 100 cycles. When the stresses are of such a magnitude that they correspond to thousands of cycles to failure in the S-N relation, usually plastic deformations occur. If plastic deformations occur a non-linear FE-analysis can be carried out in order to obtain the strain range.

CHALMERS, Shipping and Marine Technology, Master’s Thesis X-13/289 20

CHALMERS, Shipping and Marine Technology, Master’s Thesis X-13/289 21
3 Case Study 1 - Straight stern ramp In Case Study 1, the focus has been on investigating local stresses and strains in a critical area on a straight stern ramp. Images of the ramp can be seen in Figures A1 and A2 in Appendix A. The ramp is built up by a number of longitudinal beams, each beam having a small radius which is considered as the critical area, which is illustrated in Figure 3.1. This ramp design has been installed on five ships and all ramps suffer from fatigue problems in the critical area. The crack is illustrated in Figure 3.2. The FE-model for this case study is built up in order to investigate the critical area. No sub-modelling has been performed in this study since the critical area was known from before. Instead, the mesh has been configured in such a way that it will represent the geometry particularly in the critical area. The load spectrum that the ramp is subjected to is unknown. The investigation aims at evaluating the fatigue damage with respect to one assumed load cycle. Full lifetime estimations will not be applicable in this case due to an unknown load spectrum. One stress cycle investigation has been carried out in order to evaluate the stress cycle when subjected to one load cycle. The findings in the stress cycle investigation have been used for further detailed calculations of fatigue damage. The main aim is to perform a full calculation of fatigue damage for the critical area subjected to the specified applied load.
Figure 3.1: Location of the critical area on the straight stern ramp. Note that the bottom of the ramp is upward.
CHALMERS, Shipping and Marine Technology, Master’s Thesis X-13/289 22
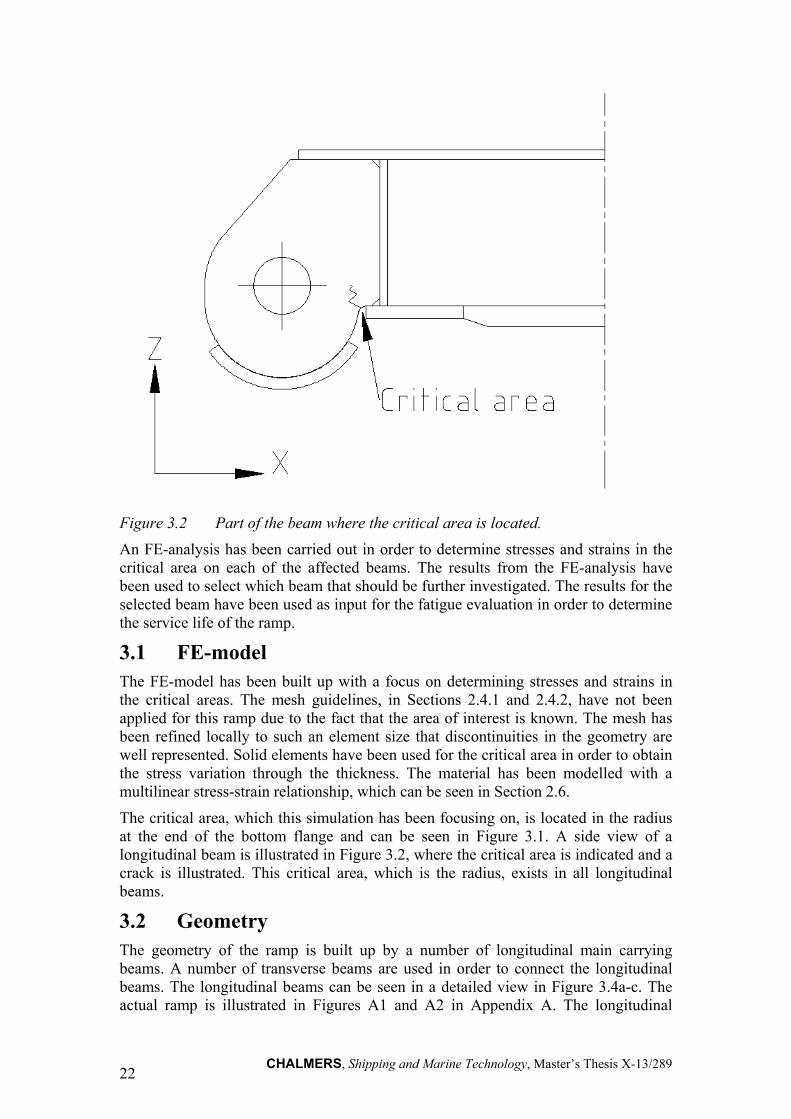
Figure 3.2 Part of the beam where the critical area is located.
An FE-analysis has been carried out in order to determine stresses and strains in the critical area on each of the affected beams. The results from the FE-analysis have been used to select which beam that should be further investigated. The results for the selected beam have been used as input for the fatigue evaluation in order to determine the service life of the ramp.
3.1 FE-model The FE-model has been built up with a focus on determining stresses and strains in the critical areas. The mesh guidelines, in Sections 2.4.1 and 2.4.2, have not been applied for this ramp due to the fact that the area of interest is known. The mesh has been refined locally to such an element size that discontinuities in the geometry are well represented. Solid elements have been used for the critical area in order to obtain the stress variation through the thickness. The material has been modelled with a multilinear stress-strain relationship, which can be seen in Section 2.6.
The critical area, which this simulation has been focusing on, is located in the radius at the end of the bottom flange and can be seen in Figure 3.1. A side view of a longitudinal beam is illustrated in Figure 3.2, where the critical area is indicated and a crack is illustrated. This critical area, which is the radius, exists in all longitudinal beams.
3.2 Geometry The geometry of the ramp is built up by a number of longitudinal main carrying beams. A number of transverse beams are used in order to connect the longitudinal beams. The longitudinal beams can be seen in a detailed view in Figure 3.4a-c. The actual ramp is illustrated in Figures A1 and A2 in Appendix A. The longitudinal

CHALMERS, Shipping and Marine Technology, Master’s Thesis X-13/289 23
beams have been numbered in order to make it possible to refer to the individual beams in the case study, which can be seen in Figure 3.3. In general, the structure is built up as a thin-walled structure. The geometry is represented by a solid 3D-model made in Autodesk® Inventor®, Autodesk (2013). Only half of the ramp is modelled due to the assumption that the rest of the main carrying beams do not contribute to the stiffness in the investigated area, since they are located so far from the applied load. This will also save computational time. The symmetry line for the ramp can be seen in Figure 3.3. The geometry has been edited in ANSYS®DesignModeler, ANSYS®(2013).
The model has been built up using both beam elements and solid elements. In Figure 3.3, the lines that are modelled using beam elements can be seen. The rest of the ramp is modelled in solid elements. The beam elements are connected to the ship and the flap, made out of solid elements, rests on the quay. In the beam elements it is of no interest to look at stresses. The beam elements are only used for contributing to the stiffness of the ramp.
Figure 3.3 Geometry of the underside of the straight stern ramp.
Table 3.1 Table of beam numbers and type of beams.
Beam number Type Beam number Type
1 L2 9 L3
2 L3 10 L3
3 L3 11 L3
4 L4 12 L4
5 L3 13 L3
6 L3 14 L3
7 L3 15 L3
8 L4 16 L4 (half)
1
15 16
14 13 12
11 10 9
87 6
54
23Quay
Ship
Section 1
Flap
Symmetry line
Beam elements
CHALMERS, Shipping and Marine Technology, Master’s Thesis X-13/289 24
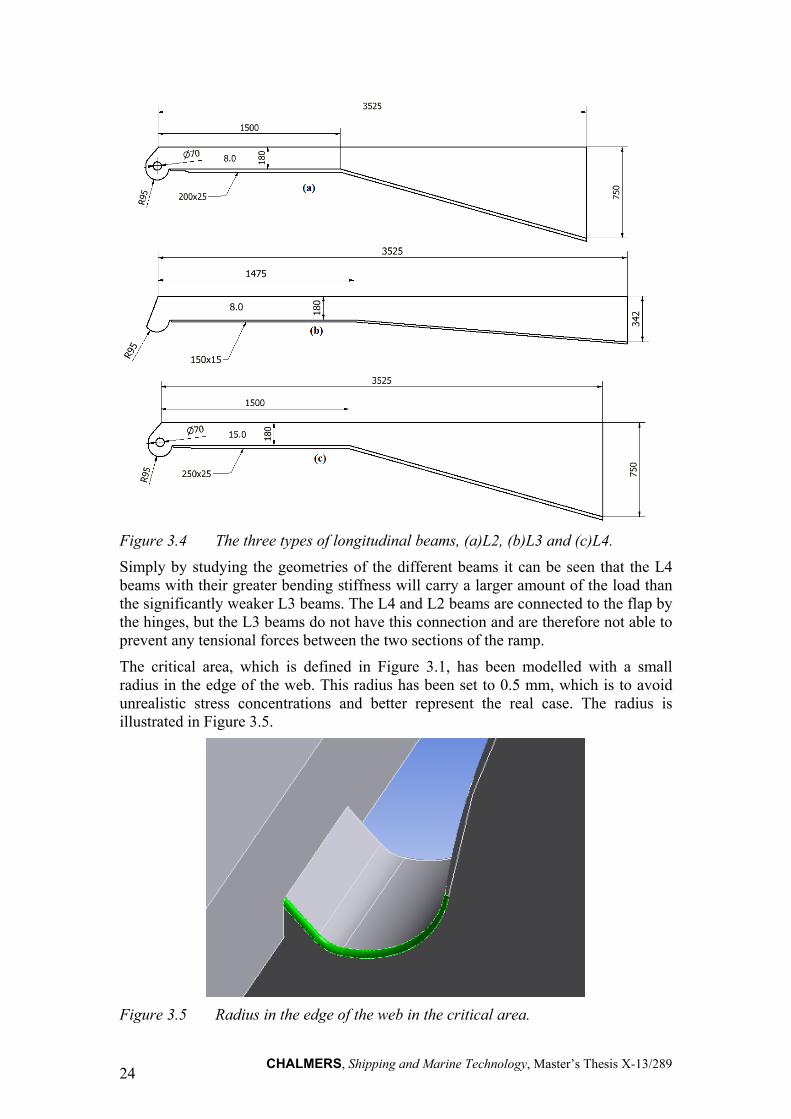
Figure 3.4 The three types of longitudinal beams, (a)L2, (b)L3 and (c)L4.
Simply by studying the geometries of the different beams it can be seen that the L4 beams with their greater bending stiffness will carry a larger amount of the load than the significantly weaker L3 beams. The L4 and L2 beams are connected to the flap by the hinges, but the L3 beams do not have this connection and are therefore not able to prevent any tensional forces between the two sections of the ramp.
The critical area, which is defined in Figure 3.1, has been modelled with a small radius in the edge of the web. This radius has been set to 0.5 mm, which is to avoid unrealistic stress concentrations and better represent the real case. The radius is illustrated in Figure 3.5.
Figure 3.5 Radius in the edge of the web in the critical area.
CHALMERS, Shipping and Marine Technology, Master’s Thesis X-13/289 25
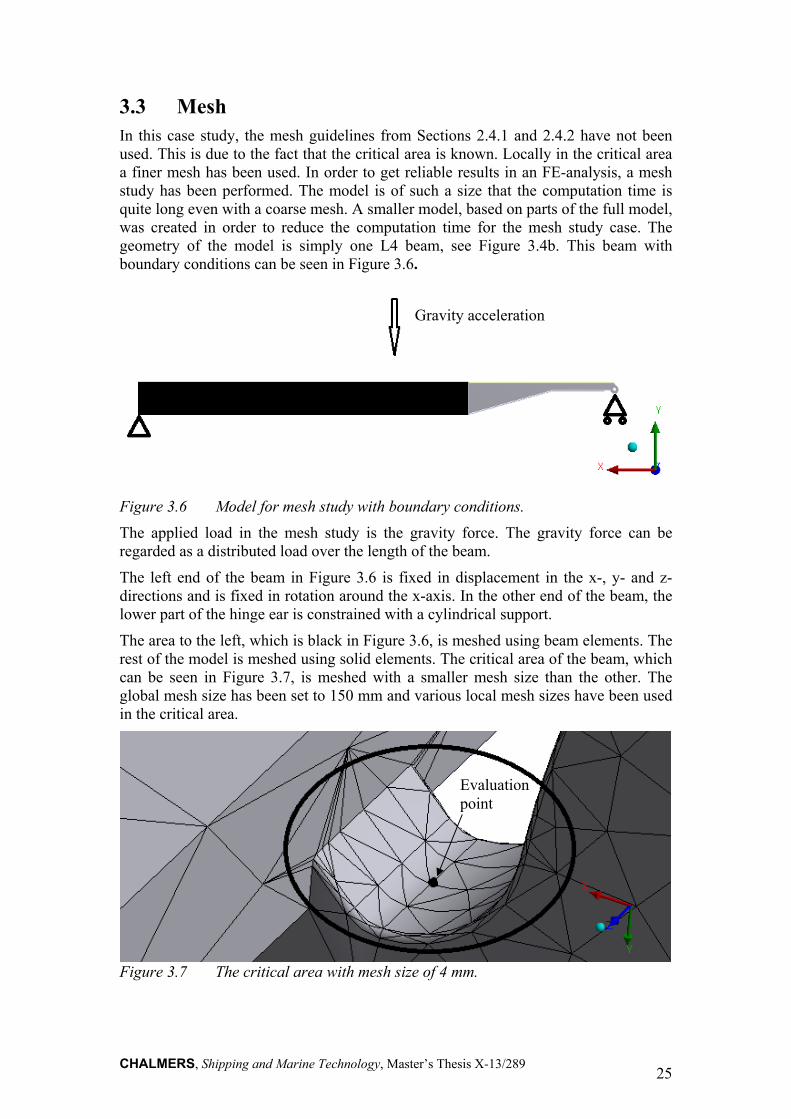
3.3 Mesh In this case study, the mesh guidelines from Sections 2.4.1 and 2.4.2 have not been used. This is due to the fact that the critical area is known. Locally in the critical area a finer mesh has been used. In order to get reliable results in an FE-analysis, a mesh study has been performed. The model is of such a size that the computation time is quite long even with a coarse mesh. A smaller model, based on parts of the full model, was created in order to reduce the computation time for the mesh study case. The geometry of the model is simply one L4 beam, see Figure 3.4b. This beam with boundary conditions can be seen in Figure 3.6.
Figure 3.6 Model for mesh study with boundary conditions.
The applied load in the mesh study is the gravity force. The gravity force can be regarded as a distributed load over the length of the beam.
The left end of the beam in Figure 3.6 is fixed in displacement in the x-, y- and z-directions and is fixed in rotation around the x-axis. In the other end of the beam, the lower part of the hinge ear is constrained with a cylindrical support.
The area to the left, which is black in Figure 3.6, is meshed using beam elements. The rest of the model is meshed using solid elements. The critical area of the beam, which can be seen in Figure 3.7, is meshed with a smaller mesh size than the other. The global mesh size has been set to 150 mm and various local mesh sizes have been used in the critical area.
Figure 3.7 The critical area with mesh size of 4 mm.
Gravity acceleration
Evaluation point

CHALMERS, Shipping and Marine Technology, Master’s Thesis X-13/289 26
A plot showing the stress in the evaluation point with respect to local mesh size was created in order to determine when the mesh size has converged. The evaluation point is located at the black point in Figure 3.7. The evaluation point in this mesh study has been chosen so that it is fixed to the geometry and is not related to the mesh at all. Neither the integration point nor element node has been chosen to be the evaluation point due to the fact that such a point location is connected to the mesh. If the evaluation point is connected to the mesh and the mesh size is changed the point will move and the evaluation point will not be fixed with respect to the geometry.
Figure 3.8 σ in the evaluation point with respect to local mesh size.
It is difficult to pick an element size with good results using Figure 3.8. The smallest mesh size that could be used with a reasonable computation time was 2.5 mm, which is the selected element size for the critical area. The mesh size for the rest of the geometry has also been varied in order to determine an acceptable mesh size with respect to the stress level. The result of this study is presented in Figure 3.9.
CHALMERS, Shipping and Marine Technology, Master’s Thesis X-13/289 27
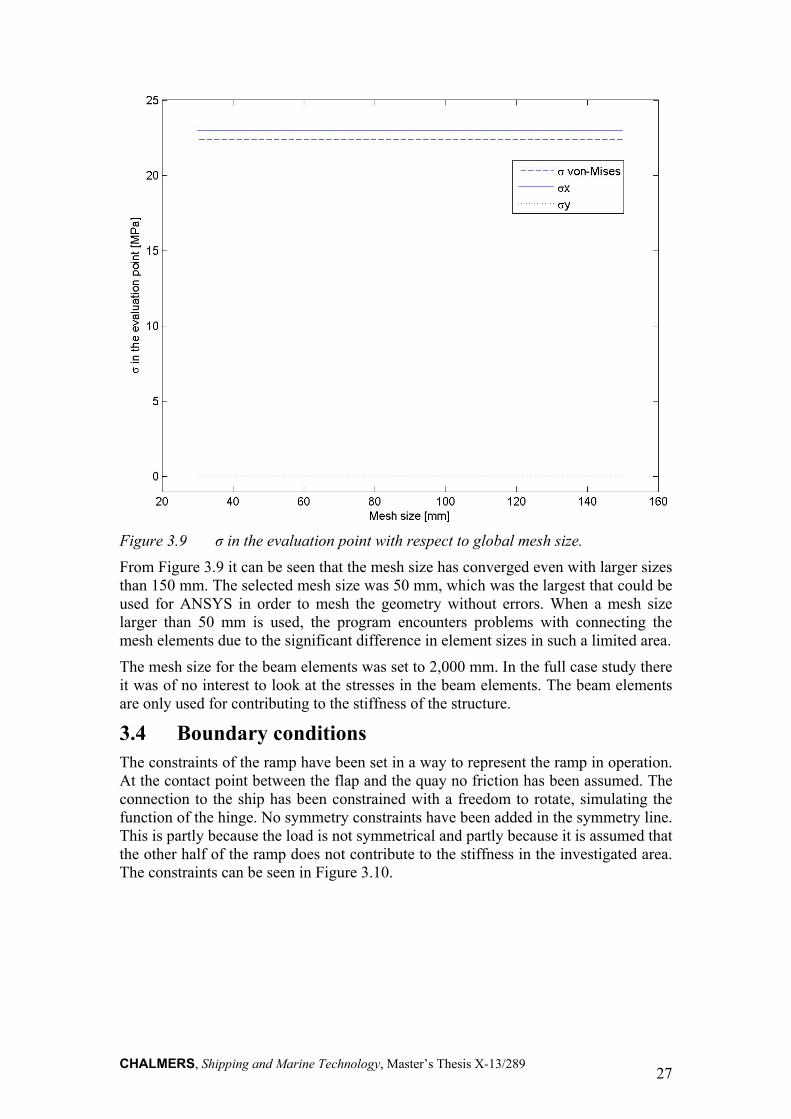
Figure 3.9 σ in the evaluation point with respect to global mesh size.
From Figure 3.9 it can be seen that the mesh size has converged even with larger sizes than 150 mm. The selected mesh size was 50 mm, which was the largest that could be used for ANSYS in order to mesh the geometry without errors. When a mesh size larger than 50 mm is used, the program encounters problems with connecting the mesh elements due to the significant difference in element sizes in such a limited area.
The mesh size for the beam elements was set to 2,000 mm. In the full case study there it was of no interest to look at the stresses in the beam elements. The beam elements are only used for contributing to the stiffness of the structure.
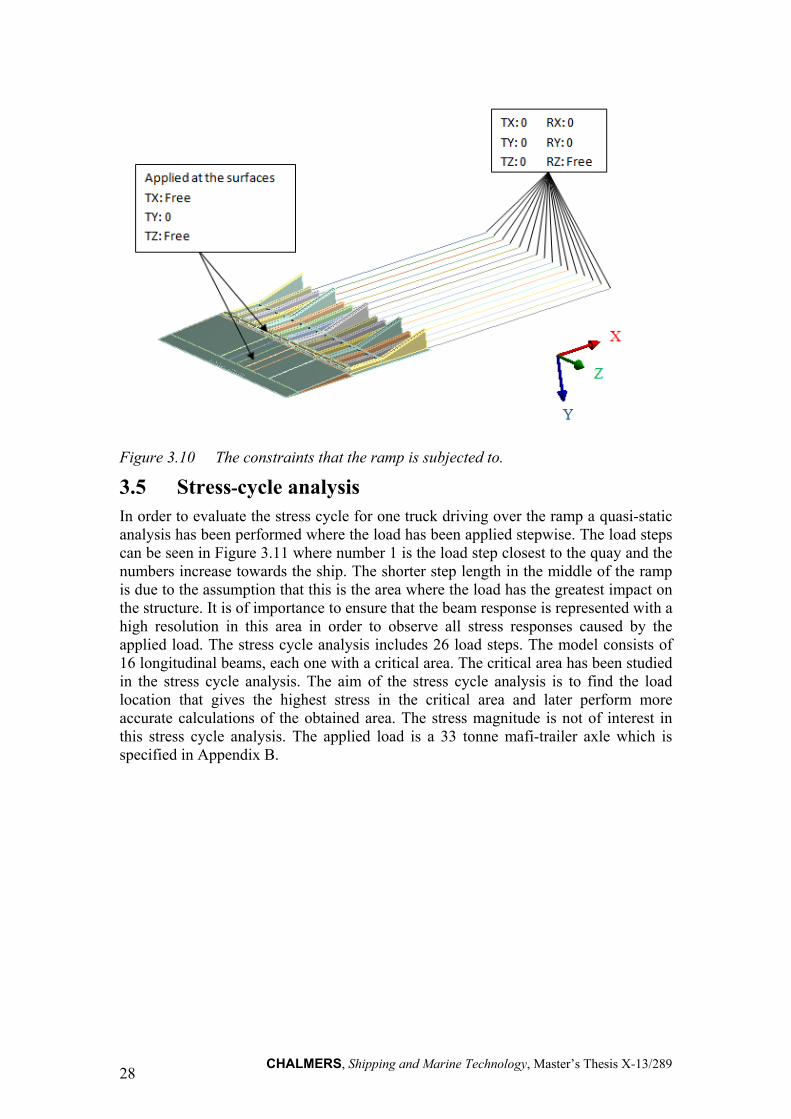
3.4 Boundary conditions The constraints of the ramp have been set in a way to represent the ramp in operation. At the contact point between the flap and the quay no friction has been assumed. The connection to the ship has been constrained with a freedom to rotate, simulating the function of the hinge. No symmetry constraints have been added in the symmetry line. This is partly because the load is not symmetrical and partly because it is assumed that the other half of the ramp does not contribute to the stiffness in the investigated area. The constraints can be seen in Figure 3.10.
CHALMERS, Shipping and Marine Technology, Master’s Thesis X-13/289 28
Figure 3.10 The constraints that the ramp is subjected to.
3.5 Stress-cycle analysis In order to evaluate the stress cycle for one truck driving over the ramp a quasi-static analysis has been performed where the load has been applied stepwise. The load steps can be seen in Figure 3.11 where number 1 is the load step closest to the quay and the numbers increase towards the ship. The shorter step length in the middle of the ramp is due to the assumption that this is the area where the load has the greatest impact on the structure. It is of importance to ensure that the beam response is represented with a high resolution in this area in order to observe all stress responses caused by the applied load. The stress cycle analysis includes 26 load steps. The model consists of 16 longitudinal beams, each one with a critical area. The critical area has been studied in the stress cycle analysis. The aim of the stress cycle analysis is to find the load location that gives the highest stress in the critical area and later perform more accurate calculations of the obtained area. The stress magnitude is not of interest in this stress cycle analysis. The applied load is a 33 tonne mafi-trailer axle which is specified in Appendix B.
CHALMERS, Shipping and Marine Technology, Master’s Thesis X-13/289 29
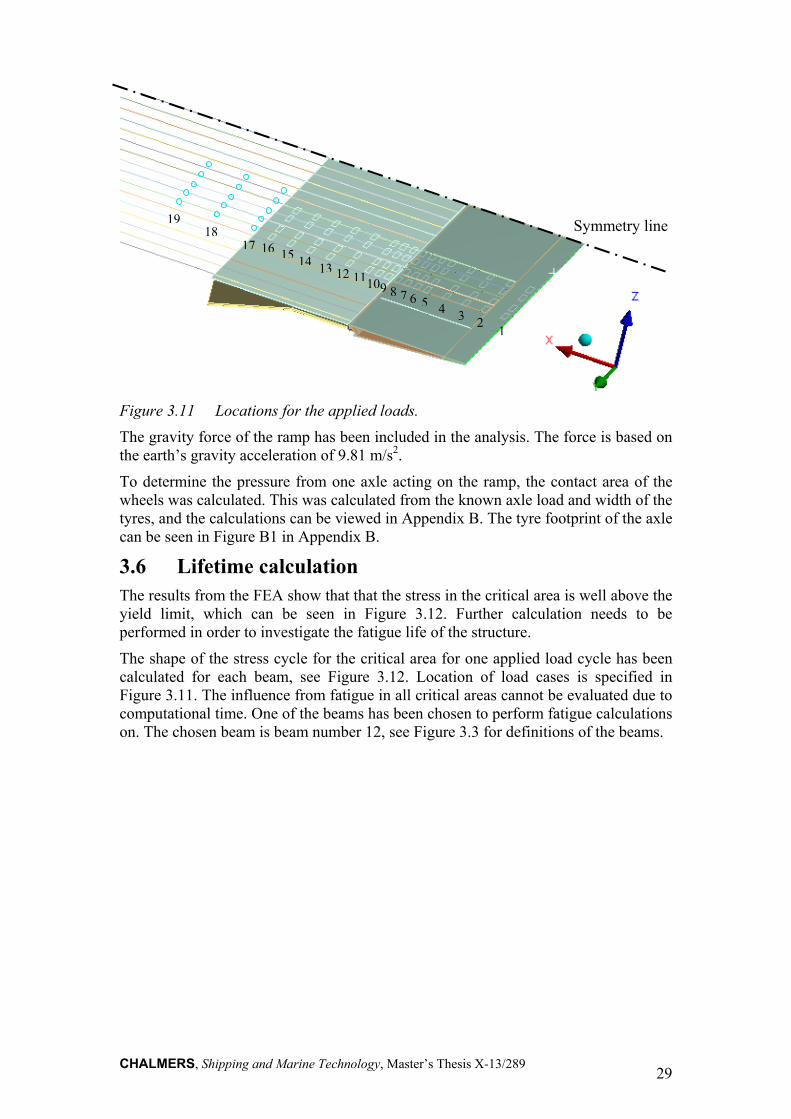
Figure 3.11 Locations for the applied loads.
The gravity force of the ramp has been included in the analysis. The force is based on the earth’s gravity acceleration of 9.81 m/s2.
To determine the pressure from one axle acting on the ramp, the contact area of the wheels was calculated. This was calculated from the known axle load and width of the tyres, and the calculations can be viewed in Appendix B. The tyre footprint of the axle can be seen in Figure B1 in Appendix B.
3.6 Lifetime calculation The results from the FEA show that that the stress in the critical area is well above the yield limit, which can be seen in Figure 3.12. Further calculation needs to be performed in order to investigate the fatigue life of the structure.
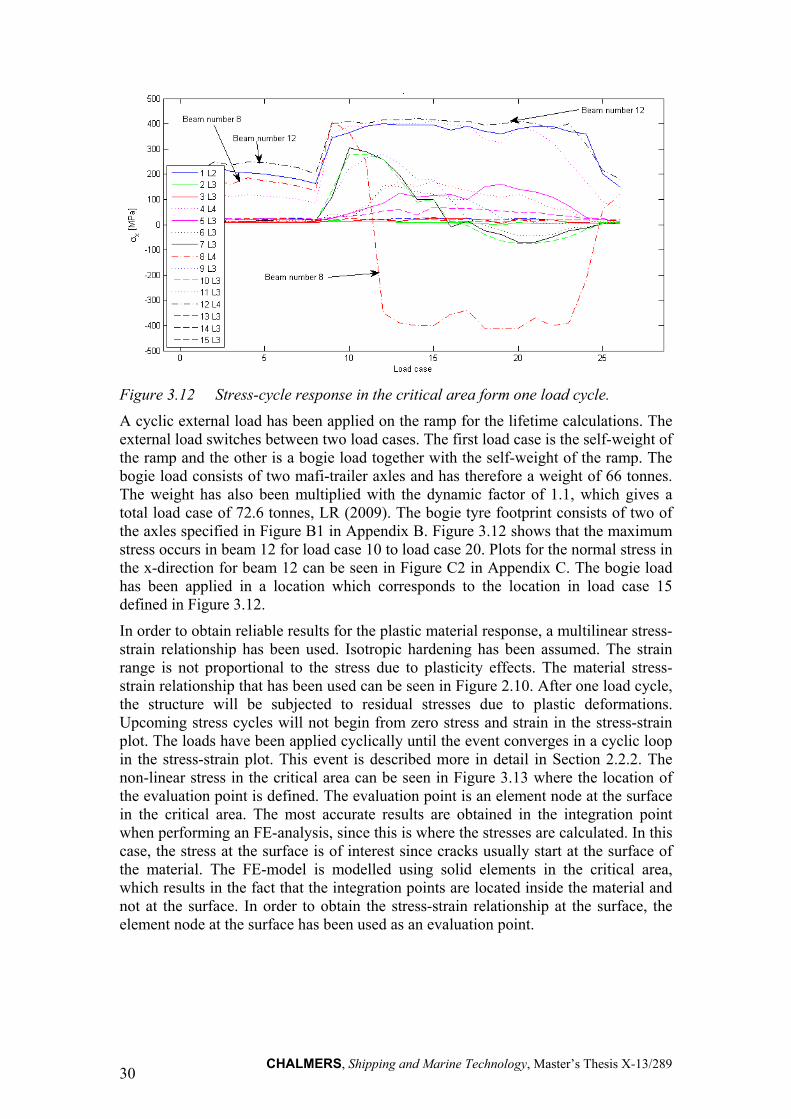
The shape of the stress cycle for the critical area for one applied load cycle has been calculated for each beam, see Figure 3.12. Location of load cases is specified in Figure 3.11. The influence from fatigue in all critical areas cannot be evaluated due to computational time. One of the beams has been chosen to perform fatigue calculations on. The chosen beam is beam number 12, see Figure 3.3 for definitions of the beams.
1234567891011121314151617
1819 Symmetry line
CHALMERS, Shipping and Marine Technology, Master’s Thesis X-13/289 30
Figure 3.12 Stress-cycle response in the critical area form one load cycle.
A cyclic external load has been applied on the ramp for the lifetime calculations. The external load switches between two load cases. The first load case is the self-weight of the ramp and the other is a bogie load together with the self-weight of the ramp. The bogie load consists of two mafi-trailer axles and has therefore a weight of 66 tonnes. The weight has also been multiplied with the dynamic factor of 1.1, which gives a total load case of 72.6 tonnes, LR (2009). The bogie tyre footprint consists of two of the axles specified in Figure B1 in Appendix B. Figure 3.12 shows that the maximum stress occurs in beam 12 for load case 10 to load case 20. Plots for the normal stress in the x-direction for beam 12 can be seen in Figure C2 in Appendix C. The bogie load has been applied in a location which corresponds to the location in load case 15 defined in Figure 3.12.
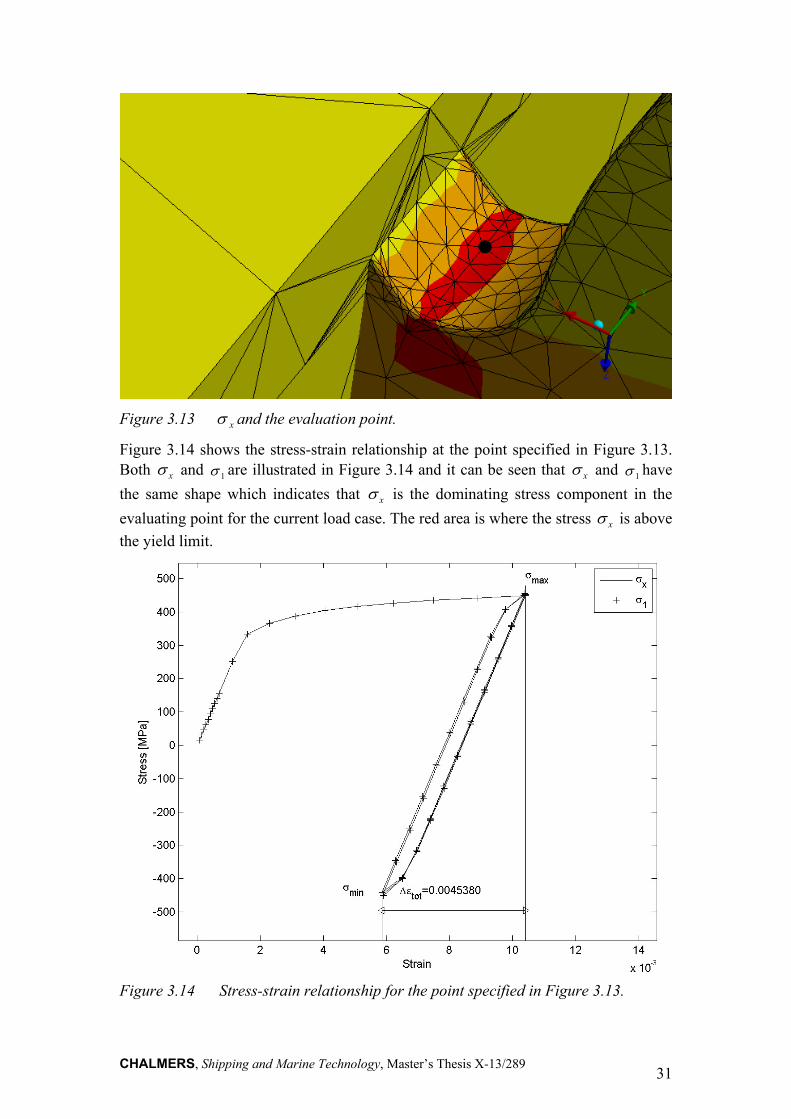
In order to obtain reliable results for the plastic material response, a multilinear stress-strain relationship has been used. Isotropic hardening has been assumed. The strain range is not proportional to the stress due to plasticity effects. The material stress-strain relationship that has been used can be seen in Figure 2.10. After one load cycle, the structure will be subjected to residual stresses due to plastic deformations. Upcoming stress cycles will not begin from zero stress and strain in the stress-strain plot. The loads have been applied cyclically until the event converges in a cyclic loop in the stress-strain plot. This event is described more in detail in Section 2.2.2. The non-linear stress in the critical area can be seen in Figure 3.13 where the location of the evaluation point is defined. The evaluation point is an element node at the surface in the critical area. The most accurate results are obtained in the integration point when performing an FE-analysis, since this is where the stresses are calculated. In this case, the stress at the surface is of interest since cracks usually start at the surface of the material. The FE-model is modelled using solid elements in the critical area, which results in the fact that the integration points are located inside the material and not at the surface. In order to obtain the stress-strain relationship at the surface, the element node at the surface has been used as an evaluation point.
CHALMERS, Shipping and Marine Technology, Master’s Thesis X-13/289 31
Figure 3.13 x and the evaluation point.
Figure 3.14 shows the stress-strain relationship at the point specified in Figure 3.13. Both x and 1 are illustrated in Figure 3.14 and it can be seen that x and 1 have
the same shape which indicates that x is the dominating stress component in the
evaluating point for the current load case. The red area is where the stress x is above
the yield limit.
Figure 3.14 Stress-strain relationship for the point specified in Figure 3.13.

CHALMERS, Shipping and Marine Technology, Master’s Thesis X-13/289 32
In order to evaluate how to further process this problem, a strain-range analysis has been carried out. The total stress range is calculated in Equation (3.1) and the strain range is calculated in Equation (3.2).
898)5.441(5.456minmax MPa (3.1)
000262.010210
898004538.0 3
EtotEtotp
Eptot
(3.2)
0.0043 10210
8983
E (3.3)
According to Equations (3.2) and (3.3), the elastic strain is of a greater magnitude than the plastic strain. This is therefore treated as a high-cycle fatigue problem, Dowling (2012). Figure 3.15 shows a number of cycles to failure in an S-N curve for the current stress range.
Figure 3.15 S-N curve where investigated load case is noted.
Figure 3.15 shows a number of cycles to failure with respect to stress range in the evaluation point specified in Figure 3.13. The number of cycles to failure in this case is 2,000 cycles when the ramp is subjected to the investigated bogie load. It can be seen in Equation (3.1) that the maximum stress is very close to the ultimate strength. Overloads due to high vehicle velocity or ramp slamming in the quay can cause stress, which exceeds the ultimate strength locally. These high stresses can cause cracks due to fracture locally and not due to fatigue. It should also be pointed out that 2,000 cycles to failure is low for this type of structure.

CHALMERS, Shipping and Marine Technology, Master’s Thesis X-13/289 33
In Figure 3.12 and in Figure C1 in Appendix C it can be seen that beam number 8 is exposed to a shift from tension to compression dependent on the load location. In order to evaluate the stress range for the critical area in this beam, a stress-strain relationship simulation has been performed for this area. The same bogie load used for the earlier calculations has been used as load. In this case, the bogie load has been applied at a location shifting between load step 9 and load step 15. The load steps are specified in Figure 3.11.
Figure 3.17 Stress-strain relationship for the critical area in beam number 8.
In Figure 3.17 it can be seen that the stress range is 770 MPa in the critical area in beam number 8. The stress range for the critical area in beam number 12 is 898 MPa, which can be seen in Figure 3.14. The strain range is greater in the critical area in beam number 12, which results in the fatigue life being shorter for beam number 12, even though the stress range is almost doubled in the critical area in beam number 8 in the initial cycle.
In the critical area the normal stress σx is above the yield point in the initial stress cycle. In the following stress cycles the stress-strain relationship is treated as linear-elastic due to material hardening effects. The fatigue life in the critical area was found to be 2,000 cycles using a heavy, frequently occurring load case stated in the requirement specifications of the ramp. In general, it can be said that the fatigue life based on this load case is short. The deadweight of the ship to which the ramp in this case study is attached is 14,330 tonnes. It is assumed that the bogie load in this case study is equal to the container weight, which is 66 tonnes. This results in a case where the ship can carry 217 containers, which corresponds to 434 load cycles for one voyage including loading and offloading. Using this information it is found that the ship cannot make five voyages with this load spectrum before fatigue failure occurs. This is based on the assumption that the ship is only carrying heavy load trailers, which might not be realistic.

CHALMERS, Shipping and Marine Technology, Master’s Thesis X-13/289 34

CHALMERS, Shipping and Marine Technology, Master’s Thesis X-13/289 35
4 Case Study 2 - Quarter ramp In this case study, focus has been set on detecting potential critical areas and evaluating them from a fatigue point of view. A quarter-ramp designed by MacGREGOR has been studied in this case study. Images of this ramp can be seen in Figures A3 and A4 in Appendix A. The study has been carried out by first calculating the stresses and strains for the entire ramp in a global simulation with various load cases. The results from the global analysis are then used for finding areas where high local stresses may exist and for making local sub-models of these areas for more accurate evaluation of the stresses. The areas for sub-modelling are selected because they have high local stresses, the mesh is too coarse to resemble the geometry or because there are other reasons for believing that there are high stress concentrations in these areas. The stresses are then used for calculating the fatigue life of the structure. The method used for the analysis is described more in detail in Section 1.3. This case study has not investigated all potential critical areas. Instead, it gives examples of a few different types of areas of interest for sub-modelling.
4.1 FE-model The FE-model consists of one global model, in which the external loads have been applied. The material has been modelled with a linear elastic relation. The mesh in the global model has been configured according to the mesh guidelines in Chapter 2.4.1. The global mesh is not sufficiently detailed in order to evaluate stresses and strains with sufficient accuracy to perform fatigue evaluation. The FE-model on the global scale has been used for evaluating areas with stresses of such a magnitude that fatigue problems may occur locally. In order to evaluate these areas, sub-models of the local structure have been created in order to obtain stresses and strains for fatigue evaluation. The mesh on the sub-model has been configured according to guidelines in Chapter 2.4.2. It should be pointed out that the FE-solution will not detect all critical areas by itself - engineering skills in structural behaviour are needed. It is of great importance to be able to detect potential critical areas by studying the geometry. It is also important to detect areas where the mesh is too coarse to describe the geometry, since the result in these areas may be inaccurate.
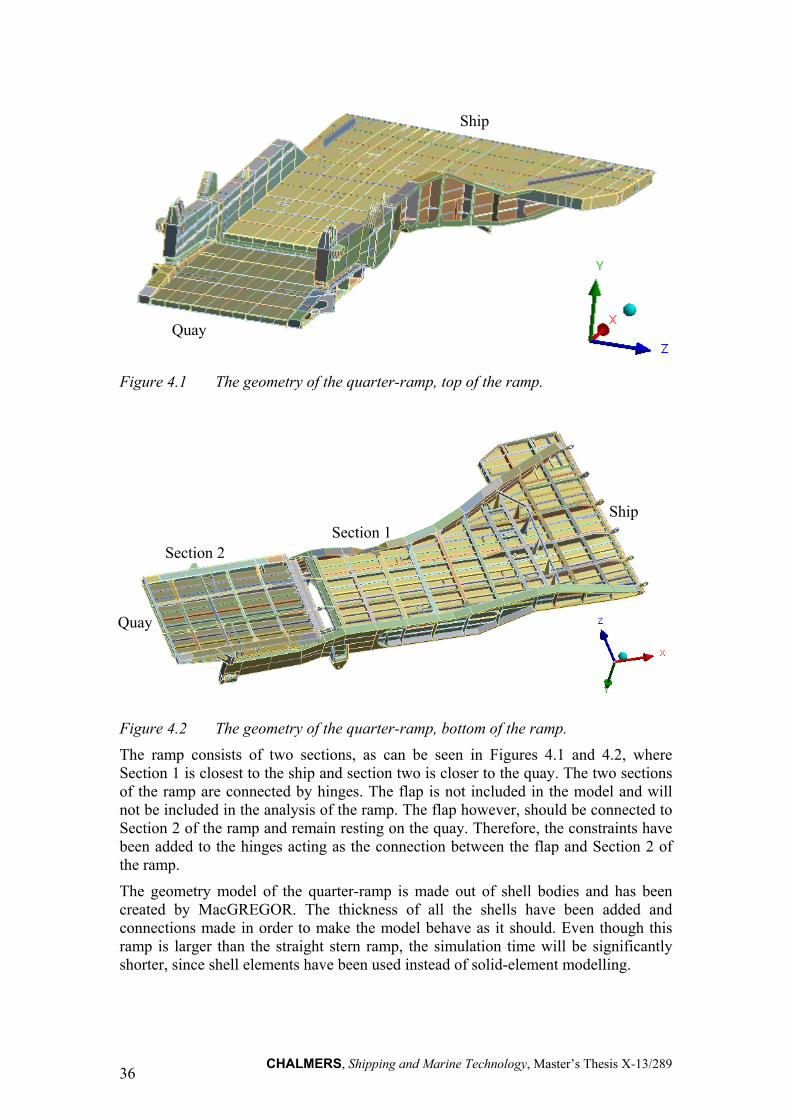
4.2 Geometry The geometry of the ramp can be viewed in Figure 4.1. The main structure of the quarter ramp consists of two large longitudinal beams, one on each side of the ramp. Between these side beams there are transverse and longitudinal beams forming a square pattern.
The ramp is not symmetric - instead it is wider at the side towards the ship and therefore the side beam on the starboard side of the ramp is not straight. This geometry may give rise to stress concentrations, since there are some extra notches and sharp corners due to the complicated shape of the ramp. In Figure 4.2 the underside of the ramp can be viewed with all longitudinal and transverse beams visible.
CHALMERS, Shipping and Marine Technology, Master’s Thesis X-13/289 36
Figure 4.1 The geometry of the quarter-ramp, top of the ramp.
Figure 4.2 The geometry of the quarter-ramp, bottom of the ramp.
The ramp consists of two sections, as can be seen in Figures 4.1 and 4.2, where Section 1 is closest to the ship and section two is closer to the quay. The two sections of the ramp are connected by hinges. The flap is not included in the model and will not be included in the analysis of the ramp. The flap however, should be connected to Section 2 of the ramp and remain resting on the quay. Therefore, the constraints have been added to the hinges acting as the connection between the flap and Section 2 of the ramp.
The geometry model of the quarter-ramp is made out of shell bodies and has been created by MacGREGOR. The thickness of all the shells have been added and connections made in order to make the model behave as it should. Even though this ramp is larger than the straight stern ramp, the simulation time will be significantly shorter, since shell elements have been used instead of solid-element modelling.
Quay
Ship
Section 1 Section 2
Quay
Ship
CHALMERS, Shipping and Marine Technology, Master’s Thesis X-13/289 37
4.3 Loads The ramp has been designed with consideration to a few different load cases specified by the shipowner. The ramp should be able to withstand these loads together with the load due to a 5°-heel of the ship, since the heel angle can come to change during loading and offloading of the ship, LR (2009). However, MacGREGOR specifies that the maximum allowed heel angle during loading and offloading is to be 3°. Therefore, the simulation in this study has only considered the 3° heel angle and not a 5° heel angle. Since the ramp is not symmetrical, the heel twist of the ramp has to be applied at both directions to evaluate which case is the worst in combination with the applied load.
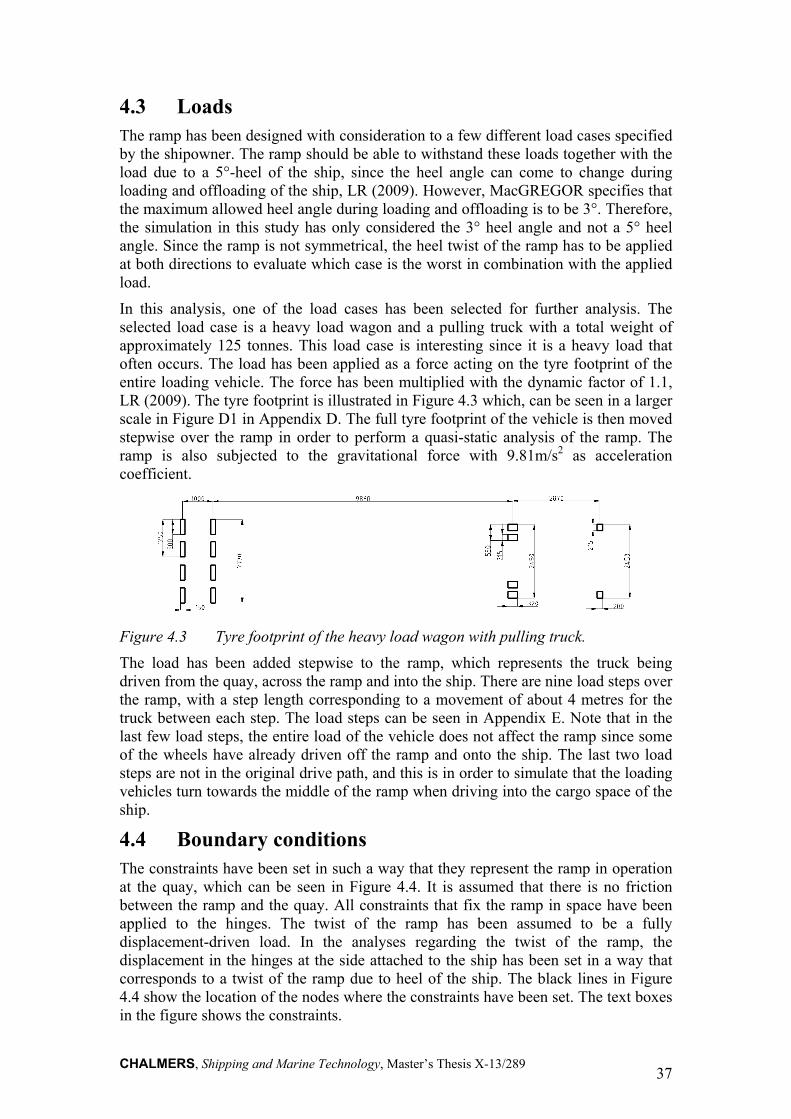
In this analysis, one of the load cases has been selected for further analysis. The selected load case is a heavy load wagon and a pulling truck with a total weight of approximately 125 tonnes. This load case is interesting since it is a heavy load that often occurs. The load has been applied as a force acting on the tyre footprint of the entire loading vehicle. The force has been multiplied with the dynamic factor of 1.1, LR (2009). The tyre footprint is illustrated in Figure 4.3 which, can be seen in a larger scale in Figure D1 in Appendix D. The full tyre footprint of the vehicle is then moved stepwise over the ramp in order to perform a quasi-static analysis of the ramp. The ramp is also subjected to the gravitational force with 9.81m/s2 as acceleration coefficient.
Figure 4.3 Tyre footprint of the heavy load wagon with pulling truck.
The load has been added stepwise to the ramp, which represents the truck being driven from the quay, across the ramp and into the ship. There are nine load steps over the ramp, with a step length corresponding to a movement of about 4 metres for the truck between each step. The load steps can be seen in Appendix E. Note that in the last few load steps, the entire load of the vehicle does not affect the ramp since some of the wheels have already driven off the ramp and onto the ship. The last two load steps are not in the original drive path, and this is in order to simulate that the loading vehicles turn towards the middle of the ramp when driving into the cargo space of the ship.
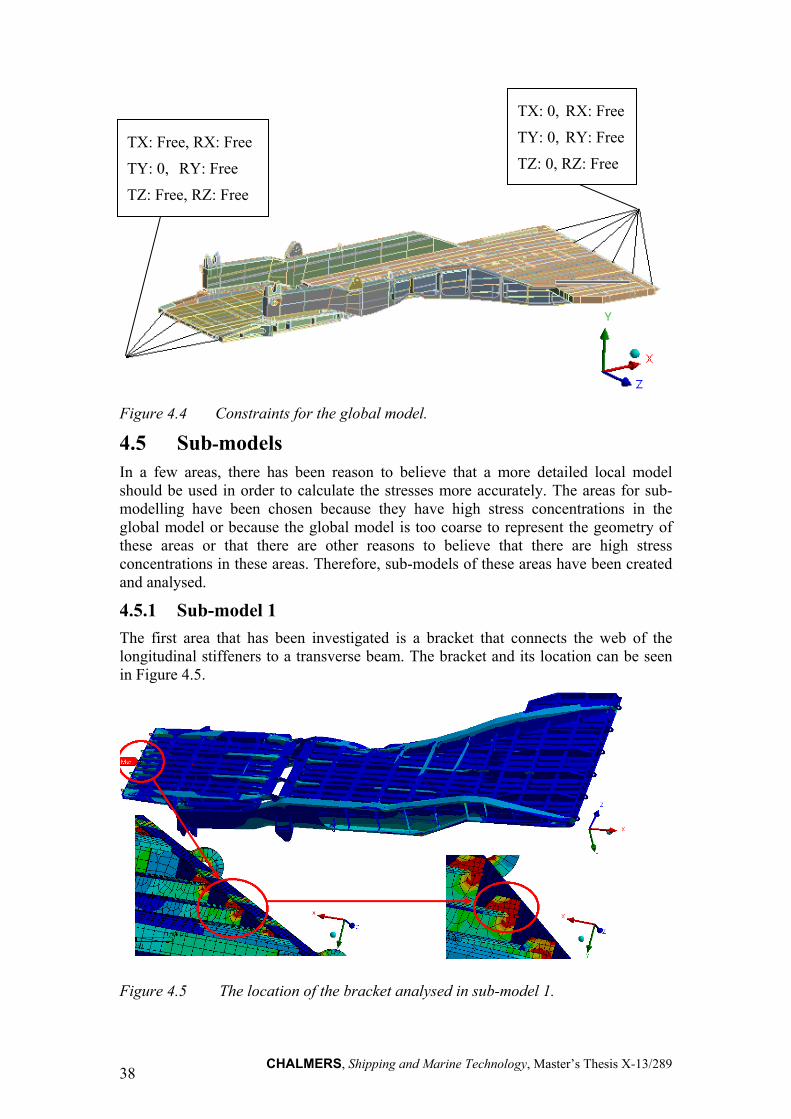
4.4 Boundary conditions The constraints have been set in such a way that they represent the ramp in operation at the quay, which can be seen in Figure 4.4. It is assumed that there is no friction between the ramp and the quay. All constraints that fix the ramp in space have been applied to the hinges. The twist of the ramp has been assumed to be a fully displacement-driven load. In the analyses regarding the twist of the ramp, the displacement in the hinges at the side attached to the ship has been set in a way that corresponds to a twist of the ramp due to heel of the ship. The black lines in Figure 4.4 show the location of the nodes where the constraints have been set. The text boxes in the figure shows the constraints.
CHALMERS, Shipping and Marine Technology, Master’s Thesis X-13/289 38
Figure 4.4 Constraints for the global model.
4.5 Sub-models In a few areas, there has been reason to believe that a more detailed local model should be used in order to calculate the stresses more accurately. The areas for sub-modelling have been chosen because they have high stress concentrations in the global model or because the global model is too coarse to represent the geometry of these areas or that there are other reasons to believe that there are high stress concentrations in these areas. Therefore, sub-models of these areas have been created and analysed.
4.5.1 Sub-model 1
The first area that has been investigated is a bracket that connects the web of the longitudinal stiffeners to a transverse beam. The bracket and its location can be seen in Figure 4.5.
Figure 4.5 The location of the bracket analysed in sub-model 1.
TX: Free, RX: Free
TY: 0, RY: Free
TZ: Free, RZ: Free
TX: 0, RX: Free
TY: 0, RY: Free
TZ: 0, RZ: Free
CHALMERS, Shipping and Marine Technology, Master’s Thesis X-13/289 39
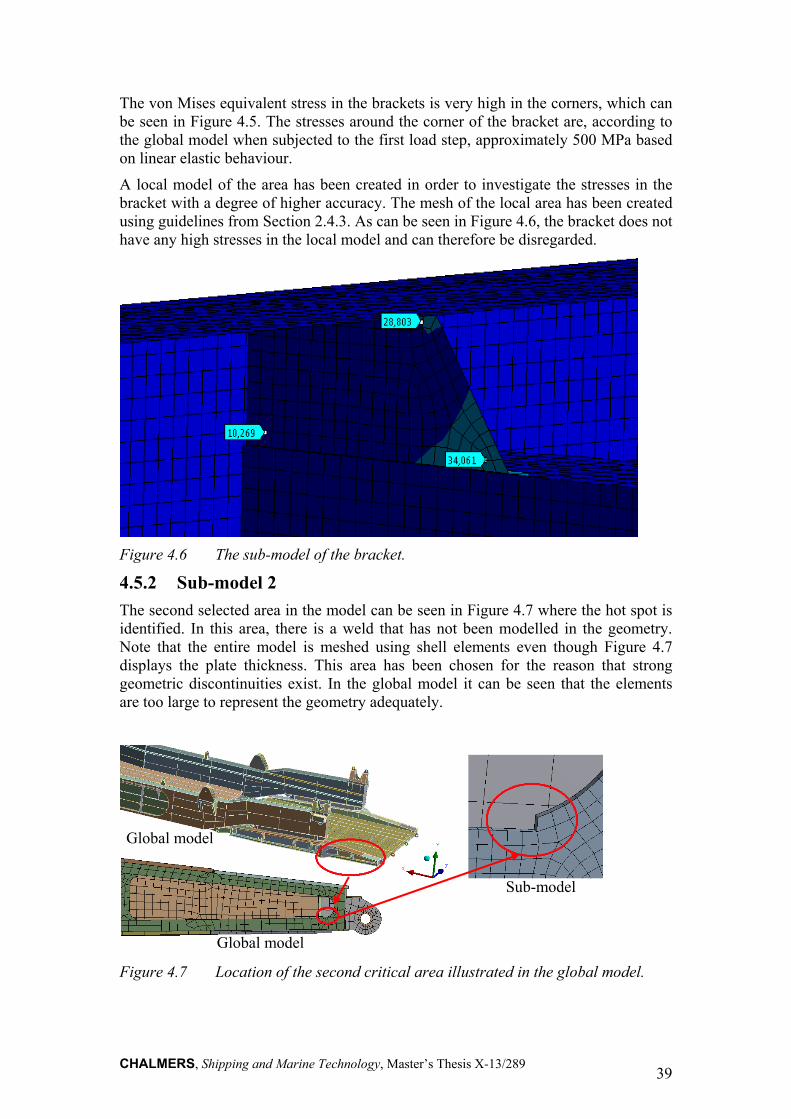
The von Mises equivalent stress in the brackets is very high in the corners, which can be seen in Figure 4.5. The stresses around the corner of the bracket are, according to the global model when subjected to the first load step, approximately 500 MPa based on linear elastic behaviour.
A local model of the area has been created in order to investigate the stresses in the bracket with a degree of higher accuracy. The mesh of the local area has been created using guidelines from Section 2.4.3. As can be seen in Figure 4.6, the bracket does not have any high stresses in the local model and can therefore be disregarded.
Figure 4.6 The sub-model of the bracket.
4.5.2 Sub-model 2
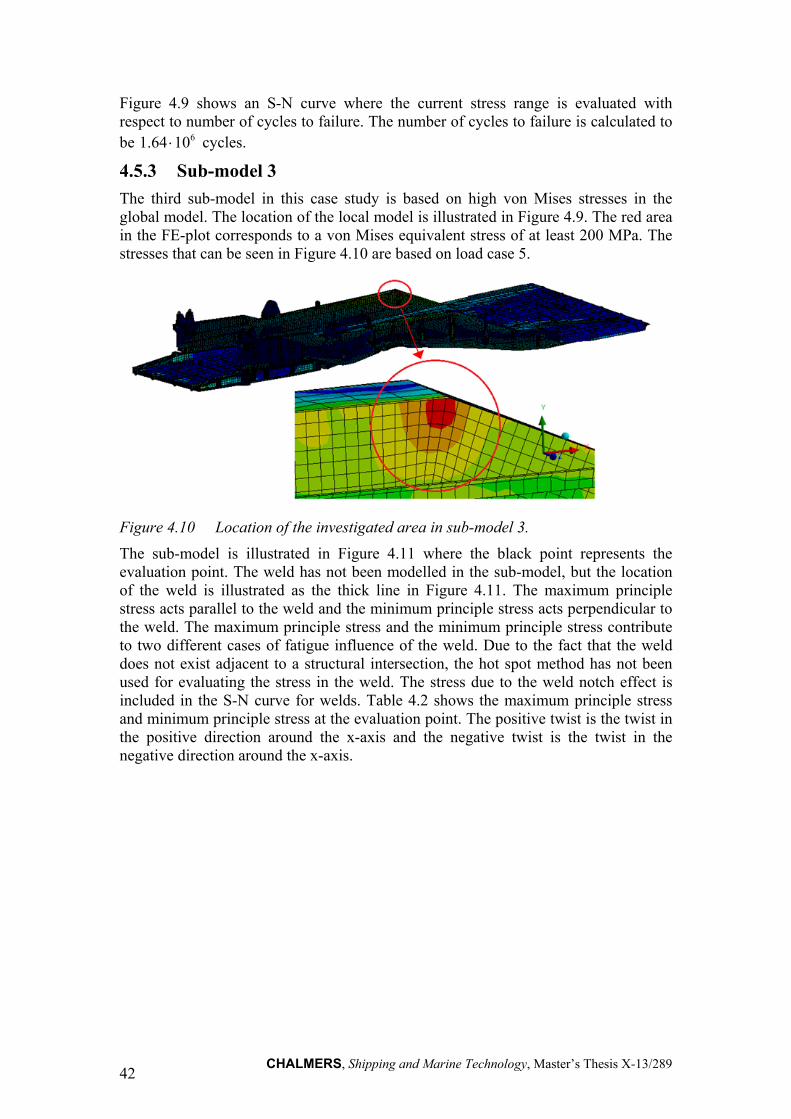
The second selected area in the model can be seen in Figure 4.7 where the hot spot is identified. In this area, there is a weld that has not been modelled in the geometry. Note that the entire model is meshed using shell elements even though Figure 4.7 displays the plate thickness. This area has been chosen for the reason that strong geometric discontinuities exist. In the global model it can be seen that the elements are too large to represent the geometry adequately.
Figure 4.7 Location of the second critical area illustrated in the global model.
Sub-model
Global model
Global model

CHALMERS, Shipping and Marine Technology, Master’s Thesis X-13/289 40
The hot spot area consists of a weld, and the hot spot stress has been calculated according to Section 2.3.2. Figure 4.8 shows the principal stress with respect to the distance from the hot spot location where the load is a 3° twist in the positive direction around the x-axis of the ramp, which occurs when the ship has a heel angle of 3° during operation of the ramp.
Figure 4.8 Hot spot extrapolation with an applied load of a 3°- twist.
The same procedure has been used for calculating the hot spot principle stress for the remaining load cases. The results of these calculations are presented in Table 4.1.

CHALMERS, Shipping and Marine Technology, Master’s Thesis X-13/289 41
Table 4.1 Calculated hot spot principle stress with respect to load case.
Load case Loads Hot spot principle stress [MPa]
References Appendix F
1 Twist and load step 1 438 Figure F1
2 Twist 3° 376 Figure F2
3 Load step 1 145 Figure F3
4 Load step 2 162 Figure F4
5 Load step 3 179 Figure F5
6 Load step 4 162 Figure F6
7 Self weight only 83 Figure F7
No further realistic life estimations can be performed due to the fact the load spectrum is unknown. The fatigue damage for one truck driving over the ramp has been calculated. From Table 4.1 it can be seen that the maximum stress due to truck load is presented in load step 3, which is 179 MPa. The self weight of the ramp results in a stress magnitude of 83 MPa. The stress range is calculated in Equation (4.1).
MPa 968317975 LCLC (4.1)
Figure 4.9 S-N curve with the stress range and number of cycles to failure.
CHALMERS, Shipping and Marine Technology, Master’s Thesis X-13/289 42
Figure 4.9 shows an S-N curve where the current stress range is evaluated with respect to number of cycles to failure. The number of cycles to failure is calculated to be 61064.1 cycles.
4.5.3 Sub-model 3
The third sub-model in this case study is based on high von Mises stresses in the global model. The location of the local model is illustrated in Figure 4.9. The red area in the FE-plot corresponds to a von Mises equivalent stress of at least 200 MPa. The stresses that can be seen in Figure 4.10 are based on load case 5.
Figure 4.10 Location of the investigated area in sub-model 3.
The sub-model is illustrated in Figure 4.11 where the black point represents the evaluation point. The weld has not been modelled in the sub-model, but the location of the weld is illustrated as the thick line in Figure 4.11. The maximum principle stress acts parallel to the weld and the minimum principle stress acts perpendicular to the weld. The maximum principle stress and the minimum principle stress contribute to two different cases of fatigue influence of the weld. Due to the fact that the weld does not exist adjacent to a structural intersection, the hot spot method has not been used for evaluating the stress in the weld. The stress due to the weld notch effect is included in the S-N curve for welds. Table 4.2 shows the maximum principle stress and minimum principle stress at the evaluation point. The positive twist is the twist in the positive direction around the x-axis and the negative twist is the twist in the negative direction around the x-axis.
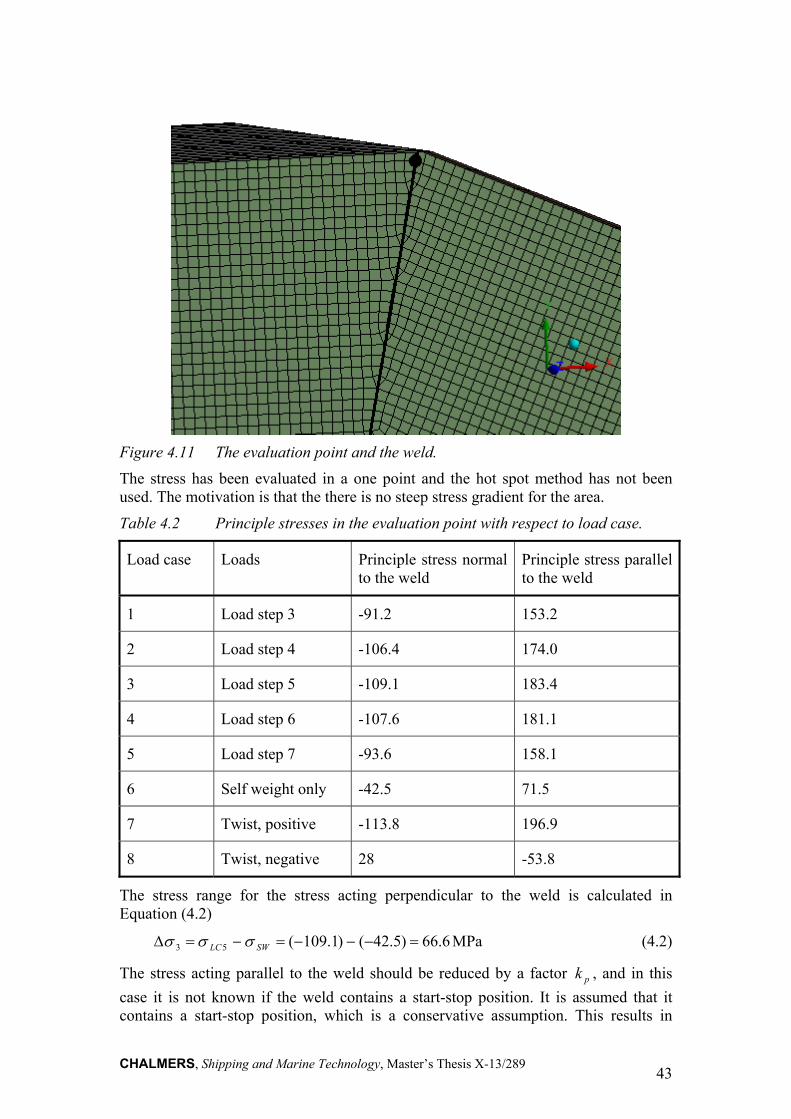
CHALMERS, Shipping and Marine Technology, Master’s Thesis X-13/289 43
Figure 4.11 The evaluation point and the weld.
The stress has been evaluated in a one point and the hot spot method has not been used. The motivation is that the there is no steep stress gradient for the area.
Table 4.2 Principle stresses in the evaluation point with respect to load case.
Load case Loads Principle stress normal to the weld
Principle stress parallel to the weld
1 Load step 3 -91.2 153.2
2 Load step 4 -106.4 174.0
3 Load step 5 -109.1 183.4
4 Load step 6 -107.6 181.1
5 Load step 7 -93.6 158.1
6 Self weight only -42.5 71.5
7 Twist, positive -113.8 196.9
8 Twist, negative 28 -53.8
The stress range for the stress acting perpendicular to the weld is calculated in Equation (4.2)
6.66)5.42()1.109(53 SWLC MPa (4.2)
The stress acting parallel to the weld should be reduced by a factor pk , and in this
case it is not known if the weld contains a start-stop position. It is assumed that it contains a start-stop position, which is a conservative assumption. This results in

CHALMERS, Shipping and Marine Technology, Master’s Thesis X-13/289 44
9.0pk , DNV (2010). The adjusted maximum principle stress range acting parallel
to the weld is calculated in Equation (4.3).
7.1009.0)5.714.183()( 51 pSWLC k MPa (4.3)
It can be seen that the adjusted stress range for the stress parallel to the weld is the greater one. This results in 1 being the limiting stress range. The number of cycles to failure can be seen in Figure 4.12. The number of cycles to failure is
61043.1 cycles for the specified vehicle.
Figure 4.12 Fatigue evaluation for sub-model 3.
In order to investigate the influence of overloads of the ramp, an investigation where the load has been increased stepwise has been carried out. The load has been increased by 10%, 20%, 30% and 50% based on load case 3, which is stated in Table 4.2. The stresses for the overload have been evaluated at the same point as before. The fatigue life has been evaluated using an S-N curve, which can be seen in Figure 4.12.
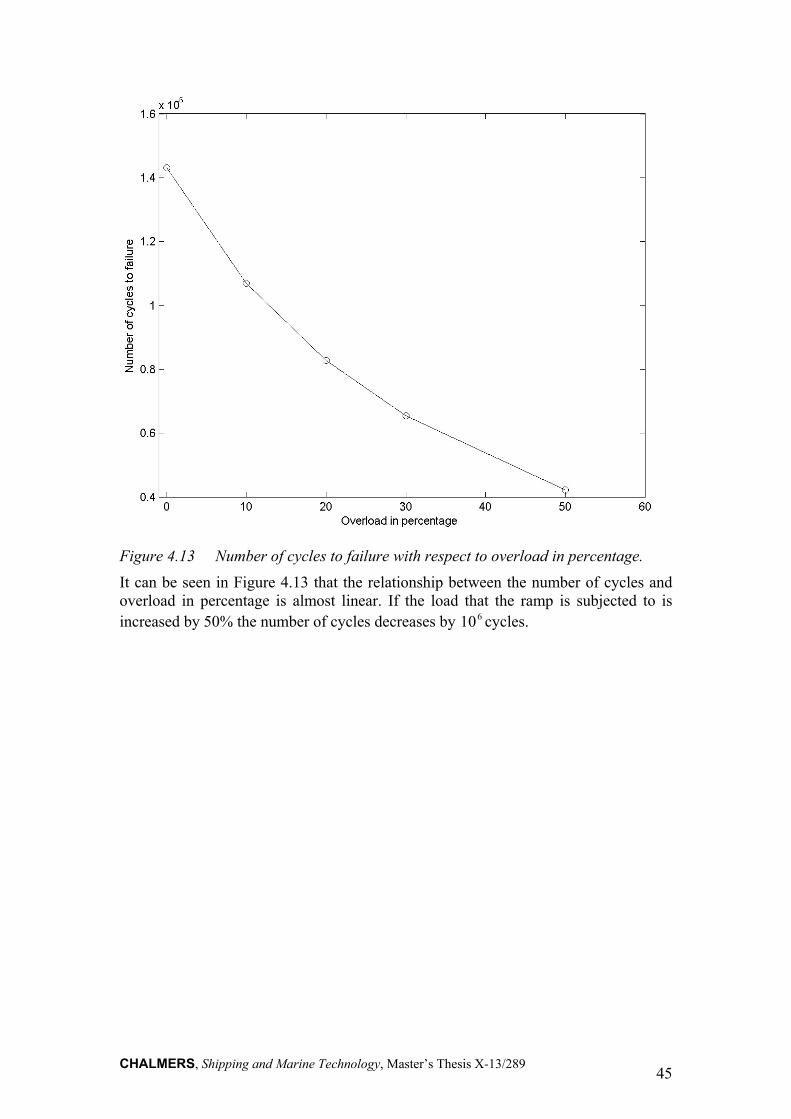
CHALMERS, Shipping and Marine Technology, Master’s Thesis X-13/289 45
Figure 4.13 Number of cycles to failure with respect to overload in percentage.
It can be seen in Figure 4.13 that the relationship between the number of cycles and overload in percentage is almost linear. If the load that the ramp is subjected to is increased by 50% the number of cycles decreases by 610 cycles.

CHALMERS, Shipping and Marine Technology, Master’s Thesis X-13/289 46
CHALMERS, Shipping and Marine Technology, Master’s Thesis X-13/289 47
5 Conclusions The objective with this thesis has been to evaluate a method for performing fatigue assessment of RoRo ramps. The evaluation has been carried out in two case studies. The steps included for performing the case studies are:
Investigate the model on a global scale in order to find critical areas with high local stress.
Investigate local stress concentrations. Evaluate the stress concentration areas from a fatigue point of view.
Two case studies have been carried out in order to find and evaluate critical areas from a fatigue point of view. In Case Study 1, a known critical area has been investigated. In Case Study 2, a global model has been studied in order to detect potential critical areas. These areas have been further investigated in sub-models. Guidelines from methods used in the marine industry for fatigue assessment have been implemented.
In Case Study 1, a service-life estimation has been carried out for the critical area. The fatigue life of the area is short for the applied load and it is known that the area suffers from cracks. The applied load is one of the heavy loads from the requirement specification that occurs frequently. The relation between service time with respect to crack initiation is not known, which makes it hard to evaluate if the calculations correspond to reality. FE-guidelines have not been used in this case study since the critical area was previously known. It was possible to build the model in such a way that the mesh is detailed enough around the critical area in order to evaluate stresses and strains. Therefore, no additional local models were required in Case Study 1. In the critical area, the normal stress σx is above the yield point, which results in plastic deformations in the initial cycle. In the following cycles the stress-strain relationship can be regarded as elastic due to the fact that the elastic strain is of a greater magnitude than the plastic strain because of the isotropic hardening.
From Case Sudy 1 it can be stated that the previously known critical area is identified and can be evaluated from a fatigue perspective as long as a realistic load spectrum is known.
In both of the performed case studies the load has been applied to simulate one truck driving over the ramp. The load has been applied in such a way that the trucks are driving over the ramp using only one drive path. The stress cycle for the truck driving over the ramp has appeared to differ among the beams. The response in some of the beams has appeared to go from tension to compression with various load locations. Other beams are subjected to tension throughout the whole load cycle. The difference in the stress cycle for the beams is probably dependent on the location of the drive path relative to the width of the ramp. On the actual ramp it cannot be expected that all the vehicles are driving in the same drive path. One specific beam can be subjected to a stress cycle that consists of pure tension in the critical area and the next stress cycle could be compression to tension dependent on the location of the drive path. The stress-strain relationship in the critical area in one beam would be a mixture of compression and tension due to deviations from the drive path. An investigation with different locations of the drive path should be tested in order to obtain the response from the beams.
CHALMERS, Shipping and Marine Technology, Master’s Thesis X-13/289 48
In Case Study 2, three local models have been studied. Two of these models have been studied due to the fact that high stresses have been found in the global model. Lifetime estimations have been carried out in the sub-models and the number of cycles to failure has been determined. An inspection of the actual ramp investigated in Case Study 2 may give information that could be used in order to evaluate this method.
The method used for the fatigue evaluation in Case Study 2 is based on guidelines from a DNV fatigue assessment of ship structure, DNV (2010). In this case, a quarter ramp has been investigated and the guidelines from DNV are not fully applicable since there are no specific guidelines for ramps. Instead, a combination of guidelines for structures of equal size compared to the ramp has been used. In this study, parts of the DNV guidelines have been used in order to locate and perform fatigue evaluation of potential critical areas of the ramp. Furthermore, fatigue evaluation of the critical areas through sub-modelling has not been performed for all of the identified critical areas. In one of the cases, high stresses in the global model motivated that a finer local model of the area should be performed. According to the local model, no fatigue evaluation was required since the stresses were too low to cause any fatigue damage of the ramp. In this case, the behaviour from the global model is conservative since it overestimates the stress in this area. The local model, however, is more accurate and gives a better representation of the actual stress levels. In some cases the opposite of this may occur. The global model is not detailed enough to represent sharp corners and similar stress risers in the model. This may lead to the fact that areas with stress concentrations may be left unnoticed. Sub-model 2 in Case Study 2 was further investigated motivated by a geometry study. The von Mises equivalent stresses in the area were not of such a magnitude that a local fatigue evaluation could be motivated. However, in the sub-models in Case Study 2 the critical areas have been detected and evaluated from a fatigue point of view. In these cases it has been shown that the critical areas have stress ranges above the fatigue limit. Fatigue evaluation of such areas is performed in order to establish information about upcoming service intervals or a redesign could be applicable due to fatigue life being too short.
In general, it can be said that the guidelines from DNV, with some modifications, can be used for detecting potential critical areas for further analyses using sub-modelling. However, it is not possible to only rely on the red spots appearing in the global model. In some cases the mesh in the global model was too coarse to represent geometry and might therefore omit stress concentrations due to geometry factors. For that reason it is of importance to thoroughly investigate the FE-model to spot areas where the mesh is obviously too coarse to represent the geometry where there may be stress concentrations.
From the case studies, it can be concluded that information about the load spectrum is of the utmost importance in order to evaluate the structure from a fatigue perspective. If the load spectrum is unknown it becomes very difficult to design the ramp in a good way, since it is not known what the ramp should be designed to withstand. To only consider a heavy load case is not a good design from a fatigue perspective if the ramp is subjected to that load case a few times during its entire service life. In order to make lifetime estimations of the ramp a realistic load spectrum has to be implemented. Therefore, one must have communication with the shipowner about the intended load spectrum for the ramp during the order process of the ramp so that this can be included in the design of the ramp and so that an estimation of the fatigue life of the ramp can be made. It is then possible to use the information from this
CHALMERS, Shipping and Marine Technology, Master’s Thesis X-13/289 49
estimation to decide how frequent the service inspections should be made and where the focus of these inspections should be. It can also be used for modifying the design of the ramp in order to extend the fatigue life of the ramp if this is considered to be too short.
The methods that have been used can be evaluated in terms of comparing actual fatigue damage and calculated fatigue damage with respect to the time aspect. In order to set up goals for the fatigue evaluation, service time has to be stated and converted in to a number of cycles for the service time.
The calculation in this study is based on loads specified in the requirement specifications. The design loads are probably not the same as the actual loads. For many reasons an increased load can significantly affect the fatigue life. As one example of this, the relationship in the S-N curve is not linear. An investigation as to where the load has been increased by a 10, 20, 30 and 50 percentage has been carried out. The results of this investigation can be seen in Figure 4.12 for the linear elastic case. It can be seen that overload has a great impact on the fatigue life.
In order to find out the actual response from the structure when subjected to cyclic loading as described in this thesis, it is of vital importance to evaluate the response after the structure has been subjected to a number of load cycles. To evaluate the structural response after just one load cycle is not enough due to hardening of the material after the first load cycle.

CHALMERS, Shipping and Marine Technology, Master’s Thesis X-13/289 50
CHALMERS, Shipping and Marine Technology, Master’s Thesis X-13/289 51
6 Future work A crucial factor required when lifetime evaluations are to be performed is the load spectrum. If the load spectrum is inaccurate, the calculated lifetime will also be inaccurate. Therefore, a realistic load spectrum should be formulated for every ramp that is to be investigated. This could be performed by cooperation with the shipowners or the harbour personnel loading the ships.
When the loading vehicles are both heavy and driven at higher velocities on the ramp it is possible that the structure is subjected to a larger dynamic contribution than accounted for by the dynamic factor from the class societies, especially when there is an angle between the ramp parts creating a bump for the vehicle. Therefore, the dynamic contribution should be evaluated in order to determine that the factor is accurate.
In this project, the dynamic loading of the ramps has only been considered in the form of a dynamic factor. But it could be simulated using a model of sprung masses with damping in order to achieve more realistic results, Jia and Ulfvarson (2004). The dynamic loads will contribute to vibrations in the structure. Therefore, a modal analysis should be carried out in order to analyse the natural frequencies of the structure.
In this thesis, the ramps have been investigated while in harbour conditions. It could also be of interest to investigate the loads and load spectrum that the ramp is subjected to when in a seagoing condition. The wave loads of the ramp could also contribute to the fatigue damage of the ramp and therefore affect the fatigue life.
One of the most interesting future studies connected to this thesis would probably be to visit both of the ships and investigate the ramps in order to validate the results from this study. If the structure is damaged or shows signs of repairs in areas where the fatigue life has been evaluated in this report, it is possible to evaluate the results in order to determine their accuracy.
In this study, it has been assumed that the vehicles are driven in the same path over the ramp and that small differences in the paths taken by the vehicles give negligible differences in the response of the ramp. The reality of these assumptions should be investigated since the conclusions from this study suggest that different drive paths results in different responses from the ramp. This could be done by adding more drive paths to the ramps and comparing the structural responses.
Isotropic hardening has been assumed for the material. However, the possibility of kinematic hardening also exists. This should therefore be verified in order to be certain of the accuracy of the results.

CHALMERS, Shipping and Marine Technology, Master’s Thesis X-13/289 52
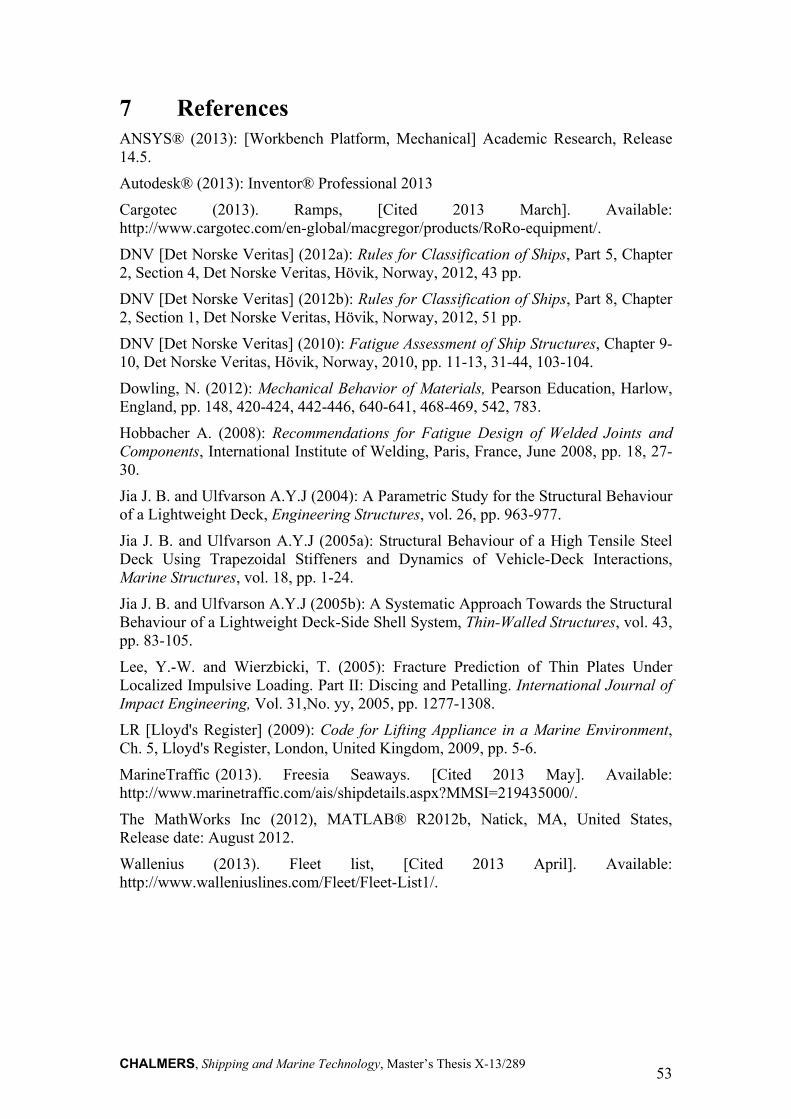
CHALMERS, Shipping and Marine Technology, Master’s Thesis X-13/289 53
7 References ANSYS® (2013): [Workbench Platform, Mechanical] Academic Research, Release 14.5.
Autodesk® (2013): Inventor® Professional 2013
Cargotec (2013). Ramps, [Cited 2013 March]. Available: http://www.cargotec.com/en-global/macgregor/products/RoRo-equipment/.
DNV [Det Norske Veritas] (2012a): Rules for Classification of Ships, Part 5, Chapter 2, Section 4, Det Norske Veritas, Hövik, Norway, 2012, 43 pp.
DNV [Det Norske Veritas] (2012b): Rules for Classification of Ships, Part 8, Chapter 2, Section 1, Det Norske Veritas, Hövik, Norway, 2012, 51 pp.
DNV [Det Norske Veritas] (2010): Fatigue Assessment of Ship Structures, Chapter 9-10, Det Norske Veritas, Hövik, Norway, 2010, pp. 11-13, 31-44, 103-104.
Dowling, N. (2012): Mechanical Behavior of Materials, Pearson Education, Harlow, England, pp. 148, 420-424, 442-446, 640-641, 468-469, 542, 783.
Hobbacher A. (2008): Recommendations for Fatigue Design of Welded Joints and Components, International Institute of Welding, Paris, France, June 2008, pp. 18, 27-30.
Jia J. B. and Ulfvarson A.Y.J (2004): A Parametric Study for the Structural Behaviour of a Lightweight Deck, Engineering Structures, vol. 26, pp. 963-977.
Jia J. B. and Ulfvarson A.Y.J (2005a): Structural Behaviour of a High Tensile Steel Deck Using Trapezoidal Stiffeners and Dynamics of Vehicle-Deck Interactions, Marine Structures, vol. 18, pp. 1-24.
Jia J. B. and Ulfvarson A.Y.J (2005b): A Systematic Approach Towards the Structural Behaviour of a Lightweight Deck-Side Shell System, Thin-Walled Structures, vol. 43, pp. 83-105.
Lee, Y.-W. and Wierzbicki, T. (2005): Fracture Prediction of Thin Plates Under Localized Impulsive Loading. Part II: Discing and Petalling. International Journal of Impact Engineering, Vol. 31,No. yy, 2005, pp. 1277-1308.
LR [Lloyd's Register] (2009): Code for Lifting Appliance in a Marine Environment, Ch. 5, Lloyd's Register, London, United Kingdom, 2009, pp. 5-6.
MarineTraffic (2013). Freesia Seaways. [Cited 2013 May]. Available: http://www.marinetraffic.com/ais/shipdetails.aspx?MMSI=219435000/.
The MathWorks Inc (2012), MATLAB® R2012b, Natick, MA, United States, Release date: August 2012.
Wallenius (2013). Fleet list, [Cited 2013 April]. Available: http://www.walleniuslines.com/Fleet/Fleet-List1/.

CHALMERS, Shipping and Marine Technology, Master’s Thesis X-13/289 54
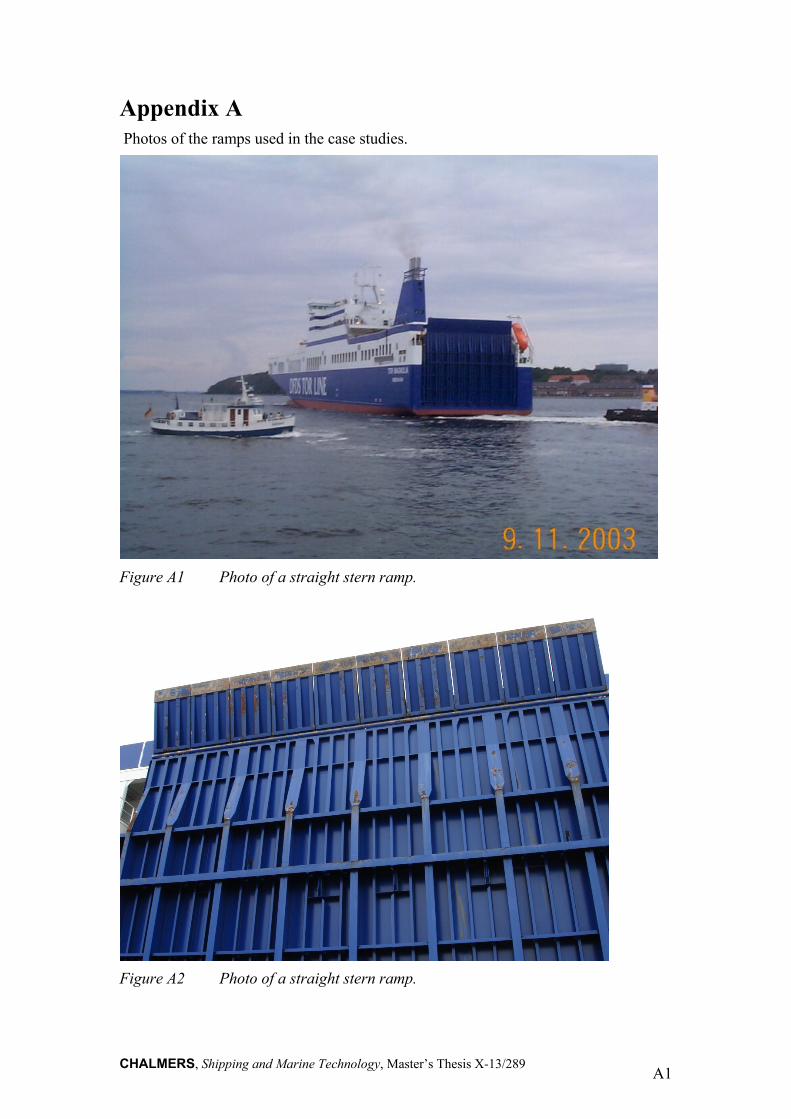
CHALMERS, Shipping and Marine Technology, Master’s Thesis X-13/289 A1
Appendix A Photos of the ramps used in the case studies.
Figure A1 Photo of a straight stern ramp.
Figure A2 Photo of a straight stern ramp.
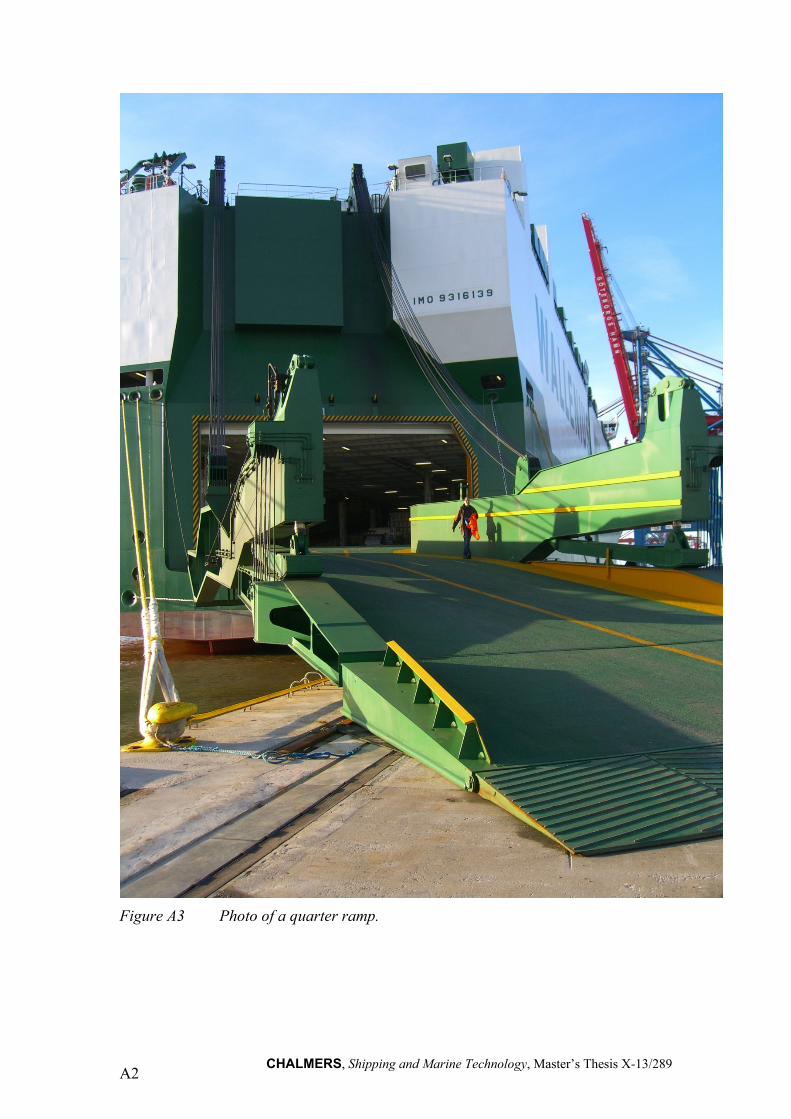
CHALMERS, Shipping and Marine Technology, Master’s Thesis X-13/289 A2
Figure A3 Photo of a quarter ramp.
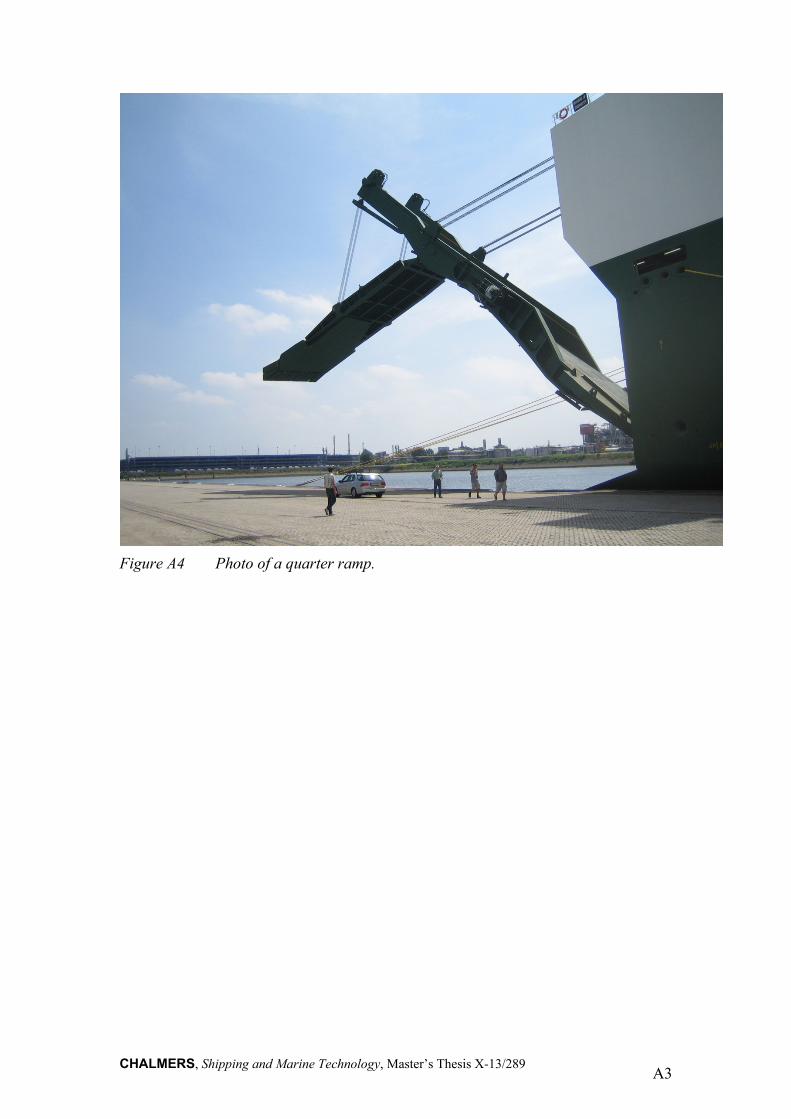
CHALMERS, Shipping and Marine Technology, Master’s Thesis X-13/289 A3
Figure A4 Photo of a quarter ramp.

CHALMERS, Shipping and Marine Technology, Master’s Thesis X-13/289 A4
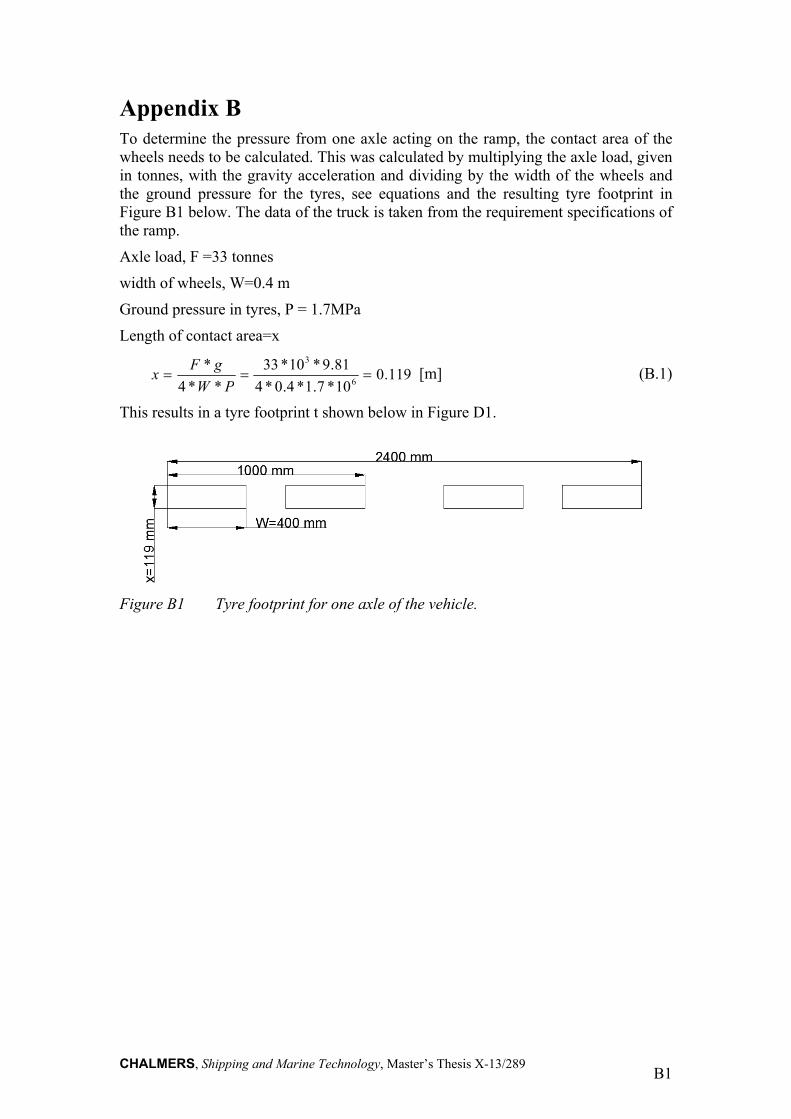
CHALMERS, Shipping and Marine Technology, Master’s Thesis X-13/289 B1
Appendix B To determine the pressure from one axle acting on the ramp, the contact area of the wheels needs to be calculated. This was calculated by multiplying the axle load, given in tonnes, with the gravity acceleration and dividing by the width of the wheels and the ground pressure for the tyres, see equations and the resulting tyre footprint in Figure B1 below. The data of the truck is taken from the requirement specifications of the ramp.
Axle load, F =33 tonnes
width of wheels, W=0.4 m
Ground pressure in tyres, P = 1.7MPa
Length of contact area=x
119.010*7.1*4.0*4
81.9*10*33
**4
*6
3
PW
gFx [m] (B.1)
This results in a tyre footprint t shown below in Figure D1.
Figure B1 Tyre footprint for one axle of the vehicle.

CHALMERS, Shipping and Marine Technology, Master’s Thesis X-13/289 B2
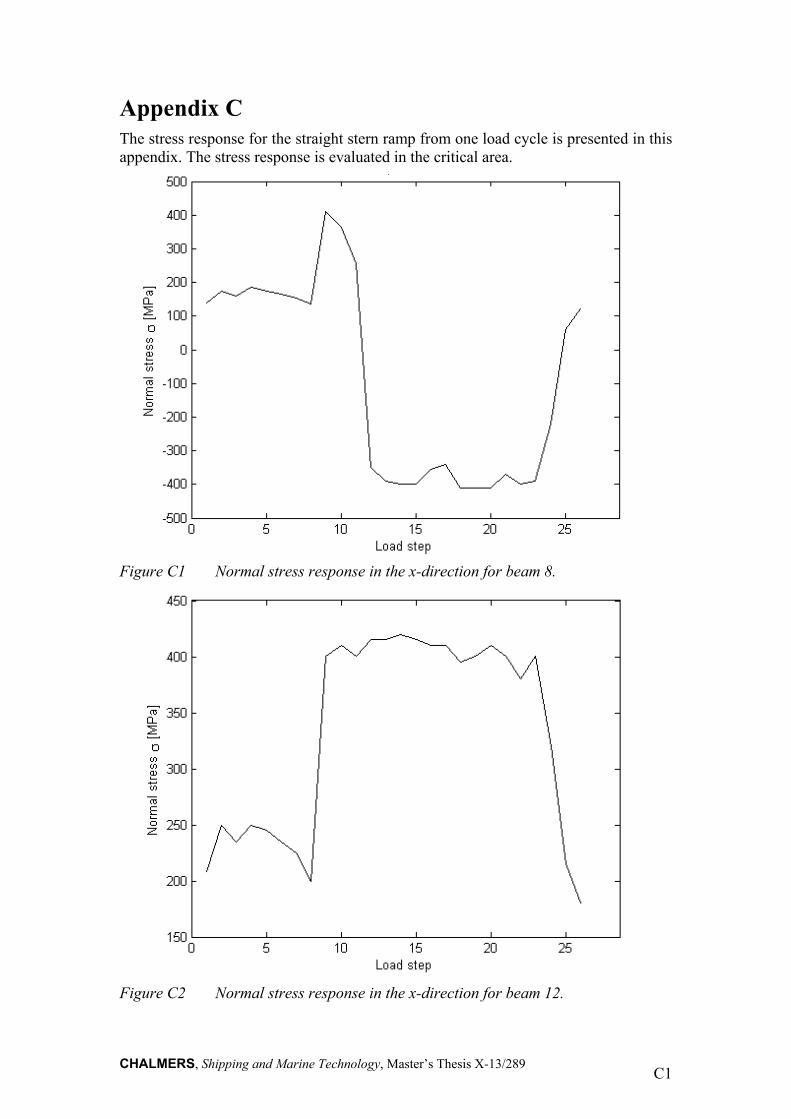
CHALMERS, Shipping and Marine Technology, Master’s Thesis X-13/289 C1
Appendix C The stress response for the straight stern ramp from one load cycle is presented in this appendix. The stress response is evaluated in the critical area.
Figure C1 Normal stress response in the x-direction for beam 8.
Figure C2 Normal stress response in the x-direction for beam 12.

CHALMERS, Shipping and Marine Technology, Master’s Thesis X-13/289 C2
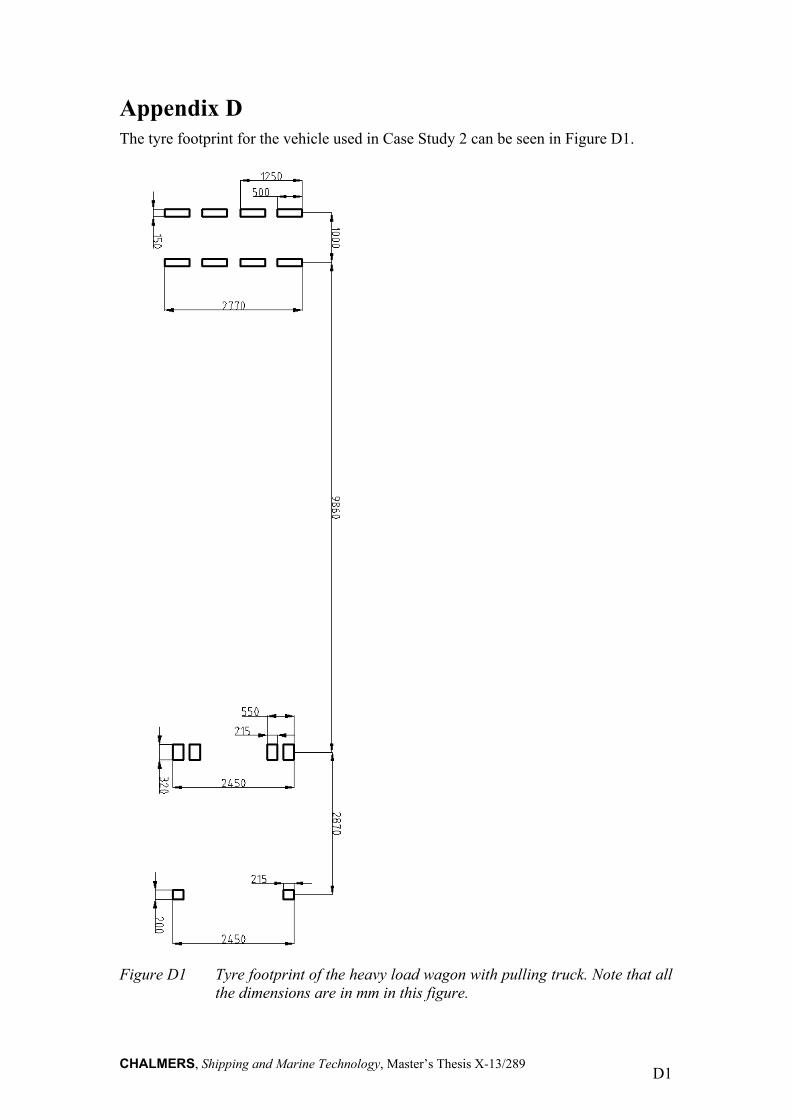
CHALMERS, Shipping and Marine Technology, Master’s Thesis X-13/289 D1
Appendix D The tyre footprint for the vehicle used in Case Study 2 can be seen in Figure D1.
Figure D1 Tyre footprint of the heavy load wagon with pulling truck. Note that all the dimensions are in mm in this figure.

CHALMERS, Shipping and Marine Technology, Master’s Thesis X-13/289 D2
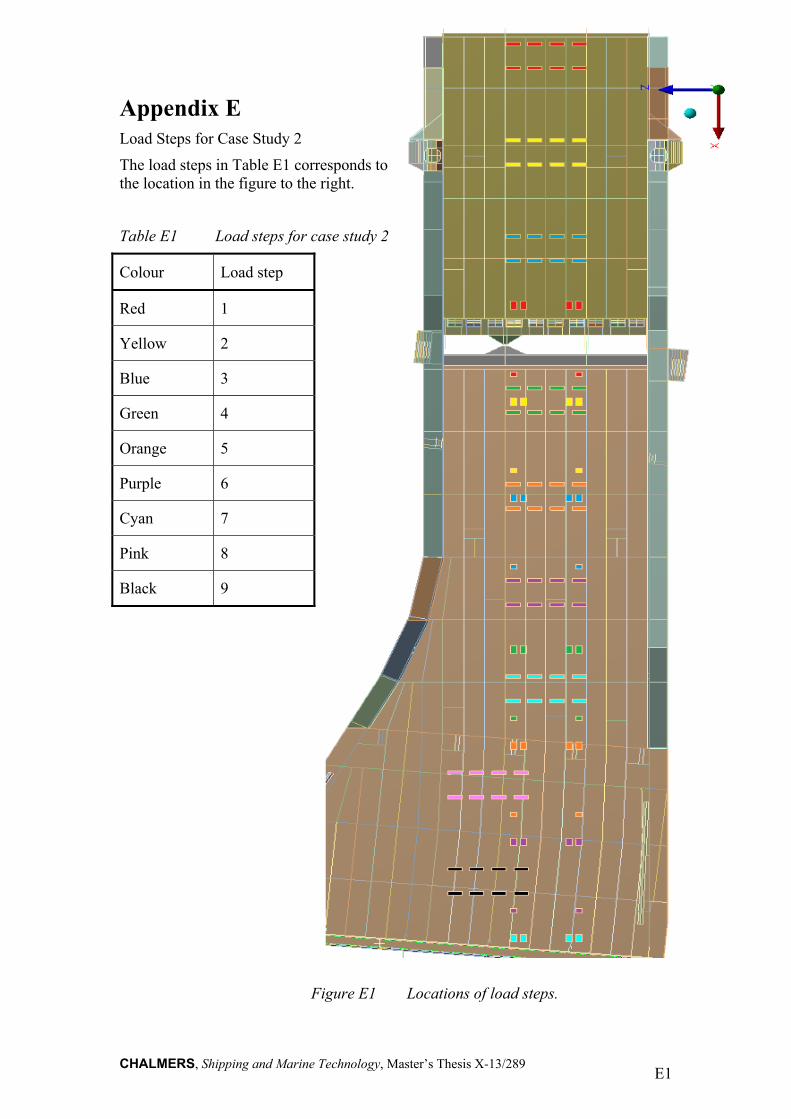
CHALMERS, Shipping and Marine Technology, Master’s Thesis X-13/289 E1
Appendix E Load Steps for Case Study 2
The load steps in Table E1 corresponds to the location in the figure to the right.
Table E1 Load steps for case study 2
Colour Load step
Red 1
Yellow 2
Blue 3
Green 4
Orange 5
Purple 6
Cyan 7
Pink 8
Black 9
Figure E1 Locations of load steps.

CHALMERS, Shipping and Marine Technology, Master’s Thesis X-13/289 E2
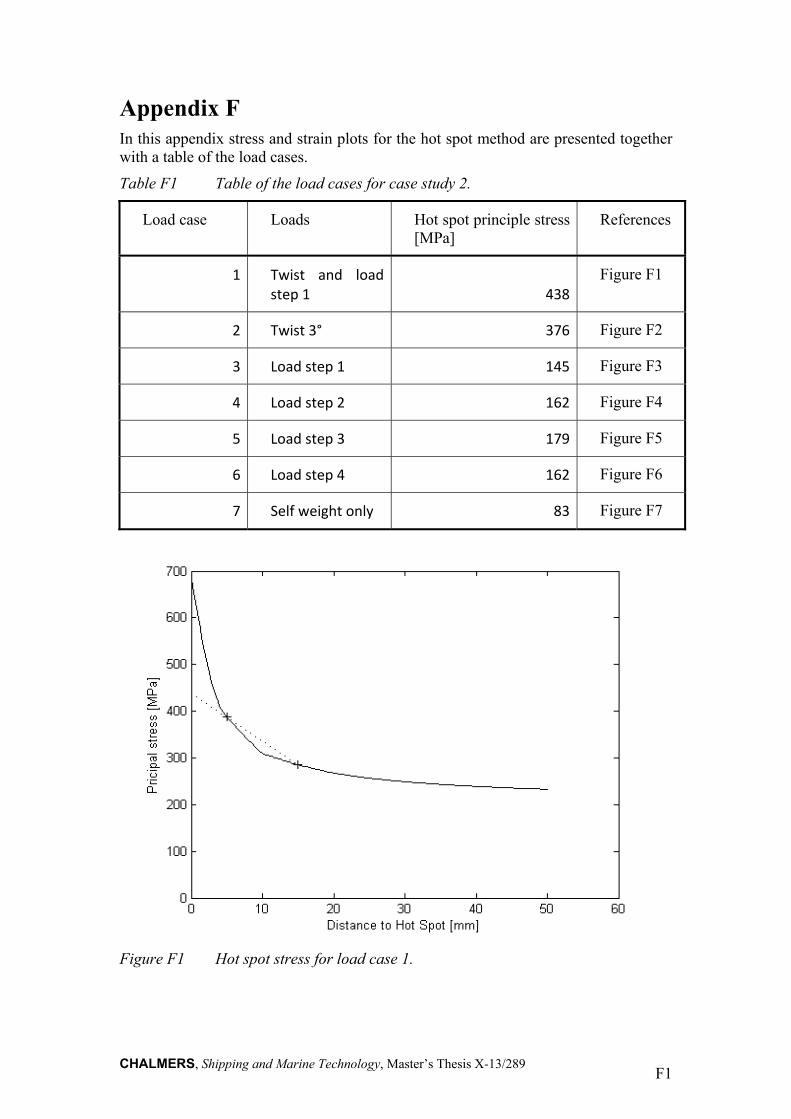
CHALMERS, Shipping and Marine Technology, Master’s Thesis X-13/289 F1
Appendix F In this appendix stress and strain plots for the hot spot method are presented together with a table of the load cases.
Table F1 Table of the load cases for case study 2.
Load case Loads Hot spot principle stress [MPa]
References
1 Twist and load step 1 438
Figure F1
2 Twist 3° 376 Figure F2
3 Load step 1 145 Figure F3
4 Load step 2 162 Figure F4
5 Load step 3 179 Figure F5
6 Load step 4 162 Figure F6
7 Self weight only 83 Figure F7
Figure F1 Hot spot stress for load case 1.
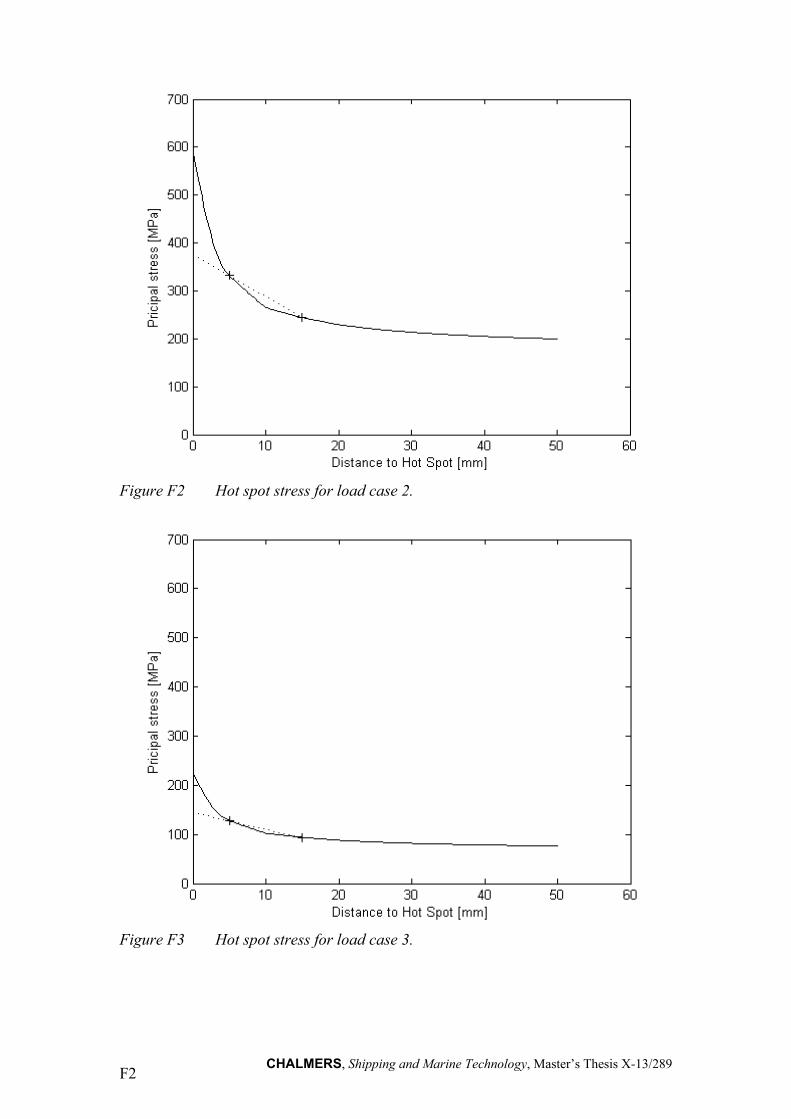
CHALMERS, Shipping and Marine Technology, Master’s Thesis X-13/289 F2
Figure F2 Hot spot stress for load case 2.
Figure F3 Hot spot stress for load case 3.
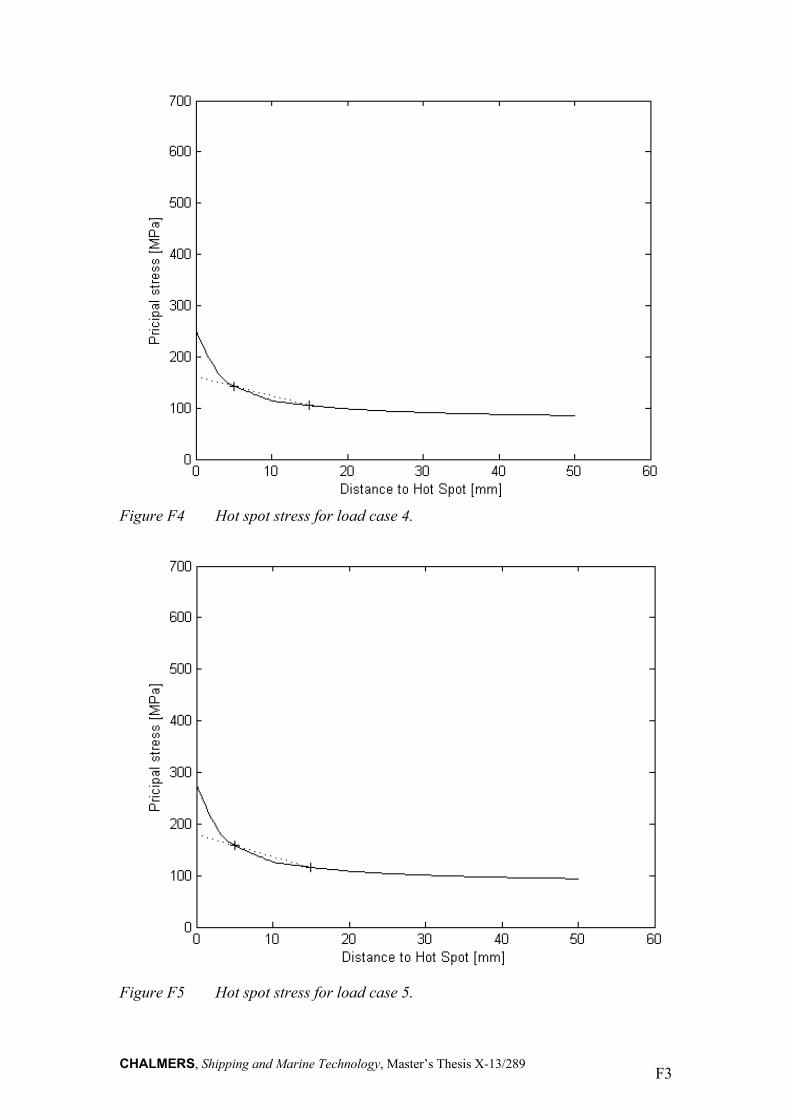
CHALMERS, Shipping and Marine Technology, Master’s Thesis X-13/289 F3
Figure F4 Hot spot stress for load case 4.
Figure F5 Hot spot stress for load case 5.
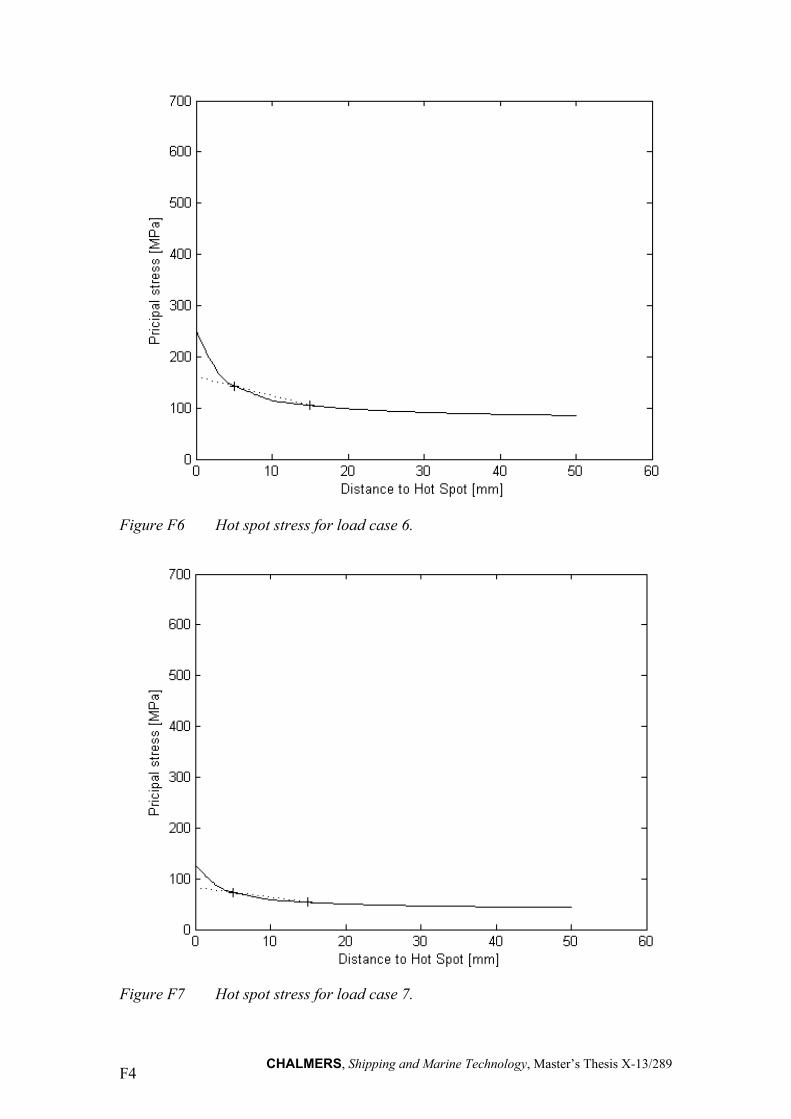
CHALMERS, Shipping and Marine Technology, Master’s Thesis X-13/289 F4
Figure F6 Hot spot stress for load case 6.
Figure F7 Hot spot stress for load case 7.