fate and behaviour of organic contaminants in the aquatic ... course pdf/pdf... · fate and...
TRANSCRIPT

1
Fate and behaviour of organiccontaminants in the aquatic
environment
Miren López de Alda, Damià Barceló
Departament of Environmental ChemistryInstitut of Environmental and Chemistry Research of Barcelona (IIQAB)
Spanish Councl for Scientific Research (CSIC)www.cid.csic.es
E-mail: [email protected]
Summary
1. Contamination of water resources: causes and history
2. Organic contaminants: distinction between priority andemerging contaminants (including endocrine-disruptngcompounds)
3. Factors affecting fate, transport and behaviour ofenvironmental contaminants in the aquatic environment:
SourcePhysical-chemical propertiesEnvironmental conditionsPersistence/degradation
4. Conclusions
Examples, case studies

2
Water
Reasons for its deterioration
A scarce resource, indispensable for human life and for the sustainability of the environment.
human and economic development(more than 60.000 chemicalsubstances are routinely synthetisedworlwide, and beween 200 and 1000 new chemicals are added tothis list each year)
Use as elimination recipient (man has released around 3 millionsof synthetic chemical substances to the environment (UNEP, 2003))
Contamination of water resources
Persistent organic pollutants (POPs)
1962. Scientific and social awareness and concernPublication of “Silent Spring” by Raquel Carson(alterations in animal species ↔ DDT)
Priority contaminants
Carcinogenic compounds
- Apolar- Toxic
- Persistent- Bioaccumulable
-PAHS- PCBs
-Pesticides-Dioxines
- ...
Beginning of S. XIX: First signs.

3
WaterWater FrameworkFramework DirectiveDirective (2000/60/EC)(2000/60/EC)
Anthracene Brominated diphenylethers AlachlorAtrazine Cadmium and its compounds BenzeneChlorpirifos C10-13-chloroalkanes ChlorfenvinphosDi(2-ethylhexyl)phthalate Hexachlorobenzene 1,2-dichloroethaneDiuron Hexachlorobutadiene DichloromethaneEndosulfan Hexachlorocyclohexane FluorantheneIsoproturon Mercury and its compounds Nickel and its compoundsLead and its compounds Nonylphenol TrichloromethaneNaphthalene PentachlorobenzeneOctylphenol Polycyclic aromatic hydroc.Pentachlorophenol Tributyltin compoundsSimazineTrichlorobenzenesTrifuralin
Subject to study for their identification as possible dangerous priority substances
Identified as dangerouspriority substances
————— List of priority substances —————(2455/2001/EC)
Persistent Organic Pollutants (Persistent Organic Pollutants (POPsPOPs))Common properties
• Semivolatile (Pv < 1000 Pa)– Long-range transport and distribution through the atmosphere
and water bodies• Resistant to chemical, photolytic and biological degradation
– Persistent • High bioacumulation and biomagnification potential
– They are found at higher concentrations at the higher levels of the food chains
• Toxic to humans and wildlife– Nervous system damage, endocrine disruption, diseases of
the immune system, reproductive and developmental disorders, cancer,…

4
Def.: newly identified or previously unrecognized contaminants
New and more sensitive analytical and biological methods
Priority lines of research (WHO, EPA, UE)
EmergingEmerging ContaminantContaminantss
...........Not regulated...........
Little or no investigatedScarcity or lack of environmental data
and analytical methods
EmergingEmerging contaminantscontaminants
• Due to their physico-chemical properties (high water solubilityand often poor degradability) they are able to penetrate throughall natural filtration steps and man-made treatments
• Low elimination in WWTP• Potential risk for drinking water supply
- Large volume production/high fluxes in the environment (e.g. pharmaceuticals, surfactants, pesticides)
- They do not need to be persistent in the environment to cause negative effects due to continuous introduction (pseudo-persistent contaminants)
- Lack of data on their occurrence and behaviour

5
Organic emerging contaminantsFlame retardants (Brominated diphenylethers)Alkylphenol ethoxylate surfactants ChloroalkanesPhthalates
Organotin compoundsDrinking water disinfection by-products Pesticide transformation products
Methyl tert-butyl ether and other gasoline additives Fluorinated surfactants (PFOA, PFOS)PharmaceuticalsPersonal care productsAlgal toxinsBisphenol A. . . .
*Susan D. Richardson (2004) Anal. Chem. 76, 3337-3364.
Endocrine disruptors
2455/2001/EC
Already regulatedNew data
Not regulatedInsufficient data
Endocrine Disrupting Chemicals (EDCs)Endocrine Disrupting Chemicals (EDCs)
“An exogenous substance that causes adverse health effects in an intact organism, or its progeny, consequent to changes in endocrine function”
(European Commission)
“An exogenous agent that interferes with the synthesis, secretion, transport, binding, action or elimination of natural hormones in the body that are responsible for the maintenance of homeostasis, reproduction, development and/or behaviour”
(EPA)
Definition

6
Categories of substances with reported endocrine-disrupting properties*
SUBSTANCE EXAMPLES USES MODES OF ACTIONNaturalPhytoestrogens Isoflavones; Present in plant material Estrogenic and
anti-estrogeniclignans; coumestansFemale sex hormones 17-β estradiol; Produced naturally in animals Estrogenic
estrone (including humans)
SyntheticPolychlorinated Dioxins By-products from incineration
and industrial chemical processesAnti-estrogenic
organic compounds
Polychlorinated biphenyls(PCBs)
Organochlorinepesticides
DDT; dieldrin; lindane Insecticides Estrogenic andanti-estrogenic
Organotins Tributyltin Anti-fouling agent
Alkylphenols Nonylphenol Used in production of NPEOs andpolymers, degradation product
Estrogenic
Alkylphenol ethoxylates Nonylphenol ethoxylate Surfactants EstrogenicPhthalates Dibutyl phthalate (DBP); Plasticisers Estrogenic
butylbenzyl phthalate (BBP)Bi-phenolic compounds Bisphenol-A Component in polycarbonate Estrogenic
plastics and epoxy resinsSynthetic steroids Ethinyl estradiol Contraceptives Estrogenic
*Environment Agency, R&D Technical Summary P38, 1999.
Dielectric fluids
Anti-estrogenic
How do the EDCs act ?
Substances can interact with endocrine systems and cause a disruptionto normal functions in several ways:
• They can act like a natural hormone and bind to a receptor. This causes a similar response by the cell, known as an agonist response.
• They can bind to a receptor and prevent a normal response, known as anantagonistic response.
• A substance can interfere with the way natural hormones and receptorsare synthesized or controlled.

7
• Decreased fertility & growth• Sex alteration• Poor hatching/egg shell thinning• Abnormal thyroid function
Well-documented effects of EDCs in wildlife
Some examples include: •reproductive effects in Baltic seals, •eggshell thinning in birds of prey, •decline in the alligator population in polluted lakes, •general declines in frog populations, •effects on the reproduction and development of fish, •development of male sex organs in female marine organisms.
Aquatic animals, especially carnivores, are the most affected because they are atthe top of the "food chain".
Suspected effects of EDCs in humans
• Malformations of newborns • Undescended testicles• Abnormal sperm• Low sperm counts• Abnormal thyroid function• Possible breast, testicular, prostate cancer
• Other effects

8
Factors affecting distribution and fate of environmentalcontaminants in the aquatic environment
* Source
* Physical-chemical properties- Water solubility- Polarity (Kow)- Volatility (Henry’s constant, vapor pressure)- Acid-base properties- ...
* Environmental conditions- Temperature, Altitude, Latitude, Wind, Rainfall, pH, Organic matter, Flow rate...
* Persistence/degradation- Photo-, chemical-, and bio-degradation
Potential sources (⇔ use)Atmospheric Transport / Agricultural Runoff
Organochlorine Pesticides: DDT, Dieldrin , LindaneIncineration, Landfill
Polychlorinated Compounds: Polychlorinated dioxins, Polychlorinated biphenyls
Industrial And Municipal EffluentsAlkylphenolics (Surfactants and Their Metabolites): NonylphenolPhthalates (Found In Placticisers): Dibutyl Phthalate, Butylbenzyl Phthalate
Municipal Effluent And Agricultural RunoffNatural Hormones, Synthetic Steroids: 17ßEstradiol, Estrone, Ethynyl estradiol
Pulp Mill Effluents Phytoestrogens: Isoflavones, Ligans, Coumestan
Agricultural RunoffPesticides Currently In Use - Atrazine, Trifluralin, Permethrin…
HarborsOrganotins: Tributyltin

9
• Def.: maximum possible concentration of a chemical compound thatcan be dissolved in water at equilibrium.
• The higher the water solubility, the greater the tendency to remain dissolved.
• High water soluble substances are less likely to volatilize from water and likely to enter the aquatic environmental through run-off.
• Low water soluble substances volatilize more readily in water, tend to precipitate, to partition to soil, and to bioconcentrate in aquatic organisms.
• < 0.5-1 mg/L = very insoluble• Most emerging contaminants are soluble in water• Most POPs have low water solubility
Physical-chemical properties
Solubility in water
• Octanol-water partition coefficient (log KOW) = the ratio of the concentration of a chemical in octanol and in water at equilibrium and at a specified temperature.
• It thus represents the tendency of a chemical to partition between an organic phase (e.g., fish, soil) and an aqueous phase.
• log POW
• The higher the Log Kow the greater the tendency of a compound to absorbto solid phases and bioacumulate in organisms.
Polarity
> 4-5 non polar comp.
> 1.5-4 moderately polar comp.
< 1-1.5 polar comp.
Physical-chemical properties

10
Physical-chemical properties
Volatility
Def.: pressure at which the gase phase of a substance coexists in equilibriumwith its liquid or solid phase.
It is characteristic for each substance and increases with T.Volatile substances have high vapour pressure values.
Vapor pressure
Def.: ratio between the concentration of a substance in air and its concentrationin water in equilibrium.
High values mean high volatilization< 9.9E-11 atm m3 mol-1 low volatile compounds
Henry’s constant (H o KH)
Def.: the property of changing readily from a solid or liquid to a vapor
Physical-chemical properties
Acid-base ionization
Ionization capacity of a compound
Characteristic for each substance, increases with T
Ionization of a compound increases its solubility in water and decreases its lipophilicity.
In the water/soil media (pH 5-8)* substances with pKa < 3-4: tend to move to the aquatic medium* substances with pKa > 10: tend to be retained in soil
11
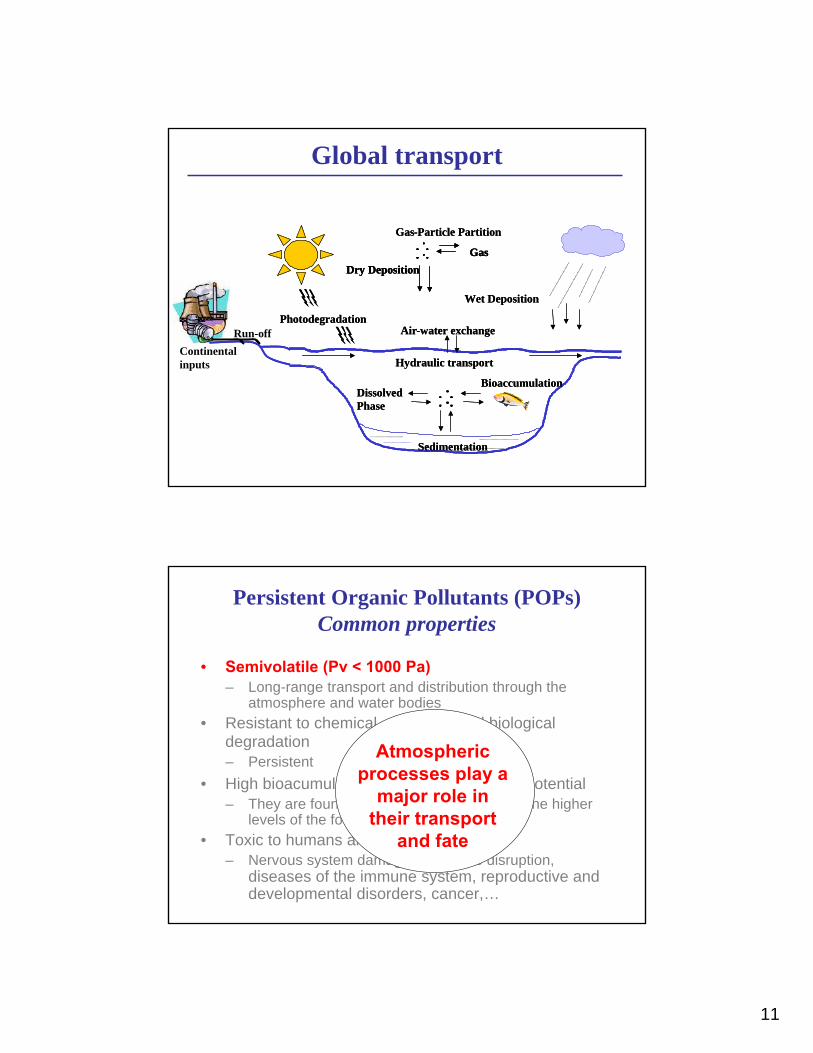
Global transport
Gas-Particle Partition
Gas
Wet Deposition
Dry Deposition
Air-water exchangePhotodegradation
Dissolved Phase
Bioaccumulation
Hydraulic transport
Sedimentation
Gas-Particle Partition
GasGas
Wet Deposition
Dry DepositionDry Deposition
Air-water exchangePhotodegradation
Dissolved Phase
Bioaccumulation
Hydraulic transport
Sedimentation
Continentalinputs
Run-off
Persistent Organic Pollutants (POPs) Common properties
• Semivolatile (Pv < 1000 Pa)– Long-range transport and distribution through the
atmosphere and water bodies• Resistant to chemical, photolytic and biological
degradation– Persistent
• High bioacumulation and biomagnification potential– They are found at higher concentrations at the higher
levels of the food chains• Toxic to humans and wildlife
– Nervous system damage, endocrine disruption, diseases of the immune system, reproductive and developmental disorders, cancer,…
Atmospheric processes play a
major role in their transport
and fate

12
AEROSOLS
DRY DEPOSITIONOF PARTICLES
ATMOSPHERIC DEPOSITIONAL PROCESSES
contaminants associated with particles
VOLATILIZATION
gaseous contaminants
ABSORPTION OF GASES
WATER DROPLETS
WASHOUT OF GASES
WASHOUT OF PARTICLES
Mainprocess
Apolar comp.(e.g., PAHs)
Rainy regions
0
1
2
3
4
5
6
Phen
antr
ene
Ant
hrac
ene
DB
T
MD
BT
MPh
enan
tren
e
DM
Phen
antr
ene
Fluo
rant
hene
Pyre
ne
Ben
zo(a
)ant
hrac
ene
Chr
ysen
e
Ben
zoFl
uora
nthe
nes
Ben
zo(e
)pyr
ene
Ben
zo(a
)pyr
ene
Pery
lene
Inde
no(1
,2,3
-c,d
)pyr
ene
Dib
enzo
(a,h
)ant
hrac
ene
Ben
zo(g
,h,i)
pery
lene
CG (n
g m
-3)
0
0.025
0.05
0.075
0.1
0.125
0.15
Phen
antr
ene
Ant
hrac
ene
DB
T
MD
BT
MPh
enan
tren
e
DM
Phen
antr
ene
Fluo
rant
hene
Pyre
ne
Ben
zo(a
)ant
hrac
ene
Chr
ysen
e
Ben
zoFl
uora
nthe
nes
Ben
zo(e
)pyr
ene
Ben
zo(a
)pyr
ene
Pery
lene
Inde
no(1
,2,3
-c,d
)pyr
ene
Dib
enzo
(a,h
)ant
hrac
ene
Ben
zo(g
,h,i)
pery
lene
CA (n
g m
-3)
Gas Phase
Aerosol Phase
Polycyclic Aromatic Hydrocarbonsin the NE subtropical Atlantic Atmosphere
Increased MW & Kow
Decreased volatility

13
Figure 5.
Fluo
rene
Phena
nthr
ene
MePhe
ns
Fluo
rant
hene
Pyren
e
Benzo
[b]fl
uor
Chrys
ene
Benzo
[a]p
yren
e
% o
f T
otal
A
tmos
pher
ic D
epos
itio
nal F
lux
0
20
40
60
80
100Dry Deposition Wet Deposition GasAbsorption
288 1930 2050 480 250 16 58Total Flux (ng/ m2 day)
22
Relative importance of air-water exchange processesfor PAHs
(Gigliotti et al. 2002, Environ. Toxicol. Chem 21: 235)
Goblal distillation effect theory
Moderate and high volatility(HCB, PCBs , HCHs, DDTs)
Low volatility(PAH ring nº >4) Pv < 10-4 Pa
High volatility(HCB, PCBs 1-4 Cl, HCHs), Pv = 10-2 – 1 Pa
HIGH LATITUDES
INTERMEDIATE LATITUDES
35-60ºN
T m = 10 -20 ºC
T m = -2/8 ºC
T m = -2/-12 ºC
HIGH ALTITUDEREGIONS
35-60ºN
Moderate volatility(DDT, PCBs 4-8 Cl),Pv = 10-4 –10-2 Pa
“GrasshopperEffect”
Moderate and high volatility(HCB, PCBs , HCHs, DDTs)
Low volatility(PAH ring nº >4) Pv < 10-4 Pa
High volatility(HCB, PCBs 1-4 Cl, HCHs), Pv = 10-2 – 1 Pa
HIGH LATITUDES
INTERMEDIATE LATITUDES
35-60ºN
T m = 10 -20 ºC
T m = -2/8 ºC
T m = -2/-12 ºC
HIGH ALTITUDEREGIONS
35-60ºN
Moderate volatility(DDT, PCBs 4-8 Cl),Pv = 10-4 –10-2 Pa
“Coldtrap”
(Fernández P, Grimalt, JO. Chimia 2003; 57: 514)

14
Seasonal effect of T
Daly G, Wania F. Environ. Sci. Technol. 2005; 39: 385.
Global distillation effect
α-HCH 3,0 10-3 1,1 HCB 2,4 10-3 139PCB28 2,6 10-2 33PCB180 8,1 10-5 102DDT 3,8 10-5 6DDE 8,6 10-4 34
Pv* H*(Pa, 25 oC) (Pa m3/mol)
HCB
DDT
*Shiu y Mackay, J. Phys.Chem.Ref. Data, 15, 911-929 (1986)
Adapted from Wania and Mackay, Ambio, 22, 10-18 (1993)and Environ. Sci. Technol., 30, 390A-396A (1996)

15
Uses of PCBs
From K. Breivik, A. Sweetman, J.M. Pacyna, K.C. Jones, Sci. Total Environ. 290, 181-198 (2002)
Uses of PCBand latitudinal distribution in soils
0
20000
40000
60000
80000
100000
120000
-90 -60 -30 0 30 60 90
Latitude
Soil
conc
(pg/
g dr
y w
t)
0
20000
40000
60000
80000
100000
120000
Tota
l PC
B u
sage
(ton
nes)

16
Global climate changeIncreased T
↓Iceberg & snow melting
↓Release of contaminants
Bioaccumulation of POPs in ArcticFood Chain
Schindler et al., Science of theTotal Environment, 160/161, 1-17 (1995).
Food chain

17
270 275 280 285 290 295 300 305
180 360 540 720
60
120
180
240
300
360
90N
60N
30N
0
30S
60S
90S
0 5 10 15
180 360 540 720
60
120
180
240
300
360
90N
60N
30N
0
30S
60S
90S180W 90W 0 90E 180E 180W 90W 0 90E 180E
273 275 280 285 290 295 300 305T (K)
0 5 10 15U10 ( m s-1)
Temperature Wind Speed
Environmental conditions
- Henry’s constant- Solubility- Degradation rate- etc.
- Atmospheric deposition- Air-water exchange- etc.
Influence of Sea Breeze on Air-Water Exchange
NW MediterraneanMasnou harbor
(Pérez et al. ES&T 2003, 37, 3794-3802)

18
0
5
10
15
20
25
30
24-7
-01
25-7
-01
26-7
-01
27-7
-01
28-7
-01
Tem
pera
ture
(C),
win
d sp
eed
(m s
-1)
Temperature
Wind speed
SE SW W NW E S W SE NE SW W NE SW W NE
Atmosphere Water ColumnInfluence of sea breeze onair-water exchange
PAH occurrence and Met data
(Pérez et al. ES&T 2003, 37, 3794-3802)
Influence of sea breeze on air-water exchange of PAHs
0
200
400
600
800
1000
1200
24-7
-01
25-7
-01
26-7
-01
27-7
-01
28-7
-01
Net
Vol
atili
zatio
n Fl
ux (u
g m
-2 d
-1)
0
5
10
15
20
25
30
35
40
Win
d sp
eed
(m s
-1)

19
EmergingEmerging contaminantscontaminants
• Due to their physico-chemical properties (high watersolubility, low volatility, and often poor degradability) theyare able to penetrate through all natural filtration steps andman-made treatments
• Low elimination in WWTP• Potential risk for drinking water supply
- Large volume production/high fluxes in the environment (e.g. pharmaceuticals, surfactants, pesticides)
- They do not need to be persistent in the environment to cause negative effects due to continuous introduction
- Lack of data on their occurrence and behaviour
Wastewatertreatment plant
Drinking waterproduction
Man
Sediment
Surfacewater
Estuarinewater
Sediment
Oceanwater
Sediment
Biota
Biota
Entering the water cycleControlled/uncontr.
dischargeRun-off
Soil
Groundwater
Sewage sludge

20
Run off
Drinkingwater
Sludge Surface waters
Domestic wasteSewage
LandfillTreatment plant
Human Medicine
overflow leaks
excretion disposal
Groundwaters Food chain
Agricultural soils
Manure
Aquaculture Livestock Poultry
excretion excretion
VeterinaryMedicine
Sea
Run off
Drinkingwater
Sludge Surface waters
Domestic wasteSewage
LandfillTreatment plant
Human Medicine
overflow leaks
excretion disposal
Groundwaters Food chain
Agricultural soils
Manure
Aquaculture Livestock Poultry
excretion excretion
VeterinaryMedicine
Sea

21
Elimination in Sewage Treatment Plants (STP)(conventional activated sludge treatment)
10-39%Diclofenac (anti-inflammatory)
> 90% Note: hydroxy and carboxy metabolites
found in effluents)
Ibuprofen (anti-inflammatory)
60%Fluoroquinolones (antibiotics)
42-92%Naproxen (anti-inflammatory)
43-71%Gemfibrozil (lipid regulator)
50% Methoxazole
< 10 % (no removal)Carbamezapine (anti-epileptic drug)Atenolol, Metoprolol (β-blockers)Trimethoprim (antibiotic)
RemovalCompound
Source: REMPHARMAWATER final report
• Removal efficiency is a function of the drug’s structure and treatment technology employed; the conjugates can be hydrolyzed back to the free parent drug.
Deconjugation of glucuronide and sulfate metabolites of pharmaceuticals
in sewers and STP
OS
H
H
H
O
OO
O Na+ OH
H
HH
O
Estrone(↑ activity)
Estrone-sulfate(↓ activity)

22
Fent et al. Aquatic Toxicology 76 (2006) 122.
STP effluents: point-source contaminationConcentration of pharmaceuticals in treated sewage and surface water
Atenolol Gemfibrozil Diclofenac Naproxen Ibuprofen Carbamazepine
0
2000
4000
6000
8000
10000
12000
WWTP1 WWTP2 WWTP3 WWTP5 WWTP6 WWTP7
Con
cent
ratio
n(ng
/L)
0
2000
4000
6000
8000
10000
12000
WWTP4
0
50
100
150
200
250
300
350
400
RW donwns.WWTP1
RW donwns.WWTP2
RW downs.WWTP3
RW downs.WWTP5
RW downs.WWTP6
RW downs.WWTP7
Con
cent
ratio
n(ng
/L)
0
500
1000
1500
2000
2500
RW downs.WWTP4
Atenolol Gemfibrozil Diclofenac Naproxen Ibuprofen CarbamazepineAtenolol Gemfibrozil Diclofenac Naproxen Ibuprofen Carbamazepine
0
2000
4000
6000
8000
WWTP1 WWTP2 WWTP3 WWTP5 WWTP6 WWTP7
Con
cent
ratio
n(ng
0
2000
4000
6000
8000
WWTP4
0
50
100
150
200
250
300
350
400
RW donwns.WWTP1
RW donwns.WWTP2
RW downs.WWTP3
RW downs.WWTP5
RW downs.WWTP6
RW downs.WWTP7
Con
cent
ratio
n(ng
/L)
0
500
1000
1500
2000
2500
RW downs.WWTP4
Atenolol Gemfibrozil Diclofenac Naproxen Ibuprofen Carbamazepine
0
2000
4000
6000
8000
10000
12000
WWTP1 WWTP2 WWTP3 WWTP5 WWTP6 WWTP7
Con
cent
ratio
n(ng
/L)
0
2000
4000
6000
8000
10000
12000
WWTP4
0
50
100
150
200
250
300
350
400
RW donwns.WWTP1
RW donwns.WWTP2
RW downs.WWTP3
RW downs.WWTP5
RW downs.WWTP6
RW downs.WWTP7
Con
cent
ratio
n(ng
/L)
0
500
1000
1500
2000
2500
RW downs.WWTP4
Atenolol Gemfibrozil Diclofenac Naproxen Ibuprofen CarbamazepineAtenolol Gemfibrozil Diclofenac Naproxen Ibuprofen Carbamazepine
0
2000
4000
6000
8000
10000
12000
WWTP1 WWTP2 WWTP3 WWTP5 WWTP6 WWTP7
Con
cent
ratio
n(ng
/L)
0
2000
4000
6000
8000
10000
12000
WWTP4
0
50
100
150
200
250
300
350
400
RW donwns.WWTP1
RW donwns.WWTP2
RW downs.WWTP3
RW downs.WWTP5
RW downs.WWTP6
RW downs.WWTP7
Con
cent
ratio
n(ng
/L)
0
2000
4000
6000
8000
10000
12000
WWTP1 WWTP2 WWTP3 WWTP5 WWTP6 WWTP7
Con
cent
ratio
n(ng
/L)
0
2000
4000
6000
8000
10000
12000
WWTP4
0
50
100
150
200
250
300
350
400
RW donwns.WWTP1
RW donwns.WWTP2
RW downs.WWTP3
RW downs.WWTP5
RW downs.WWTP6
RW downs.WWTP7
Con
cent
ratio
n(ng
/L)
0
500
1000
1500
2000
2500
RW downs.WWTP4
Concentrations (ng/L) of the most ubiquitous anti-inflammatories, lipid regulators, psychiatric drugs and ß-blockers detected in (A) wastewater effluent and (B) river
water downstream the WWTP monitored

23
Spain
⇒ Bi-monthly (Jun 02-Jun 03)
B1: Mouth of Besós river
B2: Emissary of WWTP Besós
L1: Mouth of Llobregat river
L2: Emissary WWTP Depurbaix (X1Y1)
L3: Emissary WWTP Depurbaix (XmYm)
L4: Emissary WWTP Depurbaix (X2Y2)
Barcelona
Besós river
Llobregat river L1
L4L3
L2
B1
B2
N
EO
S
WWTP BesósWWTP Depurbaix
Study area
Steroids in STP and receiving coastal waters in Catalonia
Average concentrations of estrone-3-sulfate andestrone in waste and coastal water
Barcelona
Besós river
Llobregat river
E1-sulfate
E1
100X
effluent
influent
influent
Concentrations in coastal water are approximately 100 times lower than in wastewater
Mediterranean Sea

24
Breakdown during sewage treatment (AST): APEOs case.(according Ahel, Wat. Res. 1995)Ultimate biodegradation of NPEOs <40%
40-45% ends up in secondary effluent
20 % in sludge
Primary Effluents
68%
20%
5%7%
NPnEONP1EO+NP2EO
NP1EC+NP2ECNP
20%
25%47%
8%
Secondary Effluents Digested Sludge
5%
95%
Increasing polarityPossible contamination
of groundwaters
Breakdown pathway of NPEOs
Increasing toxicity
Increasingbioconcentration
Increasingpersistence
C9H19 O CH2CH2O H9
C9H19 O CH2CH2O H8
C9H19 O CH2CH2O CH2COOH8
NP2EO
NP8EO
NP9EO
NP2EC
NP9EC
NP1EO
NPNP1EC
C9H19 OH
C9H19 O CH2CH2O H9
C9H19C9H19 O CH2CH2O H9
C9H19 O CH2CH2O H8
C9H19C9H19 O CH2CH2O H8
C9H19 O CH2CH2O CH2COOH8
C9H19C9H19 O CH2CH2O CH2COOH8
NP2EO
NP8EO
NP9EO
NP2EC
NP9EC
NP1EO
NPNP1EC
C9H19 OHC9H19C9H19 OH

25
~~1600016000 municipal WWTP in USA municipal WWTP in USA 12,5 billions dry lb/yr12,5 billions dry lb/yr of biosolidsof biosolids
Biosolids
65%
18%
16%1%
Land ApplicationIncinerationLandfillsOther
Estimated Mass and Use of Biosolids in US
Source: National Research Council of the National Academies
Run off
Drinkingwater
Sludge Surface waters
Domestic wasteSewage
LandfillTreatment plant
Human Medicine
overflow leaks
excretion disposal
Groundwaters Food chain
Agricultural soils
Manure
Aquaculture Livestock Poultry
excretion excretion
VeterinaryMedicine
Sea

26
Manure
Concentration range of antibiotics in manure.
ND non-detectable
ND – 4ND – 70ND – 309Turkey
ND – 31ND – 419ND – 10,900Sheep
ND – 6682ND – 38ND – 23,140Hog
ND – 846ND – 258ND – 585Beef
ND – 5ND – 46ND – 5130Dairy
Macrolides (µg/kg)Sulfonamides (µg/kg)Tetracyclines (µg/kg)Operation
Soil Fertilization Soil Fertilization - Lower cost of crop production- Reduces soil erosion potential- Improves soil/water infiltration
Source: Ken Carlson, Antibiotics 2004 newsletter
Environmental Effects of Antibiotics
• Antibiotics are designed to affect microorganisms and bacteria found in humans andanimals. This, therefore makes them potentially hazardous to other such organismsfound in the environment.
• Excreted antibiotics (up to 90% of one dose in urine and 75% in feces) partially inhibitmethogenesis in anaerobic waste-storage facilities, thus decreasing the rate at whichbacteria metabolize animal waste products.
• The frequent use of antibiotics has promote the rise of populations of newstrains of bacteria resistant to antibiotics. Some studies evidenced up to 70% increase in resistance to certain antibiotics when manure from a farm wasapplied to a garden soil.
• On release into the environment through manure/sluge application, antibioticsmay end up on agricultural soils and can be taken up by plants, affecting thegrowth and development.
• In general, toxic levels of antibiotics for microorganisms, bacteria and micro-algae are 2-3 orders of magnitud below the toxic values for higher trophic levels.

27
Wastewatertreatment plant
Drinking waterproduction
Man
Sediment
Surfacewater
Estuarinewater
Sediment
Oceanwater
Sediment
Biota
Biota
Entering the water cycleControlled/uncontr.
dischargeRun-off
Soil
Groundwater
Sewage sludge
SedimentationFavoured for:Non-ionicLow water solubilityHigh Kow
NPEONP1ECNP
Cardener river
Llobregat river
C1
C2 C3
Barcelona
STP
µ
400SEDIMENT
0
100
200
300
g/kg
02468
10
I III V VII
µg/L
WATER
02468
10
I III V VII
µg/L
WATER
0
100
200
300
400
µg/kg
SEDIMENT
Concentrations of nonylphenolic compoundsin river (Cardener) water and sediments
02468
10
I III V VII
µg/L
WATER
0
100
200
300
400
µg/kg
SEDIMENT

28
ocean
soils
Inventory of PCB in the surface ocean and in soils
Wastewatertreatment plant
Drinking waterproduction
Man
Sediment
Surfacewater
Estuarinewater
Sediment
Oceanwater
Sediment
Biota
Entering the water cycleControlled/uncontr.
dischargeRun-off
Soil
Groundwater
Sewage sludge Biota
BioaccumulationFavoured for lipophilic (high Kow)

29
Monzón
Flix
CincaRiver
C4
Monzón
Monzón
Flix
CincaRiver
Monzón
C1ChondrostomaC1
Sediment = NDFish = ND
C2
Sediment = 9Fish = 1799
C4
Sediment = 866Fish = 8504
Levels (ng/g) of hexabromocyclododecane (HBCD) in sediment and fish (C. toxostoma) - Cinca River (NE Spain)
FlixC4 FlixC3
Sediment = 1613Fish = NA
BrBr
Br
Br
BrBr
Hexabromocyclododecane (HBCD)3 isomers
α-HBCD β-HBCD γ-HBCDα-HBCD β-HBCD γ-HBCD
Applications as flame retardant:
- Electronic circuitry- Plastics- Paper- Wood- Textiles- Building materials
Fish length and weight are directly related to fish ageLength and Weight versus [HBCD]
0
500
1000
1500
2000
8 9 10 11 12 13 14Fish length (cm)
HB
CD
(ng/
g w
w)
Site 3
R2 = 0.92
0
500
1000
1500
2000
0 5 10 15 20 25 30Fish weight (g)
HB
CD
(ng/
g w
w)
Site 3
R2 = 0.94
HBCD in fish from the Cinca River –Bioaccumulation

30
Different profiles of HBCD isomers in sediment & fish
BrBr
Br
Br
Br
Br
Hexabromocyclododecane (HBCD)3 isomers
α-HBCD β-HBCD γ-HBCDα-HBCD β-HBCD γ-HBCD
Alpha is more bioavailable than gamma?Or its bioaccumulation factor is greater?Or does biotransformation from gamma to alpha occur?
QuestionsQuestions??
Biomagnification in the food web
0,1
1
10
100
1000
10000
100000
10 12 14 16 18 20
δN15
lnC
(g/
Kg)
HCB
PCB
DDT
Zooplancton
Fish
Sea birds
Sea lion
(Jarman et al. Environ. Sci. Technol. 30, 654-660, 1996)
31
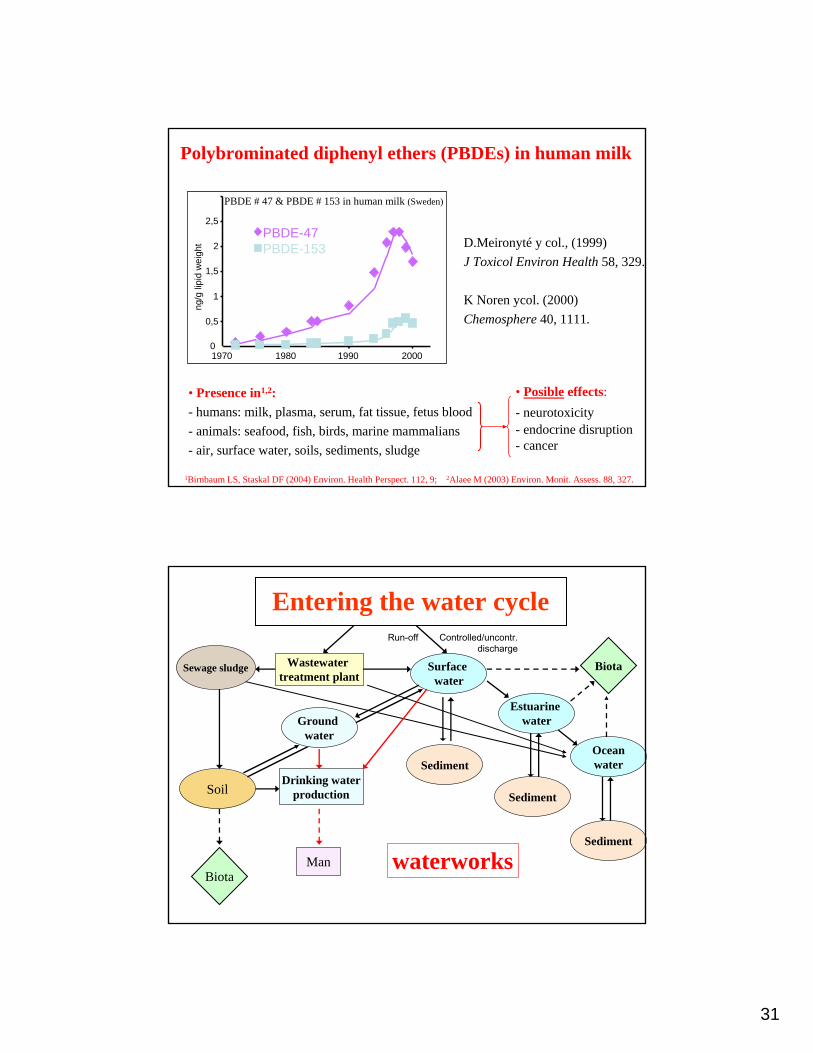
Polybrominated diphenyl ethers (PBDEs) in human milk
• Presence in1,2:- humans: milk, plasma, serum, fat tissue, fetus blood- animals: seafood, fish, birds, marine mammalians- air, surface water, soils, sediments, sludge
1Birnbaum LS, Staskal DF (2004) Environ. Health Perspect. 112, 9; 2Alaee M (2003) Environ. Monit. Assess. 88, 327..
0
0,5
1
1,5
2
2,5
1970 1980 1990 2000
ng/g
lipi
d w
eigh
t
PBDE-47PBDE-153
PBDE # 47 & PBDE # 153 in human milk (Sweden)
D.Meironyté y col., (1999)J Toxicol Environ Health 58, 329.
K Noren ycol. (2000)Chemosphere 40, 1111.
• Posible effects:- neurotoxicity- endocrine disruption- cancer
Wastewatertreatment plant
Sediment
Surfacewater
Estuarinewater
Sediment
Oceanwater
Sediment
Biota
Entering the water cycleControlled/uncontr.
dischargeRun-off
Soil
Groundwater
Sewage sludge Biota
Drinking waterproduction
Man waterworks

32
Sant Joan Despí waterworks (Barcelona)
Prechlorination/predioxichlorination
Sand filtration
Ozonization
Activated carbon
Chlorination
SURFACE WATER
SURFACE WATER
DAMTREATMENT
PLANTRIVER
DISTRIBUTION SYSTEM
PUMPING STATION
GROUND WATER
GROUND WATER
NATURALRECHARGING
THROUGH THE RIVER’S
BED
NATURALRECHARGING
THROUGH THE RIVER’S
BED AQUIFER WELLSSTORAGE
INDUCED SURFACE
RECHARGING
INDUCED SURFACE
RECHARGING
ARTIFICIAL RECHARGING OF
THE AQUIFER
ARTIFICIAL RECHARGING OF
THE AQUIFER
SURFACE WATER
SURFACE WATER
DAMTREATMENT
PLANTRIVER
DISTRIBUTION SYSTEM
PUMPING STATION
GROUND WATER
GROUND WATER
NATURALRECHARGING
THROUGH THE RIVER’S
BED
NATURALRECHARGING
THROUGH THE RIVER’S
BED AQUIFER WELLSSTORAGE
INDUCED SURFACE
RECHARGING
INDUCED SURFACE
RECHARGING
INDUCED SURFACE
RECHARGING
INDUCED SURFACE
RECHARGING
ARTIFICIAL RECHARGING OF
THE AQUIFER
ARTIFICIAL RECHARGING OF
THE AQUIFER
ARTIFICIAL RECHARGING OF
THE AQUIFER
ARTIFICIAL RECHARGING OF
THE AQUIFER
PURIFICATIONPROCESS
WATERWORKS OPERATION
LLOBREGAT.
0.00
100.00
200.00
300.00
400.00
500.00
600.00
ng/L
River Sandfiltration
Ground-water
Ozonation Activatedcarbonfiltration
Drinkingwater
CyanazineSimazineTertbuthylazineDesethylatrazineAtrazineMetolachlorDiuronIsoproturonDimethoateDiazinonMolinatePropanilMecoprop2,4 DMCPA
515.8
252.9
81.7
173.7
48.6 47.3
.
combined
Profile of total pesticide concentration throughout the water treatment process (SJD)
Directive 75/440/EC: max. adm. conc. 5 ug/L for surface waters (intensive phys. & chem. treatment.)Directive 98/83/EC: max. total pesticide conc. 500 ng/L water intended for human consumptionDirective 2006/118/EC: max. individual pesticide conc. 100 ng/L groundwater
Not detected: chlortoluron, linuron, alachlor and bentazone(15 pe) (8 pe)
415
2854

33
Arraenas (DK)AR trial plant
Arraenas artificial recharge plant in Denmark
.. .
.1
..
..
.
2
Lake Arreso
3Abstraction wells
Drinking water
Filtration
Aeration
4
Analyte\Sample Intake SBW SBE IBW1 IBE2 I1 I3 M1 DGUDeisopropylatrazine nd nd nd nd nd nd nd nd ndBAM 6.95 7.03 7.97 9.37 4.31 8.71 3.83 10.44 3.11Desethylatrazine nd nd nd nd 0.31 0.34 0.87 0.25 ndDimethoate nd nd nd nd nd nd nd nd ndSimazine 11.57 11.02 8.93 9.09 13.49 6.33 1.68 1.93 1.09Cyanazine nd nd nd nd nd nd nd nd ndChlortoluron nd nd nd nd nd nd nd nd ndIsoprototuron nd nd nd nd nd nd nd nd ndAtrazine 0.87 0.82 0.62 0.65 1.22 0.41 3.43 0.22 ndDiuron 0.46 0.45 nd 0.97 0.55 nd nd 0.19 ndPropanil nd nd nd nd nd nd nd nd ndtert-Butylazine 2.29 2.25 2.49 2.42 2.61 0.3 nd 0.07 ndLinuron nd nd nd nd nd nd nd nd ndMolinate nd nd nd nd nd nd nd nd ndMetalachlor nd nd nd nd nd nd nd nd ndAlachlor nd nd nd nd nd nd nd nd ndDiazimon 0.18 0.31 0.35 0.23 0.2 0.19 0.15 0.16 0.16
Levels (ng/L) of pesticides in DK samples (2004)
2 sampling campaigns: Sept. 2003 / June 200417 target pesticides by on-line SPE(PLRP-s)-LC-ESI(PI)-MS/MS:
* 15 PI pesticides + propanil + BAM (2,6-dichlorbenzamide)

34
0
5
10
15
20
25
Intake SBW SBE IBW1 IBE2 I1 DI3 M1 DGU
Sampling location
ng/L
Diazimontert-Butylaz.Diuron
Atrazine SimazineDesethylatraz.BAM
Treatment progress
Cumulative levels of pesticides in water samples from DK
1 – Influent (river water)2 – Prechlorination3 – Flocculation/Sand filter4 – Ozonation5 – GAC6 – Chlorination
97.9TOTAL42.8Chlorination72.7GAC
86.3Ozonation+groundwater blending
7.3Flocculation/sand filtration
20.4Prechlorination
Efficiency (%)
Treatment step
Elimination of total nonylphenolic compounds
0
500
1000
1500
2000
2500
3000
3500
1 2 3 4 5 6
ng/L
NPNP1ECNP2EC
0
50
100
150
200
250
300
350
400
1 2 3 4 5 6
ng/L
BrNPClNPBrNP1ECClNP1ECBrNP2ECClNP2EC
Petrovic M y col. (2003) Environ. Sci. Technol. 37, 4442-4448
Nonylphenolic compounds
Halogenated nonylphenolic compounds
Formation of halogenated derivatives (SJD WW)

35
NPEC NP NPEO halogenated derivatives
Average composition of nonylphenoliccompounds after chlorination
(calculated on a molar basis)
Flocculation sludgeChlorinated river waterRiver water
13%
48%
After: Petrovic et al. ES&T, 2003
Formation of chlorinated derivatives of phenolic compounds
- Estrogens:
5 min.NaClO
estrogenic. ~ EE- Phenol- Bisphenol A
Chlorinated derivatives: < biodegradation> estrogenicity
4-ClEE + 2,4-diClEE
than parent comp.
Ethynyl estradiol
estrogenic. 10-1x EE
- ...

36
Water disinfection by-products (DBPs)
• Halogenated compounds are formed by reaction of disinfection agents withorganic matter present in the source water.
http://www.epa.gov/safewater/mdbp/qrg_st1.pdfUS EPA
• 1974: chloroform and other trihalomethanes, first identified DBPs.
Very little information aboutthe occurrence and toxicity
of non-regulated DBPs
Richardson S, Simmons JE, Rice AG (2002) Environ. Sci. Technol. 36, 198A-205A.
UEDirective 98/83/EC
(drinking water)
100 µg/L
10 µg/L
More than 600 DBPsidentified (< 50% total DBPs)
62.4 % unknown
ChemicalChemical analysisanalysis output output forfor a a typicaltypical environmentalenvironmental samplesample
TIC – tentatively identified compoundsAdapted from: C.G. DaughtonU.S. EPA July 2002
Targetanalytes
TIC
unknown
Recognizableartefact
Large portion of naturallyoccurring and
anthropogenic chemicalsof varied toxicity
Naturally occuring compounds
Neglected....Ignored....Omitted.....Overlooked
Anthropogenic compounds

37
Conclusions
Contaminants are widely distributed in the aquatic environment
Sources, transport routes and final distribution in the various environmental compartments depend on the physical-chemical properties of the compounds and on environmental conditions
Identified contaminants represent only a portion of those potentially present and their overall risk significance is largely ignored.
Reduced emission and improved wastewater treatment to diminish occurrence, exposure and detrimental effects.
Acknowledgements
- the EU (project INNOVA-MED [(INCO-2006-517728])
- the Spanish Ministry of Education and Science (project CEMAGUA [CGL2007-64551/HID])
This work has been supported by: