faster gas engine start with less emission - · pdf filefaster gas engine start with less...
TRANSCRIPT

Faster gas engine start with less emission
Improvements obtained by engine modifications
Project Report 2 September 2007
Dokumentrevision
Rev. Reference for ændring
Rev. dato Bemærkninger Init.
7 TKJ 8 TKJs kladde 7/9 Sekretær gennemgang jdg

Faster gas engine start with less emission Improvements obtained by engine modifications
Torben Kvist Jensen

Title : Faster gas engine start with less emission
Report Category : Project Report
Author : Torben Kvist Jensen
Date of issue : 30.09.2007
Copyright : Danish Gas Technology Centre
File Number : 727-71; h:\727\71 start stop\rapporter og notater\delrapport 2\delrap 2 rev 8.doc
Project Name : Start-stop projekt
ISBN : 978-87-7795-304-0

DGC-report 1
Table of Contents Page
1 Introduction........................................................................................................................... 2
2 Conclusions........................................................................................................................... 4
3 Reduction of emissions during start and stop ....................................................................... 5 3.1 Engine #2, Wärtsila 18V34SG ....................................................................................... 6
3.1.1 Description of modification .................................................................................... 6 3.1.2 Emissions ................................................................................................................ 6 3.1.3 Start up time .......................................................................................................... 10
3.2 Engine #4. Rolls Royce KVGS16V-G4........................................................................ 10 3.2.1 Description of modifications................................................................................. 10 3.2.2 Emissions .............................................................................................................. 10 3.2.3 Start up time .......................................................................................................... 15
3.3 Reduction potential for Caterpillar engines .................................................................. 15 3.4 Reduction potential for Jenbacher engines.................................................................... 16
4 References........................................................................................................................... 16
Appendix A. List of participants ................................................................................................... 17
Appendix B. Description of measuring equipment and methods.................................................. 18

DGC-report 2
1 Introduction
This report is the second part of the project “Start hurtigere med mindre emission” (Faster gas engine start with less emission). In the first part of the project the emission of CO, NOx and unburned hydrocarbons (UHC) were measured during start, stop and continues operation for 12 different natural gas fired CHP units. The units were selected to be representative for the installed capacity of power production from natural gas engines in Den-mark. The measurements were analysed and the relative impact of start and stop on the total emissions were determined. The investigation showed that the influence of an increased number of starts and stops will affect the overall emissions differently. Compared to steady-state full-load operation two starts and 16 hours of operation per day will increase the emission CO by 7%, NOx by 1% and UHC by 3%. These values are the average value for the 12 examined engines. Significant differences between examined engines were observed. Details can be found in [1]. Besides determining the relative influence of start and stop on the overall emissions another aim of the project is to examine the possibilities of reduc-ing the emissions during start and stop by modifying the engine and/or the control strategy. So far, the main focus has been on obtaining high reliabil-ity (it starts every time) and safety and only to a minor extent on emissions during start and stop. This report shows the results that were obtained from the engine modifica-tions. The participants in the project are
• PonPower • Jenbacher • Wärtsila • Rolls Royce • National Environmental Research Institute, DMU • Danish Gas Technology Centre, DGC.

DGC-report 3
Measurements were conducted by Steen D. Andersen, DGC in cooperation with engine manufactures. Jan de Wit made the Q/A work. All persons in-volved are listed in Appendix A. The work is financially supported by the Danish gas companies and Energi-net.DK (former Eltra) as a part the PSO programme.

DGC-report 4
2 Conclusions
Two different stationary lean-burn natural gas fired engines installed at dif-ferent combined heat and power (CHP) units in Denmark were modified in order to reduce start up time and the emissions during start up and shut down. The emissions of NOx, CO and UHC were measured during start, stop and steady full-load operation. The measured data were analysed in order to de-termine relative influence of start up and shut down on the overall emis-sions. For an operation sequence consisting of one start and stop per eight hours of operation it was found that the emission of both CO and UHC caused by the start and stop was reduced to between one third and two third due to the conducted modifications. The NOx emissions were only affected insignifi-cantly. For both engines the conducted modifications were based on cutting off the fuel supply to one part of the cylinders during start-up, allowing the other cylinders to be operated at a higher load. This means that engines where the fuel and air are mixed and led to a receiver common for both cylinder banks can not use the suggested solution. For both engines it was possible to reduce the start up time so it satisfies the demands required in order to deliver system balance services. Originally it was planned to optimise a Caterpillar G3500 engine and a Jen-bacher engine as well. But when PonPower (the Danish Caterpillar agent) chose to leave the project it was necessary to omit the Caterpillar engine from the analysis. Furthermore, the modifications were not carried out at the Jenbacher JMS 320 engine.

DGC-report 5
3 Reduction of emissions during start and stop
Two engines of different makes have been modified in different ways in order to reduce the emissions during start up and shut down of the engine. Another aim of the modifications was to reduce the required start-up period, so the engine can be at full load within 15 minutes as required in order to deliver system balance services. The modifications were chosen, designed and implemented by the individ-ual engine manufactures. Details are known by manufactures only. Charac-teristics of the selected engines are given in Table 1.
Table 1. Data of the examined engines.
Unit Make Type* Size #2 Wärtsilä 18V34SG P 6060 MWe #4 Rolls Royce KVGS16V-G4 P 2700 MWe
* P: Pre-chamber The unit number refers to the unit numbering applied in the first report [1]. The selected engines are common for combined heat and power production in Denmark. Originally it was planned to optimise a Caterpillar G3500 engine and a Jen-bacher engine as well. But when PonPower (the Danish Caterpillar agent) chose to leave the project it was necessary to omit the Caterpillar engine from the analysis. Furthermore, the modifications were not carried out at the Jenbacher JMS 320 engine either. However, the possibility of reducing the emissions from these engines during start and stop has been assessed based on experiences gained from the two engines mentioned above.

DGC-report 6
3.1 Engine #2, Wärtsila 18V34SG
The control system of this engine was modified so it was possible to choose different control strategies. Two different strategies for emission reduction were tested. The first modification was focused on reducing UHC emis-sions. The second modification was based on the first modification, but a further attempt to reduce the NOx emissions was made. One additional set of measurements were conducted in order to examine the possibility of reducing the start up time and to examine the effect on the emissions. 3.1.1 Description of modification
The engine is equipped with an electromagnetic fuel injection valve for each cylinder instead of a fuel throttle. In order to reduce emissions during start up and shut down the control system of the engine was modified, so it al-lows cut-off of the fuel supply to one part of the cylinders when the engine is running at low load. This allows a relatively higher load for the cylinders that are supplied with fuel at a given overall engine load. When the overall engine load exceeds 30% of full load all cylinders are fuelled. 3.1.2 Emissions
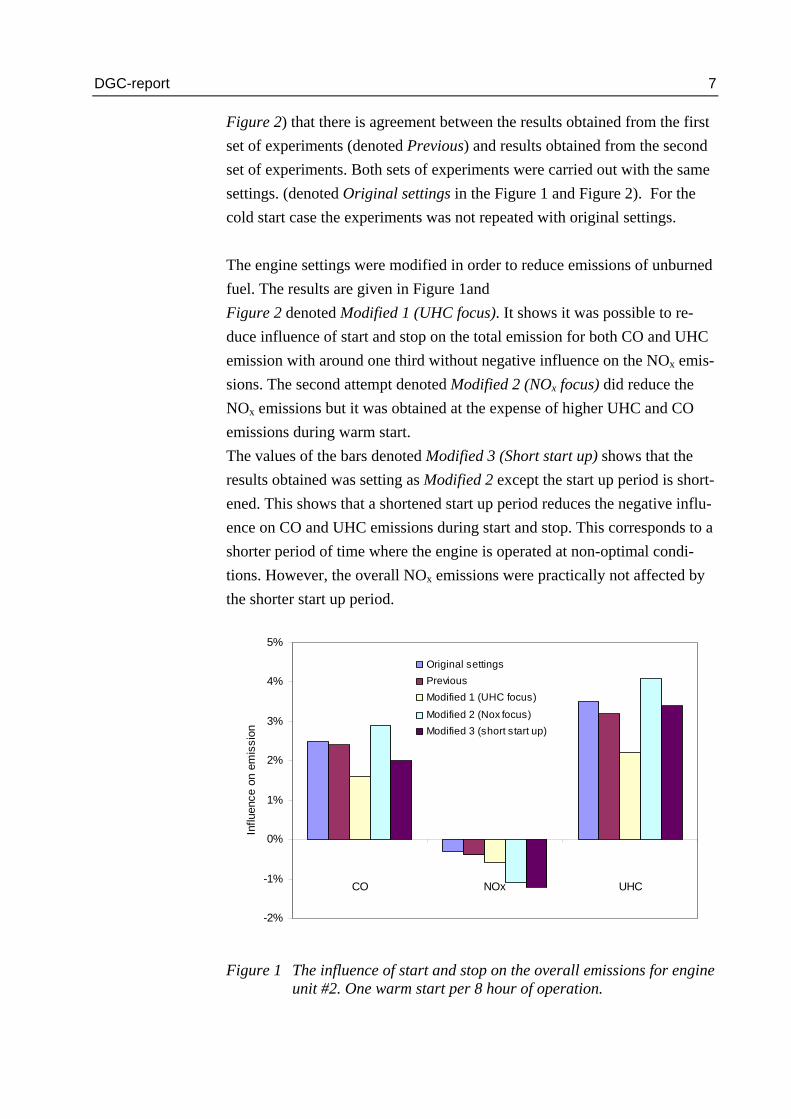
The results are shown in Figure 1 and Figure 2. The values given in the figures are the overall emissions from an operation sequence consisting of a start up period, a period of normal full load operation and a shut down period compared to the emissions during normal full load operation. This means that the value 0 corresponds to a case where there is no influence on start and stop on the overall emissions. The value +1% corresponds to a case where the start and the stop sequence increases the overall emission by 1% compared to normal full load opera-tion for a certain period of operation. Some of the measurements were conducted at the same conditions as the measurements conducted during the first part of the project. The reproduci-bility of both measurements and analyses is satisfying as the measurements showed (Figure 1 and
DGC-report 7
Figure 2) that there is agreement between the results obtained from the first set of experiments (denoted Previous) and results obtained from the second set of experiments. Both sets of experiments were carried out with the same settings. (denoted Original settings in the Figure 1 and Figure 2). For the cold start case the experiments was not repeated with original settings. The engine settings were modified in order to reduce emissions of unburned fuel. The results are given in Figure 1and Figure 2 denoted Modified 1 (UHC focus). It shows it was possible to re-duce influence of start and stop on the total emission for both CO and UHC emission with around one third without negative influence on the NOx emis-sions. The second attempt denoted Modified 2 (NOx focus) did reduce the NOx emissions but it was obtained at the expense of higher UHC and CO emissions during warm start. The values of the bars denoted Modified 3 (Short start up) shows that the results obtained was setting as Modified 2 except the start up period is short-ened. This shows that a shortened start up period reduces the negative influ-ence on CO and UHC emissions during start and stop. This corresponds to a shorter period of time where the engine is operated at non-optimal condi-tions. However, the overall NOx emissions were practically not affected by the shorter start up period.
-2%
-1%
0%
1%
2%
3%
4%
5%
CO NOx UHC
Influ
ence
on
emis
sion
Original settingsPreviousModified 1 (UHC focus)
Modified 2 (Nox focus)Modified 3 (short start up)
Figure 1 The influence of start and stop on the overall emissions for engine unit #2. One warm start per 8 hour of operation.

DGC-report 8
-2%
-1%
0%
1%
2%
3%
4%
5%
CO NOx UHC
Influ
ence
on
emis
sion
previous
Modified 1 (UHC focus)
Modified 2 (Nox focus)
Modified 3 (short start up)
Figure 2. The influence of start and stop on the overall emissions for engine
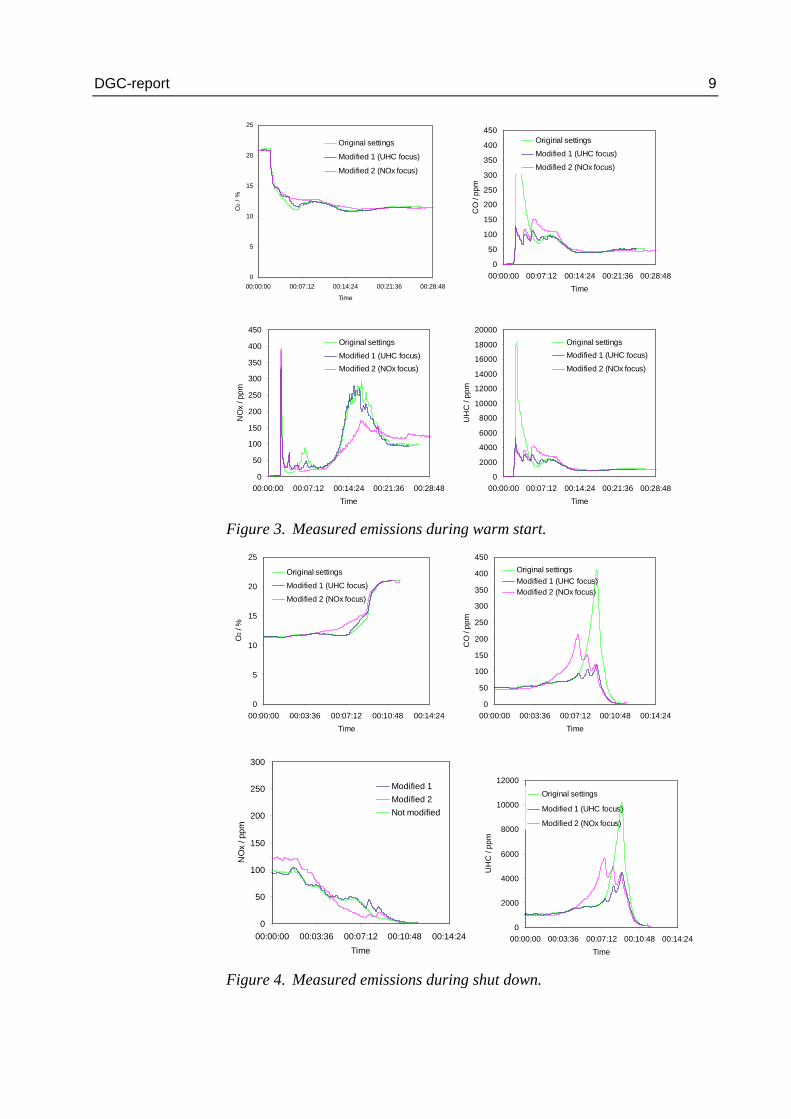
unit #2. One cold start per 8 hour of operation. The measured emissions during warm start and shut down are shown in Figure 3 and Figure 4. The time axis was displaced for the individual curves so the time of ignition was coinciding for the different measurements. The figures shows that the high peaks of CO and UHC was eliminated, and that is the reason for lower influence of start and stop on the overall emissions.
DGC-report 9
0
5
10
15
20
25
00:00:00 00:07:12 00:14:24 00:21:36 00:28:48
Time
O2
/ %
Original settings
Modified 1 (UHC focus)
Modified 2 (NOx focus)
0
50
100
150
200
250
300
350
400
450
00:00:00 00:07:12 00:14:24 00:21:36 00:28:48Time
CO
/ pp
m
Original settings
Modified 1 (UHC focus)
Modified 2 (NOx focus)
0
50
100
150
200
250
300
350
400
450
00:00:00 00:07:12 00:14:24 00:21:36 00:28:48Time
NO
x / p
pm
Original settings
Modified 1 (UHC focus)Modified 2 (NOx focus)
0
2000
4000
6000
8000
10000
12000
14000
16000
18000
20000
00:00:00 00:07:12 00:14:24 00:21:36 00:28:48Time
UH
C /
ppm
Original settingsModified 1 (UHC focus)
Modified 2 (NOx focus)
Figure 3. Measured emissions during warm start.
0
5
10
15
20
25
00:00:00 00:03:36 00:07:12 00:10:48 00:14:24Time
O2 /
%
Original settings
Modified 1 (UHC focus)
Modified 2 (NOx focus)
0
50
100
150
200
250
300
350
400
450
00:00:00 00:03:36 00:07:12 00:10:48 00:14:24Time
CO
/ pp
m
Original settingsModified 1 (UHC focus)Modified 2 (NOx focus)
0
50
100
150
200
250
300
00:00:00 00:03:36 00:07:12 00:10:48 00:14:24Time
NO
x / p
pm
Modified 1Modified 2Not modified
0
2000
4000
6000
8000
10000
12000
00:00:00 00:03:36 00:07:12 00:10:48 00:14:24Time
UH
C /
ppm
Original settings
Modified 1 (UHC focus)
Modified 2 (NOx focus)
Figure 4. Measured emissions during shut down.

DGC-report 10
3.1.3 Start up time
The start up time was measured, and it was found that it varied from one start to another. The longest start up period from receiving start signal to full load operation was 17 minutes, and it was measured during cold start with the modified settings (modified 1). The shortest was 14 minutes, and that was measured during modified settings (modified 2) during a warm start. The demand for selling balance power is that the offered power can be de-livered within 15 minutes. This means the unit can only meet these demands if a power corresponding to only 90% of full load is offered with the present start up strategy. The attempt to reduce the start-up time was successful. The rate of increas-ing the engine load was increased so the time from receiving the start signal till the engine was at full load operation was reduced to 11 minutes. As mentioned above the shorter start up time reduced the negative effect of start and stop. 3.2 Engine #4. Rolls Royce KVGS16V-G4
The fuel supply system and the control system were modified by Rolls Royce in order to reduce the emissions of CO and unburned fuel during start up and shut down. 3.2.1 Description of modifications
The engine is a V-type engine. On the fuel string before one of the cylinder banks a pneumatic ball valve is mounted, so it is possible to cut-off the fuel supply to half of the engine during the first part of the start up period. When the engine load exceeds 200 kWe both engine banks are fuelled. The remain-ing part of the start procedure continues as normal. 3.2.2 Emissions
There has been made modifications of Engine #4. As mentioned above the nature of the modifications allows the control system to switch the effect of the modifications on and off. Since the first set of measurements the unit was equipped with a CO catalyst. Measurements have been conducted with

DGC-report 11
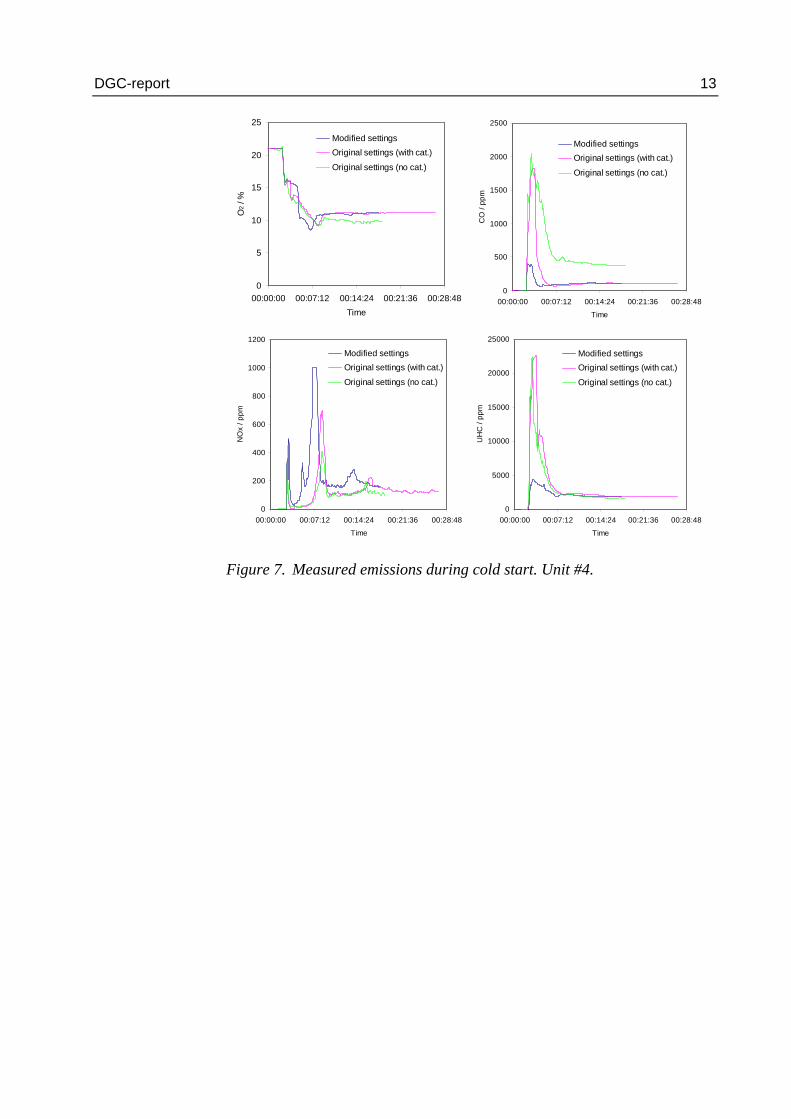
the modified engine with the modifications activated and deactivated. The results of the measurements are compared with results of previously con-ducted measurements (Original settings (no cat.)), see Figure 5 and Figure 6. A CO catalyst needs a certain temperature in order to be active. Despite of that the influence of start and stop on the overall CO emission is reduced by 40% in the cold start case by installing the catalyst. For the warm start case the influence of start and stop on the CO emission was almost eliminated by installation of the CO catalyst. During the warm start-stop sequence the UHC emission was reduced to around one third compared to the original settings without affecting the NOx emissions. In all warm start cases NOx emissions are lower than during normal full load operation. During the cold start sequence the influence on the UHC emission was reduced to around the half applying the installed modifications. The NOx emissions are lower than steady state full load op-eration. During cold start the influence of NOx emissions are the same as during normal operation.
-3%
-2%
-1%
0%
1%
2%
3%
4%
5%
CO NOx UHC
Influ
ence
on
emis
sion
Original settings (no cat.)
Original settings (with cat.)
Modified
Figure 5. The influence of start and stop on the overall emissions for engine unit #4. One warm start per 8 hour of operation.

DGC-report 12
-3%
-2%
-1%
0%
1%
2%
3%
4%
5%
CO NOx UHC
Influ
ence
on
emis
sion
Original settings (no cat.)Original settings (with cat.)Modified
Figure 6. The influence of start and stop on the overall emissions for engine unit #2. One cold start per 8 hour of operation.
As it was seen for unit #2 the CO and UHC peaks occurring just after start up were reduced significantly by the implemented modifications. See Figure 7 and Figure 8. During cold start with the modified settings the NOx emis-sion exceeds the range of the NOx analyser (1000 ppm.). Ther actual NOx emission has been assessed as shown in Figure 9. With the assessed NOx emissions the influence of NOx start and stop on the overalls emissions is +0,8% as given in Figure 6. With a NOx concentration of 1000 ppm. during the period with overload the NOx emission the start-stop influence would have been +0,5% instead.
DGC-report 13
0
5
10
15
20
25
00:00:00 00:07:12 00:14:24 00:21:36 00:28:48Time
O2 /
%
Modified settingsOriginal settings (with cat.)
Original settings (no cat.)
0
500
1000
1500
2000
2500
00:00:00 00:07:12 00:14:24 00:21:36 00:28:48
Time
CO
/ pp
m
Modified settingsOriginal settings (with cat.)
Original settings (no cat.)
0
200
400
600
800
1000
1200
00:00:00 00:07:12 00:14:24 00:21:36 00:28:48
Time
NO
x / p
pm
Modified settingsOriginal settings (with cat.)
Original settings (no cat.)
0
5000
10000
15000
20000
25000
00:00:00 00:07:12 00:14:24 00:21:36 00:28:48
Time
UH
C /
ppm
Modified settingsOriginal settings (with cat.)
Original settings (no cat.)
Figure 7. Measured emissions during cold start. Unit #4.

DGC-report 14
0
5
10
15
20
25
00:00:00 00:07:12 00:14:24 00:21:36 00:28:48
Time
O2
/ %
Modified settingsOriginal settings (with cat.)
Original settings (no cat.)
0
500
1000
1500
2000
2500
00:00:00 00:07:12 00:14:24 00:21:36 00:28:48Time
CO
/ pp
m
Modified settings
Original settings (with cat.)
Original settings (no cat.)
0
100
200
300
400
500
600
00:00:00 00:07:12 00:14:24 00:21:36 00:28:48
Time
NO
x / p
pm
Modified settings
Original settings (with cat.)
Original settings (no cat.)
0
5000
10000
15000
20000
25000
00:00:00 00:07:12 00:14:24 00:21:36 00:28:48Time
UH
C /
ppm
Modified settings
Original (with cat.)
Original (no cat.)
Figure 8. Measured emissions during warm start. Unit #4.
0
500
1000
1500
2000
2500
0 20 40 60 80 100 120
Time / sec.
NO
x / p
pm
Measured concentrationAssessed concentration
Figure 9. Assessed NOx emissions during cold start with the modified set-tings. Unit #4.

DGC-report 15
3.2.3 Start up time
The period from the start signal is given till the engine is turning is fives minutes. From this point it takes 10 minutes before full load is obtained. This means that this unit can only just meet the 15 minutes demand for de-livering balance service. Prior to start up this unit is venting the exhaust gas system. The venting event can be moved from prior to start up to just after shut down. This will reduce the total period of the start up sequence so the 15 minutes demand is met. However, this requires approval by the Danish Safety Technology Authority [2]. 3.3 Reduction potential for Caterpillar engines
It was originally planned to make an attempt to reduce the emissions during start up and shut down on a Caterpillar G3500 engine. However, the Danish Caterpillar agent, PonPower, redraw their participation in the project. This occurred after the first set of measurements was conducted and therefore the emissions during start and stop are known. It was assessed whether the same kind of solutions as tested on the Wärtsila and Rolls Royce engines could be applicable on the Caterpillar engines. On the Caterpillar G3500 engines the fuel and air are mixed before the tur-bocharger. After turbo charging and cooling the air-fuel mixture is supplied to a receiver common for both cylinder banks. This means that it is not pos-sible to supply some cylinders by fuel-air mixtures and others only by air. This means that a solution like the one tested by Rolls Royce and Wärtsila can not be applied on the G3500 engines. The Caterpillar G3600 engines are equipped with a mechanical gas valve before each individual cylinder. The gas valves are supplied from a gas pipe for each cylinder bank. This means that it should be possible to cut the fuel supply for one part of the cylinder during part load. However, that will re-quire significant modifications of the control system of the engine. It is un-certain to which extent such a modification will reduce the emissions but based on the experiences from Engine #2 and #4 it is reasonable to expect some reduction.

DGC-report 16
3.4 Reduction potential for Jenbacher engines
Originally it was planned to try to reduce the emissions during start up on a Jenbacher JMS 320-GS L.NC engine. However, due to re-organisation at the Jenbacher R&D department and general busyness it was not possible to do so within the time frame of the project. However, an attempt was made. Different features for ensuring even stoichiometric conditions during start and stop were implanted in the software of the control system of the engine. The control system of this engine type consists of two different PLCs com-municating with each other. However, it turned out that the older PLC could not handle the implemented modifications. This engine was selected for further modification in order to test a represen-tative selection of the gas engine units installed in Denmark. The first set of measurements showed that the start up and shut down practically did not affect the overall emissions from this engine type.
4 References
[1] Faster gas engine start with less emission - An analysis of emissions during start and stop of natural gas engines, state of art 2005/2006 DGC rapport 2006.
[2] Gasmotoranlæg. Skylning af udstødningssystem. Projektnotat. Juni 2006.

DGC-report 17
Appendix A. List of project participants
• DGC o Hanne Frederiksen, Project manager o Per G. Kristensen o Steen D. Andersen o Jan de Wit o Henrik Andersen o Torben K. Jensen
• PonPower o Jens M. Jakobsen o Flemming Hjøllund
• GE Jenbacher o Jesper Greve Jensen o Jens Hylling Kristensen
• Wärtsila o Bent Iversen o Kent Jensen o Kenneth Kristensen
• Rolls Royce o Keld Skærbæk Nielsen o Kim Larsen o René Hansen
• National Environmental Research Institute, DMU o Malene Nielsen o Jytte Boll Illerup
• Sikkerhedsstyrelsen, Danish Safety Technology Authority. Not a project partner.
o Anders Knak-Nielsen (Safety aspects)
DGC-report 18
Appendix B. Description of measuring equipment and methods
Flue gas conditioning
The flue gas is conditioned according to processes described below, before flue gas is led to the separate analysers. - condensation in glass bottle at ambient temperature - the flue gas is cooled in a cooling dryer; dew point 2 ± 1°C
– capacity 0 – 10 l/min - filtering in fine filter with an efficiency >99.9% for particles 0.3 μm - distribution by means of flow meters to separate analysers - DGC-No.: 01702 / User instruction B-01701 Oxygen in the flue gas
The content of oxygen in the dry flue gas is measured with a paramagnetic oxygen analyser. The data for the analyser are: Manufacturer: SERVOMEX Model: 570A - paramagnetic Range: 0 - 100 %-vol. Repeatability: < 0.2% O2 Linearity: < 0.3% O2 Calibration: N2 and ambient air DGC-No.: 00202/ User instruction B-00202

DGC-report 19
Carbon monoxide in the flue gas The content of carbon monoxide in the dry flue gas is measured with an infrared absorption analyser. The data for the analyser are: Manufacturer: Hartmann & Braun AG Model: Uras 14 Ranges: 0 - 300 to 0 – 2,500 ppm Range used: 0 – 2,500 ppm Repeatability: ≤ 0.5% of range Linearity: ≤ 1% of range Calibration: N2 and calibration gas containing 2001 respectively 239.6 ppm CO in N2 DGC-No.: 00404/User instruction B-00404 Nitrogen oxides in the flue gas
The content of nitrogen oxides in dry flue gas is measured with a chemilu-miniscence analyser using the principle that nitrogen oxide during reaction with ozone emits light. The data for the analyser are: Manufacturer: Thermo Environmental Corp. Model: 42 CHL - chemiluminiscence Ranges: 0 – 2.5 to 0 – 5,000 ppm in 9 ranges Range used: 0 - 500 and 0 – 1000 ppm Repeatability: 1% of full scale Linearity: ± 1% from 0.05 - 2,000 ppm with air supply to the ozone generator Calibration: N2 and calibration gas containing 401 re-
spectively 796 ppm NO in N2 DGC-No.: 00305 / User instruction B-00305

DGC-report 20
Hydrocarbons in the flue gas
The content of unburned hydrocarbons in dry flue gas is measured with an analyser using a flame ionisation detector. The data for the analyser are: Manufacturer: Mess- & Analysentechnik Model: Thermo FID Ranges: 0 – 10 to 0 – 1000000 ppm in user selectable ranges Range used: 0 – 20000 ppm Repeatability: ± 1% of range Linearity: ± 1% of range Calibration: N2 and calibration gas containing 2000 ppm CH4 in N2. DGC-No.: 00607 / User instruction B-00607 Carbon dioxide in the flue gas The content of carbon dioxide in the dry flue gas is measured with an infra-red absorption analyser. The data for the analyser are: Manufacturer: Hartmann & Braun AG Model: Uras 14 Ranges: 0 - 5 to 0 – 15 %-vol. Range used: 0 – 15 %-vol. Repeatability: ≤ 0.5% of range Linearity: ≤ 1% of range Calibration: N2 and calibration gas containing 9.45 %-vol. CO2 in N2 DGC-No.: 00404/User instruction B-00404