fast x-ray micro-tomography of multiphase flow in … synchrotron-based fast micro-tomography is the...
TRANSCRIPT

Transp Porous Med (2014) 105:451–469DOI 10.1007/s11242-014-0378-4
Fast X-ray Micro-Tomography of Multiphase Flowin Berea Sandstone: A Sensitivity Study on ImageProcessing
L. Leu · S. Berg · F. Enzmann · R. T. Armstrong ·M. Kersten
Received: 9 May 2014 / Accepted: 9 August 2014 / Published online: 13 September 2014© The Author(s) 2014. This article is published with open access at Springerlink.com
Abstract Synchrotron-based fast micro-tomography is the method of choice to observe insitu multiphase flow and displacement dynamics on the pore scale. However, the imageprocessing workflow is sensitive to a suite of manually selected parameters which can leadto ambiguous results. In this work, the relationship between porosity and permeability inresponse to systematically varied gray-scale threshold values was studied for different seg-mentation approaches on a dataset of Berea sandstone at a voxel length of 3µm. For validationof the image processing workflow, porosity, permeability, and capillary pressure were com-pared to laboratory measurements on a larger-sized core plug of the same material. It wasfound that for global thresholding, minor variations in the visually permissive range lead tolarge variations in porosity and even larger variations in permeability. The latter is causedby changes in the pore-scale flow paths. Pore throats were found to be open for flow at largethresholds but closed for smaller thresholds. Watershed-based segmentation was found to besignificantly more robust to manually chosen input parameters. Permeability and capillarypressure closely match experimental values; for capillary pressure measurements, the plateauof calculated capillary pressure curves was similar to experimental curves. Modeling on struc-tures segmented with hysteresis thresholding was found to overpredict experimental capillarypressure values, while calculated permeability showed reasonable agreement to experimen-tal data. This demonstrates that a good representation of permeability or capillary pressurealone is not a sufficient quality criterion for appropriate segmentation, but the data should bevalidated with both parameters. However, porosity is the least reliable quality criterion. In
Electronic supplementary material The online version of this article (doi:10.1007/s11242-014-0378-4)contains supplementary material, which is available to authorized users.
L. Leu (B) · F. Enzmann · M. KerstenGeosciences Institute, Johannes Gutenberg University, Becherweg 21, 55099 Mainz, Germanye-mail: [email protected]
L. Leu · S. Berg · R. T. ArmstrongShell Global Solutions International B.V., Kesslerpark 1, 2288 GS Rijswijk, The Netherlands
R. T. ArmstrongSchool of Petroleum Engineering, University of New South Wales, Sydney, NSW 2052, Australia
123

452 L. Leu et al.
the segmented images, always a lower porosity was found compared to experimental valuesdue to micro-porosity below the imaging resolution. As a result, it is recommended to basethe validation of image processing workflows on permeability and capillary pressure and noton porosity. Decane-brine distributions from a multiphase flow experiment were modeled ina thus validated µ-CT pore space using a morphological approach which captures only capil-lary forces. A good overall correspondence was found when comparing (capillary-controlled)equilibrium fluid distributions before and after pore-scale displacement events.
Keywords Image segmentation · Multiphase flow · Modeling · Porous media · Micro-CT
1 Introduction
X-ray micro-computed tomography (µ-CT) multiphase flow experiments are aimed at imag-ing the in situ fluid phase distributions in porous media (Wildenschild et al. 2005; Silinet al. 2010; Iglauer et al. 2011; Setiavan et al. 2012; Andrew et al. 2014). Recently, fastsynchrotron-based µ-CT has been used to image fluid distributions under dynamic condi-tions (Berg et al. 2013b); the term “dynamic” means that fluid flow is maintained whileimaging, with ms integration times thus enabling dynamic process studies on basis of aseries of images. By imaging the pore-scale displacement process during fluid injection andanalyzing, the resulting non-wetting phase cluster size redistribution (e.g., Georgiadis et al.2013) proposed that fundamental mechanisms like invasion percolation for drainage can bevalidated by experimental data. Additionally, the mechanisms underlying multiphase flowthrough porous media can be studied and validated by combining pore-scale numerical mod-eling with µ-CT multiphase flow experiments. However, these approaches require µ-CTimages that are segmented into binary images representing the “true” structure of the imagedrock and immiscible phases (Koroteev et al. 2013). In image segmentation, rock grains (e.g.,quartz grains in typical sandstone rock) are binarized by applying algorithms that account foreither local or global differences of gray-scale values between rock and void space. However,the image segmentation process is non-trivial, and the mislabelling of features occurs easilydue to non-ideal signal-to-noise ratios and/or image artefacts. Therefore, the influence ofimage segmentation on sequential pore space characterization and pore-scale modeling formultiphase flow (i.e., involving parameters important for flow, like permeability, and capil-lary dominated displacement like capillary pressure) must be thoroughly evaluated in furtherdetail since the accuracy of the segmentation process determines how well the resulting binaryimage represents the “true” rock structure. Thus, any pore space characterization, analysisof experimental results or flow modeling will ultimately be influenced by subtle differencesin image segmentation (Iassonov et al. 2009).
Reconstruction of µ-CT images yields in a 3-dimensional (3D) map of X-ray attenuationcoefficients that represent the sample microstructure. This 3D map is constructed of elemen-tary units called voxels that are assigned an attenuation coefficient over a given bit range(e.g., 1–256 for an 8-bit image or 1–65,536 for a 16-bit image). Weak absorbers (low-densitymaterials) exhibit low attenuation and when visualized on a typical gray-scale map these vox-els appear as dark regions, whereas strong absorbers (high-density materials) exhibit highattenuation and appear as brighter regions (Ketcham and Carlson 2001). In an ideal situa-tion where the contrast between attenuation values for the different phases (e.g., void andmatrix) is large enough, the gray-scale intensity distribution (histogram) of the µ-CT imageis bimodal, with two distinct peaks representing each phase. In practice such a situation isalmost never encountered. Typical image histograms do exhibit maxima, e.g., for grains and
123

Fast X-ray Micro-Tomography of Multiphase Flow in Berea Sandstone 453
pores but often the range of gray levels in between does include voxels that below to bothgrains and pores, and hence a histogram-based separation is not easily possible. There is arange of reasons why that happens. Individual voxels are often assigned attenuation valuesdifferent to those expected for a given material for numerous reasons, e.g., phase contrast,beam hardening and, in particular, so-called partial volume effects (Wildenschild and Shep-pard 2013) and noise. Phase contrast is commonly observed in µ-CT data as low intensityareas around phases with higher intensity edges resulting from refraction that is not accountedfor during image reconstruction. During image reconstruction, only the linear attenuation ofX-rays is considered. However, X-ray trajectories are bent as propagation speed increaseswhen traveling through denser material (refraction) which causes a slight change in directionthat is manifested in the resulting image as bright and dark fringes near phase boundaries(Wildenschild and Sheppard 2013). At synchrotron-based and hence monochromatic (narrowbandwidth of energy) µ-CT facilities, this fringing effect can be reduced by decreasing thesample to detector distance (Wildenschild and Sheppard 2013). Unlike for synchrotron facili-ties that can operate with monochromatic energies, beam hardening is a typical problem whenusing lab-based polychromatic X-ray energies. Lower energies are attenuated more stronglyalong the outer perimeter of a sample, which results in higher attenuation coefficients alongthe perimeter of a sample. As a consequence, the energy spectrum of the beam “hardens”causing the edges of the sample to appear more attenuating (Wildenschild and Sheppard2013; Jovanovic et al. 2013). Partial volume effects occur when at a finite resolution of theimage, single voxels represent multiple phases due to overlap in space and thus are assignedan average attenuation value (Ketcham and Carlson 2001). This common artefact occurs, e.g.,at grain contacts, at interfaces between phases, in clay-rich regions or in any other region withfeatures below image resolution. Voxels in interfacial and/or grain contact regions are in acomplex manner affected by a combination of both partial volume effects and phase contrast.This means that potentially a multitude of individual voxels represents features of differentphases albeit with the same attenuation value. Lastly, noise is also a commonly encounteredartefact leading to different pixel gray levels. Noise can originate from the X-ray source, thedetector, electronics but also from scattering of X-ray from the sample and other solid objectsin the beam cone outside of the detector’s direct field of view like sample holders, mountingelements, etc.
Some of the aforementioned effects like noise appear to be reduced by filtering of adataset, which often results in an image with higher contrast between phases and improvesthe separation of the phases in the image histogram. However, the filtering may introduce abias on the results, even though the bimodality in the histogram may visually appear to beimproved (e.g., Armstrong et al. 2012). For an overview of different image filters applied inporous media research see Kaestner et al. (2008). According to Wildenschild and Sheppard(2013), the most popular and widely applied image filters are the anisotropic diffusion (Peronaand Malik 1990), median filter, or statistical approaches (Besag 1986). In applying imagefilters for enhancing features of the image, there is always a loss of information (Iassonovet al. 2009), which must be considered in the sequential steps of image segmentation andanalysis of results.
For the segmentation process in terms of the binarization of a digital image based on eitherlocal or global differences of voxel intensities, a variety of algorithms are available as reviewedby Sezgin and Sankur (2004) and Wirjadi (2007). The most common image segmentationis based on the global threshold approach. Even though it is tempting to manually segmentan image by choosing a threshold value which is visually permissive, this choice is operatorbiased (Wildenschild and Sheppard 2013). To minimize the effect of subjectivity, manyautomated histogram-based algorithms are applied classifying different phases on the basis
123

454 L. Leu et al.
of the shape of the image histogram. Among such automated global threshold segmentationalgorithms, the Otsu’s algorithm (Otsu 1979) or k-means clustering have proven to producethe most accurate results, as shown in a comparative study by Iassonov et al. (2009). When ahistogram-based segmentation algorithm is applied, a mislabelling of voxels with gray-scaleintensity values between the peak values in the image histogram will occur, and the extent towhich this influences the results is unclear. Schlüter et al. (2014) give an excellent overviewof the current state-of-the-art methods in evaluation of image segmentation methods, andreport also on novel histogram bias removal methods, e.g., histogram equalization or ROIdilations, that may improve the threshold selection process by decreasing the influence ofpartial volume effects.
Generally speaking, algorithms that segment data by considering image gradients or localand non-local statistics are also available nowadays and are often preferred over global thresh-olding. Among the most favored algorithms is indicator kriging (Oh and Lindquist 1999),which has been applied to many different sample types and materials (Prodanovic et al. 2007;Porter and Wildenschild 2010). Another approach used in this study is watershed-based seg-mentation (Vincent and Soille 1991), which builds on the fact that in a histogram the graylevels around the maxima can be clearly assigned to, e.g., pores and grains acting as seeds.The gray levels in between, which are difficult to assign from the histogram alone, are com-puted from a region-growing method where phase boundaries are placed along the inflectionregion of image intensity gradients that typically occur at phase boundaries. In general, thewatershed-based segmentation approach is more robust towards long-range gradients andnoise compared to global thresholding. A drawback of watershed-based segmentation is therequirement of seed placement prior to the segmentation process, which is often based on aglobal value and concomitant user bias (Iassonov et al. 2009). Ideally, the seeds are placedin regions of low image intensity gradients (referred to as basins to initiate the growth algo-rithm); then the seed regions are grown using a watershed algorithm where adjacent seedregions meet and form interfaces at regions with high image intensity gradients (Vincent andSoille 1991; Wang 1997). Another local segmentation algorithm, also evaluated in this study,is hysteresis (or bilevel) segmentation (Vogel and Kretzschmar 1996). For this method, twothresholds tmin and tmax are selected for voxels that belong to a low gray value and a high grayvalue intensity class, respectively. The voxels assigned to the lower class are seed regionsfor a region-growing algorithm that stepwise assigns any voxel in between both thresholdsto the lower intensity class if it is connected to the lower class. The remaining voxels will beassigned to the high class, and therefore the algorithm performs well in connecting isolatedvoxels of the transition zone (Schlüter et al. 2010).
In general, the current understanding is that no universal segmentation algorithm can pro-duce consistent results for every type of data (Wildenschild and Sheppard 2013), especially,when image quality is poor (noise, low spatial resolution, image artefacts). There are strate-gies that are more robust than others, but the optimum choice of methods and workflows isstill largely dependent on the actual image. Therefore, it is not our intention to give prefer-ence to one specific method in this work (also because such a comparison will be practicallylimited to specific implementation of methods in different software platforms and highlyinfluenced by different levels of maturity of the respective implementation). Our intention isto give a demonstration of how the choice of a segmentation method can influence the out-come and rather focus on the identification of suitable quality control parameters for efficacymeaningful validation of a given image segmentation approach.
However, estimating the bias caused by a given image segmentation algorithm is difficult,as there is no available absolute reference for the segmented structure. The pore structure ofa sandstone rock, e.g., is not known a priori and cannot be determined (at least in 3D) by
123

Fast X-ray Micro-Tomography of Multiphase Flow in Berea Sandstone 455
independent techniques. Also bias likely depends on the characteristics and quality of theimage data, and likely has to be evaluated for each data series. As best practice, macroscopicproperties obtained from computer modeling are often used as validation criteria, whereby thecalculated pore structure-related values like porosity (Iassonov et al. 2009; Vogel et al. 2005),permeability (Mostaghimi et al. 2013), and capillary pressure curves (Silin et al. 2010), arecompared to experimental data. Permeability can be derived from Lattice–Boltzmann (LBM)single-phase flow simulations on the segmented images (Chen et al. 1991; Coles et al. 1998;Ferreol and Rothmann 1995; Lehmann et al. 2008; Vogel et al. 2005; Zhang and Kwok2006). Capillary pressure curves can be obtained from quasi-static two-phase flow simulationusing a pore morphological approach. Hilpert and Miller (2001) found good agreementbetween the horizontal part of the experimental capillary pressure curves from mercuryintrusion porosimetry (MIP) and values calculated using a pore morphology approach. Thisapproach, first used by Hazlett (1995), operates with several morphological erosion anddilation operations, thus simulating static fluid distributions and saturation of wetting andnon-wetting phase in the binary image of the pore space (Hilpert and Miller 2001; Vogelet al. 2005). The pore morphology approach was successfully applied by Silin et al. (2010)to compute capillary pressure curves and model fluid distributions of supercritical CO2 inbrine-saturated porous media under reservoir conditions (µ-CT two-phase flow experiment).One of the most systematic studies assessing different segmentation algorithms, on overallperformance and global applicability to extracting the pore space of the porous medium, wasmade by Iassonov et al. (2009), who compared calculated porosity values to experimentalvalues.
However, a single porosity value may be represented by a multitude of different porespace geometries. Even though comparing segmentation results to experimental values isgenerally being accepted as important, the comparison with experimentally derived porosityvalues is often unsatisfactory, even if attributed to sample heterogeneity. Unfortunately, ifat all performed, the error assessment in most studies is not going beyond this simple com-parison. Our aim was a detailed and systematic study to evaluate the bias associated witha given image segmentation process and show a path to a validation workflow for flow anddisplacement-related purpose that can be used more generally also on different data sets. Wedo not aim to make an extensive comparison of all different processing and segmentationmethods (for that we refer to Schlüter et al. 2014) but rather select a few common methodswith largely different characteristics to highlight their sensitiveness. After a brief analysis ofcommon image filters, a comparison is made between global thresholding and watershed-based segmentation. For global thresholding, the intensity threshold value used for imagesegmentation was systematically varied over a range of visually permissible values, whereasfor the watershed-based segmentation, the intensity threshold value for setting the seed pointswas systematically varied. Then porosity, permeability, and capillary pressure curves werederived from the segmented images and compared to experimental data from MICP and abuoyancy method for porosity (also see Berg et al. 2013a). Furthermore, we compare datafrom a multiphase flow experiment by Berg et al. (2013b) to fluid distributions modeled usingthe same segmented data. We will show that the watershed-based segmentation approach wasmore robust than global thresholding. Moreover, by systematically varying the global thresh-old value at 5 narrow steps, we gain insight into the region of the image histogram that is mostcritical for image segmentation and the sequential modeling of fluid flow properties and/orpore space characterization. Using this extended evaluation approach, we identify a cate-gory of pixels that are critical for the accurate prediction of fluid flow properties and assessthe sensitivity of no only porosity but also different other parameters that can be used forevaluating the efficacy of a given segmentation approach. Overall, we explore (i) two readily
123

456 L. Leu et al.
available image segmentation approaches, (ii) highlight how subtle differences in user-biasescan influence sequential modeling and characterization results, (iii) identify parameters forjudging the accuracy of the image segmentation process, and (iv) highlight major challengesassociated with modeling pore-scale multiphase flow from digital rock images.
2 Materials and Methods
2.1 Materials
Berea sandstone is easily accessible and well studied (Oren and Bakke 2003). Therefore,upper Berea sandstone is a standard material for flow experiments (core flooding) usingmicro-CT or for flow modeling with a pore network derived directly from the rock (Hazlett1995). A rock core measuring 10 mm in height and 4 mm in diameter was drilled from a blockof fine-grained upper Berea sandstone (Churcher et al. 1991), surrounded by a polycarbonatetube, heat-shrunk to the core to prevent circumventing fluid flow. An average permeabilityof 700 mD and a porosity of 19.9 % was determined for 6 different core plugs of the samerock by Shell standard laboratory measurements (Berg et al. 2013a), along with capillarypressure curves from MICP. The mineralogy of the rock was determined by X-ray diffrac-tion, containing 89–90 % quartz, 3.9–8.7 % feldspars, 1.2 % dolomite, 0.2 % siderite, 0.2 %calcite, 1 % illite, 4.3 % kaolinite, 0.2 % clay minerals, and 0.1 % hematite. Churcher et al.(1991) reported similar mineralogies and porosities ranging from 19.04 % to 26.10 % andpermeability values between 114 and 1,168 mD for different rock samples of the upper Bereasandstone.
2.2 Experimental Methods: Imaging and Flow Setup
The synchrotron µ-CT images were collected in an in situ experiment performed underdynamic flow conditions at the TOMCAT beamline at the Swiss Light Source, Paul ScherrerInstitut, Villigen, Switzerland. For more technical details of the experimental setup, the readeris referred to Berg et al. (2013b). In brief, multiple scanning cycles were conducted for thecylindrical core of Berea sandstone, first the dry rock (pore space filled with air), followedby multiple drainage and imbibition cycles of two-phase fluids (decane and brine). Theexperiment settings were optimized for fast tomography with monochromatic X-ray beamenergy set at 21.25 keV (Mokso et al. 2011). To enhance the X-ray contrast between brine(therefore enhanced contrast between the two phases in the 16-bit output images, which isnecessary for image segmentation) and injected decane, the brine was doped with 10 wt %of CsCl salt. A full tomogram (1,440×1,440×896 pixel3) at a spatial resolution of 2.99µmvoxel length was obtained in as fast as 16.8 s (1,401 projections, 12 ms per integration time).A 2D slice of the dry scan showing image quality of the scan along with different grey valueintensity ranges of the different phases can be found in the Supplementary Material.
2.3 Data Processing
As part of the segmentation workflow, the dry scans were filtered and segmented with imagefilters and segmentation algorithms available within the commercial software package Avizo(FEI Visualization Sciences Group, Mérignac Cedex, France). In this, study grain and poreboundaries were of specific interest, since all simulations were carried out in the segmentedpore space. Therefore, special focus was set on the conservation and representation of the
123

Fast X-ray Micro-Tomography of Multiphase Flow in Berea Sandstone 457
boundary regions. More specific results of the filter analysis are shown in the SupplementaryMaterial. The sensitivity of global segmentation to threshold variation was studied on a cubicregion-of-interest (ROI volume of 7503 voxel) of the anisotropic diffusion filtered imagesof the dry scan. The initial choice of threshold value referred to as mid value was set on avisual basis representing an intuitive manual segmentation threshold selection by comparingthe extent of masked area to the image. In this approach, the maximum gray value intensitythreshold for segmentation of the pore space chosen as mid value in the previous step wasvaried by ±1 % of the maximum gray value intensity of the mid value per step. This resultedin five different files, each with a slightly different threshold for the pore space. Each file isnamed after its relative position towards the mid value (intuitive choice). Starting from thelowest possible visible permissive threshold value and progressing to the maximum possiblethreshold value, the individual segmented files are referred to as lowest, low, mid, high, andhighest respectively. The same procedure was repeated for the assessment of the watershed-based segmentation (two-phase segmentation), varying the threshold value for the seeds forthe pores. In the same manner, the tmin value representing the seed region for the growingalgorithm was varied for hysteresis thresholding. The initial values (mid) for tmin and tmax
were determined closely following a routine by Schlüter et al. (2010). For the tmax value, thegradient image (sobel filter) was calculated from the gray-scale image and segmented witha global threshold. The resulting mask was multiplied with the gray value image, and tmax
was determined according to the mode of the histogram. To be comparable with the othermethods, the tmin value was determined manually by visual comparison. For all segmentedstructures, the three studies porosity and permeability were calculated and plotted versus thethreshold variation in percent. All different files of the segmented pore space were used formodeling of permeability, flow fields, capillary pressure curves, and fluid distributions. Adetailed overview of the workflow along with a description of the REV study is presented inthe Supplementary Material.
2.4 Data Modeling
In the first modeling step, the Lattice–Boltzmann method (LBM) was applied on the fivedifferent watershed-based, five hysteresis thresholding, and five global segmented files toobtain permeability and flow fields for the full variability in the thus segmented micro-structures. The Par-pac module, implemented in the commercial software package GeoDict(Fraunhofer ITWM, Math2Market GmbH, Kaiserslautern, Germany), operates on a D3Q15lattice with three dimensions and 15 velocity directions. Input parameters chosen for single-phase flow simulation characterizing the fluid (i.e., water) were a temperature of 20 ◦C, adensity of 998.234 kg/m3, and a dynamic viscosity of 1 g/ms. Permeability was calculatedfor all three Cartesian directions (x, y, z), each with periodic boundary conditions. In themodel, a pressure drop of 10 Pa was applied, and average velocities in the given direction werecalculated. Values (input or calculated) for the length of the sample, fluid viscosity pressuredrop, and flow velocity were then used to calculate permeability values from Darcy’s law.The calculated values were then plotted versus threshold variation. Porosity values for thedifferent volumes were obtained by counting the connected pore-voxels, while disconnectedpores represented a small fraction of less than 1.5 % of the connected pore volume of thestructures. Flow fields and flow paths computed with LBM showing the fluid velocity foreach direction at each voxel in m/s were processed and rendered in 3D with Avizo code forvisualization in 3D, elucidating the effect of threshold variation.
In the second modeling step, drainage (quasi-static two-phase flow decane/brine) wassimulated on selected ROIs with SatuDict, a module implemented in the GeoDict software.
123

458 L. Leu et al.
The structures of the pore space with varied thresholds for the segmentation of the porespace chosen for this were the watershed-based segmented mid, hysteresis segmented midand highest and global segmentation lowest and highest respectively. The pore morphologyapproach used in this modeling step calculates capillary pressure versus saturation curvesfrom different saturation levels. As boundary conditions for the simulation, a tension of0.0288 N/m for the brine/decane interface (determined experimentally), a contact angle ofbrine and quartz of 0◦ (Xie and Morrow 1998), and a step size by which the radii wereincreased to 0.5 voxel for the largest volume and one voxel for ROI were used. Which of thepores are invaded during simulated drainage or imbibition is determined by several seriesof morphological erosion and dilation operations on the grains, performed by a sphericalstructuring element. Hence, for the invasion of an immiscible fluid into the pore space fullysaturated with another phase, the model is connected to an infinite reservoir of the invadingphase, while the sides are closed. The pores may be invaded only if the phase is connected tothe reservoir (Becker et al. 2008; Hilpert and Miller 2001; Vogel et al. 2005). The followingsteps were performed in sequence for the simulation of drainage:
• Initially, the pore space is saturated with wetting fluid at a capillary pressure Pc = 0, andone side of the sample is connected to a reservoir of the intruding phase, while lateral sidesare closed.
• Starting with a minimum diameter of a sphere as structuring element, the pore space iseroded to obtain connectivity of the pores. Eroded pores connected to the reservoir canbe invaded, pores that are disconnected from the infinite non-wetting phase reservoir areremoved.
• The connected pore space is dilated by the same sphere radius leading to morphologicalopening of the pore space. In this way, a pore size distribution of the pores is obtained.
• Using the Young–Laplace equation, a capillary pressure of the dilated connected poresis obtained. The saturation is calculated by subtracting the volume of unconnected poresfrom the total pore space.
• The entire erosion and dilation procedure is then repeated with the next larger sphereradius.
The calculated capillary pressure curves for the present study were compared to experi-mental MICP data from core plugs. MICP capillary pressure curves require a closure correc-tion, do not show irreducible wetting phase saturation, and generally exhibit higher capillarypressure values compared to the simulated curves due to the interfacial tension and contactangle of mercury and quartz. As a consequence, the experimental capillary pressure valueswere scaled to the water–oil system, and the curve was closure corrected. In this way, thesimulated fluid distributions in the structures were rendered and compared to each other,visualizing the effect of threshold variation. In addition, simulated fluid distributions fromthe mid watershed-based segmented files were compared to segmented experimental fluiddistributions in several selected sub-volumes.
3 Results
The results for threshold variation applying global threshold segmentation on the gray-scaleimage are shown in Fig. 1, where a blue mask marking the selected threshold in each step issuperimposed on a sub-volume of a 2D slice of the filtered gray value image. The maximumthreshold value is increased for each step from lowest to highest. The histogram shows thegray value intensity range (16-bit) and the maximum gray value threshold of each of the five
123

Fast X-ray Micro-Tomography of Multiphase Flow in Berea Sandstone 459
Fig. 1 Selection of gray value threshold range for segmentation with stepwise increasing maximum thresholdfrom lowest to highest choice, as shown by the blue mask superimposed on gray level image (left) representingthe selected area, and the corresponding maximum thresholds in the histogram (right, 16-bit gray scale intensityrange, but only the interval 10,605–19,000 is shown)
threshold selections, marked with a red line and labeled with lowest to highest, respectively.In other words, the images of the masked area within the visually permissive range (left) arecorresponding to the threshold value selected for the pore space in the histogram (right). Theresults demonstrate that the range of threshold values appear reasonable to the human eye.Therefore, the chosen threshold value is highly subjective, and any value within this rangecould be a likely solution.
As shown in Fig. 2, even subtle variation of the threshold value for the pore space resultsin a significant variation for both the calculated porosity and permeability. Each value isdisplayed as a relative change of the mid value in percent. Note that the mid value representsan arbitrary selected absolute maximum gray value intensity value representing the intuitivesegmentation by eye. The terms lowest, low, high, and highest correspond to the relativeposition towards the mid value (intuitive choice). The low value has a 1 % lower maximumthreshold value selection than the mid, and the highest has a 2 % higher maximum thresholdselection than the mid value, respectively. Watershed-based segmentation derived values var-ied by maximum 8 % for permeability and less than 1 % for porosity, respectively. In contrast,for permeability, maximum values derived from global threshold segmentation varied by 28and 32 %, respectively, and about 8 % for porosity. The variation for hysteresis thresholdingwas from −16 to 19 % for permeability and about 6 % for porosity. The absolute permeabilityvalues calculated from global segmentation (green line) ranged from 600 to 1,000 mD. Poros-ity values between 16 and 19 % were obtained. For the watershed-based segmented files, thepermeability and porosity variation was lower, ranging from 680 to 780 mD and 16 to 17 %,respectively. For the last approach, the permeability was in between 520 and 730 mD, andthe porosity varied from 16.7 to 18.7 %. For all cases, however, porosity values estimatedfrom the digital data were less than the 19.9 % porosity measured on a larger core samplein the laboratory. However, the permeability value of the mid threshold selection (722 mD)was close to experimental permeability values of 700 mD. This threshold selection was thusreasonable, while the mid selection of the hysteresis thresholding segmentation underesti-mated permeability by 100 mD. Only the highest selection for the latter approach showed an
123

460 L. Leu et al.
Fig. 2 Porosity and permeability values derived from the increasing gray value threshold sensitivity testsfor pore space segmented by the watershed (red), global threshold (green), and hysteresis thresholding (blue)approach, respectively. Values are expressed as relative difference to the mid value and show that variationmagnitude is significantly higher for the global threshold segmentation approach for permeability in particularcompared to the other two segmentation approaches
equally good match with the experimental values as the mid selection for the watershed-basedsegmentation. However, a better match in porosity compared to watershed-based segmen-tation was observed (hysteresis: 18.73 %, watershed-based: 16.57 % experimental: 19.9 %).Clearly porosity is less sensitive to threshold variation, showing a linear trend in responseto threshold variation, while permeability appears to be much more sensitive, showing anonlinear trend (Fig. 2). Values derived from the watershed-based segmentation were morerobust towards threshold variation, while global segmentation derived parameters showeda broader distribution. Comparing two extreme cases in terms of absolute numbers fromthe lowest to the highest threshold selection, 3,804,494 more voxels were included in thewatershed-based segmentation, but even four times more (12,716,205 voxels) were includedin the global threshold segmentation. The number of voxels from lowest to highest for globalthreshold selection is 3 % of the total amount of voxels of the volume, demonstrating thatthe voxels causing significant permeability changes are situated in a very narrow area in thehistogram.
To visualize the effect of threshold variation, flow fields from modeling with LBM in thelowest and high threshold structures (global segmentation) were compared. A closer lookon the selected ROI revealed that individual flow pathways were opened at higher thresholdvalues, i.e., in narrow channels or in micro-porous areas. The first image of Fig. 3 shows thegray value image of a subsection with several quartz grains and narrow pores with a tube-shaped channel in its center. The other images of Fig. 3 show the corresponding globallysegmented binary images (with lowest and high threshold values for the pore space). Acomparison reveals that the depicted narrow pore throat was opened in both images but atdifferent throat widths. The throat was wider by at least two voxels at its narrowest part in
123

Fast X-ray Micro-Tomography of Multiphase Flow in Berea Sandstone 461
Fig. 3 Three ROI images showing quartz grains and a narrow canal-shaped pore in the center of the 2D slicewith varying widths, depending on the selected threshold value
Fig. 4 2D slices showing that threshold increase (left, top to bottom) caused invasion of narrow channels.The same view in 3D (right) reveals that pore bodies were connected, and overall flux was increased (top tobottom)
the high threshold selection file. Voxels affected by threshold variation thus were situated intransition regions representing phase boundaries with partial volume effects.
Changing the pore throat width has a direct consequence for the flow field as illustrated inFig. 4 (both in 2D and in 3D). In the 2D slices, the connection is only accessed half way forthe lowest threshold value, while flow in the connection is apparently open to the adjacentpore body in the high threshold image. In the 3D view, no flow connection exists for the lowerthreshold, while for the high threshold, the flow path is fully connected. It is also evident fromthe fluid velocities that the average flow velocity increased as the pore diameter generallyincreased with the higher threshold value. This general trend can be observed also fromvisualizations of the entire flow field in 3D (supplementary material). Apparently, smallerpathways have formed, and overall flux has increased in the large pore bodies from lowest tohigh threshold selection. However, flow pathways of a small size such as that shown in Fig. 4also influence the magnitude of stagnant areas and play a more important role for diffusionand dispersion processes (Bijeljic et al. 2013).
123

462 L. Leu et al.
Fig. 5 Comparison of calculated capillary pressure to experimental curve shows that the plateau of thewatershed-based and the highest global threshold segmented structure is in good agreement with experimentaldata, indicating that the main pore throats are well resolved. Note that the experimental curve was closurecorrected shifting it to the right. In addition, the capillary pressure values were scaled to the water–oil system.The simulated curves show residual wetting phase saturation and therefore do not reach a saturation below 0.2.Close to the resolution limit curves start to diverge, showing that the micro-structure is not well segmented
The permeability calculated for the watershed-based segmentation approach showed goodagreement with experimental data. For instance, the mid watershed-based segmentation givesa match in permeability but at a less than 17 % porosity, which is lower than the experimentalvalues of 19.9 %. To explain this intriguing difference, capillary pressure was used as a thirdmatching criterion. Thus, capillary pressure curves for the lowest and highest global threshold,for the mid and highest hysteresis thresholding, and mid value watershed-based segmentedpore space were compared to the experimental data in Fig. 5. The shape of the graph indicatedthat the horizontal part of the capillary pressure curve from the mid threshold value of thewatershed-segmented and the highest global structure showed good agreement, while globalthreshold lowest overestimated, and the hysteresis threshold segmented structure significantlyoverestimated the saturation and capillary pressure of the curve. Strong resemblance of themiddle part of simulated and experimental curves suggests that the core plug and sample porethroat geometry is similar, and that the main pore throats are captured well with watershed-based mid and global threshold highest segmentation. At a capillary pressure value of 6500to 7000 Pa, curves started to diverge. It appears that this divergence corresponds to imageresolution, since this range represents the resolution limit, and the micro-porous areas appearto be not well resolved. Note that scaling the capillary pressure values to a dimensionless J-value using the Leverett J-function (Leverett 1941) showed that the curves are very sensitiveto the porosity and permeability values chosen as input parameters. Scaling to the calculatedparameters of the image resulted in skewed curves, especially, for the global segmentedstructures. Most likely this was due to the porosity values which were underestimated dueto the partial volume effects. Therefore, the (manually) closure-corrected MICP curve wasscaled to the water–oil system for our comparison.
123
Fast X-ray Micro-Tomography of Multiphase Flow in Berea Sandstone 463
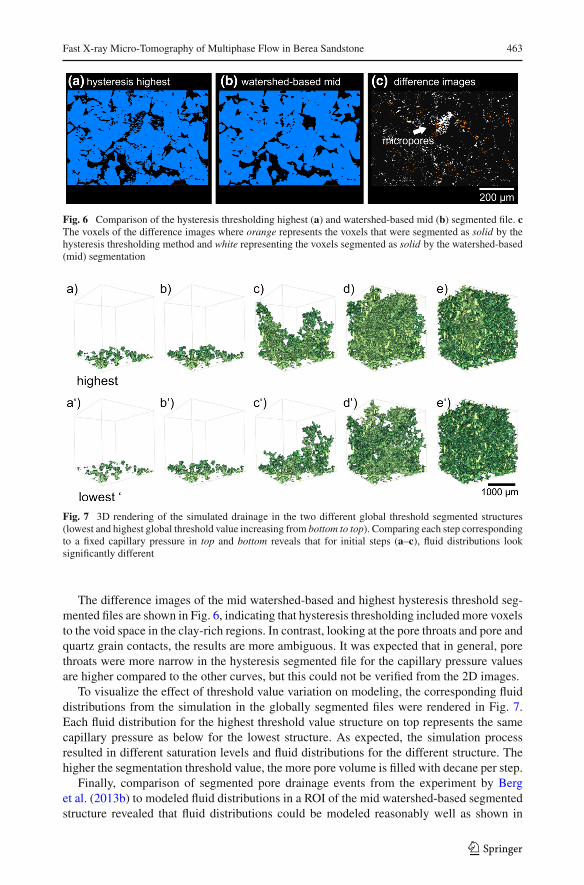
Fig. 6 Comparison of the hysteresis thresholding highest (a) and watershed-based mid (b) segmented file. cThe voxels of the difference images where orange represents the voxels that were segmented as solid by thehysteresis thresholding method and white representing the voxels segmented as solid by the watershed-based(mid) segmentation
Fig. 7 3D rendering of the simulated drainage in the two different global threshold segmented structures(lowest and highest global threshold value increasing from bottom to top). Comparing each step correspondingto a fixed capillary pressure in top and bottom reveals that for initial steps (a–c), fluid distributions looksignificantly different
The difference images of the mid watershed-based and highest hysteresis threshold seg-mented files are shown in Fig. 6, indicating that hysteresis thresholding included more voxelsto the void space in the clay-rich regions. In contrast, looking at the pore throats and pore andquartz grain contacts, the results are more ambiguous. It was expected that in general, porethroats were more narrow in the hysteresis segmented file for the capillary pressure valuesare higher compared to the other curves, but this could not be verified from the 2D images.
To visualize the effect of threshold value variation on modeling, the corresponding fluiddistributions from the simulation in the globally segmented files were rendered in Fig. 7.Each fluid distribution for the highest threshold value structure on top represents the samecapillary pressure as below for the lowest structure. As expected, the simulation processresulted in different saturation levels and fluid distributions for the different structure. Thehigher the segmentation threshold value, the more pore volume is filled with decane per step.
Finally, comparison of segmented pore drainage events from the experiment by Berget al. (2013b) to modeled fluid distributions in a ROI of the mid watershed-based segmentedstructure revealed that fluid distributions could be modeled reasonably well as shown in
123

464 L. Leu et al.
Fig. 8 Comparison of experiment (top) to modeled (bottom, input file pore space: watershed-based segmen-tation) fluid distributions, showing that a reasonably good agreement is established for the central and lastimages of each sequence (b, c and e, f). The initial fluid distribution (a, d) is very different because of differentboundary conditions
Fig. 8. In the first image, the modeled fluid distribution at the bottom (light green) differsfrom experimental data (rendered in dark green), while in the following steps, the distributionis in reasonably good agreement. The pore morphology approach worked well on largervolumes [about 30–40 % of total field of view (FoV)] and results in a reasonably goodmatch with experimental data. The segmentation process of experimental data and additionalexperimental and modeled fluid distributions are shown in the Supplementary Material.
4 Discussion
A result of the sensitivity assessment of different segmentation algorithms (Fig. 2) was thatthe operator bias can be significant when manually selecting a threshold value. This holds trueespecially for global threshold segmentation. Marginal variation in selected thresholds withinthe visually permissive range caused large variations of the derived porosity and permeabil-ity. Variation was stronger for permeability than for porosity for all segmentation routinessuggesting that permeability is more sensitive towards threshold variation and consequentlymore relevant as a validation criterion. Global threshold segmentation produced extremelybiased results overall. This was most likely caused by single voxels affected by partial vol-ume effects in combination with phase contrast situated in the phase transition zone. Thesevoxels affected by threshold variation were situated in a narrow part of the histogram, withinthe range of only about ±3 % of the total voxels between both peaks. Close inspection ofsegmented images and flow fields from LBM simulation revealed that the threshold varia-
123

Fast X-ray Micro-Tomography of Multiphase Flow in Berea Sandstone 465
tion caused pore throat diameters to vary, thus altering the derived permeability. This showsthat only a narrow part of the histogram is relevant for an accurate segmentation of theflow-controlling voxels in the transition zone. The overall good agreement of calculated andexperimental permeability of 720 and 700 mD, respectively, indicated that the main structurewas well represented by the mid file watershed-based segmentation. The same impressionwas reflected by the good match of the plateau of the experimental and modeled capillarypressure curve derived from the image. From that we conclude that the main pore structurewas well segmented using the watershed-based approach. Only for capillary pressure valuesrepresenting pores close to and below the resolution limit did the curves diverge, indicatingthat structures were not resolved well. The porosity offset was probably related to partial vol-ume effects from pores with diameters below imaging resolution, e.g., in clay-rich regions.The micro-porous structure in clay-rich regions is causing partial volume effects in the cor-responding voxels (see the supplementary material); thus, gradients between pores and clayminerals were low. As a consequence, the watershed-based algorithm could not success-fully place boundaries based on the gradients. In addition, the seed placement in clay-richregions was hampered for average voxel gray-scale intensities were higher than for macropores. However, in direct comparison, the hysteresis thresholding results overall produceda closer match to experimental porosity values, while not showing such a dramatic shiftin permeability as the global segmentation, suggesting that the segmentation is reasonable.Comparing the capillary pressure curves from hysteresis thresholding to the other curves, asignificant overestimation of the curve was observed indicating that the threshold selectionfor tmax failed resulting in false labeling of the pore throats. The comparison of 2D images ofthe segmented structures could not explain this offset. Maybe the connectivity was increasedfor the voxels in the transition zone for the hysteresis segmented files, as expected from theimplementation of the method, adding to the overall porosity and permeability and explainingpart of the offset. The individual two capillary pressure curves of the hysteresis method incomparison, however, did not differ significantly indicating that the pore throat segmentationwas similar. Schlüter et al. (2010) propose to base the tmax threshold selection on more thanone filter, and there are more robust routes to determine tmax values. Hysteresis thresholdresults were robust relative to each other but skewed with respect to absolute capillary pres-sure values. A more careful selection might have resulted in better segmentation results. Stillthe watershed-based segmentation produced the most robust results overall. This agrees wellwith observations of other groups that segmentation algorithms based on local criteria aremore accurate (Iassonov et al. 2009; Porter and Wildenschild 2010; Wildenschild and Shep-pard 2013). Overall, the results show that porosity values can differ from experimental data,while the main structure of the pore space may still be represented well. This agrees wellwith a study by Andrew et al. (2013), where for a Ketton Oolite limestone core, an offset ofcalculated to experimental porosity values was observed related to pores below µ-CT resolu-tion. Furthermore, Sok et al. (2009) revealed that the micro-porosity of carbonate rocks cancontribute largely to the total porosity of the sample. According to Hurst and Nadeau (1989),up to 50 %, porosity for diagenetic kaolinite clay-rich areas may account for a few percent ofthe total effective porosity in this study. Simultaneously, the simulated permeability valuescan show a reasonable agreement to experimental data; however, the capillary pressure curvesdo differ as seen for the hysteresis thresholded files. Vice versa permeability may be overpredicted, while capillary pressure is in reasonable agreement as demonstrated for the globalsegmented file with the highest threshold. The conclusion is that permeability and capillarypressure curves may still serve as a robust validation criterion, but it is important to look atmultiple parameters at the same time. Porosity, however, seems to be the poorest validationcriterion.
123

466 L. Leu et al.
The pore morphology approach was applied by many different groups for modeling quasi-static fluid distribution from multiphase flow experiments (Silin et al. 2010). In the presentstudy, the visualization of the fluid distribution for the varied segmentation thresholds showsthat the fluid distribution is significantly different, emphasizing that a correct representationof the pore structure is vital for the modeling results for otherwise the distributions differ.The agreement between segmented fluid distributions from a dynamic flow experiment andmodeled static fluid distributions is reasonably good, demonstrating that the segmentationwas successful, even though different shortcomings were observed resulting from differentboundary conditions and the implementation of the method.
The morphological approach includes only capillary forces but accounts for connectivity.Neglecting viscous forces in modeling pore-scale displacement could lead to a misrepre-sentation of the pore-scale physics. In a recent publication, Armstrong and Berg (2013)demonstrate that capillary action is a consequence of differences between leading and trail-ing menisci during a pore drainage event, resulting in large fluid velocities near the displace-ment front. The main issue when comparing experiment with modeling results is that thefluid distribution and hence long-range connectivity outside of the imaged FoV are virtuallyunknown because of the capillary differences range over multiple pores distance (Armstrongand Berg 2013). Since these differences between menisci over multiple pores can cause theredistribution of fluids (Armstrong and Berg 2013), the displacement processes cannot berepresented correctly if the ROI is too small to properly represent phase topology. The firstchallenge, which might be accommodated by most modeling tools, is to provide meaningfulboundary conditions for a modeling domain, i.e., which pore will lead to inflow of, e.g.,a non-wetting phase in drainage, connected to the non-wetting phase outside the modeledROI. Only after properly defining, the pore connectivity can the impact of higher orderboundary effects be studied, i.e., the difference between model-assumed constant flow andpressure and the reality, which is neither constant flux nor constant pressure (Berg et al.2013b).
Even though the pore morphological approach was tested on small volumes only, webelieve that it is suited for a pre-selection of samples before the actual flow experiments in asynchrotron facility, where beamtime is limited. For instance, samples already scanned in abenchtop µ-CT can be used for the simulation, and in this way, the expected flow pattern canbe studied and suitable samples selected. This may apply for samples with more complex poregeometry, e.g., carbonate rocks, as long as the pore shape is more or less spherical. For moredifferent geometries, e.g., sheet- or crack-like pores, the interfaces will be misrepresented.The pore morphology approach was shown to be easily applicable for this task does not requireas much computational power as the LBM approach, and is therefore potentially well suitedfor integration into a multiphase flow image processing workflow. From our simulationsand experimental fluid distributions, we see that the main pore bodies are more relevant fortwo-phase flow than small pores, in agreement with the literature reports (Wildenschild andSheppard 2013; Okabe and Oseto 2006; Silin et al. 2010; Blunt et al. 2013). Beyond thatour extensive and unique sensitivity study elucidated how threshold variation can change theflow path geometry for narrow pore throats and in micro-porous areas.
5 Summary and Conclusions
Our study of synchrotron µ-CT images of Berea sandstone shows in detail how sensi-tive three arbitrarily chosen segmentation methods, global, hysteresis thresholding, andwatershed-based segmentation are towards variation of manually required input parame-
123

Fast X-ray Micro-Tomography of Multiphase Flow in Berea Sandstone 467
ters in the respective methods. For all investigated methods, a gray value intensity thresholdis required, which for all methods was systematically varied by ±1 % of the intuitive intensityvalue per step, selected on a visual basis. For validation of the result of the segmentation,the properties, porosity, permeability, capillary pressure curves, and quasi-static fluid distri-butions were derived directly from the image data, using Lattice–Boltzmann single-phaseflow simulations for permeability and a pore morphological approach for capillary pres-sure. All derived parameters were compared to experimental data from MICP and porositymeasurements as well as experimental fluid distributions from a synchrotron-based two-phase flow experiment in the same samples, to ensure consistency between the computedcapillary pressure and the associated fluid distributions for the morphological approach. Itwas found that modeled fluid distributions were in reasonably good agreement to experi-mental data which validates the morphological approach for quasi-static applications likethe computation of Hg-air intrusion. Differences between experiment and simulation relateto unknown distributions outside the imaged FoV which set the connectivity boundaryconditions.
The three different segmentation methods lead to different results for the computed prop-erties porosity, permeability, and capillary pressure, which in turn also showed very differentsensitivity to the selection of the input parameters. Generally, permeability is more sensitiveto the selection of input parameters than porosity. A narrow area of the histogram containedcritical voxels of pore throats that were opened or closed by threshold variation. Hence,variations of threshold values can also lead to opening and closing of flow paths and impactlarger-scale connectivity, which may also impact parameters sensitive to stagnant flow regionslike dispersion. Also porosity showed a large offset to measured porosity which is explainedby sub-resolution micro-porosity and mixed-pixel porosity. Therefore, permeability is a morereliable and also more sensitive validation parameter and hence clearly preferred over poros-ity. Also capillary pressure was identified as a suitable parameter for validation. However,it was found that neither permeability nor capillary pressure curve alone could sufficientlyindicate whether the structure was represented well or not. For the case of watershed seg-mentation, consistency for permeability and capillary pressure was achieved, but there wasan offset for porosity due to micro-porosity. We consequently suggest the comparison ofboth, the permeability values and capillary pressure curves at the same time for validation.Using porosity as a validation criterion only may result in errors regardless of the type ofsegmentation algorithm used.
Other segmentation methods were less successful. Using global thresholding on a visualbasis will lead to excessive variation of calculated parameters and large operator bias, whilewatershed-based segmentation was far more effective in accurately segmenting the mainstructural features appropriately. Micro-porous regions below imaging resolution did notcontribute to the flow behavior, most likely causing an offset with respect to experimentalvalues of porosity. Hysteresis thresholding was more robust towards threshold variationand the segmentation favored labelling of the voxels in micro-porous areas, as pore space,potentially leading to elevated porosity and permeability values. However, an overpredictionof the capillary pressure curves was observed indicating that the segmentation of the porethroats was less ideal due to the upper threshold selection.
Acknowledgments We would like to thank the reviewers for their valuable comments and suggestions on ourmanuscript, especially Steffen Schlüter suggesting the application of and giving advice on the implementationof the hysteresis thresholding method. We would like to express our gratitude to Laurent Louis, Holger Ott,Christopher Pentland and Maja Rücker for insightful discussions and ideas about the results of the manuscriptprior to and during the revisions process.
123

468 L. Leu et al.
Open Access This article is distributed under the terms of the Creative Commons Attribution License whichpermits any use, distribution, and reproduction in any medium, provided the original author(s) and the sourceare credited.
References
Andrew, M., Bijeljic, B., Blunt, M.: Pore-scale imaging of geological carbon dioxide storage under in situconditions. Geophys. Res. Lett. 40, 3915–3918 (2013)
Andrew, M., Bijeljic, B., Blunt, M.: Pore-scale contact angle measurements at reservoir conditions using X-raymicrotomography. Adv. Water Resour. 68, 24–31 (2014)
Armstrong, R.T., Berg, S.: Interfacial velocities and capillary pressure gradients during Haines jumps. Phys.Rev. E 88, 043010 (2013)
Armstrong, R.T., Pentland, C., Berg, S., Hummel, J., Lichau, D., Bernard, L.: Estimation of curvature fromµ-CT liquid-liquid displacement studies with pore scale resolution. In: SCA International Symposiuim ofthe Society of Core Analysts (SCA2012-55), Aberdeen, Scotland 27–30 Aug 2012 (2012)
Becker, J., Schulz, V., Wiegmann, A.: Numerical determination of two-phase material parameters of a gasdiffusion layer using tomography images. J. Fuel Cell Sci. Technol. 5, 21006–21014 (2008)
Berg, S., Armstrong, R., Ott, H., Georgiadis, A.H., Klapp, S.A., Schwing, A., Neiteler, R., Brussee, N.,Makurat, A., Leu, L., Enzmann, F., Schwarz, J.-O., Wolf, M., Khan, F., Kersten, M., Irvine, S., Stampanoni,M.: Multiphase flow in porous rock imaged under dynamic flow conditions with fast X-ray computedmicrotomography. In: SCA International Symposium of the Society of Core Analysts (SCA2013-011),Napa Valley, California, USA, 16–19 September 2013 (2013a)
Berg, S., Ott, H., Klapp, S.A., Schwing, A., Neiteler, R., Brussee, N., Makurat, A., Leu, L., Enzmann, F.,Schwarz, J.-O., Kersten, M., Irvine, S., Stampanoni, M.: Real-time 3D imaging of Haines jumps in porousmedia flow. Proc. Natl Acad. Sci. U.S.A. 10, 3755–3759 (2013b)
Besag, J.: On the statistical analysis of dirty pictures. J. R. Stat. Soc. 48, 259–302 (1986)Bijeljic, B., Raeini, A., Mostaghimi, P., Blunt, M.J.: Predictions of non-Fickian solute transport in different
classes of porous media using direct simulation on pore-scale images. Phys. Rev. E 87, 013011 (2013)Blunt, M.J., Bijeljic, B., Dong, H., Gharbi, O., Iglauer, S., Mostaghimi, P., Paluszny, A., Pentland, C.: Pore-
scale imaging and modeling. Adv. Water Resour. 51, 197–216 (2013)Chen, S., Diemer, K., Doolen, G.D., Eggert, K., Fu, C., Gutman, S., Travis, B.J.: Lattice gas automata for flow
through porous media. Physica D 47, 72–84 (1991)Churcher, P.L., French, P.R., Shaw, J.C., Schramm, L.L.: Rock properties of Berea sandstone, Baker dolomite,
and Indiana limestone. In: SPE International Symposium on Oilfield Chemistry (SPE 21044) 20–22 Feb1991, Anaheim, CA, USA (1991)
Coles, M.E., Hazlett, R.D., Spanne, P., Soll, W.E., Muegge, E.L., Jones, K.W.: Pore level imaging of fluidtransport using synchrotron X-ray microtomography. J. Pet. Sci. Eng. 19, 55–63 (1998)
Ferreol, B., Rothmann, D.H.: Lattice–Boltzmann simulations of flow through Fontainebleau sandstone. Transp.Porous Media 20, 3–20 (1995)
Georgiadis, A., Berg, S., Maitland, G. Makurat, A., Ott, H.: Pore-scale micro-CT Imaging: non-wetting phasecluster size distribution during drainage and imbibition. Phys. Rev. E 88, 033002 (2013)
Hazlett, R.D.: Simulation of capillary-dominated displacements in microtomographic images of reservoirrocks. Transp. Porous Media 20, 21–35 (1995)
Hilpert, M., Miller, T.C.: Pore-morphology-based simulation of drainage in totally wetting porous media. Adv.Water Resour. 24, 243–255 (2001)
Hurst, A., Nadeau, P.H.: Determination of clay microporosity in reservoir sandstones: application of quan-titative electron microscopy to petrographic sections for petrophysical evaluation. Society of PetroleumEngineers. http://www.onepetro.org/mslib/app/Preview.do?paperNumber=00019456&societyCode=SPE(1989)
Iassonov, P., Gebrenegus, T., Tuller, M.: Segmentation of X-ray computed tomography images of porousmaterials: a crucial step for characterization and quantitative analysis of pore structures. Water Resour.Res. 45, W09415 (2009)
Iglauer, S., Paluszny, a., Pentland, C., Blunt, M.J.: Residual CO2 imaged with X-ray micro-tomography.Geophys. Res. Lett. 38, L16304 (2011)
Jovanovic, Z., Khan, F., Enzmann, F., Kersten, M.: Simultaneous segmentation and beam-hardening correctionin computed microtomography of rock cores. Comput. Geosci. 56, 142–150 (2013)
Kaestner, A., Lehmann, E., Stampanoni, M.: Imaging and image processing in porous media research. Adv.Water Resour. 31, 1174–1187 (2008)
123

Fast X-ray Micro-Tomography of Multiphase Flow in Berea Sandstone 469
Ketcham, R.A., Carlson, D.W.: Acquisition, optimization and interpretation of X-ray computed tomographicimagery: applications in the geosciences. Comput. Geosci 27, 381–400 (2001)
Koroteev, D., Dinariev, O., Evseev, N., Klemin, D., Nadeev, A., Safonov, S., Gurpinar, O., Berg, S., vanKruijsdijk, C., Armstrong, R., Myers, M.T., Hathon, L., de Jong, H.: Direct hydrodynamic simulation ofmultiphase flow in porous rock. In: Society of Core Analysts (SCA2013-014), 16–19 Sept 2013, NapaValley, CA, USA (2013)
Lehmann, P., Berchtold, M., Ahrenholz, B., Tölke, J., Kaestner, A., Krafczyk, M., Flüher, H., Künsch, H.R.:Impact of geometrical properties on permeability and fluid phase distribution in porous media. Adv. WaterResour. 31, 1188–1204 (2008)
Leverett, C.M.: Capillary behaviour in porous solids. Trans. AIME 142, 140–149 (1941)Mokso, R., Marone, F., Haberthür, D., Schittny, J.C., Mikuljan, G., Isenegger, A., Stampanoni, M.: Follow-
ing dynamic processes by X-ray tomographic microscopy, with sub-second temporal resolution. In: AIPConference Proceedings 1365, pp. 38–41. doi:10.5167/uzh-57653 (2011)
Mostaghimi, P., Blunt, M.J., Bijeljic, B.: Computations of absolute permeability on micro-CT images. Math.Geosci. 45, 103–125 (2013)
Oh, W., Lindquist, B.: Image thresholding by indicator kriging. Trans. Pattern Anal. Mach. Intell. 21, 590–602(1999)
Okabe, H., Oseto, K.: Pore-scale heterogeneity assessed by the Lattice–Boltzmann method. In: Society ofCore Analysts (SCA2006-44), 12–16 Sept 2006, Trondheim, Norway (2006)
Oren, P.-E., Bakke, S.: Reconstruction of Berea sandstone and pore-scale modeling of wettability effects. J.Petrol Sci. Engine 39, 177–199 (2003)
Otsu, N.: A threshold selection method from gray-level histograms. Trans. Syst. Man Cybern. 9, 62–66 (1979)Perona, P., Malik, J.: Scale-space and edge detection using anisotropic diffusion. Trans. Pattern Anal. Mach.
Intell. 12, 629–639 (1990)Porter, M., Wildenschild, D.: Image analysis algorithms for estimating porous media multiphase flow variables
from computed microtomography data: a validation study. Comput. Geosci. 14, 15–30 (2010)Prodanovic, M., Lindquist, W.B., Seright, R.S.: 3D image-based characterization of fluid displacement in
Berea core. Adv. Water Resour. 30, 214–226 (2007)Schlüter, S., Weller, U., Vogel, H.-J.: Segmentation of X-ray microtomography images of soil using gradient
masks. Comput. Geosci 36, 1246–1251 (2010)Schlüter, S., Sheppard, A., Brown, K., Wildenschild, D.: Image processing of multiphase images obtained via
X-ray microtomography: a review. Water Resour. Res. 50, 3615–3639 (2014)Setiavan, A., Nomura, H., Suekane, T.: Microtomography of imbibition phenomena and trapping mechanism.
Transp. Porous Media 92, 243–257 (2012)Sezgin, M., Sankur, B.: Survey over image thresholding techniques and quantitative performance evaluation.
J. Electron. Imaging 13, 146–165 (2004)Silin, D., Tomutsa, L., Benson, S., Patzek, T.W.: Microtomography and pore-scale modeling of two-phase
fluid distribution. Transp. Porous Media 86, 495–515 (2010)Sok, R.M., Varslot, T., Ghous, A., Latham, S., Sheppard, A.P., Knackstedt, M.: Pore scale characterization of
carbonates at multiple scales: integration of micro-CT, BSEM and FIBSEM. In: Society of Core Analysts(SCA2009-18), 27–30 September 2009, Noordwijk, The Netherlands (2009)
Vincent, L., Soille, P.: Watersheds in digital spaces: an efficient algorithm based on immersion simulations.Trans. Pattern Anal. Mach. Intell. 13, 583–589 (1991)
Vogel, H.J., Kretzschmar, A.: Topological characterization of pore space in soil—sample preparation anddigital image-processing. Geoderma 73, 23–38 (1996)
Vogel, H.J., Tölke, J., Schulz, V.P., Krafczyk, M., Roth, K.: Comparison of a Lattice–Boltzmann model, a fullmorphology model, and a pore network model for determining capillary pressure-saturation relationships.Vadose Zone J. 4, 380–388 (2005)
Wang, D.: A multiscale gradient algorithm for image segmentation using watersheds. Pattern Recognit. 30,2043–2052 (1997)
Wildenschild, D., Sheppard, A.: X-ray imaging and analysis techniques for quantifying pore-scale structureand processes in subsurface porous medium systems. Adv. Water Resour. 51, 217–246 (2013)
Wildenschild, D., Hopmans, J.W., Rivers, M.L., Kent, A.J.R.: Quantitative analysis of flow processes in a sandusing synchrotron-based X-ray microtomography. Vadose Zone J. 4, 112–126 (2005)
Wirjadi, O.: Survey of 3D segmentation techniques. Technical Report 123 Fraunhofer ITWM, Kaiserslautern,Germany (2007)
Xie, X., Morrow, N.: Wetting of quartz by oleic/aqueous liquids and adsorption from crude oil. ColloidsSurfaces 138, 97–108 (1998)
Zhang, J., Kwok, D.Y.: Pressure boundary condition of the Lattice Boltzmann method for fully developedperiodic flows. Phys. Rev. E 73, 047702 (2006)
123