fast pyrolysis oil from pinewood chips co-processing with ... · pdf fileproduct quality...
TRANSCRIPT

Fuel 188 (2017) 462–473
Contents lists available at ScienceDirect
Fuel
journal homepage: www.elsevier .com/locate / fuel
Full Length Article
Fast pyrolysis oil from pinewood chips co-processing with vacuum gasoil in an FCC unit for second generation fuel production
http://dx.doi.org/10.1016/j.fuel.2016.10.0320016-2361/� 2016 The Authors. Published by Elsevier Ltd.This is an open access article under the CC BY license (http://creativecommons.org/licenses/by/4.0/).
⇑ Corresponding author.E-mail address: [email protected] (A.R. Pinho).
Andrea de Rezende Pinho a,⇑, Marlon B.B. de Almeida a, Fabio Leal Mendes a, Luiz Carlos Casavechia b,Michael S. Talmadge c, Christopher M. Kinchin c, Helena L. Chumc
a PETROBRAS, Centro de Pesquisas e Desenvolvimento Leopoldo A. Miguez de Mello (CENPES), Ilha do Fundão, Av. Horácio Macedo, 950, Rio de Janeiro, RJ, Brazilb PETROBRAS-SIX, Rodovia do Xisto BR 476, km 143, São Mateus do Sul, PR, BrazilcNREL – National Renewable Energy Laboratory, 15013 Denver West Parkway Golden, CO 80401-3305, USA
g r a p h i c a l a b s t r a c t
a r t i c l e i n f o
Article history:Received 28 July 2016Received in revised form 30 September2016Accepted 3 October 2016Available online 15 October 2016
Keywords:RefiningCo-processingFluid catalytic crackingBiofuelsBio-oil
a b s t r a c t
Raw bio-oil produced from fast pyrolysis of pine woodchips was co-processed with standard Brazilianvacuum gasoil (VGO) and tested in a 200 kg�h�1 fluid catalytic cracking (FCC) demonstration-scale unitusing a commercial FCC equilibrium catalyst. Two different bio-oil/VGO weight ratios were used: 5/95and 10/90.Co-processing of raw bio-oil in FCC was shown to be technically feasible. Bio-oil could be directly co-
processed with a regular gasoil FCC feed up to 10 wt%. The bio-oil and the conventional gasoil werecracked into valuable liquid products such as gasoline and diesel range products.Most of the oxygen present in the bio-oil was eliminated as water and carbon monoxide as these yields
were always higher than that of carbon dioxide. Product quality analysis shows that trace oxygenates,primarily alkyl phenols, in FCC gasoline and diesel products are present with or without co-processingoxygenated intermediates. The oxygenate concentrations increase with co-processing, but have notresulted in increased concerns with quality of fuel properties.The presence of renewable carbon was confirmed in gasoline and diesel cuts through 14C isotopic anal-
ysis, showing that renewable carbon is not only being converted into coke, CO, and CO2, but also intovaluable refining liquid products. Thus, gasoline and diesel could be produced from lignocellulosic rawmaterials through a conventional refining scheme, which uses the catalytic cracking process. The bio-oil renewable carbon conversion into liquid products (carbon efficiency) was approximately 30%, wellabove the efficiency found in literature for FCC bio-oil upgrading.� 2016 The Authors. Published by Elsevier Ltd. This is an openaccess article under the CCBY license (http://
creativecommons.org/licenses/by/4.0/).

A.R. Pinho et al. / Fuel 188 (2017) 462–473 463
1. Introduction
The fast pyrolysis of lignocellulosic biomass has been gainingrelevance in recent years due to its ability to convert raw lignocel-lulosic biomass into a liquid product, frequently referred to as bio-oil [1]. The use of lignocellulosic materials and processing residues,such as wood processing residues, corn cobs, and sugarcanebagasse, has the advantage of decreasing impacts on food security,because they are not used for human consumption. Additionally,agriculture and forest products economics may improve by usingsome of these residues, as is the case of pellet fuel market develop-ment for the power and heating markets [2].
Fluid catalytic cracking (FCC) is one of the main processes in apetroleum refinery and used worldwide to convert heavy petro-leum molecules into valuable products such as gasoline, liquefiedpetroleum gas or LPG (propyl and butyl products), and light cycleoil or LCO (diesel range product). Finished cracked naphtha pro-duced from the FCC is usually the predominant blendstock in thegasoline pool in most of the refineries in Brazil and the U.S. Theuse of the FCC units for direct introduction of raw bio-oils, the pro-duct of the fast pyrolysis of biomass, has many challenges and lim-itations reported in the literature, often from small-scaleexperimentation [3–5]. Bio-oil characteristics, such as low misci-bility with hydrocarbons, high acidity [6], high tendency to formcoke and poor chemical stability are commonly cited as limitationsor even as impediments for its direct use. In one reported exampleof 3/97 weight ratios of pine bio-oil and vacuum gasoil (VGO) co-processing in a continuous reactor FCC pilot unit, more coke andless gasoline were observed along with production of CO andCO2. In this reference, coking and plugging of the feed nozzle wasobserved [7]. Many researchers concluded that a previoushydrodeoxygenating (HDO) step was necessary to make drop infuels [8–11] for the current petroleum fuels infrastructure.Multiple technologies are under development to reduce the oxygencontent of pyrolysis oils and measuring fuel properties to indicatedesirable compositions [12,13].
On the other hand, many tests carried out at FCC lab-scale unitswith heavy fossil feeds showed that their results do not necessarilyreflect behavior obtained at larger scales, especially with respect tocoke formation tendency. Coke results obtained in circulating FCC
Fig. 1. Refining scheme. Bio-oil is directly co-fed into the FCC unit with VGO. Naphtha (gcomply with fuels specifications.
pilot risers are frequently lower than those observed at lab scales[14].
The use of even larger scales offers additional advantages tobetter understand bio-oil co-processing. The Petrobras demonstra-tion unit in São Mateus do Sul (State of Paraná, Brazil) has beenused intensively for many years to develop its FCC technology.Among its features is the possibility of using one or more multiplefeed nozzle injection points positioned along the riser reactor.Therefore, bio-oil and the fossil FCC streams are segregated, dis-pensing the use of any dispersant agent, and can be introducedseparately into the riser reactor.
Fig. 1 shows a possible refining scheme using the FCC process.The bio-oil is directly fed into the FCC unit, without any kind ofprevious hydroprocessing. The naphtha and LCO produced by theFCC are hydrotreated to remove sulfur, as required to comply withfuels specifications.
In a previous study, it was shown that a bio-oil from pinewoodchips, produced in a biomass pyrolysis pilot-scale unit, couldbe co-processed along with a Brazilian VGO with drasticallyreduced impacts on coke yield, even when 20 wt.% of bio-oil wasused. Moreover, the impacts on coke with 10 wt.% of bio-oil werenegligible and feed nozzle or feed line plugging were not observedat demonstration scale [15,16].
In the present work, we co-processed raw bio-oils from pinewoodchips from a commercial producer with a standard BrazilianVGO and tested in a 200 kg�h�1 FCC demonstration-scale unit usinga commercial FCC equilibrium catalyst. Two different bio-oil/VGOweight ratios were used - 5/95 and 10/90 - running at a reactiontemperature of 540 �C and other conventional operating FCC condi-tions. Given the current commercial supply of bio-oil relative tothe supply of petroleum, a feed addition rate of up to 5/95 bio-oil to VGO is considered to be a reasonable starting point for atypical commercial FCC unit. We investigated the influence on con-version and product yields, such as gasoline. We also conducted alonger test run at 5% bio-oil (uninterrupted for 70 h). The liquideffluent was then distilled to produce 400 gallons of gasoline and400 gallons of diesel materials for subsequent hydrotreating andstudies of the quality of the co-processed biofuels produced usingthis route. The co-processing of raw pine bio-oil in the FCC unitoperating at 200 kg�h�1 flow rate with vacuum gas oil and 5 or
asoline range cut) and LCO (diesel range cut) are hydrotreated to remove sulfur and
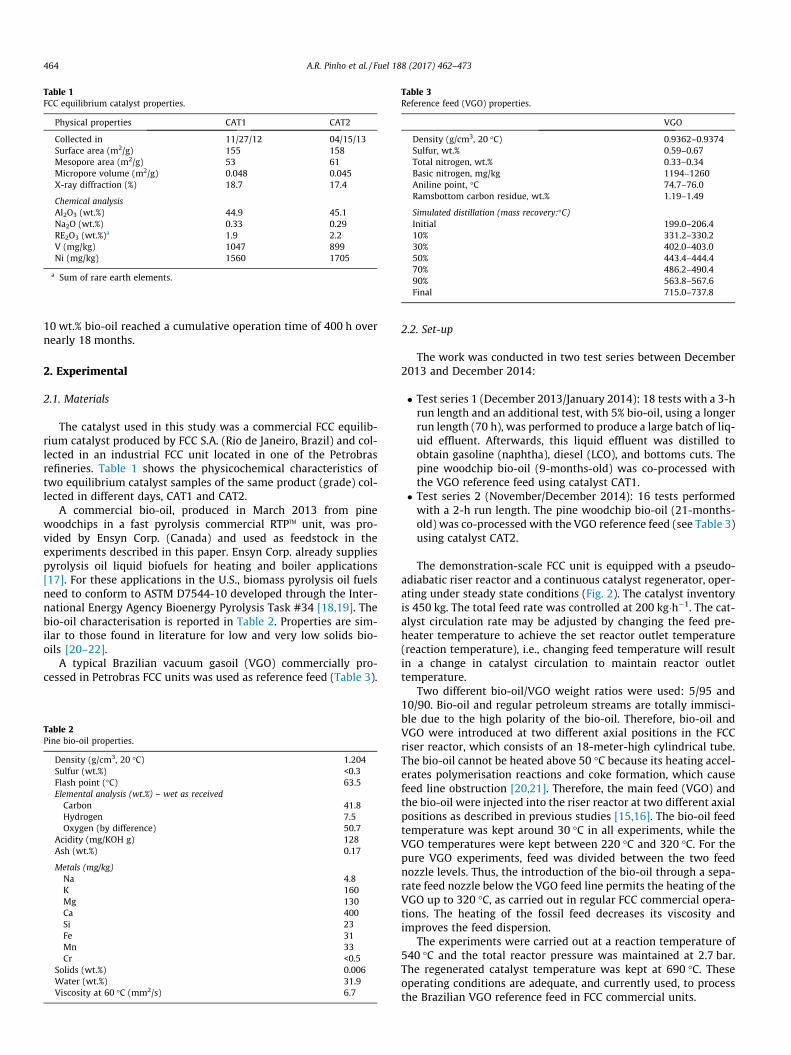
Table 1FCC equilibrium catalyst properties.
Physical properties CAT1 CAT2
Collected in 11/27/12 04/15/13Surface area (m2/g) 155 158Mesopore area (m2/g) 53 61Micropore volume (m2/g) 0.048 0.045X-ray diffraction (%) 18.7 17.4
Chemical analysisAl2O3 (wt.%) 44.9 45.1Na2O (wt.%) 0.33 0.29RE2O3 (wt.%)a 1.9 2.2V (mg/kg) 1047 899Ni (mg/kg) 1560 1705
a Sum of rare earth elements.
Table 3Reference feed (VGO) properties.
VGO
Density (g/cm3, 20 �C) 0.9362–0.9374Sulfur, wt.% 0.59–0.67Total nitrogen, wt.% 0.33–0.34Basic nitrogen, mg/kg 1194–1260Aniline point, �C 74.7–76.0Ramsbottom carbon residue, wt.% 1.19–1.49
Simulated distillation (mass recovery:�C)Initial 199.0–206.410% 331.2–330.230% 402.0–403.050% 443.4–444.470% 486.2–490.490% 563.8–567.6Final 715.0–737.8
464 A.R. Pinho et al. / Fuel 188 (2017) 462–473
10 wt.% bio-oil reached a cumulative operation time of 400 h overnearly 18 months.
2. Experimental
2.1. Materials
The catalyst used in this study was a commercial FCC equilib-rium catalyst produced by FCC S.A. (Rio de Janeiro, Brazil) and col-lected in an industrial FCC unit located in one of the Petrobrasrefineries. Table 1 shows the physicochemical characteristics oftwo equilibrium catalyst samples of the same product (grade) col-lected in different days, CAT1 and CAT2.
A commercial bio-oil, produced in March 2013 from pinewoodchips in a fast pyrolysis commercial RTPTM unit, was pro-vided by Ensyn Corp. (Canada) and used as feedstock in theexperiments described in this paper. Ensyn Corp. already suppliespyrolysis oil liquid biofuels for heating and boiler applications[17]. For these applications in the U.S., biomass pyrolysis oil fuelsneed to conform to ASTM D7544-10 developed through the Inter-national Energy Agency Bioenergy Pyrolysis Task #34 [18,19]. Thebio-oil characterisation is reported in Table 2. Properties are sim-ilar to those found in literature for low and very low solids bio-oils [20–22].
A typical Brazilian vacuum gasoil (VGO) commercially pro-cessed in Petrobras FCC units was used as reference feed (Table 3).
Table 2Pine bio-oil properties.
Density (g/cm3, 20 �C) 1.204Sulfur (wt.%) <0.3Flash point (�C) 63.5Elemental analysis (wt.%) – wet as receivedCarbon 41.8Hydrogen 7.5Oxygen (by difference) 50.7
Acidity (mg/KOH g) 128Ash (wt.%) 0.17
Metals (mg/kg)Na 4.8K 160Mg 130Ca 400Si 23Fe 31Mn 33Cr <0.5
Solids (wt.%) 0.006Water (wt.%) 31.9Viscosity at 60 �C (mm2/s) 6.7
2.2. Set-up
The work was conducted in two test series between December2013 and December 2014:
� Test series 1 (December 2013/January 2014): 18 tests with a 3-hrun length and an additional test, with 5% bio-oil, using a longerrun length (70 h), was performed to produce a large batch of liq-uid effluent. Afterwards, this liquid effluent was distilled toobtain gasoline (naphtha), diesel (LCO), and bottoms cuts. Thepine woodchip bio-oil (9-months-old) was co-processed withthe VGO reference feed using catalyst CAT1.
� Test series 2 (November/December 2014): 16 tests performedwith a 2-h run length. The pine woodchip bio-oil (21-months-old) was co-processed with the VGO reference feed (see Table 3)using catalyst CAT2.
The demonstration-scale FCC unit is equipped with a pseudo-adiabatic riser reactor and a continuous catalyst regenerator, oper-ating under steady state conditions (Fig. 2). The catalyst inventoryis 450 kg. The total feed rate was controlled at 200 kg�h�1. The cat-alyst circulation rate may be adjusted by changing the feed pre-heater temperature to achieve the set reactor outlet temperature(reaction temperature), i.e., changing feed temperature will resultin a change in catalyst circulation to maintain reactor outlettemperature.
Two different bio-oil/VGO weight ratios were used: 5/95 and10/90. Bio-oil and regular petroleum streams are totally immisci-ble due to the high polarity of the bio-oil. Therefore, bio-oil andVGO were introduced at two different axial positions in the FCCriser reactor, which consists of an 18-meter-high cylindrical tube.The bio-oil cannot be heated above 50 �C because its heating accel-erates polymerisation reactions and coke formation, which causefeed line obstruction [20,21]. Therefore, the main feed (VGO) andthe bio-oil were injected into the riser reactor at two different axialpositions as described in previous studies [15,16]. The bio-oil feedtemperature was kept around 30 �C in all experiments, while theVGO temperatures were kept between 220 �C and 320 �C. For thepure VGO experiments, feed was divided between the two feednozzle levels. Thus, the introduction of the bio-oil through a sepa-rate feed nozzle below the VGO feed line permits the heating of theVGO up to 320 �C, as carried out in regular FCC commercial opera-tions. The heating of the fossil feed decreases its viscosity andimproves the feed dispersion.
The experiments were carried out at a reaction temperature of540 �C and the total reactor pressure was maintained at 2.7 bar.The regenerated catalyst temperature was kept at 690 �C. Theseoperating conditions are adequate, and currently used, to processthe Brazilian VGO reference feed in FCC commercial units.

Fig. 2. FCC demonstration-scale schematic drawing. Total feed rate (renewable and fossil) controlled at 200 kg�h�1.
A.R. Pinho et al. / Fuel 188 (2017) 462–473 465
Catalyst-to-oil ratio (CTO) was calculated by dividing the cokeyield by the difference between the coke in the spent catalystand the coke in the regenerated catalyst. A correction factor isapplied to take into account the light hydrocarbons lost from thespent catalyst when it is collected from the stripper.
2.3. Analysis
Coke-free product yields were calculated and normalised (i.e.,the coke yield was excluded from the normalisation) into maingroups defined as: dry gas (C1, C2 hydrocarbons, and hydrogen),liquefied petroleum gas (LPG: C3 and C4 hydrocarbons), gasoline(C5–220 �C boiling point), light cycle oil (LCO: 220–343 �C boilingpoint), bottoms (boiling point above 343 �C), coke, carbon monox-ide, carbon dioxide, and water. The yield of each fraction is given by
Yield of fraction i ð%Þ ¼ mass of fraction itotal mass in the feed
� 100 ð1Þ
The coke yield was calculated from the flue gas (produced in theregenerator from the combustion of the coke deposited on the cat-alyst) mass flow rate and the chromatographic composition of itsconstituents.
Gaseous products collected in gasbags during the experimentswere analysed by using an Agilent 7890 micro gas chromatographyunit equipped with three columns, two thermal conductivitydetectors, and one flame ionisation detector.
The water was calculated from the difference between the totalwater added into the unit (catalyst lifting, feed dispersion, catalyststripping, and the catalyst separation device) and the water col-lected at the end of each experiment.
The conversion is defined as the sum of the dry gas, LPG,gasoline, coke, carbon monoxide, carbon dioxide, and water, i.e.,100 – LCO (wt.%) – bottoms (wt.%).
Liquid samples were collected and analysed by simulated distil-lation (ASTM D2887) according to their boiling point range.
The liquid effluents were submitted to a gas chromatography –flame ionisation detector (paraffins, isoparaffins, aromatics,naphthenes, and olefins - PIANO) in order to obtain a detailed char-acterisation of the gasoline fraction composition in terms ofn-paraffins, i-paraffins, aromatics, naphthenes, i-olefins andn-olefins up to a boiling range of 220 �C. An Agilent 6890 N gaschromatograph was used with a HP PONA methyl silicone columnand a flame ionisation detector. The water content in the liquidswas measured using the volumetric Karl Fischer method.
The 14C (renewable carbon) concentrations in the gasoline andLCO fractions were determined by accelerator mass spectrometry(AMS) combined with isotope ratio mass spectrometry using theASTM D6866-12 method at Beta Analytic Inc. laboratories inMiami, Florida, USA.
The liquid effluents were also analysed using an adapted UVtechnique from UOP (UOP 262-59) to measure the phenolic con-tent of different distillation cuts.
Further chemical information on the gasoline samples wasobtained by ion chromatography to identify and quantify phenoliccompounds present compared to just those present in the VGOonly processing.
3. Results
A set of graphs (Figs. 3 and 4) includes 34 experiments andshows the product yields as a function of the conversion extent.

Fig. 3. Effect of the feed on the yields at different conversion levels: VGO cracking 1st test series ( ), VGO/Bio-oil cracking 95/5 1st test series ( ), VGO/Bio-oil 90/10 1st testseries ( ), VGO cracking 2nd test series (▲), VGO/Bio-oil cracking 95/5 2nd test series (+), VGO/Bio-oil 90/10 2nd test series (s).
466 A.R. Pinho et al. / Fuel 188 (2017) 462–473

Conversion, wt. %
Hyd
roge
n, w
t. %
63 64 65 66 67 68 69 70 71 72 730,00
0,02
0,04
0,06
0,08
0,10
Conversion, wt. %
Met
hane
, wt.
%
63 64 65 66 67 68 69 70 71 72 730,0
0,5
1,0
1,5
2,0
Conversion, wt. %
Ethe
ne, w
t. %
63 64 65 66 67 68 69 70 71 72 730,0
0,5
1,0
1,5
2,0
Conversion, wt. %
Prop
ene,
wt.
%
63 64 65 66 67 68 69 70 71 72 733
4
5
6
7
8
Conversion, wt. %
Prop
ene/
Tota
l C3,
wt/w
t
63 64 65 66 67 68 69 70 71 72 730,70
0,75
0,80
0,85
0,90
Conversion, wt. %
Bute
nes/
Tota
l C4,
wt/w
t
63 64 65 66 67 68 69 70 71 72 730,50
0,55
0,60
0,65
0,70
0,75
0,80
Fig. 4. Gas phase yields at different conversion levels: VGO cracking 1st test series ( ), VGO/Bio-oil cracking 95/5 1st test series ( ), VGO/Bio-oil 90/10 1st test series ( ), VGOcracking 2nd test series (▲), VGO/Bio-oil cracking 95/5 2nd test series (+), VGO/Bio-oil 90/10 2nd test series (s).
A.R. Pinho et al. / Fuel 188 (2017) 462–473 467

Table 4Oxygen balance during co-processing (kg of oxygen/100 kg of feed) - feedtemperature = 280 �C.
5% bio-oil 10% bio-oil
Initial 2.54 5.07
CO 0.57 0.97CO2 0.29 0.44Water 1.24 3.11Not classified 0.44 0.55
468 A.R. Pinho et al. / Fuel 188 (2017) 462–473
Both test series were included: the first one, carried out in Decem-ber 2013/January 2014 with 18 experiments, and the second inNovember/December 2014 with 16 experiments. Although testsequences in 2014 were performed with similar VGO feeds andFCC equilibrium catalysts, in the second experimental test seriesthe bio-oil had aged an additional 10 months by the time it wasused. Fig. 3 shows the main group of products, dry gas, LPG, gaso-line, LCO, bottoms, coke, carbon monoxide, carbon dioxide andwater. These yields add up 100% (in weight). Four other productsof interest, such as hydrogen, methane, propene, and ethene, canbe found in Fig. 4. Co-processing tests with 5% and 10% of bio-oilwere carried out in alternate times. The mass balance closurewas between 96 wt.% and 100 wt.%.
Despite the different bio-oil ages, the resulting product yieldswere again very similar to those found in other studies with bio-oil from pine woodchips [15,16]. Although the cracking of pureVGO does not produce any CO, CO2, or water, some CO and CO2
formed in the regenerator could be observed in the products dueto their entrainment in the regenerated catalyst. Catalytic crackinghas shown a great ability to remove O-compounds from the bio-oiland primarily convert them into water, followed by CO and then byCO2, indicating a predominance of dehydration reactions due to theFCC catalyst acidity (Fig. 3).
CO formation prevailed over CO2 in the co-processing of bio-oil,indicating the predominance of decarbonylation reactions overdecarboxylation. In other studies in literature performed usinghydrodeoxygenated bio-oil or catalytic pyrolysis oil [8,23] at labo-ratory scale, the CO2 yields are higher than CO yields. On the otherhand, a previous study using this same experimental FCC unitobtained the same proportion of oxygenated products, i.e., preva-lence of decarbonylation reaction over decarboxylation [16].
A clear decrease in the dry gas yields was obtained when bio-oilwas processed. Hydrogen, methane, and ethene yield decreasedsignificantly (Fig. 4), which compensates, to some extent, for thehigher CO and CO2 yields. Likewise, there is some decrease inLPG yields. The C3 and C4 olefinicity increased. According to Cormaet al., complex reaction pathways are involved in the catalyticcracking of biomass. Olefins and paraffins present in the gas-phase are formed by three main catalytic pathways: dehydrationreactions, hydrogen-producing reactions, and hydrogen-consuming reactions [24]. The higher C3 and C4 olefinicity wouldbe the consequence of the predominance of hydrogen-consumingover hydrogen-producing reactions and bio-oil H-deficiency.
The decrease in the hydrogen, dry gas (except CO and CO2), andLPG may preserve or slightly decrease the wet gas compressor feedrate, i.e., the net effect would be a similar gas feed rate to the FCCwet gas compressor.
In the first test series, the gasoline overcracking (maximum ofgasoline) was not reached for the pure VGO processing and thegasoline yield for 5% bio-oil was practically the same as wasobtained with VGO, while some decrease was observed at10 wt.%. However, in the second test series, the gasoline overcrack-ing region was reached for all feeds, including the VGO. Gasolineyield was maximized at a conversion between 68 wt.% and 69 wt.%,and these maximum values were approximately the same (Fig. 3)for all the feeds studied. Likewise, LCO yields, which were the samelevel for pure VGO and 5%, slightly decreased at 10% bio-oil. On theother hand, bottoms yields increased slightly when 5% or 10% bio-oil was added to the feed (Fig. 3).
In both sequences, separated by a period of 10 months, a cleardrop in coke yield was observed at 5 wt.% bio-oil when comparedwith pure VGO and it increased back again to the level obtainedwith pure VGO when 10% of bio-oil was added to the feed. It isprobable that, at 5% of bio-oil, dilution effects caused by the pres-ence of water and oxygen in the bio-oil prevail over its pronouncedcoke formation tendency. At a 10% bio-oil level, the more pro-
nounced bio-oil trend to promote coke formation caused the returnto the coke level originally obtained by the pure VGO.
In an industrial FCC unit, metals present in an FCC fossil feed,such as Na, Ni, V and Fe, cause deactivation of the catalyst, so freshcatalyst is constantly added and equilibrium catalyst is removed tokeep the FCC equilibrium catalyst activity. The industrial catalystmake-up rate is usually around 1.0 kg catalyst�m�3 feed. Thealkaline metals present in the bio-oil, such as Na, K, Ca and Mgmay also cause catalyst deactivation (zeolite destruction). Equilib-rium FCC catalyst was used in these experiments, instead of freshFCC catalyst, and catalysts samples were collected during the firstco-processing test series. Samples were collected after approxi-mately 22 h, using a 1.0 kg�m�3 feed catalyst make-up rate andmetals content and textural properties of the catalyst were anal-ysed. Increases in K (from 271 ppm to 650 ppm) and Ca(936 ppm to 1287 ppm) in the catalyst were observed under theseconditions. Despite the evident increase in alkaline metals, it wasnot possible to observe a clear drop in surface area or microporevolume. Therefore, longer run tests, without catalyst make-up,would be necessary to assess the impact of alkaline metals onthe FCC catalyst.
3.1. Oxygen balance
There was no detectable difference in the water content in theliquid effluents produced from bio-oil and those produced frompure gasoil. All liquid effluents contained approximately 400 ppmwt. of water. Likewise, elemental analysis did not indicate the pres-ence of oxygen (obtained by difference) in the liquid effluents.
The oxygen mass balance was calculated based on the oxygencontent in the feed (50.7 wt.% of oxygen, as shown in Table 2)and in the products: CO, CO2, water, liquid products and othercomponents not classified in coke or gaseous fraction (Table 4).As observed in literature in oxygen balances obtained with HDO,water is the main oxygenated product [6]. However, contrary towhat is observed with HDO, CO formation and decarbonylationreactions prevail over decarboxylation and CO2 formation.
3.2. Quality of the gasoline, LCO, and bottoms
The PIANO analysis was used to explore the gasoline fraction indetail. Compared at the same conversion level, the benzene,toluene, and C8 aromatics concentrations in gasoline were lowerwhen pure VGO was used (Fig. 5). Contrary to what was observedin literature from the co-processing of 20 wt.% HDO and 80 wt.%VGO, monoaromatics formation increased with the increase ofthe conversion [10].
A long uninterrupted test was carried out, co-processing 5% ofbio-oil at 540 �C in the FCC unit. The liquid effluent was distilledto produce gasoline, diesel range (LCO), and bottoms cuts (seeTable 5). Between parentheses are typical property values obtainedat the same reaction temperature and VGO feed quality. Asobserved in literature with HDO-oil, bio-hydrocarbon productswere obtained with very little oxygen [11]. Only phenolic com-pounds were observed in the products when bio-oil was used asfeed. Other studies have also observed that co-processing of either

Fig. 5. Benzene, toluene, C8 aromatics and C6–C9 aromatics concentration in gasoline at different conversion levels: VGO cracking 1st test series ( ), VGO/Bio-oil cracking 95/5 1st test series ( ), VGO/Bio-oil 90/10 1st test series ( ), VGO cracking 2nd test series (▲), VGO/Bio-oil cracking 95/5 2nd test series (+), VGO/Bio-oil 90/10 2nd test series (s).
Table 5FCC naphtha (gasoline range), LCO (diesel range), and bottoms properties produced from 5% bio-oil co-processing at 540 �C. Values between parentheses represent the fossil fuelobtained from a typical Brazilian VGO.
Gasoline LCO Bottoms
Density (g/cm3, 20 �C) 0.7755a (0.73–0.76) 0.9125 (0.92–0.96) 1.0997 (1.04–1.20)Carbon (C), wt.% 85.60 87.00 n.a.Hydrogen (H), wt.% 12.68 10.79 n.a.Sulfur, wt.% 936 (700–1200 mg/kg) 0.56 (0.50–0.70) 0.88 (0.70–0.90)Nitrogen, wt.% 166 (150–250 mg/kg) 0.10 (0.14–0.24) n.a.RVP, kPa 48.1 (50.0–60.0) 14.0 n.a.Water, mg/kg 120 (50–200) 256 n.a.Biocarbon, wt.% 1 (0) 1 (0) n.a.Phenols, mg/kg 4636 (2000–3300) n.a. n.a.Thiophenols, mg/kg 96 (20–50) n.a. n.a.Phenols + Thiophenols, mg/kg 4732 3364 n.a.BSW, wt.% n.a. n.a. 0.0Ashes, wt.% n.a. n.a. <0.001 (0.10–0.40)Viscosity at 60 �C, mm2/s n.a. n.a. 342.1Viscosity at 82.2 �C, mm2/s n.a. n.a. 68.46Viscosity at 100 �C, mm2/s n.a. n.a. 29.18
Simulated distillation (mass recovery: �C)Initial �20.6 (�20.0 to 0.0) 34.9 334.05% 39.4 (10.0–30.0) 144.4 340.510% 61.2 (25–40) 202.2 348.130% 100.1 (60–80) 234.7 379.050% 134.2 (90–130) 255.3 (250.0–270.0) 410.570% 161.2 (150–170) 275.8 444.090% 194.9 (160–190) 299.8 491.895% 202.5 (180–200) 310.1 511.2Final 220.7 (200.0–240.0) 343.7 (340.0–390.0) 526.2
n.a. – not available.a Higher value may have been caused by the lower RVP required to transport samples.
A.R. Pinho et al. / Fuel 188 (2017) 462–473 469

470 A.R. Pinho et al. / Fuel 188 (2017) 462–473
hydrodeoxygenated oil and vacuum gasoil or catalytic pyrolysis oiland vacuum gasoil [6,23] or model compounds, such as guaiacol[25], led to the presence of phenol and alkylphenols in the gasolinefraction. However, phenol and alkylphenols are also found in thegasoline obtained from the VGO formed from the reaction in theriser between the oxygen entrained in regenerated catalyst andthe hydrocarbon feed [26,27]. This value is typically around3000 ppm wt. Phenolic compounds were identified and quantifiedby using ion chromatography (see Table 6) obtained from a fossilfeed (VGO), 5% of bio-oil, and 10% of bio-oil. Phenol and alkylphe-nols increased steadily with the bio-carbon content in the feed.
Phenolic compounds are also observed in shale oils [28], whichhave been widely processed in many FCC units. Therefore, U.S.refineries are not unfamiliar with high phenolic content feedstocks.Phenolics have been mentioned in literature as gasoline octaneboosters and antioxidant additives for gasoline, jet fuel or dieselrange products [29–31]. However, the possible effect of the pheno-lic molecules produced from the bio-oil in the catalytic cracking ongasoline stability is yet to be determined.
McCormick and co-workers [13] examined the fuel propertiesof phenols, guaiacols, anisoles, and other compounds that couldbe present in upgraded biomass-pyrolysis oils. At low blend levelsthe phenolics slightly increased octane number and reduced gumformation. However, phenol and the cresol isomers exhibit poorsolubility in hydrocarbons, especially at low ambient tempera-tures. In addition, cresol boils at 202 �C, well above the T90 (90%volume recovered temperature) limit in U.S., European, and manyother gasoline standard specifications (185 �C or 190 �C). Boilingpoint increases with increasing number and length of alkyl chains,with propyl phenol, for example, boiling at 232 �C, well above theend point limit of 225 �C for gasoline. The T90 and end point limitsseverely constrain the quantity of alkyl phenols that can beblended into gasoline. If present at low levels in diesel fuels, thephenolic compounds improved conductivity, lubricity, and oxida-tion stability, but have very low cetane number limiting their pres-ence to a few wt.%.
Baumgardner et al. [32] showed that residual diesel blends con-taining phenolic compounds that can be obtained from pyrolysisoils show slightly positive effects at low percentages (2 vol.%)and some tradeoffs. At higher blend levels properties deteriorate.The authors suggest that phenolics should be limited to 2%. Itwas observed that, below this limit, reduced in-cylinder tempera-tures lead to lower NOx levels while slightly increasing CO andCH2O (negative effects) and inhibit PM10 (particle matter below10 lm) generation, arguably, in favor of increased total hydrocar-bons emissions. In the 5–6 vol.% level directionally negative effectsoccur such as in-cylinder temperatures appear to rise, reducing COemissions but raising NOx emissions. Thermal efficiency also decli-nes as the fuel additives have greater impact on the combustiontiming and overall energy release of the total blend.
Table 6Phenols (ppm wt.) in the gasoline range by ion chromatography.
From VGO From 5%bio-oil
From 10%bio-oil
Phenol 362 844 1681p-Methoxyphenol 36 0 04-MePhenol 562 724 13382-MePhenol 526 652 10873,4-DiMePhenol 55 122 2133,5-DiMePhenol 90 413 5972,3/2,6-DiMePhenol 235 127 11752,4/2,5-DiMePhenol 399 439 566Benzene-1,4-diol 0 0 0Benzene-1,2-diol 0 0 0
Total phenols 2265 3321 6657
The partially renewable gasoline and light cycle oil (400 gallonseach) were sent to the United States and hydrotreated. The proper-ties of the resulting fuels after the hydrotreatment met specifica-tions pursuant to Title 40 CFR Part 79 promulgated by the CleanAir Act required for the sale of renewable fuels into U.S. commerceand EnsynCorp.was granted regulatory approval from theU.S. Envi-ronmental Protection Agency (EPA) for both gasoline and dieselproducts with renewable content [33]. The same pathways werealso approved by the California Air Resources Board under theLow Carbon Fuel Standard program [34]. Description of the U.S.specifications will be provided in a companion paper along withthe techno-economic assessment and lifecycle analyses results [35].
4. Discussion
It is frequently reported, based on FCC laboratory and pilot-scale results, that coke production in the FCC units isexcessively high when raw (untreated) bio-oil is used as feed [5].In small-scale units, even low bio-oil amounts or hydrogenatedbio-oils may cause a considerable increase in coke yield, opera-tional instabilities, and plugging by coke formation. However,some characteristics inherent to small-scale units may explainthe differences in yields obtained in the present study performedat a much larger scale unit (feed rate unit 200 kg�h�1).
4.1. Feeding a lignocellulosic stream into the FCC riser reactor
Most FCC lab-scale units, such as ACE (advanced cracking eval-uation) and MAT (microactivity test) apparatuses, use a single lineto introduce the feed. Co-processing studies in laboratory-scaleunits require the blending of different feeds in the unit feeding ves-sel. However, bio-oils and fossil streams are not miscible due todifferences in their polarities. Therefore, FCC co-processing exper-iments necessitate the use of some emulsifier. In some studies1 wt.% of emulsifier was used to blend 10 wt.% of bio-oil with thefossil feed. In the experiments reported in this work, an emulsifierwas not necessary, because the fossil and the renewable feeds weresegregated and injected at different heights in the demonstration-scale FCC unit, minimizing or possibly avoiding these problems inoptimized systems.
In a commercial FCC unit, separated feed lines and tanks wouldbe necessary for bio-oil introduction due to its high acidity, whichrequires proper stainless steel materials to minimize corrosion.Moreover, feed segregation would allow bio-oil operation to bediscontinued, in case the economics are no longer attractive or ifthere are pyrolysis oil supply discontinuities, without impairingregular FCC operation.
The pyrolysis oil or other oxygenated feeds need to be main-tained below 50 �C. Excessive heating promotes severe coke plug-ging in the feed lines. For instance, even pure ethanol rapidlydehydrates, polymerises and forms coke in feed lines when heatedabove 50 �C. On the other hand, fossil feeds, such as VGO and ATR(atmospheric residue, bottom of the atmospheric residue distilla-tion tower), are heated in a commercial FCC unit at temperaturesbetween 180 �C and 320 �C to reduce their viscosity, obtainingproper feed atomisation and dispersion through the feed nozzles.Feed dispersion is of the outmost importance to decrease cokeyields and the selectivity of the cracking reactions. Therefore, thereare different adequate feed temperatures for the bio-oil and the reg-ular FCC feed. In laboratory-scale, the main concern in FCC co-processing studies is avoiding coke plugging and ensuring the feedline is kept below 50 �C, which affects the fossil feed dispersion andincreases coke yields beyond the values that would be caused solelyby the bio-oil.
Again, the segregation between the fossil and renewable feedsusing larger scales allows the operation at optimum temperature

A.R. Pinho et al. / Fuel 188 (2017) 462–473 471
for each feed. In the present study, the bio-oil was kept below50 �C, while the VGO was heated between 220 �C and 320 �C, mak-ing it possible to obtain an optimum feed dispersion through thenozzles for both feeds.
Fig. 6. Riser pressure drop, bio-oil feed rate and VGO feed rate vs. time (a) 9-month-old bio-oil with 67 h of operation, 5 wt.% and 10 wt.% of bio-oil alternately, (b) 21-month-old bio-oil: primary axis (on the left) riser pressure drop ( ), secondary axis(on the right) VGO feed rate ( ) and bio-oil feed rate ( ).
4.2. Temperature profile in an FCC reactor
The raw lignocellulosic biomass includes mainly different typesof macromolecules: cellulose, hemi-cellulose, and lignin. Celluloseis a linear polysaccharide, composed only of glucose, whilehemi-cellulose is a more complex polysaccharide of multiplesix- (hexoses) and five-carbon sugars (pentoses) [36,37]. Likewise,lignin is an interpenetrating, mostly mononuclear, aromatic poly-mer with some oxygen functionalities (ethers being predominant).Although these macromolecules widely break apart in biomass fastpyrolysis reactors, the bio-oil still contains some amount of highmolecular weight molecules [37].
FCC reactors are commonly used to break large molecules intosmaller ones, generating LPG, gasoline, and diesel range productsfrom liquid streams as heavy as atmospheric residues. Industrialriser reactors temperatures are usually set between 500 �C and550 �C. However, the heaviest part of the residues distillation curveis well above these temperatures; usually at least 15 wt.% of it isabove 550 �C. In the industrial FCC unit, the set reactor tempera-ture represents the temperature at the top of the riser reactor,when most of the cracking reaction had already taken place. Nev-ertheless, the temperature varies widely along the riser reactorheight. Higher temperatures are found in the bottom of the riserand the temperature decreases along the riser height until reachingthe temperature set for the reaction at the top. At the bottom, thehot catalyst from the regenerator is around 700 �C. A thermal shocktakes place when the hot catalyst contacts the liquid bio-oil feedinside the reactor. Some heat vaporises the feed and heat alsobreaks large molecules into smaller ones, so that these smallermolecules penetrate into the catalyst pores. Therefore, the realtemperature in the feed nozzle reactor region, where the contactbetween the catalyst and the feed occurs, is around 600 �C, wellabove the set reaction temperature. The temperature then decaysdue to the endothermic reactions occurring along the reactor. Ifsuch an axial temperature profile did not exist, the heaviest frac-tion of the liquid feed would not vaporise and would be instanta-neously transformed into coke, which would deposit on thecatalyst and abate the selectivity of the catalyst, causing deteriora-tion in the yields profile.
Nevertheless, most of laboratory-scale FCC reactors, includingMAT reactors or fluidised ACE units, are designed to operateisothermally, do not present any temperature profile and are oftenmaintained at the desired reactor temperature during the wholeexperiment.
These differences explain much of the divergent results fromlaboratory, pilot, and commercial scales when heavy feeds areused. A comparison between a laboratory-scale and a pilot riserunit was carried out using a typical Brazilian VGO and atmosphericresidues [14]. The laboratory unit (ACE) produced more than eightabsolute points of coke for atmospheric residues compared to thepilot riser, while coke yields were practically the same in bothscales when a VGO feed was used. As in an FCC commercial unit,in the pilot riser the catalyst-feed mixing zone temperature is atleast 100 �C higher than the temperature at the top of the riserreactor, contrary to what happens in ACE units, where the entirereactor is kept at the same temperature. Therefore, the coke yieldsobtained from ACE increase significantly when the heavy endfractions of the feed distillation curve increases, suggesting thatthe non-vaporised portion of the feed remains as a liquid and istransformed directly into coke.
Bio-oils distillation curves can be generated with thermogravi-metric analysis (TGA) [38]. As in ATR, bio-oils present highamounts of heavy distillation fractions, which do not vaporise orbreak unless they are submitted to extremely high temperatures,suggesting that their behaviour in laboratory-scale would be sim-ilar to the one found with ATR feeds.
In the reactor riser profile obtained in the experimentsdescribed in this paper, the temperature drops from 690 �C toapproximately 660 �C after contacts with the renewable feed anddecreases again to less than 580 �C due to the contact with theVGO feedstock and to the endothermic reactions that take placein the riser until reaching the final reaction temperature of 540 �C.
The bio-oil injection in the demonstration-scale reactor beforethe VGO benefited from the high regenerated catalyst temperatureat the base of the riser reactor and the thermal shock between bio-oil large molecules and the hot catalyst. Moreover, the localcatalyst-to-bio-oil ratio in the base of the riser is higher than theaverage catalyst-to-oil ratio (CTO) considering the entire reactor.The total CTO is approximately 6–9 in a regular FCC riser reactor,while the local CTO for the bio-oil was much higher at the bottomof the riser. For a 10 wt.% bio-oil injection at the bottom of the riserreactor, the local CTO ratio is approximately 10 times higher andthe catalyst temperature is approximately 690 �C, helping to ther-mally break and vaporise the heaviest fraction of the bio-oil.
4.3. Bio-oil ageing
Fig. 6a shows the pressure drop trends measured along severaltests carried out in January 2014, right after the bio-oil wasreceived. Although the variations in the test conditions (5–10 wt.% of bio-oil, and different feed temperatures) alternate in time,

472 A.R. Pinho et al. / Fuel 188 (2017) 462–473
the riser pressure drop varied between 200 kPa and 250 kPa over69 h until all the planned tests with bio-oil were finished in thefirst test series. It is worth noting that this bio-oil was already 9-months-old when it was finally used.
The same bio-oil was used again in December 2014. Althoughthe product yield profiles were not altered, the pressure drop inthe riser increased very fast along each test as shown in Fig. 6b,which represents operating conditions during one of the tests car-ried out with the aged bio-oil. The clean-up of the deposits insidethe reactor could be carried out by allowing some catalyst circula-tion without any feed introduction during some minutes. Thisstop-and-go operation indicates some bio-oil deterioration11 months after the first trials and that, as any other renewablematerial, bio-oil has an ‘‘expiration date” for this application,which is a function of production and storage conditions. This sit-uation is analogous to that of biomass pyrolysis oils intended foruse in various types of fuel-burning equipment under various cli-matic and operating conditions. There are several standard specifi-cations of properties covered by the ASTM D7544.
4.4. Renewable carbon content in the liquid products
Specific bio-oil characteristics, such as its tendency to separateinto two test series and become heterogeneous, require the use of14C technique to assure that the quality and amount of the bio-oilfed in the FCC unit is the one initially expected. Thus, 14C isotopicanalysismust be conducted to calculate renewable carbonmass bal-ances and the amount of renewable carbon contained in the FCCproducts.
The renewable carbon content in the gasoline and LCO rangewere measured by 14C analysis and compared with another studyin literature, which processed 10 wt.% and 20 wt.% of bio-oil pro-duced from pinewood [16]. Fig. 7 represents renewable carboncontent versus the % of bio-oil in the feed. Liquid product contained2 wt.% and 5 wt.% of renewable carbon when 10 wt.% and 20 wt.%of bio-oil was used, respectively. In the present work, liquid prod-ucts contained 1 wt.% of renewable carbon from 5 wt.% bio-oil (seealso Table 5). Therefore, for a similar reference feed (VGO), FCCconditions, and bio-oil origin, approximately 30% of the renewablecarbon from the bio-oil ends up in in the liquid products for a bio-oil usage between 5 wt.% up to 20 wt.%. This efficiency is in therange estimated by Talmadge et al. [36] for hydroprocessing,where approximately 30–50 wt.% of the carbon in the feed is con-verted into carbon in the upgraded oil. However, contrary to thehydroprocessing route, the FCC has the advantage of not requiring
Fig. 7. Renewable carbon content in the liquid product at different bio-oil feedpercentages: present study ( ), Literature [16] ( ).
the use of an external source of hydrogen to produce gasoline ordiesel range blendstocks.
The putative product yields from a virtual 100 wt.% bio-oilprocessing can be calculated from the linear extrapolation via100 wt.% VGO and at 5 wt.% bio-oil/95 wt.% VGO, or at 10 wt.%bio-oil/90 wt.% VGO. The linear extrapolation yields are higherthan those calculated via 14C (approximately 60 wt.% against30 wt.%). De Miguel Mercader et al. [11] co-processed 20 wt.%HDO oil/80 wt.% Long Residue in a laboratory-scale unit and com-pared with the result obtained from 100 wt.% HDO oil. Similarly,putative yields profile obtained via linear extrapolation give betterresults (more gasoline, less coke) than the results obtained frompure HDO oil. The authors suggested internal hydrogen transferand reduction in coke precursor concentration during the co-processing of the renewable and the fossil feed as potentiallyoperative mechanisms to explain these results. However, theyconcluded that, to date, it is not possible to determine whichmechanism causes the changes in the yield profile.
5. Conclusions
This paper demonstrates the technical feasibility of co-processing raw bio-oil with VGO, a fossil feedstock, in the fluidcatalytic cracking. Different feeding strategies for integrating thebio-oil into the FCC unit were necessary due to its low miscibilitywith petroleum streams. Up to 10% of bio-oil having an oxygen con-tent of approximately 50% was directly fed into a demonstration-scale FCC riser reactor that had multiple feed injection points.
The tests conducted with the same bio-oil in two differentexperimental test series showed that while a 9-month-old bio-oildid not cause operating problems in the FCC unit, a 21-month agedbio-oil may affect operating conditions.
The oxygen present in the bio-oil was almost completelyremoved through catalytic cracking, mostly as water and as COor CO2 to a lesser extent. However, the oxygenated compoundsconcentrations, especially alkyl phenols, increased in co-processed gasoline and diesel products compared to the amountspresent in processing of VGO alone.
The presence of renewable carbon was confirmed in gasolineand diesel cuts through 14C isotopic analysis, showing that renew-able carbon is not only being converted into coke, CO, and CO2, butalso into valuable refined liquid products. Thus, gasoline and dieselcould be produced from lignocellulosic raw materials through aconventional refining scheme, which uses the versatile catalyticcracking process.
The bio-oil renewable carbon conversion into liquid products(carbon efficiency) was approximately 30%, well above the effi-ciency found in literature for FCC bio-oil upgrading fromlaboratory-scale equipment, whose characteristics enhance cokeformation in the reactor and deteriorate the yields profile.
The successful demonstration of raw pyrolysis oil (50 wt.% oxy-gen) co-processing suggests that it would also be feasible to co-process partially-upgraded bio-oils as well. This also suggests therewould be an optimal hand-off point between the biorefinery and thepetroleum refinery. More data for co-processing partially upgradedpyrolysis oils are needed to further investigate this optimisation.
Future studies must also be dedicated to address catalyst deac-tivation caused by alkaline metals present in bio-oils, which mayrequire an increased catalyst make-up rate.
Subsequent analysis and publications will present the economicfeasibility and lifecycle analysis of the co-processing strategy.
Acknowledgements
The research reported in this paper was a result of theMemorandum of Understanding to Advance Biofuels Cooperation

A.R. Pinho et al. / Fuel 188 (2017) 462–473 473
between the governments of Brazil and the United States started in2007 and continued through the Strategic Energy Dialogue since2011. The Brazilian Ministry of Mines and Energy (Dr. RicardoDornelles) provided significant encouragement to these activities.The U.S. Department of Energy (Rhia Davis), through the staff ofthe Office of Energy Efficiency and Renewable Energy InternationalPrograms (Dr. Robert Sandoli) and the Bioenergy TechnologiesOffice (Dr. Valerie Reed and Dr. Jonathan Male), led the bilateralwork and enabled and encouraged the collaboration. TheCooperative Research and Development Agreement Number 12-500, Biomass Pyrolysis to Hydrocarbons, in the Refinery Context,between Petroleo Brasileiro SA and the Alliance for SustainableEnergy, was conducted by researchers at Petrobras/CENPES/SIXand the National Renewable Energy Laboratory. We thank a verylarge number of involved managers and staff of these organizationsfor facilitating this productive bilateral collaboration.
The authors are grateful to Petrobras for permission to publishthis work. The authors also would like to acknowledge the workdone by the Petrobras-SIX (São Mateus do Sul, State of Paraná,Brazil) demonstration-scale group, especially Henrique Wilmersde Moraes. We would also like to thank CENPES/PDEDS/QM group,Marco Antonio Gomes Teixeira, Luiz Alexandre Sacorague, andCleber Gonçalves Ferreira for the development of the chemicalanalysis techniques used in this study. Finally, a special thanks toBarry Freel and Robert Graham (Ensyn Corp., Canada) and MatheusGuimarães (Fibria, Brazil) for their assistance in the logistics andtransportation of the bio-oil and the renewable fuels.
References
[1] Bridgwater AV, Peacocke GVC. Renew Sustain Energy Rev 2000;4:1–73.[2] International Bioenergy Trade: History status & outlook on securing
sustainable bioenergy supply demand and markets. In: Junginger M, Goh CS,Faaij A, editors. Lecture Notes in Energy, vol. 17; 233 p. ISBN: 978-94-007-6981-6.
[3] Graça I, Lopes JM, Cerqueira HS, Ribeiro MF. Ind Eng Chem Res 2013;52:275–87.
[4] Garcia JR, Bertero M, Falco M, Sedran U. Appl Catal A 2015;503:1–8.[5] Marinangeli R, Marker T, Petri J, Kalnes T, Mccall M, Mackowiak D, et al.
Opportunities for biorenewables in oil refineries. Des Planes: UOP FinalTechnical Report; 2005. 60 pp. DOE Report: DE-FG-36-05GO15085 at <http://www.osti.gov/scitech/biblio/861458> [last visited: 03-08-2016].
[6] Oasmaa A, Elliott DC, Korhonen J. Energy Fuels 2010;24:6548–54.[7] Bryden K, Weatherbee G, Habib ET. Flexible pilot plant technology for
evaluation of unconventional feedstocks and processes. Catalagram2013;113:3–21.
[8] Fogassy G, Thegarid N, Schurmann Y, Mirodatos C. Green Chem2012;14:1367–71.
[9] Lappas AA, Bezergianni S, Vasalos IA. Catal Today 2009;145(1–2):55–62.[10] Fogassy G, Thegarid N, Toussaint G, Van Veen AC, Schurmann Y, Mirodatos C.
Appl Catal B: Environ 2010;96(3–4):476–85.[11] De Miguel Mercader F, Groeneveld MJ, Kersten SRA, Way NW, Schaverten CJ,
Hogendoorn JA. Appl Catal B 2010;96(1–2):57–66.
[12] Zacher AH, Olarte MV, Santosa DM, Elliott DC, Jones SB. Green Chem2014;16:491–515.
[13] McCormick RL, Ratcliff MA, Christensen E, Fouts L, Luecke J, Chupka GM, et al.Energy Fuels 2015;29:2453–61. doi: http://dx.doi.org/10.1021/ef502893g.
[14] Gilbert WR. In: Technical papers of the Rio oil and gas expo and conference, Riode Janeiro; 2010.
[15] Pinho AR, Almeida MBB, Mendes FL, Ximenes VL. Pure Appl Chem 2014;86(5):859–65.
[16] Pinho AR, Almeida MBB, Mendes FL, Ximenes VL, Casavechia LC. Fuel ProcessTechnol 2015;131:159–66.
[17] Stichnote H, Meier D, de Bari I. Biorefineries: industry status and economics.In: Lamers P, Searcy E, Hess JR, Stichnothe H, editors. Developing the globalbioeconomy: technical, market, and environmental lessons frombioenergy. Academic Press; 2016. p. 41–68. ISBN 9780128052907.
[18] Oasmaa A, van de Beld B, Saari P, Elliott DC, Solantausta Y. Energy Fuels2015;29(4):2471–84. doi: http://dx.doi.org/10.1021/acs.energyfuels.5b00026.
[19] Oasmaa A, Peacocke C, Gust S, Meier D, McLellan R. Energy Fuels 2005;19(5):2155–63. doi: http://dx.doi.org/10.1021/ef040094o.
[20] Elliott DC, Oasmaa A, Meier D, Preto F, Bridgwater AV. Energy Fuels 2012;26(6):3769–76. doi: http://dx.doi.org/10.1021/ef300384.
[21] Elliott DC, Oasmaa A, Meier D, Preto F, Bridgwater AV. Energy Fuels 2012;26(12):7362–6. doi: http://dx.doi.org/10.1021/ef301607.
[22] Steele P, Puettmann ME, Penmetsa VK, Cooper JE. Forest Prod J 2012;62(4):326–34.
[23] Thegarid N, Fogassy G, Schuurman Y, Mirodatos C, Stefanidis S, Iliopoulou EF,et al. Appl Catal B: Environ 2014;145:161–6.
[24] Corma A, Huber GW, Sauvanaud L, O’Connor P. J Catal 2007;247:307–27.[25] Graça I, Lopes JM, Ramoa Ribeiro F, Cerqueira HS, Almeida MBB. Appl Catal B:
Environ 2011;101(3–4):613–21.[26] Kitaoka S. 14th World petroleum congress, vol. 3; 1994. p. 43–45.[27] Willenbrink R. The petroleum/petrochemical industry. In: AIChE symposium
series, 69, 135; 1973. p. 153–54.[28] Guenther FR, Parris RM, Chester SN, Hilpert LR. J Chromatogr 1981;207
(2):256–61.[29] Shang JY, Bisson BA, Wyncoop R. US Patent 3,976,437 Filed 13 September
1974, Issued 24 August 1976.[30] Pearson CD. J Chromatogr 1988;449:440–7.[31] DeBlase FJ, Fox BE, Migdal CA. US Patent 8,313,542 Filed 11 May 2011, Issued
20 November 2012.[32] Baumgardner ME, Vaughn TL, Lakshminarayanan A, Olsen D, Ratcliff MA,
McCormick RL, et al. Combustion of lignocellulosic biomass based oxygenatedcomponents in a compression ignition engine. Energy Fuels 2015;29(11):7317–26.
[33] Biofuels Digest at <http://www.biofuelsdigest.com/bdigest/2015/11/25/epa-grants-ensyn-title-40-cfr-approval-for-rfgasoline/>; <http://www.biofuelsdigest.com/bdigest/2015/08/27/ensyn-gets-epa-approval-for-rfdiesel/> [last visited: 03-08-2016].
[34] Biomass Magazine at <http://biomassmagazine.com/articles/12874/ensyn-receives-key-regulatory-approvals-from-carb> [last visited: 03-08-2016].
[35] Talmadge MS, Zhang Y, Kinchin C, Pinho AR, Biddy M, Chum HL, et al. Techno-economic and sustainability analysis for co-processing fast pyrolysis oil withvacuum gas oil in an FCC for second generation fuel production [unpublishedresults].
[36] Talmadge MS, Baldwin R, Biddy MJ, McCormick RL, Beckham GT, Ferguson GA,Czernik S, Magrini-Bair KA, Foust TD, Metelski PD, Hetrick C, Nimlos MR. GreenChem 2014;16:407–53.
[37] Huber GW, Iborra S, Corma A. Chem Rev 2006;106(9):4044–98.[38] Christensen E, Deutch S, Ferrell J. Simulated distillation of pyrolysis bio-oil
using thermogravimetric analysis. In: (2014) Symposium on Thermal andCatalytic Sciences for Biofuels and Biobased Products, Denver, Colorado.