farrar 2 i. mitochondrial dna genetic patterns across...
TRANSCRIPT

Evolution of Novel Color PhenotypesDuring Population Establishment: Genetic,Biochemical, and Ecological Considerations
Item Type text; Electronic Thesis
Authors Farrar, Victoria Sophia
Publisher The University of Arizona.
Rights Copyright © is held by the author. Digital access to this materialis made possible by the University Libraries, University of Arizona.Further transmission, reproduction or presentation (such aspublic display or performance) of protected items is prohibitedexcept with permission of the author.
Download date 16/05/2018 07:56:07
Link to Item http://hdl.handle.net/10150/579036


Farrar 2
TABLE OF CONTENTS
Abstract………………………………………………………………………………………pg.2
I. Mitochondrial DNA genetic patterns across the House Finch range edge and adaptive
potential………………………………………………………………………………………........4
II. Analyses of the biochemical network of carotenoid feather coloration………………………30
Acknowledgements………………………………………………………………………………48
References………………………………………………………………………………………..49

Farrar 3
ABSTRACT
When do novel adaptations arise as rearrangements of ancestral components and when do
they arise de novo? Answering this question requires direct study of the proximate mechanisms
behind novel phenotypes that arise from diverse starting points along different historical
contingencies. Here we capitalize on uniquely replicated historical sequences of population
establishment in the house finch (Haemorphous mexicanus) to study the evolution of color-
producing enzymatic pathways that underlie population divergence in color phenotypes. We first
evaluated genetic diversity and differentiation in a neutral marker (the mitochondrial NADH II
dehydrogenase gene) across 12 study populations, both in the ancestral range in Arizona and
across the Continental Divide in Montana at the range edge. We uncovered 29 haplotypes in our
samples, describing 17 new haplotypes for this species. We then examined the influence of inter-
population differences (such as habitat, age, and genetic relationships) on variation in the
network of enzymatic reactions that produce carotenoid-based coloration in this species. Placing
these comparisons in the framework of historical sequence of population establishment allows us
to elucidate likely evolutionary trajectories of novel feather color phenotypes in this species.

Farrar 4
CHAPTER I. Mitochondrial DNA genetic patterns across the House Finch range edge and
adaptive potential.
INTRODUCTION
Adaptive radiations, which occur as an ancestral lineage branches into divergent
groups/species through the occupation of different ecological niches and acquisition of
corresponding adaptations to those niches (Givnish 1997) must first begin at the population level.
Individual populations of the original lineage first diverge due to differential selection pressures
across their ecological niches (Grant & Grant 2008). This initial step of an adaptive radiation
involves a process of simultaneous divergence and introgression/back-crossing between
populations of the original lineage before speciation and reproductive isolation occur (Grant &
Grant 2008). These populations undergoing local adaptation may represent future species if
divergence continues. While some studies have uncovered the gradual change from populations
to species over times through adaptive radiations (e.g., Darwin’s’ finches; Petren et al. (2005)),
few studies explore the relationships between peripheral populations during the initial stages of
morphological and genetic divergence. The relationships among such populations experiencing
different ecological pressures and separated by geographic barriers, could represent the trajectory
of future adaptive radiations.
In order to understand the trajectory a future adaptive radiation may take or how
adaptations may arise across a gradient of different environments (and consequently, selection
pressures), one needs a system in which the historical direction of range expansion and sequence
of population establishment in novel environments are known. Furthermore, such a system
requires geographical separation of populations over different environments with varying
ecological pressures, as well as evidence that these ecological pressures do in fact drive adaptive

Farrar 5
traits within those populations. Lastly, understanding the genetic relationships between these
peripheral populations not only allows for further description of the divergence occurring among
these populations, but also an assessment of genetic diversity available for selection to act upon.
House finches (Haemorphous mexicanus), a small passerine bird native to North
America, provide a system through which to study population divergence and local adaptation.
Originally native to the Southwestern United States, the house finch was introduced from
California to the East Coast in New York City in the 1930s through the pet trade, and established
across the eastern United States from the 1950s onward (Badyaev et al. 2012). While the
introduced eastern populations underwent a large and rapid range expansion westward across the
United States, the native range populations also expanded northward in the western United States
(Badyaev et al. 2012). In the late 1960s, house finch populations colonized northwestern
Montana (the Rocky Mountain range) (Badyaev 2009; Badyaev et al. 2012). Populations on the
east side of the continental divide were recorded around 1990 (Badyaev et al. 2012). The range
expansions, from both directions, continues along both sides of the divide – northward in the
west and southward on the east (Badyaev 2009).
Since the expansion of this species range in Montana has been well-documented, and there
are two distinct historical trajectories of population establishment on either side of the
Continental Divide, these populations provide a system to study population divergence across a
geographical scale in which environment and ecology differ. For instance, house finch
populations on the west of the divide generally live in urban areas at high elevations, dense
coniferous forest, and heavy snowfall throughout the winter, while populations on the east side
of the divide live in lower elevations in more prairie-like /grassland habitat (A.V. Badyaev,
personal communication ). These habitats exert differential selection pressures based on climate,

Farrar 6
food sources, and reproductive success that may act upon house finch populations. In addition,
previous studies on these range-edge populations show significant adaptive divergence in and
rapid evolution of many morphological and physiological traits (Badyaev et al. 2000; Badyaev &
Martin 2000).
Here, we use a neutral, mitochondrial DNA marker to describe the genetic diversity within
and the genetic relationships among house finch populations in southeastern Arizona, northwest
and central Montana. Mitochondrial DNA markers are particularly useful for studies of
population relationships because they do not recombine across generations (they are only
maternally inherited) and evolve faster than most nuclear gene (Wan et al. 2004). Evaluating
these relationships at the population level will allow us to consider the level of gene flow
between populations and how divergence occurs relative to genetic exchange between
populations. We expect to find that the Continental Divide (Rocky Mountains) acts as a
significant barrier to gene flow between eastern Montana and western Montana populations and
use populations sampled from southern Arizona, deep within the native, ancestral range as a
genetic comparison point. We aim to evaluate a) population divergence across the Continental
Divide, b) examine concordance between the observed historical sequence of population
establishment and patterns inferred from the present day mitochondrial DNA markers, c)
evaluate genetic diversity among populations that may represent available genetic variation, and
d) examine how genetic differentiation and diversity change over time through deep temporal
sampling (20 years) of a western Montana population.

Farrar 7
METHODS
Samples
We examined mitochondrial DNA variation in 156 house finches from 12 populations in
Arizona (part of the ancestral, native range) and Montana, both west of the Continental Divide
(of putative native origin) and east of the Continental Divide (of putative introduced origin from
the east coast founder event) (See Table 1.1 and Figure 1.1 for sampling map and distribution).
Samples were collected from the field over a 19 year period, from 1995 to 2014. Genomic DNA
was extracted from blood samples using the Qiagen DNAEasy kit (Qiagen, Germantown, MD,
USA) and stored in molecular-grade water or a low-concentration Tris-EDTA solution.
MtDNA Amplification and Sequencing
We sequenced the entire mitochondrial NADH subunit II gene (ND2) for a total of 1041
base pairs. PCR reactions were run at 35 μL volumes, each containing 1-10 ng of genomic
DNA, 0.875 U of Terra™ PCR Direct Polymerase (TaKaRa Clontech, Mountain View, CA,
USA), 17.50 μL of 2X Terra™ PCR Direct Buffer, and 0.40 μM each of forward and reverse
primers, METB and TRPC (Eberhard et al. 2004). PCR conditions were an initial denature of
98° C for 5 minutes, followed by 40 cycles of 98°C for 30 seconds, 58°C for 30 seconds, 72°C
for 45 seconds, followed by a final 72°C extension for 5 minutes. PCR products were purified
using the ZR DNA Sequencing Clean-up Kit (Zymo Research, Irvine, CA, USA) and sequenced
by the University of Arizona Genetics Core using ABI Big-Dye chemistry. The two
amplification primers, plus two internal primers, HOFIintR2 and HOFIind2-intF562 (Hawley et
al. 2008) were used to sequence the ND2 region. These four primers all overlapped in sequence
reads, increasing coverage to minimize errors. We used this coverage to look for signals of

Farrar 8
Numts, pseuogenzied nuclear copies of mitochondrial genes, within our data, and found none,
indicating true mitochondrial copies were amplified (Sorenson & Quinn 1998).CLC Main
Workbench 7.5.1 (CLC Bio, Germantown, MD, USA) was used to align and trim the sequences.
Data Analysis
We used DNAsp v 5.10.01 (Librado & Rozas 2009) to calculate descriptive statistics and
diversity measures for each of our populations. To estimate diversity across populations, we
calculated haplotype diversity (h) and nucleotide diversity (π) for each population (Nei 1987).
We also calculated Tajima’s D (Tajima 1989) for each population to test for neutrality and drift-
mutation equilibrium of the marker in each population using segregating sites. To test for
evidence of population expansion, we calculated R2-values (Ramos-Onsins & Rozas 2002). To
determine the statistical significance of Tajima’s D and the R2 values, we ran a coalescent
simulation given theta with no recombination over 1000 replicates.
We used MrModelTest v2 (Nylander 2004) to determine whether HKY was the best
model of sequence evolution and used this model of evolution in phylogenetic analyses and the
close relative, Kimura 2P, for AMOVA analyses.
We used Arlequin 3.5.1.2 (Excoffier & Lischer 2010)’s Analysis of Molecular Variance
(AMOVA) to determine if geographical groupings could explain variation seen in our samples.
The AMOVA was run under the Kimura 2 P distance method (most similar to the HKY model,
which best fit our data) with no gamma distribution over 1000 iterations. Groups defined a priori
were “Arizona”, “East Montana” and “West Montana”.
We used Network 4.612 (Fluxus-Engineering 1999-2014) to build unrooted median-
joining haplotype networks (Bandelt et al. 1999) for all mitochondrial DNA ND2 haplotypes

Farrar 9
represented in our data. Median-joining networks infer ancestral haplotype states not sampled
from the existent data, and for this reason are recommended over minimum-spanning networks
(Wooley et al. 2008). We mapped the haplotype frequencies per locality over each of the nodes
in the haplotype network.
We aligned the set of 30 haplotypes in our dataset using MUSCLE in MEGA 6 (Tamura
et al. 2013). All phylogenetic trees were rooted using the purple finch (Haemorhous purpureus),
a sister taxa to the house finch as determined by phylogeny based on multiple nuclear and
mitochondrial genes (Tietze et al. 2013). A full mtDNA NADH II dehydrogenase sequence from
this species was accessed from GenBank (accession number: KF194160, Tietze et al.2013). We
used MEGA 6 (Tamura et al. 2013) to build maximum likelihood phylogenies using the HKY
model of mutation, and tested the phylogeny using the bootstrap method with 1000 replications.
We assumed uniform rates among sites and used the nearest-neighbor-interchange (NNI)
heuristic method with a very strong branch swap filter.
We also reconstructed trees using Bayesian inference and the program BEAST 1.8.1
(Drummond et al. 2012). In these runs, the outgroup (Purple finch, H. purpureus) was set as a
monophyletic taxon set a priori, as were all of the house finch haplotypes from our dataset. The
substitution model HKY was used, and the site heterogeneity model was set to gamma, with four
categories. We used an uncorrelated lognormal relaxed clock model and a tree prior that assumed
a constant coalescent to generate our trees, starting with a random tree. The Monte-Carlo
Markov Chain (MCMC) was run for 10,000,000 iterations, with trees being saved every 1000
iterations (a total of 10,000 tree sampled). We used Tracer v1.6 (Rambaut et al. 2014) to
evaluate the quality of the MCMC simulations and TreeAnnotator v1.8.1(Drummond et al. 2012)

Farrar 10
to produce the maximum clade credibility tree with mean heights at the nodes. We used FigTree
1.4.2 (Rambaut 2006-2009) to visualize tree topologies and create gene tree figures.
Temporal analyses
To explore genetic diversity and differentiation among populations over time, we
compared different time periods in Missoula, a population with twenty years of sampling
coverage. We selected samples (n =70) from four five-year periods, 1999-1995, 2000-2004,
2005-2009, 2010-2014.We treated each five-year period as a “population” (for samples size for
each group, see Table 1.4). We calculated haplotype diversity, nucleotide diversity, Tajima’s D
and Ramos-Onsins R2 for each five-year period using DNAsp 5.10.01(Librado & Rozas 2009)
as above. We used Arlequin 3.5 (Excoffier & Lischer 2010) to calculate pairwise genetic
differentiation using FST for sequence data, using the Kimura 2 P model, between each five-year
period and the three main geographical groupings (Arizona, east MT, west MT). Each grouping
consisted of pooled data for each population included in that grouping (for groupings, see Table
1.1), with the exception of west MT, which excluded Missoula and only included Ovando and St.
Regis. We also calculated the number of shared haplotypes between each five-year period in
Missoula and each pooled geographical grouping.
RESULTS
Genetic diversity
Within our populations, we sampled 29 unique haplotypes of the ND2 gene region,
encompassing 33 polymorphic sites (29 transitions and four transversions). Of these haplotypes,
12 were described in (Hawley et al. 2008), while the other 17 had not been previously described
for this species.
Farrar 11
Mitochondrial DNA diversity varied between populations. Western Montana populations
had the highest haplotype diversity, and the eastern Montana populations had the lowest
haplotype diversity (Table 1.1). However, Choteau, a population east of the Continental Divide,
had higher haplotype diversity than the average for eastern populations. Western Montana
populations also had the highest nucleotide diversity, whereas eastern Montana and Arizona
populations were similar (Table 1.1). Genetic diversity did not correlate with sample size
(haplotype diversity: r = -0.41553, p = 0.204; nucleotide diversity: r = -0.402, p = 0.221).
All but one Arizona population (the Mason Center) included at least one unique
haplotype (i.e. a haplotype only uncovered in that population and not shared with any other
populations). Among Montana populations, only Missoula and Choteau had unique haplotypes
(Table 1.2).
Population expansion
Tajima’s D was not significant in any population, except Havre. The negative value of
Tajima’s D for this eastern Montana population (Table 1.1) suggests that this population is either
undergoing expansion or experiencing purifying selection at this gene locus (Tajima 1989). R2
values were not significant for all populations except the University of Arizona campus
population in Arizona, part of the native ancestral range (Table 1.1). Interestingly, neutrality
tests and tests of demographic population expansion were not in concordance. For example,
Havre had a significant negative Tajima’s D, but had a non-significant high R2 value (Table 1.1).
The median-joining haplotype network had a “star-shaped” topology (Figure 1.3),
suggesting recent population expansion (Avise 2000). An ancestral haplotype (4) has the highest

Farrar 12
frequency, while most other haplotypes radiated out from this central point without large genetic
distance between them. The gene tree (Figure 1.4) for this mitochondrial locus was also shallow,
suggesting the recent radiations typical of recent population expansions (Avise 2000).
Population structure and differentiation
Three populations were significantly differentiated from Livingston (an eastern Montana
population), two of which were also eastern Montana populations and one, Ovando, was the
western population closest to the Continental Divide (Table 1.3). Missoula and the University of
Arizona campus were significantly differentiated, but not as strongly as populations across the
continental divide in Montana. When populations within each geographic group (Arizona, east
Montana, west Montana) were pooled, only western Montana and Arizona differed (FST= 0.0440,
p = 0.01270).
We also considered the number of haplotypes shared among the populations as an
indicator of gene flow or shared populations-of-origin (Table 1.2). Two haplotypes of the 29
were shared among all three geographic groups. East and west Montana shared five haplotypes,
west Montana and Arizona shared six haplotypes, and east Montana and Arizona shared three
haplotypes.
St. Regis and Ovando populations had a subset of the Missoula population haplotypes. St.
Regis population shared a haplotype with Arizona populations, but not other Montana
populations, suggesting that a widespread haplotype in the native range had reached St. Regis
through the west (St. Regis is the western-most Montana population). Ovando population also
shared haplotype 13 with Choteau and Chester, two populations on the east side of the
Continental Divide. On the east side of the divide, Havre included a subset of haplotypes found

Farrar 13
in Livingston, providing support for the idea that migrants from Livingston founded Havre.
Chester also included haplotypes that were found in Havre and Livingston, giving weight to the
idea that it was founded sequentially from Havre. However, Chester also included haplotypes
only found on the west side of the divide, suggesting that gene flow may be occurring from west
to east.
In Arizona, Saguaro National Park East population shared more haplotypes (5) with the
University of Arizona campus population than with geographically closer Saguaro National Park
West population (3). Mason Center, a population to the northwest of the Tucson valley, shared
haplotypes with the University of Arizona campus but not with either of the sections of Saguaro
National Park. This suggests that the Tucson metropolitan area may be conducive to gene flow,
but the Tucson Mountains separating Saguaro National Park West may reduce dispersal.
Both the haplotype network and the gene tree did not show geographical clustering
(Figures 1.3 and 1.4, respectively). Common and central nodes on the network were found on
both sides of the continental divide, and both clades in the gene tree had representatives on either
side of the continental divide, suggesting that the divergence of clades predated the dispersal
restriction due to the continental divide.
Temporal scale changes
In the Missoula population, haplotype diversity decreased overall from 1995 to 2014, and
generally decreased between each five-year period, except for an increase between 2000-2004
and 2005-2009 (Table 1.4). However, nucleotide diversity increased between each five-year
period, except for a decrease between 2000-2004 and 2005-2009. Neither haplotype diversity
nor nucleotide diversity correlated significantly with sample size in the Missoula five-year
groups (haplotype diversity: r = 4.202, p = 0.580; nucleotide diversity: r = 0.691, p = 0.309).

Farrar 14
The number of haplotypes increased through the first three periods, but decreased in the last
period (2010-2014). In the first period, all haplotypes belonged to haplogroup 2 (see gene tree,
Figure 1.4, 1.5), though haplotype 1 became present in the second period. The frequency of
haplogroup 1 was also reduced in the most recent time period (2010-2014), although this, along
with a reduced number of haplotypes covered, may be an artefact of reduced sampling for this
period.
Tests of neutrality and population expansion were not significant after coalescent
simulations (p>0.05) (Table 1.4), so we could not reject the null hypotheses of neutrality and
constant population size over time in the Missoula population.
Genetic differentiation between each five-year period within Missoula and the other
geographic groups (i.e. Arizona, east Montana, west Montana) fluctuated over time (Table 1.1).
The 1995-1999 group had the highest FST values of the five-year periods to the other
geographical groups, all which were significant (p <0.05). From 2000 on, Missoula was not
significantly differentiated from the eastern Montana populations, nor was it significantly
differentiated from the other two western Montana populations. The periods 2005-2009 and
2010-2014 differentiated significantly from Arizona populations, however, these FST values were
low (Table 1.5). The number of shared haplotypes between the geographic groups was similar
across time (Table 1.4). The only time period for which the geographical groups differed in the
number of shared haplotypes with Missoula was 2000-2004, when eastern Montana shared fewer
haplotypes (4 shared) than both Arizona and western Montana did (5 shared). Number of shared
haplotypes between Missoula and all populations increased from 1995-1999 to 2000-2004,
stayed about constant through 2005-2009, and then decreased from 2010-2014.

Farrar 15
DISCUSSION Genetic structure
The lack of geographical clustering on the gene tree and haplotype network, together with
low genetic differentiation and substantial numbers of shared haplotypes between populations on
either side of the divide indicate little genetic partitioning by the Continental Divide. This pattern
may arise due to high dispersal rates among populations and over the divide. This gene flow
could swamp out the effects of any initial population structuring that was present. Alternatively.
populations may have recently expanded from a common source and large effective population
sizes (Ne) have buffered the diverging effects of drift or selection.
Dispersal rates may provide a likely explanation for gene flow between these house finch
populations. Juveniles have been observed undergoing long-distance dispersal with distances up
to 500- 700 km ( ), however most dispersal observed among Montana populations is post-
breeding adult dispersal from nearby populations (< 20 km away) (Oh & Badyaev 2008;
Badyaev et al. 2012). With this in mind, populations may experience a gradient of similarity
following the pattern of gene flow, a pattern observed in the distribution of shared haplotypes.
This “isolation by distance” pattern of gene flow is further supported by the significant FST
values, which found that populations furthest from each other across the sampling range in
Montana were most differentiated from one each other (Table 1.3). Gene flow across the
Continental Divide may also be further explained by the tendencies of northern and recently
established house finch populations to move down elevation gradients and towards urban areas
during the winter, with distances of up to 200 km (Badyaev et al. 2012). Since sampled
populations consist of urban centers, birds sampled there may have settled there from higher-
elevation, less-urbanized areas within the mountain range. This, in particular, might explain the

Farrar 16
shared haplotypes between populations close to the Divide, such as from Choteau and Augusta
(east Montana) to Ovando (west Montana).
A shared and recent population history coupled with large effective population sizes may
lead to the low divergence between the two sides of the Divide. Large effective population sizes
are not likely in these populations founded by a few individuals, and mycoplasmosis sweeps
early in the range expansion could have reduced the female (and thus mitochondrial DNA)
effective population size significantly, with male: female ratios as high as 2.5 : 1 (Badyaev et al.
2012). Recent population expansion from a shared point of origin is more plausible. The star-
shaped haplotype network, a shallow, relatively unresolved phylogenetic tree corroborates recent
population expansions. Although the relatively-high values of Ramos-Onsins R2 were not
significant, the expansion may have been too recent to detect it (Ramos-Onsins & Rozas 2002).
Combined with the low divergence across populations, this suggests that the recent expansion
may have radiated from one genetic source, and not enough time has yet passed to detect the
effects of drift on daughter populations across the Divide, regardless of gene flow levels.
Furthermore, our results suggest a native range origin for the sampled populations. For
example, Livingston, an eastern population “basal” in the historical sequence (Figure 1.2) and
believed to be the source of eastern populations in our sample, shares all its haplotypes with the
oldest western population, Missoula, and contains no unique haplotypes (Table 1.2). Our
sampled eastern Montana populations have higher haplotype diversity than that of the introduced
populations in the eastern United States (Hawley et al. 2008). Eastern Montana populations in
our sample have lower genetic diversity than western Montana and Arizonan populations.
Importantly, we did not uncover two of the only four haplotypes (8, 9, 10) found in introduced
populations (D. Hawley, personal communication) sampled by Hawley et al (2008) in any of our

Farrar 17
eastern populations. Since these three haplotypes are observed in all other eastern populations
across the United States, we expect to sample them in our dataset if it was of eastern origin.
However, dispersal or founder effects by only individuals of haplotype 4, the most widespread,
ancestral haplotype, remains a possibility. Additionally, observed breeding records support the
idea of a native-range origin, since house finch populations in Lewistown, Idaho and northern
Wyoming were present since the 1920s and 1930s, close to the Montana range we sampled
(Badyaev et al. 2012).
Concordance between genetic patterns and historical sequence of population establishment
We did not find support for the idea that eastern populations originated through the
introduced range expansion, while western populations originated from native range expansions.
We found evidence (Table 1.2) that Missoula was a source for other western populations such as
St. Regis and Ovando. St. Regis population only contained one additional haplotype (i), which
may have been acquired from gene flow with the native range, as it is also present in Arizona.
Ovando population, however, shares a haplotype (13) with Choteau and Chester, suggesting that
there may be gene flow across the divide into these populations closest to the divide. Since
haplotype 13 was also found in California and Idaho (as part of the native range expansion; D.
Hawley, personal communication), gene flow across the divide may be from west to east. We
find support for Havre as a daughter population of Livingston (shares 2/3 of its haplotypes with
Livingston), but in turn, less support for Chester as a daughter population of Havre. In fact,
Chester shared a common western Montana haplotype (A) at a high frequency, indicating
possible eastward dispersal across the divide.

Farrar 18
We found no support for hypothesis that Choteau population was a descendant population
of Livingston, as these populations shared no haplotypes (the pairwise FST value was also
significantly differentiated). Instead, Choteau population contained more unique haplotypes than
other populations, and is the only Montana population that did not share the central ancestral
haplotype (4) on the network. The high diversity uncovered in this newly-established population
was unexpected, and could be caused by over-dominant selection on the NADH II
dehydrogenase mitochondrial locus in this population. However, Tajima’s D was not significant
for this population, causing us to fail to reject the hypothesis of neutral evolution in this locus.
Alternate explanations include gene flow from more northern, unsampled populations in the
range, or a high buffering of mutations against drift due to a large effective population size
(which explained the high number of unique haplotypes in large populations like Missoula and
the University of Arizona campus). We cannot currently distinguish the effects of incomplete
lineage sorting from the effects of gene flow on the high divergence seen in the Choteau
population.
Temporal analysis
Our in-depth analysis of genetic changes in Missoula across time revealed that the
changes in haplogroup composition, diversity, and divergence that may arise from the gene flow
patterns outlined above. Over the twenty year period, we find haplotype diversity decreased over
time, most likely due to the extinction of low-frequency mutants by genetic drift (Figure 1.5).
The fluctuation in haplotype diversity over time may also be driven by levels of incoming
female migrants from nearby populations, which are genetically dissimilar to the resident gene-
pool, increasing haplotype diversity (Oh & Badyaev 2008). The reduced coverage of low-

Farrar 19
frequency mutants in the last five-year period may have been due to increased genetic drift or
biased dispersal. Interestingly, after 1999, the genetic differentiation with eastern populations
became not-significant while haplogroup 1 representation greatly increased in this time period.
Haplogroup 1 representation in populations generally decreases from west to east on the east side
of the divide, suggesting that haplogroup 1 may be more present in the west, and this may serve
as a source of gene flow across the divide, although we cannot be certain of the direction. We
cannot, however, rule out the effects of sample size on these periods, as the small sample size
may not have been able to cover those low-frequency mutants that did persist.
While mitochondrial DNA can delineate relationships between populations at the
intraspecific level, it is limited in that it only shows the history and exchange of matrilines
between populations, and does not uncover patterns in male dispersal ( if any occurs). The use
of multiple markers, such as microsatellites, could allow us to garner more significant genetic
differentiation measurements and capture more subtle patterns of population structuring.
Multiple markers also allow us to detect selection on mitochondrial DNA genes in populations
like Choteau or Havre, allowing us to distinguish the effects of bottlenecks and expansion from
those of selection. In addition, microsatellite markers differ more between individuals, allowing
us to uncover further patterning within this small range around the Continental Divide that
mitochondrial DNA alone could not detect.
Conclusions Our data suggest that these range edge Montana populations may have shared origins in
the native range expansion of the house finch species, and that as the populations are established
along the Continental Divide, gene flow may have recently occurred across it. This gene flow
may exacerbate or buffer the effects of local adaptation (Garant et al. 2007) across this range,

Farrar 20
though previous studies have shown that morphological divergence does occur in the presence of
gene flow in neutral markers (Petren et al. 2005) and may even facilitate further divergence, as
novel alleles may be adaptive and can be further acted upon by selection (Garant et al. 2007). As
dispersal occurs at different times from fluctuating central, source populations, such as Missoula
(Badyaev 2010) it may catapult different populations into different “starting points” in terms of
selection depending on the state of the trait in dispersing individuals. Further explorations of
these well-studied adaptive traits (bill shape, sexual dimorphism) can uncover whether
morphological divergence is indeed occurring despite gene flow and genetic similarity, allowing
us to uncover whether or not adaptive divergence is occurring in this species across the range of
differential environments across the Continental Divide.

Farrar 21
Diversity Group State Population Years
Covered N Haplotype
No. Haps/N
Haplotype diversity (h)
StDev (h)
Nucleotide diversity (π)
StDev (pi)
Tajima's D R2 ‐value
ARIZONA AZ Saguaro National Park East (SNPE)
2006‐2007 9 7 0.778 0.944 0.070 0.00310 0.00062 ‐0.57839 0.1415
ARIZONA AZ Saguaro National Park West (SNPW)
2004 ‐2005 8 5 0.625 0.786 0.151 0.00175 0.00041 ‐0.25149 0.1444
ARIZONA AZ University of Arizona Campus (UAC)
2003‐2009 20 12 0.600 0.932 0.035 0.00231 0.00029 ‐1.25157 0.0799*
ARIZONA AZ Mason Center (MC)
2010, 2012, 2014
4 4 1.000 1.000 0.031
0.00512 0.00111
‐0.22234 0.1202
Average 0.649 0.89 0.0024
EAST MT Choteau (CHOT) 2014 5 4 0.800 0.900 0.161 0.00423 0.0008 1.0275 0.2332
EAST MT Chester (CHS) 2006 11 3 0.273 0.618 0.104 0.00217 0.0004 1.2288 0.2151
EAST MT Havre (HAV) 2006 8 4 0.500 0.643 0.184 0.00168 0.00067 ‐1.6741* 0.1812
EAST MT Livingston (LVS) 2006 7 3 0.429 0.667 0.16 0.00165 0.00049 0.23902 0.1988
EAST MT Augusta (AUG) 2014 1 1 1.000
Average 0.469 0.71 0.0024
WEST MT Ovando (OVD) 2008 6 5 0.833 0.933 0.122 0.00333 0.00073 ‐0.06223 0.192
WEST MT St Regis (STR) 2006, 2008 7 6 0.857 0.952 0.096 0.00274 0.00053 0 0.1594
WEST MT Missoula (MSO) 1995, 2003‐2008, 2010, 2012, 2014
70 17 0.243 0.822 0.025 0.00314 0.00018 ‐0.21732 0.0937
Average 0.644 0.902 0.00307
Table 1.1. Genetic diversity and demographic history measures for the 12 study populations. N refers to the number of samples sequenced for this gene region, haplotype number refers to the number of haplotypes uncovered in that population. Haplotype diversity, nucleotide diversity, Tajima’s D and the Ramos-Onsins R2 value were calculated using DnaSP v5 (Librado & Rozas 2009). * indicates a significant value of Tajima’s D or R2 where p <0.05 after a coalescent simulation of 1000 replicates.

Farrar 22
A)
B)
Figure 1.1. Map of population locations across the Continental Divide in Montana and in Arizona. Pie charts show haplotype distributions for each population. Each slice of the pie chart represents a haplotype. Haplogroup 1, 2, and private haplotypes are coded purple, orange, and gray respectively. Only haplotypes shared between 2 or more populations were coded for their haplogroup (see Figure 1.4). Montana populations (A) are coded red or blue for western or eastern populations, respectively. Arizona populations are green and in a subset of southeastern Arizona (see inset). Pie chart size for each population corresponds to relative sample size (see Table 1.1 for accurate sample sizes).

Farrar 23
Figure 1.2. Historical sequence of population establishment across the Continental Divide in Montana. This tree shows the timeline of putative population establishment dates (Badyaev et al. (2012), A.V. Badyaev, personal communication). Circles represent a population and bold arrows represent that population existence through time. Dotted lines correspond to putative populations of origin from which an established population was founded. Red and blue lines correspond to west and east populations respectively. The gray circle represents the most recent common ancestor of all populations.

Farrar 24
Mitochondrial DNA Haplotype I.D.
Population
1 2 4 6 9 13 14 17 26 A C i J M Private haplotypesEAST MT 16 2 1 1 4 3 4AUG 1
CHOT 1 4
CHS 6 1 4
HAV 5 1 1
LVST 4 1 2
WEST MT 9 24 2 2 6 1 15 17 1 1 3OVD 1 1 2 1 1
MSO 7 21 2 5 1 12 16 1 4
STR 1 2 1 2 1
ARIZONA 3 5 9 4 1 3 2 1 1 2 1 9MC 1 1 1 1
SNPE 1 2 1 2 1 1 1
SNPW 1 1 4 2
UAC 1 2 4 3 1 1 1 1 6
Table 1.2. Shared haplotypes between populations and geographic groups. The 15 mtDNA haplotypes that were shared between two or more populations are included in the main table with their frequency within each population. Private haplotypes, those haplotypes that only occur within one population and are not shared with others (Private haplotype I.D.s: 7, 18, 22, B, D, E, F, G, H, L, N, O, P, Q, R), are listed on the right. Colored rows in bold represent the overall geographic groupings, which encompass the total occurrence of each haplotype within the included populations (below each group). See Table 1.1 for population abbreviations and groupings.

Farrar 25
AUG CHOT CHS HAV LVST OVD STR MISS MC SNPE SNPW UAC AUG
CHOT 0
CHS 0 0.086
HAV 0 0.170 0.091
LVST 0 0.241* 0.196* 0
OVD 0 0 0 0.068 0.153*
STR 0 0.036 0 0.146* 0.261 0
MISS 0 0.117 0.017 0.017 0.063 0 0.005
MC 0 0 0.034 0.027 0.087 0 0 0
SNPE 0 0.030 0 0.048 0.151 0 0 0.036 0
SNPW 0 0.088 0 0 0.112 0.007 0.009 0.013 0.000 0
UAC 0 0.149 0.062 0 0.058 0.058 0.087 0.072* 0.039 0.007 0
Table 1.3. Genetic differentiation (FST values) between populations. All values were calculated in Arlequin 3.5 using the Kimura 2P model of evolution. All negative FST values were rendered as “0” in this table. Significantly different values (p < 0.05) are noted with an * and in bold. East Montana populations are shaded in blue, West Montana populations in red, and Arizona populations in green. See Table 1.1 for population abbreviations.

Farrar 26
Figure 1.3. Median-joining haplotype network. Node size corresponds to the frequency of the haplotype occurred in the sampled populations. Network includes 31 haplotypes described by (Hawley et al. 2008) and the 17 newly described haplotypes from this study (see Results). Color corresponds to the geographical grouping a haplotype is included in (blue, red, and green correspond with eastern Montana, western Montana, and Arizona respectively). Gray nodes are haplotypes from (Hawley et al. 2008) that were not sampled in our study (frequency in our populations = 0). All connections between nodes are one point mutation in length, unless marked with tick marks, in which each tick mark corresponds to a point mutation. Network was built in Network 4.612 (Fluxus-Engineering 1999-2014).

Farrar 27
Figure 1.4. A Bayesian-inference phylogenetic tree based on NADH II dehydrogenase mitochondrial DNA region for our populations. Tips refer to haplotype names. Node labels refer to maximum-likelihood bootstrap values / Bayesian-inference posterior probabilities. Only bootstrap values over 50% and posterior probabilities over 0.5 were included. Population assignment is denoted with the colored dots next to each tip: blue corresponds to east Montana, green to Arizona, and red to west Montana. Since there was support for two main clades, or haplogroups, these are labeled in purple and orange brackets.

Farrar 28
Genetic Diversity Demographic History
Five‐year Period
Sample Size Haplotype number
Haps/N Haplotype diversity (h)
Standard deviation of h
Nucleotide diversity (pi)
Standard deviation of pi
Tajima's D Ramos‐Onsins R2
1995‐1999 4 3 0.750 0.833 0.222 0.00240 0.00068 1.36522 0.2724
2000‐2004 28 7 0.250 0.820 0.040 0.00326 0.00030 0.65295 0.1519
2005‐2009 30 9 0.300 0.841 0.034 0.00304 0.00028 ‐0.1213 0.1141
2010‐2014 8 4 0.500 0.786 0.113 0.00309 0.00067 0.20201 0.1769
Table 1.4. Descriptive statistics for Missoula (a western Montana population) over a twenty-year period. Samples were collected from Missoula for a twenty year period, and grouped into four five-year periods. Each of these periods was treated as a “population” for which genetic diversity and demographic history statistics were calculated (see Methods). Haplotype diversity, nucleotide diversity, Tajima’s D and Ramos-Onsins R2 were all calculated in DNAsp 5.10.01 (Librado & Rozas 2009). Coalescent simulations for Tajima’s D and Ramos-Onsins R2 found none of these values significant for the four five-year periods.
Figure 1.5. Haplotype coverage and diversity across Missoula over a twenty-year period. Samples were sorted into four five-year periods (above pie charts). Each pie chart shows the frequency of haplotypes present in the samples included in that five-year period. Pie chart size does not correlate with sample size (for sample size, see Table 1.4). Color corresponds with haplogroups defined on the gene tree (see Figure 1.4). Warm colors (oranges, yellow) and cool colors (blues, purples) correspond with haplogroup 1 and 2, respectively.

Farrar 29
FST Shared Haplotypes
Five‐year period Arizona East MT West MT Arizona East MT West MT 1995‐1999 0.217* 0.172* 0.248* 2 2 2
2000‐2004 0.039 0.029 0 5 4 5
2005‐2009 0.053* 0.036 0 5 5 5
2010‐2014 0.090* 0.060 0.095 3 3 3
Table 1.5 Genetic differentiation (FST values) between the Missoula population and the main geographical groupings over time. Each five-year period represents a group of samples collected within that five-year period, and the FST values and number of shared haplotypes between that group of Missoula samples and the geographical groups are reported above. FST values were calculated in Arlequin 3.5 (Excoffier & Lischer 2010) and significant values (p < 0.05) are marked with an * and in bold. Negative FST values were reported as “0” in this table. Shared haplotypes are the number of haplotypes shared between those two groups. See Table 1.1 for which populations are assigned to each geographic grouping and see Table 1.4 for sample sizes between each of the five-year periods.
Figure 1.6. Genetic differentiation between Missoula and the main geographical groups over time. Filled in circles represent significantly different FST values (p <0.05).

Farrar 30
CHAPTER II. Analyses of the biochemical network of carotenoid feather coloration
INTRODUCTION
Evolution of local adaptation depends on both the amount of genetic variation available
in a population and natural selection (Fisher 1930). Evolution of complex traits can be limited by
genetic diversity in the population undergoing selection (Agashe et al. 2011). In particular,
evolution of adaptation may be limited by the ancestral state of founding individuals of that
population, and what components already exist from the ecological history of selection on that
trait. In this scenario, existing trait components are rearranged to produce novel phenotypes.
Alternatively, novel environments may provide unique resources and strong selection that drives
exploration of novel components of the trait, leading to novel phenotypes in a different way.
Explorations of how novel adaptations arise, either by re-arrangements of ancestral states
or de novo across environments, require understanding of the proximate mechanisms that
underlie evolution of complex phenotypes. Carotenoid coloration of avian feathers provides
such a complex adaptation for which the underlying components are known. Since birds must
acquire carotenoid components exclusively from the diet, novel dietary carotenoid inputs across
habitats can change the expression of this trait (Hudon & Brush 1989; McGraw 2006) providing
a direct connection between organism-environment interactions and phenotype. Most
importantly, the well-described network of enzymatic reactions that convert dietary sources into
those expressed in feathers provides a proximate mechanism and collection of trait components
that underlie phenotypic changes (Badyaev et al.,in review).
House finches in particular provide a unique opportunity to explore the origins of novel
adaptions through carotenoid coloration. This species possesses a particularly adept capability
for carotenoid coloration; their network contains 24 described carotenoid compounds, with seven

Farrar 31
dietary entry points and 12 expressed compounds (Badyaev et al.,in review). In addition, the
color phenotypes observed in house finches varies, with males ranging in color from yellow to
orange to bright red (Inouye et al. 2001; Hill et al. 2002; McGraw 2006) . The presence of these
color morphs vary across the species’ range (A. V. Badyaev, pers. comm.) and differ due to
different carotenoid composition in the feathers. Since this species has recently undergone
extensive range expansion out of its native range (the southwestern United States), house finches
of different points-of-origin across the range are encountering diverse range of novel
environments (see Chapter 1 for more information on species history), providing a system
through which to study novel phenotypes over different historical trajectories of population
establishment.
In this study, we capitalize on the different historical trajectories and diverse habitats of
recently-established house finch populations around the Continental Divide in Montana to
explore how novel phenotypes might arise across the expansion front. Here, we first describe
variation between populations in different aspects of the carotenoid network, including dietary
and expressed compounds. We then compare variability in the network across populations with
other inter-population metrics, such as habitat differences, population age, and genetic
relationships between populations (see Chapter 1 for mitochondrial DNA genetic data). Lastly,
we look for evidence of local competence, or increasing metabolic ability and network usage as
individuals become acclimated to their particular habitat, in these populations as they age.
METHODS
Feather collection
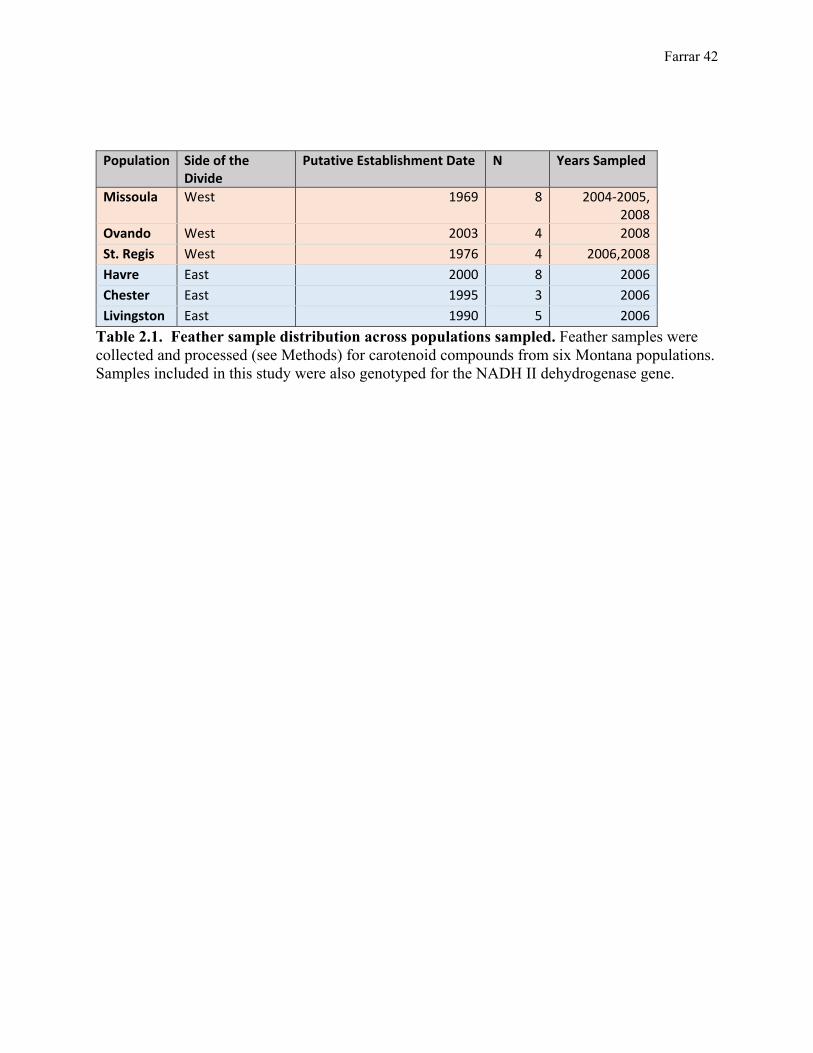
Feather samples were collected from 30 male house finches from six study populations
around the continental divide in Montana, U.S.A. between 2004 -2008 (see Table 2.1 for a list of

Farrar 32
study populations and samples). Fifteen ornamental feathers were collected from each male:
five from the crown, breast, and rump. Each of these males also had blood taken for genetic
work and their age and morphological metrics recorded.
Carotenoid extraction and high-performance liquid chromatography
First, we weighed feathers before and after removing the red ornamental portions of each
feather. The red carotenoid-containing portions of the feathers continued on to extraction and
carotenoid analysis. To clean feathers, we washed the feathers with about 2- 4 milliliters of
hexane per sample. We then ground the clean feathers into a 3 mL methanol solution for 10
minutes at 20 Hertz. We filtered the feather-methanol solution and then evaporated off the
solution (methanol) by running solution samples in a LabConco Centrivap Concentrator for
about 70 minutes at 40°C. The remaining carotenoid solution was reconstituted with 150
microliters of a 50/50 solution of methanol: acetonitrile. Feather solutions were stored at -20°C
before being run through high-performance liquid chromatography (HPLC). This procedure was
repeated separately for each group of ornament feathers (crown, breast, and rump) per male.
Extracted carotenoids were quantified using an HPLC System (Shimadzu Corporation,
Pleasanton, CA) fitted with an YMC Carotenoid 5.0mm column (250, 4.6mm) and guard column
(Waters Corporation, Milford, MA). Carotenoid solutions were eluted at a constant flow rate of
1.2 mL/min using isocratic elution with 42:42:16 methanol:acetonitrile:dichloromethane,
followed by a linear gradient up to 42:23:35 methanol: acetonitrile:dichloromethane through 21
42:42:16 (v/v/v) methanol:acetonitrile:dichloromethane for the first 11min, followed by linear
gradient up to 42:23:35 (v/v/v) methanol:acetonitrile:dichloromethane through 21min, isocratic

Farrar 33
elution at this condition until 30min, when returned with step function to the initial isocratic
condition at which it was held through 48min. Carotenoids were detected using a Shimadzu
SPD-M10AVP photodiode array detector, and data were collected from 200 to 800nm. Peaks
and concentrations per unit of feather mass (ug/g) were calculated using calibration curves of
standards (Sigma, St. Louis, MO; Indofine Chemical, Hillsborough NJ;CaroteNature, Lupsingen,
Switzerland); peak areas were integrated at 450 or 470nm depending on the absorbance
maximum (lmax) for each compound (Landeen & Badyaev 2012).
We analyzed the HPLC chromatogram peaks by hand for each ornamental feather per
male. Retention times of peaks were recorded and used to identify a set of 24 known carotenoid
compounds found in house finches and any other detected, but unknown, compound peaks. Area
of the peak was recorded and used to calculate concentration based on the overall grams/
microliter of carotenoid solution extracted in the HPLC run. Samples with low-quality baselines
on the chromatogram did not have areas or concentrations recorded.
Network construction and analysis
A carotenoid network for each bird was built for each bird first by coding presence or
absence of each of the 24 known compounds for house finches for each feather ornament (crown,
breast, and rump). The overall network for each bird was then built based on those ornaments; if
a compound was present in any one of the three ornamental feathers, it was coded as present in
the bird, if it was not present in any ornament, it was coded as absent. Since HPLC analysis may
not uncover all of the intermediate compounds used in carotenoid expression, and since not all of
the pathways are known, we built both minimum (based solely on compounds detected in the
HPLC run, or intermediates that must have been present based on the presence of their reaction

Farrar 34
products) and maximum (including all hypothesized compounds that could have been involved
in pathways leading to those compounds detected) hypothesized networks for each bird. In
maximum networks, hypothesized compounds were coded as distinct from those actually
detected in HPLC analysis.
Since the goal of this study was to compare populations, we built average population
networks in a similar manner. If a compound was present in more than 50% of the population
sample, it was coded as present, if it was present in less than 50% of the population, it was coded
as absent. This average population network was used to calculate metabolic distance between
populations. We also considered, separately, the proportion of samples that expressed a
compound per population. This was calculated as the number of individuals with that compound
present over the total number of samples included in the population.
Network analyses
We calculated pairwise metabolic distance (the number of compounds that differ between
two networks over the total number of compounds present) between each pair of Montana
populations. We also collected data for pairwise genetic differentiation (FST values based on
mitochondrial DNA data), pairwise genetic similarity (number of shared haplotypes between
populations), pairwise age difference (number of years between the dates of population
establishment), and pairwise differences in area of suitable house finch habitat (in hectares
within a 20 mile buffer around the population) (Krebs & Badyaev 2007) between populations.
Habitat considered suitable for house finches was defined as areas with semi-open shrub habitat,
such as hedges and bushes within towns or clear-cut areas. House finches require open areas but
also some understory areas in which to nest, so high elevations with dense montane forests or

Farrar 35
humid, wetland habitats were coded as non-suitable (A.V. Badyaev, personal communication ;
Badyaev et al. 2012). Genetic data was based on haplotypes for the mitochondrial NADH II
dehydrogenase gene region (see Section 1 for details and analyses). Only birds genotyped for
this locus and with feathers sampled were included in carotenoid network analyses.
Using these data, we ran partial regressions using SAS 9.4 (SAS Instutite, Cary, NC) and
SigmaPlot 11.1 (Systat Software, San Jose, CA) between each of these pairwise comparisons
(network, genetic differentiation, genetic similarity, age differences and habitat differences) for
each pair of populations to explore the relative contribution of each factor to network
differentiation. Data for each measure was log10 transformed to decouple mean and variance in
these samples.
We then also explored differences within dietary compounds and derived compounds
between populations. We assessed how the six main dietary entry points (lutein, zeaxanthin, β-
carotene, β-cryptoxanthin, α-carotene, and rubixanthin) differs between populations. We also
explored how derived pathways that differed (here, the 4-hydroxylutein to α-doradexanthin
pathway) between populations as well. We considered population characteristics, such as east of
the Continental Divide versus west of the Continental Divide or population age (old or new), and
their effects on compound differences. Lastly, we explored the relationship between population
age and the ratio of highly-derived compounds (four compounds in the network that are more
than two steps from any dietary entry point: canthaxanthin, adonirubin, astaxanthin, α-
doradexanthin) to dietary entry points (those four within the main network: lutein, zeaxanthin, β-
carotene, β-cryptoxanthin) to test if local competence occurs within these populations as they age
and accustom to their habitat.

Farrar 36
RESULTS
Between the six Montana study populations, four of the six possible dietary entry points
differed in the proportion of the sample that expressed the compound (Figure 2.2). Only lutein
and zeaxanthin were present in 100% of the birds and populations sampled, while β-carotene, β-
cryptoxanthin, α-carotene, and rubixanthin varied between populations to different degrees. Of
these, β-cryptoxanthin varied the most between populations (Figure 2.2) and was the only
compound with a significant ANOVA value suggesting different means (F = 4.178, p = 0.007).
When eastern versus western populations were compared, east populations expressed more β-
carotene and rubixanthin, but west populations expressed more β-cryptoxanthin and α-carotene.
When we compared old and new populations, a similar pattern appeared, where β-carotene and
rubixanthin are more common in newer populations and β-cryptoxanthin slightly more common
in older ones. However, in this comparison, α-carotene was more common in new populations
than older ones.
Of derived compounds (including intermediates and expressed compounds), seven out of
18 possible varied among populations. Since 4-oxo-rubixanthin is the only possible derived
compound from rubixanthin, a dietary entry point (Figure 2.1), the proportions of individuals
expressing rubixanthin matched completely those that expressed 4-oxo-rubixanthin, so this
expressed compound is not particularly informative. Of the other six derived compounds that
differed, three (idoxanthin, astaxanthin, and β-isocryptoxanthin) differed only in the St. Regis
population, all other populations expressed these three compounds in 100% of their samples. The
last two compounds that differed, 4-hydroxylutein and α-doradexanthin (intermediate and
derived, respectively) are consecutive compounds in a pathway, so their presence in samples
correlated 100% with one another (it is only possible to express α-doradexanthin if 4-

Farrar 37
hydroxylutein is present as an intermediate). We considered these two compounds as a pathway
“unit” that differed between populations.
Of the inter-population differences included in the partial regression, genetic variables
contributed most to the variation in network differences across populations (Figure 2.4). Genetic
similarity (number of shared mitochondrial haplotypes) had contributed most strongly to the
network differentiation variation (bst = -0.84, t=-2.48, p =0.02, n=15), while genetic
differentiation (FST) also contributed to the variation observed, but not quite as strongly and
significantly as genetic similarity (bst = -0.63, t = -2.20, p =0.05, n=15). Neither population age
differences nor suitable house finch habitat differences between populations contributed to the
variation in network differentiation (population age differences: bst = 0.03, t = 0.11, p =0.90,
n=15; suitable habitat differences: bst = -0.1, t = -0.41, p =0.80, n=15).
The analysis of the highly-derived compounds to dietary entry points ratio against
population age suggest a weak negative relationship (Figure 2.5), although this correlation was
not significant (Spearman’s rank, ρ= -0.257, p = 0.658, n = 6).
DISCUSSION
Our results suggest that the variability of carotenoid networks between populations and
the genetic relationships between populations may be related. Genetic relationships (both genetic
similarity, measured by shared haplotypes, and genetic differentiation, measured by FST) best
explained the variation in network differentiation that occurred across populations. This suggests
that the patterns of gene flow and isolation that have both buffered against and promoted
divergence in these populations drive differences in the network of carotenoid coloration, more
Farrar 38
so than ecological differences in habitat quality or the length of time populations have occupied
said habitat.
We found that as populations share more mitochondrial DNA haplotypes (i.e. increasing
genetic similarity), their network structures become increasingly similar. Since these
mitochondrial DNA haplotypes are shared through either high gene flow between populations or
a mutual population-of-origin as a source, they may represent shared local foraging and
coloration strategies within a population. These strategies may develop in those source
populations over time as they adjust to the available resources of that particular habitat. As
dispersal and emigration from that source population occurs (as evidenced by shared
haplotypes), those strategies may also be shared across the range as it expands.
Interestingly, we also found that genetic differentiation (as measured by FST) also
explains some of the variation in network differences across populations. However, this
relationship suggests that as populations become more genetically differentiated (increasing FST
values), their networks become increasingly similar (reduced metabolic distance), contradicting
the relationship found with genetic similarity. One explanation for this apparent contradiction
may be that the measure of genetic differentiation incorporates the more subtle effects of
divergence over time. Genetic differentiation, as measured for DNA sequence data using the
method of Nei (1982), incorporates the nucleotide differences between haplotypes, as well as
their frequency within the two populations being compared. This measure goes beyond the
qualitative description that populations share haplotypes (and thus gene flow or populations-of-
origin), but describes to what degree that similarity occurs, both in terms of nucleotide similarity
between haplotypes, but also the proportion that the shared haplotypes may occur. The genetic
differentiation measure thus includes the accumulation of private haplotypes or divergent single-

Farrar 39
site polymorphisms between haplotypes that may arise by drift and mutation processes over time
in separated populations (Gillespie 2004). Through these included processes, genetic
differentiation may better encapsulate subtle genetic differences across the populations that
accumulate over time. As time since population divergence increases, network usage may
diversify as local foraging and metabolic competence increases, as individuals become more
accustomed to the resources available in their habitat. This increased competence and network
exploration may cause networks to overlap more (reducing metabolic distance) as they use more
of the possible network space for the species.
Our analysis of the highly-derived compound to dietary compound ratio in populations
over time also supports the idea of local competence. Local competence can be described as
increasing metabolic ability and network usage in a habitat as time increases since population
establishment. As individuals become more acclimated to the resources in their habitat and more
adept at foraging and metabolizing dietary inputs over time, their network usage will expand
accordingly. Our results suggest that as populations age in their location, the ratio of highly-
derived compounds to dietary inputs decreases. This suggests that as populations become more
established in their environment, they are able to increase the number of dietary inputs into the
network (either through increased familiarity or foraging ability), decreasing the ratio. Studies of
carotenoid compounds across molts in individuals showed that dietary compounds can increase
with individual age, further supporting increased foraging ability over years (Welu et al. 2015).
Increased dietary inputs can also mean increased use of the total network space over time,
supporting the hypothesis of local competence.
The distribution of dietary compounds across dietary compounds shows that
interestingly, some peripheral, “rare” dietary entry points are more common in newly-established
Farrar 40
populations (e.g. those established after 1991) than older populations (those established before
1991). For example, rubixanthin, a carotenoid on the periphery of the network (Figure 2.2) was
present in 100% of newly established population samples, and only 80% of more established
populations. Rubixanthin is ecologically rare compared to other carotenoids, and is found
mainly in flowers, like rose hips (McGraw 2006). α-carotene, another peripheral compound and
secondary carotenoid (found in fruits and flowers) (Delgado-Vargas et al. 2000), also was found
in slightly higher proportions in newer populations. While this pattern may be due to dietary
source abundances in the different habitats, a possible alternative explanation may be a tendency
towards novel food sources in newly-established populations at range edge. Previous studies of
invasive bird species found that individuals in range-edge populations find novel foods faster
than those from well-established populations (Liebl & Martin 2014). In this case, range-edge
house finches may be more likely to eat flowers or less common carotenoid sources than those
central to the range with established dietary sources of carotenoids. Since these carotenoids do
not contribute to the highly-derived expressed compounds in the main network, this finding does
not directly contradict the idea of local competence, since other, more central carotenoids (i.e. β-
cryptoxanthin) were still more common in established populations than newer ones.
However, inclusion of multiple sampling years may bias the data, as environmental
conditions within one year may effect carotenoid availability or acquisition (McGraw 2006) and
not actually affect patterns such as local competence. This is especially problematic if birds of
different ages have differential ability to acquire or metabolize less-common compounds (Welu
et al. 2015). In addition, using an “average” network may reduce some of the variation observed
in a population, obfuscating patterns of differentiation and reducing the metabolic distance.
Increased sampling of male birds across the range edge and comparisons of data on flux through

Farrar 41
the network (vs network structure) could parse apart patterns with population age seen in our
data.
Overall, we find that the differences in carotenoid networks across these range-edge
populations may be best explained by the genetic relationships among populations, suggesting
that adaptive potential for new phenotypes may be limited by the trait components present in the
population founders. However, we also find evidence that competence with local food sources
increases over time, as increased habitat familiarity enables new inputs to the carotenoid
network. This may suggest that both processes are at play, where the trait components present in
the ancestral state of the population may be molded and ultimately, extended by the habitat
resources available to each population.
Farrar 42
Population Side of the
Divide Putative Establishment Date N Years Sampled
Missoula West 1969 8 2004‐2005, 2008
Ovando West 2003 4 2008
St. Regis West 1976 4 2006,2008
Havre East 2000 8 2006
Chester East 1995 3 2006
Livingston East 1990 5 2006
Table 2.1. Feather sample distribution across populations sampled. Feather samples were collected and processed (see Methods) for carotenoid compounds from six Montana populations. Samples included in this study were also genotyped for the NADH II dehydrogenase gene.

Farrar 43
Figure 2.1. Biochemical network of carotenoid feather coloration in house finches. Variation in carotenoid-based pigmentation of male house finches is proximately determined by variation in a network of enzymatic reactions that drives the conversion of dietary carotenoids into carotenoids deposited into ornamental feathers. In the house finch enzymatic network, there are 18 possible intermediate or expressed compounds (yellow, red) that can be derived from six possible dietary entry points (green).

Farrar 44
Figure 2.2: Expression of dietary compounds and derived compounds varies between populations. Of the six dietary entry points, four varied in expression between populations. Red-coded populations (STR, MSO, OVD) all correspond to western populations, while blue-coded populations (CHS, HAV, LVST) are eastern populations. 4 dietary entry points varied, while one highly-derived compound varied between populations.

Farrar 45
A)
B) Figure 2.3. Differences in dietary compound expression across regions and across population ages. Six dietary entry points are sorted by common (Lutein, zeaxanthin, beta-carotene) and more rare (beta-cryptoxanthin, alpha-carotene, and rubixanthin). A) Blue bars correspond with eastern populations, orange bars to western populations (population proportions are pooled across the three populations per side). B) Older populations are in brown (established before 1991), newer populations are in green (established after 1991).

Farrar 46
Figure 2.4. Partial regression plots showing the effect of inter-population differences on variability in enzymatic network differentiation. (A) Network enzymatic differentiation versus genetic differentiation, as measured by FST (run in Arlequin 3.5); (B) enzymatic network differentiation versus genetic similarity, measured by number of mitochondrial DNA haplotypes shared between populations; (C) pairwise network differentiation versus pairwise population age difference, calculated as the difference in years between establishment dates; (D) pairwise network differentiation versus suitable habitat differences, calculated as the difference in area of suitable habitat for house finches within a 20 mile buffer from each population. Network differentiation is measured by metabolic distances between average population networks (see Methods)

Farrar 47
Figure 2.5: Relationship between population age and the ratio of highly derived compounds to main dietary inputs. Highly derived compounds are more than one reaction away from a dietary compound. In the house finch network, there are four such compounds: α-doradexanthin, adonirubin, astaxanthin and canthaxanthin. Only the four main dietary inputs that are connected to the main network were included in this ratio. Eastern populations are red dots, western populations blue dots.

Farrar 48
ACKNOWLEGEMENTS Many thanks to Erin Morrison for her mentoring and encouragement in the lab, Taylor
Edwards, Matt Kaplan and Barbara Fransway for their guidance during data collection and
analysis, the members of the Badyaev and Duckworth labs for their comments and guidance
during the research process, and to Dr. Alexander Badyaev, who presented me with the
wonderful opportunity to do work in his laboratory and further strengthen my background in
genetics and Ecology & Evolutionary Biology. I thank all my mentors and advisors who believed
in my potential to do research and my capacity to handle a challenging independent project; I
have learned so much from you all. Lastly, I thank my friends and family for supporting me
through the trials and tribulations of research and offering me advice and encouragement.
This research was supported by funds from the Undergraduate Biological Research
Program, the National Science Foundation – Research Experiences for Undergraduates, the
Leslie Goodding Ecology and Evolutionary Biology Scholarship, and the Galileo Circle
Scholarship.

Farrar 49
REFERENCES Agashe D, Falk JJ, Bolnick DI (2011) Effects of Founding Genetic Variation on Adaptation to a
Novel Resource. Evolution, 65, 2481-2491. Avise JC (2000) Phylogeography: The History and Formation of Species, 1 edn. Harvard
University Press, Cambridge, Massachusetts. Badyaev AV (2009) Evolutionary significance of phenotypic accomodation in novel
environments: an empirical test of the Baldwin effect. Philosophical Transactions of The Royal Society B, 364, 1125-1141.
Badyaev AV (2010) The Beak of the Other Finch: Coevolution of genetic covariance structure
and developmental modularity during adaptive evolution. Philosophical Transactions of The Royal Society Biological Sciences, 365, 1111-1126.
Badyaev AV, Belloni V, Hill GE (2012) House Finch (Haemorhous mexicanus). In: The Birds of
North America Online. Cornell Lab of Ornithology, Ithaca. Badyaev AV, Hill GE, Stoehr AM, Nolan PM, McGraw KJ (2000) The evolution of sexual
dimorphism in the house finch: II. Population divergence in relation to local selection. Evolution, 54, 2134-2144.
Badyaev AV, Martin TE (2000) Sexual dimoprhism in relation to current selection in the house
finch. Evolution, 54. Badyaev AV, Morrison ES, Belloni V, Sanderson MJ (,in review) Tradeoff between robustness
and elaboration produces cycles of avian color diversification. In review. Bandelt HJ, Forster P, Röhl A (1999) Median-joining networks for inferring intraspecific
phylogenies. Molecular Biology and Evolution, 16, 37-48. Delgado-Vargas F, Jimenez AR, Parades-Lopez O (2000) Natural Pigments: Carotenoids,
Anthocyanins, and Betalains - Characteristics, Biosynthesis, Processing, and Stability. Critical Reviews in Food Science and Nutrition, 40, 173-289.
Drummond AJ, Suchard MA, Xie D, Rambaut A (2012) Bayesian phylogenetics with BEAUti
and the BEAST 1.7. Molecular Biology and Evolution, 29, 1969-1973. Eberhard JR, Bermingham E, Zink R (2004) Phylogeny and Biogeography of the Amazona
Ochrocephala (Aves: Psittacidae) complex. Auk, 121, 318-332. Excoffier L, Lischer HE (2010) Arlequin suite ver 3.5: a new series of programs to perform
population genetics analyses under Linux and Windows. Molecular Ecology Resources, 10, 564-567.
Fisher RA (1930) The Genetical Theory of Natural Selection. Clarendon Press, Oxford.

Farrar 50
Fluxus-Engineering (1999-2014) Network 4.612. Garant D, Forde SE, Hendry AP (2007) The multifarious effects of dispersal and gene flow on
contemporary adaptation. Functional Ecology, 21, 434-443. Gillespie JH (2004) Population Genetics: A Concise Guide, 2 edn. The Johns Hopkins
University Press, Baltimore, Maryland. Givnish TJ (1997) Adaptive Radiation and Molecular Systematics: Issues and Approaches.
In:Givnish TJ, Sytsma KJ (eds) Molecular Evolution and Adaptive Radiation, 1 edn. Cambridge University Press, Cambridge, UK. p.^pp. 1-54.
Grant BR, Grant PR (2008) How and Why Species Multiply: The Radiation of Darwin's Finches,
1 edn. Princeton University Press, Princeton, NJ. Hawley DM, Briggs J, Dhondt AA, Lovette IJ (2008) Reconciling molecular signatures across
markers: mitochondrial DNA confirms founder effect in invasive North American house finches (Carpodacus mexicanus). Conserv Genet, 9, 637-643.
Hill GE, Inouye CY, Montgomerie R (2002) Dietary carotenoids predict plumage coloration in
wild House Finches. Proc R Soc B-Biol Sci, 269, 1119-1124. Hudon J, Brush AH (1989) Probable dietary basis of a color variant of the Cedar Waxwing.
Journal of Field Ornithology, 60, 361-368. Inouye CY, Hill GE, Stradi R, Montgomerie R (2001) Carotenoid pigments in male House Finch
plumage in relation to age, subspecies, and ornamental coloration. Auk, 118, 900-915. Krebs MA, Badyaev AV (2007) House Finch Habitat Suitability and Connectivity for Montana -
Supporting Documentation. p. 5. Landeen EA, Badyaev AV (2012) Developmental Integration of Feather Growth and
Pigmentation and its Implications for the Evolution of Diet-Derived Coloration. Journal of Experimental Zoology Part B-Molecular and Developmental Evolution, 318B, 59-70.
Librado P, Rozas J (2009) DnaSP v5: A software for comprehensive analysis of DNA
polymorphism data. Bioinformatics, 25, 1451-1452. Liebl AL, Martin LB (2014) Living on the edge: range edge birds consume novel foods sooner
than established ones. Behavioral Ecology, 25, 1089-1096. McGraw K (2006) The mechanics of carotenoid coloration in birds. In:Geoffrey E. Hill KJM
(ed) Bird Coloration, Volume 1: Mechanisms and Measurements, 1 edn. Harvard University Press, Cambridge, MA. p.^pp. 177-242.

Farrar 51
Nei M (1982) Evolution of Human Races at the Gene Level. Progress in Clinical and Biological Research, 103, 167-181.
Nylander JAA (2004) MrModeltest v2. Program distributed by the author, Evolutionary Biology
Centre, Uppsala University. Oh KP, Badyaev AV (2008) Evolution of Adaptation and Mate Choice: Parental Relatedness
Affects Expression of Phenotypic Variance in a Natural Population. Evol Biol, 35, 111-124.
Petren K, Grant PR, Grant BR, Keller LF (2005) Comparative landscape genetics and the
adaptive radiation of Darwin's finches: the role of peripheral isolation. Molecular Ecology, 14, 2943-2957.
Rambaut A (2006-2009) FigTree: tree figure drawing tool version 1.2.2. Available at:
http://tree.bio.ed.ac.uk/software/figtree. . Rambaut A, Suchard MA, Xie D, Drummond AJ (2014) Tracer v1.6. Ramos-Onsins SE, Rozas J (2002) Statistical properties of new neutrality tests against population
growth. . Molecular Biology and Evolution, 19, 2092-2100. Sorenson MD, Quinn TW (1998) Numts: A Challenge for Avian Systematics and Population
Biology. The Auk, 15, 214-221. Tajima F (1989) Statistical method for testing the neutral mutation hypothesis by DNA
polymorphism. Genetics, 123, 585-595. Tamura K, Stecher G, Peterson D, Filipski A, Kumar S (2013) MEGA6: Molecular Evolutionary
Genetics Analysis version 6.0. Molecular Biology and Evolution, 30, 2725-2729. Tietze DT, Päckert M, Martens J, Lehmann H, Sun Y-H (2013) Complete phylogeny and
historical biogeography of true rosefinches (Aves: Carpodacus). Zoological Journal of the Linnean Society, 169, 215-234.
Wan QH, Wu H, Fujihara T, Fang SG (2004) Which genetic marker for which conservation
genetics issue? Electrophoresis, 25, 2165-2176. Welu A, Morrison ES, Badyaev AV (2015) Do changes in enzymatic network underlie age-
dependent optimization of carotenoid displays in a bird? . In: Ecology and Evolutionary Biology Undergraduate Poster Session, University of Arizona.
Wooley SM, Posada D, Crandall KA (2008) A Comparison of Phylogenetic Network Methods
Using Computer Simulation. PLoS ONE, 3, e1913.