fallon, nevada, childhood leukemia: a case study in medical geology paul sheppard laboratory of...
TRANSCRIPT

FALLON, NEVADA, CHILDHOOD LEUKEMIA: A CASE STUDY IN
MEDICAL GEOLOGY
Paul Sheppard
Laboratory ofTree-RingResearch
(dendrochronology)


But Wait, There’s More …
• AHSC colleagues
– Dr. Mark Witten, Pediatrics (ret.)
– Dr. Clark Lantz, Anatomy (admin.)
• Joint faculty, Zuckerman Public Health
• ACC
– CPC
• Huh?

Medical Geology
• (Re)-emerging interdisciplinary scientific field
• Study of exposure to, or deficiency of, trace elements, e.g., in dust, water, food
• Effects on human health
Hydrobiogeochemoepidemiopathoecology

• Ron Fuge: Editor,Applied Geochemistry
• Olle Selinus: My working editor
Lovelock
Fern ley
Yerington
Reno Fallon
Ne
vada
Califo
rnia
80
50 km
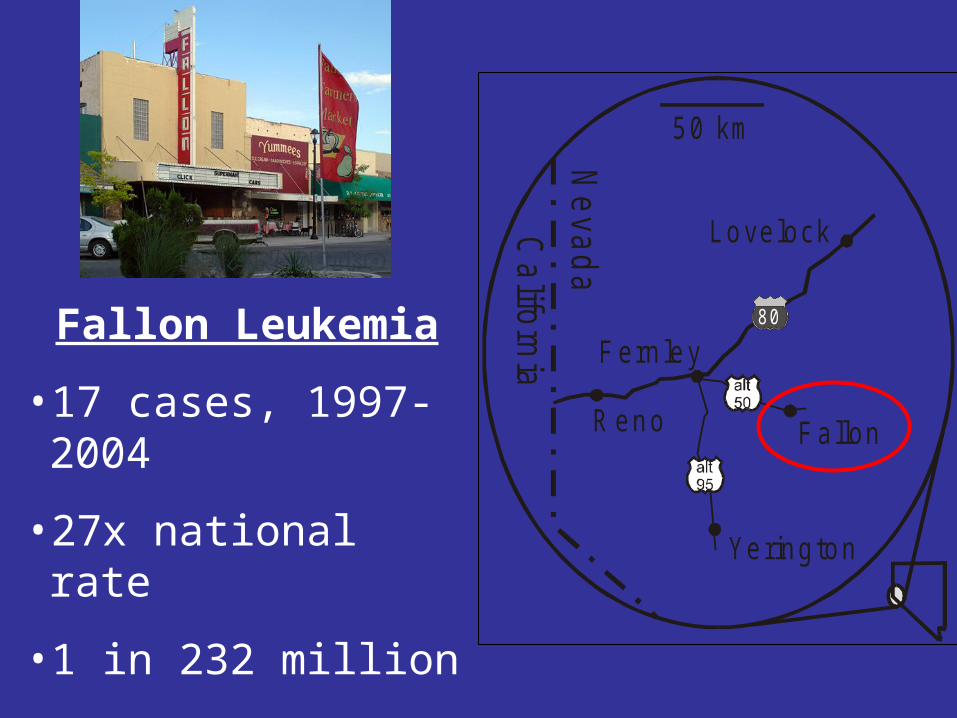
Fallon Leukemia
• 17 cases, 1997-2004
• 27x national rate
• 1 in 232 million
• “Most convincing cluster ever reported”

Environmental Analysis
• Ecologic study vs. case-comparison
• Multi-element analysis
• Controls
• Multiple lines of evidence
• Replication
• Airborne environment

Airborne Dust

Fallon Airborne Dust
• Many samplers
• Many days
• Five towns
• Project repeated
− New equipment
Lovelock
Fernley
Yerington
Reno Fallon
Ne
vad
a
Californ
ia
80alt95
alt50
50 km

0
5
10
Fa
llon
(1
0)
Fa
llon
(5
)L
ove
lock
(5
)
Fa
llon
(5
)F
ern
ley
(5)
Fa
llon
(4
)Y
eri
ng
ton
(5
)
Fa
llon
(2
)R
en
o (
3)
Fa
llon
(2
7)
Oth
ers
(1
8)
Tu
ng
ste
n (
ng
m–3
)
0
1
2
Co
ba
lt (n
g m
–3)
0.0
10
.01
0.0
1
0.1
5
0.0
20
.06
0.0
7
0.3
0
0.0
01
0
.00
1
a
Fallon W Other W Fallon Co Other Co
Tungsten and cobalt
• Elevated in Fallon
• Variable through time

Surface Dust
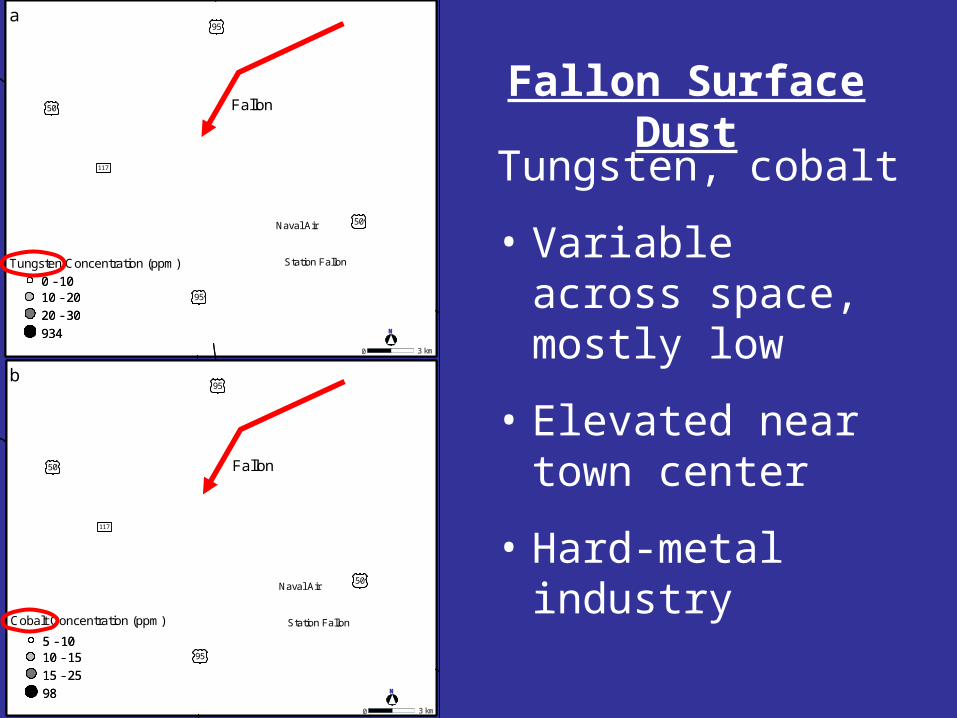
Tungsten, cobalt
• Variable across space, mostly low
• Elevated neartown center
• Hard-metal industry
#S#S#S#S#S#S
#S#S#S#S
#S#S
#S
#S#S
#S#S#S
#S#S#S
#S#S
#S
#S
#S#S #S #S#S
#S#S#S#S #S #S#S
#S
#S#S#S#S #S#S#S#S#S
#S
#S
#S
#S #S #S #S #S #S
#S
#S
#S#S
#S
#S#S
#S
#S
#S#S
#S#S#S
#S #S
#S
#S
#S
#S
#S
#S
#S
#S
#S
#S#S
#S
#S
#S #S
#S
#S
#S
#S#S
#S
#S #S
#S
#S #S
#S
#S
#S
#S #S #S #S #S
#S#S
#S #S
#S#S#S#S#S
#S
#S
#S#S#S
#S
50
50
95
95
117
Tungsten Concentration (ppm)
0 3 km
N
0 - 1010 - 20
20 - 30
934
a
Fallon
Naval Air
Station Fallon
#S#S#S#S#S#S
#S#S#S#S
#S#S
#S
#S#S
#S#S#S
#S#S#S
#S#S
#S
#S
#S#S #S #S#S
#S#S#S#S #S #S#S
#S
#S#S#S#S #S#S#S#S#S
#S
#S
#S
#S #S #S #S #S #S
#S
#S
#S#S
#S
#S#S
#S
#S
#S#S
#S#S#S
#S #S
#S
#S
#S
#S
#S
#S
#S
#S
#S
#S#S
#S
#S
#S #S
#S
#S
#S
#S#S
#S
#S #S
#S
#S #S
#S
#S
#S
#S #S #S #S #S
#S#S
#S #S
#S#S#S#S#S
#S
#S
#S#S#S
#S
5050
5050
9595
9595
117
Tungsten Concentration (ppm)
0 3 km
N
0 3 km
N
0 - 1010 - 20
20 - 30
934
0 - 1010 - 20
20 - 30
934
a
Fallon
Naval Air
Station Fallon
#S#S#S#S#S#S
#S#S#S#S
#S
#S#S
#S
#S#S
#S#S#S#S
#S#S#S
#S#S
#S#S#S#S #S #S
#S
#S#S#S#S #S #S#S
#S#S#S#S
#S#S#S
#S#S#S#S
#S
#S
#S
#S #S #S #S #S #S
#S
#S
#S#S
#S
#S#S
#S
#S
#S#S
#S#S#S
#S #S
#S
#S
#S
#S
#S
#S
#S
#S
#S
#S
#S#S
#S
#S
#S #S
#S
#S
#S
#S#S
#S
#S #S
#S
#S #S
#S
#S
#S
#S #S #S #S #S
#S#S
#S #S
#S#S#S#S#S
#S
#S
#S#S#S
#S
50
50
95
95
117
5 - 1010 - 15
15 - 25
98
Cobalt Concentration (ppm)
b
Fallon
Naval Air
Station Fallon
0 3 km
N
#S#S#S#S#S#S
#S#S#S#S
#S
#S#S
#S
#S#S
#S#S#S#S
#S#S#S
#S#S
#S#S#S#S #S #S
#S
#S#S#S#S #S #S#S
#S#S#S#S
#S#S#S
#S#S#S#S
#S
#S
#S
#S #S #S #S #S #S
#S
#S
#S#S
#S
#S#S
#S
#S
#S#S
#S#S#S
#S #S
#S
#S
#S
#S
#S
#S
#S
#S
#S
#S
#S#S
#S
#S
#S #S
#S
#S
#S
#S#S
#S
#S #S
#S
#S #S
#S
#S
#S
#S #S #S #S #S
#S#S
#S #S
#S#S#S#S#S
#S
#S
#S#S#S
#S
5050
5050
9595
9595
117
5 - 1010 - 15
15 - 25
98
5 - 1010 - 15
15 - 25
98
Cobalt Concentration (ppm)
b
Fallon
Naval Air
Station Fallon
0 3 km
N
0 3 km
N
Fallon Surface Dust
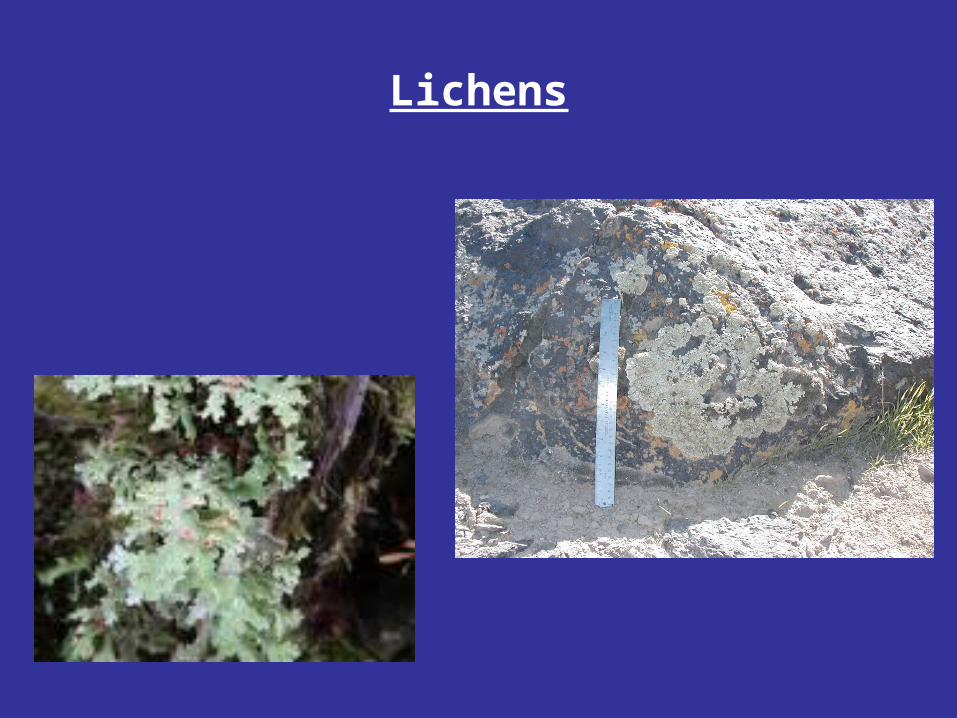
Lichens

Fallon Lichens
• 10 in town
− Rattlesnake Hill
• 20 out of town
− All directionsNavalAirStation
Fallon
East
South
West
North
10 km
alt50
95

Table 1: Element concentrations and standard errors in lichens and rock substrates. Cobalt and tungsten are shaded for lichens as the only elements with significant differences within Fallon versus outside of Fallon.
Lichens
Within Fallon (n = 10) Outside Fallon (n = 20)
Element Median (ppm)
Standard Error
Median (ppm)
Standard Error
Ratio Within: Outside
lithium 8.02 0.82 5.37 3.61 1.49 beryllium 0.32 0.06 0.19 0.07 1.71 vanadium 21.65 3.88 13.40 5.52 1.62 chromium 8.52 1.56 6.21 2.26 1.37
manganese 137 52 118 43 1.16 iron 8122 1403 6290 1852 1.29
*cobalt 3.59 0.73 1.79 0.65 2.01 nickel 4.38 0.94 4.40 0.99 0.99
copper 8.99 0.72 7.73 1.43 1.16 zinc 43.55 2.31 34.60 4.58 1.26
arsenic 4.83 0.72 3.07 0.99 1.57 strontium 251 20 179 20 1.40
molybdenum 0.63 0.06 0.60 0.12 1.05 silver 0.17 0.01 0.14 0.01 1.26
cadmium 0.30 0.01 0.32 0.02 0.94 tin 0.61 0.07 0.44 0.08 1.40
antimony 0.77 0.08 0.71 0.13 1.09 cesium 1.44 0.14 0.93 0.44 1.54
tantalum 0.09 0.02 0.06 0.02 1.47 ***tungsten 24.95 1.91 1.99 0.30 12.54
thallium 0.12 0.01 0.08 0.03 1.55 lead 13.70 1.15 17.45 5.13 0.79
thorium 2.28 0.33 1.35 0.31 1.69 uranium 0.96 0.11 0.52 0.19 1.85
Rock Substrates
Within Fallon (n = 3) Outside Fallon (n = 12)
Element Median (ppm)
Standard Error
Median (ppm)
Standard Error
Ratio Within: Outside
cobalt 24.00 0.58 23.00 0.47 1.04 tungsten 2.40 0.17 2.45 0.06 0.98
* Significance at the 0.06 level, *** significance at the <0.001 level. Differences in medians were tested using the two-tailed Mann-Whitney test of medians (Sokal and Rohlf, 1981).
• Most Elements
– Slightly higher in Fallon
• Tungsten, cobalt
– Much higherin Fallon
Fallon Lichens`
`
– Not higher in Fallon rocks

Tree Leaf Chemistry
1. Clip a branchlet of leaves
2. Rinse leaves in water, save water
3. Measure rinsate for contaminants
4. Divide through by mass of dried leaves
5. Map out concentrations
6. Repeat every year,citizen science

Fallon Leaf Chemistry

Fallon Leaf Chemistry

Tree rings

Fallon Tree Rings
• Trees in Fallon
• Trees in other towns
• Last 15 years
50
95
Lovelock
Fernley
Yerington
Fallon
Ne
vad
a
Ca
liforn
ia
80alt95
alt50
50 km hard-metalfacility
250 m
A B

Fallon Tree Rings
• Tungsten increased since mid 1990s
• Cobalt high through-out
• Other metals not noteworthy
0
100
200
1990 1992 1994 1996 1998 2000 2002 2004
A:
Tun
gste
n0.01 0.04 0.06>0.50
0
70
140
1990 1992 1994 1996 1998 2000 2002 2004
B:
Cob
alt
0. 0. 0. 0.
0.01 0.02 0.06 0.01
1,500
2,500
3,500
1990 1992 1994 1996 1998 2000 2002 2004
C:
Cop
per
>0.50 >0.50 >0.50 >0.50
0
100
200
1990 1992 1994 1996 1998 2000 2002 2004
D:
Cad
miu
m
>0.50 0.02 0.09>0.50
0
125
250
1990 1992 1994 1996 1998 2000 2002 2004
E:
Lead
>0.50 >0.50 >0.50 >0.50
Con
cent
ratio
n (p
pb)

• Environmental Research (me)
• Fallon distinctive environmentally
– Tungsten and cobalt elevated relative to other towns, outlying desert
– Airborne particles

• Biomedicalresearch (Witten)
• Public health theory• Research by others
Biomedical Side• Tungsten can’t be linked to
leukemia from en-vironmental data alone– Biomedical research
suggestive– IARC: W and Co probably
carcinogenic

• Relevant title
• Appropriate journal
• Independent authors

• High tungsten burden in Fallon
• Tungsten exposure in Fallon
• Leukemia cluster in Fallon

• Tungsten biomedical treatment level based on environmental finding

• Tungsten of high interest in cancer research

EPA Earmark: Fallon

What’s next?
• Other sites with illness
• Other sites with pollution

Funding
• Cancer Research & Prevention Foundation
• Gerber Foundation

Funding Dilemma
• NIEHS: Understand how combined environmental exposures affect disease pathogenesis
• EPA: Protect human health and the environment
• Research, or mere monitoring?

Thanks for having me.
Comments, questions?