faisal rahmatallah, chairman mark connelly david …...mark connelly callum davidson allenby capital...
TRANSCRIPT
3rd July 2017
Plastics Capital plc
(“Plastics Capital”, the “Company” or the “Group”)
Results for the year ended 31 March 2017
Plastics Capital plc (AIM: PLA), the niche plastics products manufacturer, announces its audited results for the year ended 31 March 2017, which are in line with consensus market expectations. Financial highlights Year ended
31 March 2017 £000
Year ended 31 March
2016 £000
% Change
Revenue 65,785 50,803 29.5% EBITDA* 6,900 5,886 17.2% Underlying Profit before tax* 4,348 4,061 7.1% Underlying EPS (p)*+ 11.5 10.8 6.5% DPS (p) 1.46 4.40 -66.8% * excluding amortisation, exceptional costs, unrealised foreign exchange derivative gains / losses, and share-based incentive scheme charges (see Notes 4&5). + applying an underlying tax charge of 6.5% and based on the weighted average number of shares in issue in the year.
Financial highlights • Banking facilities increased and extended in July 2016 • Significant increase in capital allocated towards investment in organic growth
Operational highlights
• Strong like-for-like organic growth of 6.7% annually • Pipeline of business won and still to go into production up £0.7 million to £5.5 million • Excellent initial contribution from recently acquired Synpac • Record years for the Industrial Division and Flexipol • Programme of strategic change progressing well at Palagan • Stream of new products being launched • Strong free cash flow being reinvested into growth opportunities • £2.45 million invested in capacity expansion projects • 10% stake taken in CCM in USA with option to increase to 100%
Post year-end highlights
• Placing to raise £3.54 million, net of expenses, completed in early June 2017 Commenting on these results, Faisal Rahmatallah, Chairman, said: “FY2017 has been a very good year for organic and acquisitive growth. Our Industrial Division and Flexipol have had record years for sales and profitability driven by excellent key account management, product innovation and technical sales. In addition, Synpac, acquired in July 2016, has performed in line with expectations at the time of acquisition and has so far proved to be an excellent addition to our Films Division in terms of technology and customer reach. We expect that profits will benefit from the change programme being implemented at Palagan and the expiry of currency hedges taken out prior to Brexit.
The information contained within this announcement is deemed to constitute inside information as stipulated under the Market Abuse Regulation (EU) No. 596/2014. Upon the publication of this
announcement, this inside information is now considered to be in the public domain.

We continue to have a number of exciting projects that we will be investing in as the current financial year progresses. We believe these initiatives will help us to deliver good growth over the next few years and we anticipate another year of good progress.” Plastics Capital plc Tel: 020 7978 0574 Faisal Rahmatallah, Chairman Nick Ball, Finance Director Cenkos Securities (Nomad and Joint Broker) Tel: 020 7397 8900 Mark Connelly Callum Davidson Allenby Capital Limited (Joint Broker) Tel: 020 3002 2074 David Hart Katrina Perez Notes to Editors Plastics Capital is a niche manufacturer of specialist plastic products. Applications for these products vary widely and examples include:
• Packaging for the food manufacturing and distribution - films, sacks and pouches • Steering columns and instrument control knobs in the automotive industry - plastic ball bearings • Hydraulic and industrial rubber hose manufacture - various types of plastic mandrel • Cardboard box manufacture - plastic creasing matrices
Plastics Capital's business model is based on understanding customers' problems in depth, and then developing and mass producing proprietary, technical solutions for these problems. The business operates through two divisions, Films and Industrial, and has the majority of its production in six UK based factories, with a further two factories in Asia. Approximately 45 per cent. of its £65 million sales are made outside the UK to more than 80 countries. Further information can be found on www.plasticscapital.com
Chairman’s Statement Review of FY2017 Financial Performance FY2017 has been another year of strong revenue growth, with acquisitive and organic growth both contributing significantly. On the acquisitive side, we completed the acquisition of Synpac Limited (“Synpac”) in July 2016 and took minority stakes, with options to acquire further control, in both Channel Creasing Matrix Inc (“CCM”) and Mito Srl (“Mito”); together all these added £8.8 million to revenues in the year under review. On the organic side, we achieved 6.7% like-for-like growth over FY2016, which is within the target range of 5-10% annual growth that we have set ourselves. In addition, sterling devaluation has contributed 3.9% to sales in the year. In terms of organic growth, in the Industrial Division, we achieved 16.5% year-on-year growth after adjusting for exchange rates; 27.3% before adjusting for exchange rates.
(i) Our mandrel business achieved 40.2% revenue growth, much of which was due to new business. (ii) Our bearings business enjoyed a 32% year-on-year increase in sales before adjusting for
exchange rates; a 20.5% increase after adjusting for exchange rates. Again new business was the key success factor.
(iii) Our matrix business increased sales 15.8% on the prior year, after suffering a 7% reduction in the prior year. Some rebuilding of stocks by our distributors contributed to this as did increasing sales of related non-matrix products.
In the Films Division, we achieved 1.7% year-on-year organic growth on a pro-forma basis. Flexipol was 5.9% up and Palagan 4.4% behind the prior year. Exchange rates are not a significant factor for the Films Division. Both businesses had very busy years for different reasons. Flexipol installed and commissioned new extrusion and conversion machinery; Flexipol also took management responsibility for Synpac. Palagan, having lost some key accounts at the end of FY2016, did well to maintain focus and not lose any other key accounts during FY2017 as significant changes were made to the management team, as well as to the production team, wage structure and to internal IT systems. Commodity raw material prices, which affect our Films Division in the short term, were relatively steady during the year and have not affected margins in the Films Division significantly. Prices for engineering grade raw materials, which affect the Industrial Division, have been relatively steady too. Gross margin on a like-for-like basis has improved from 33.2% to 34.5% mainly due to the operational gearing in our bearings and mandrels businesses, both of which have grown strongly. In the Films Division, on a like-for-like basis, there has been little change in gross margin, although Flexipol has performed better in this respect than Palagan. The change in business mix resulting from the acquisitions now consolidated has had little impact on gross margin. Administration and distribution costs increased 9.4% on a like-for-like basis as we continue to add business development resource and other costs to help future growth. Overall therefore, EBITDA increased by 17% during the year; the majority of this improvement resulted from the acquisitions and investments made in the year. Like-for-like EBITDA growth was flat as good progress made in the Industrial Division and at Flexipol was negated by a year of rebuilding at Palagan. Depreciation increased £0.3 million on the prior year primarily because of increased capital expenditure during FY2017. Interest costs have increased significantly due to a higher average debt level and lending margin, but the tax charge remains low due to capital allowances, low taxes in Thailand and the R&D tax credit. As a result, underlying EPS increased by 0.7p or 6.5% over the prior year. “Adjusted” and “Underlying” means excluding amortisation, exceptional costs, unrealised foreign exchange derivative and loan gains / losses, and LTIP charges “like-for-like” means comparison between years applying a constant exchange rate and assuming no impact from acquisitions “pro-forma” means comparison between years assuming no impact from acquisitions “EBITDA” is stated before LTIP charges and exceptional costs
Exceptional costs of £0.9 million were due to the transaction costs associated with the acquisition of Synpac, the stakes in CCM and Mito and the relocation of manufacturing facilities in China. Cash conversion, which is cash flow converted from EBITDA excluding exceptional items, was down on the prior year from 40% to 15%. Higher capital expenditure, up from £2.2m million to £3.5 million was the main cause and reflects the need to expand capacity and add capabilities in both our Divisions. Working capital was 12.6% of sales at year end, down from 13.7% in the prior year. Overall net debt at the end of the year was £16.3 million and net debt leverage 2.3x, which was above the range we target over the long run of 1.5-2x. Interest cover was comfortable at 10.2x. New Business Performance Revenue from new business entering production over the last year was £2.2 million up from £1.5 million in FY2016. We have seen new business entering production in our bearings and specialist sacks businesses in particular. Lost business in the year was low, accounting for less than 1% of turnover, reflecting very high levels of customer satisfaction and therefore retention across the Group. We have enjoyed our second successive year of project conversions worth over £20 million of lifetime sales in our bearings business. At this rate of sales we would expect this business to grow at 15% annually over the next 3-4 years as all this new business comes into production. The annual sales value of new projects that have been converted but not yet reached full production now amounts to £5.5 million; this pipeline is expected to take three to four years to come through. Acquisitions and Investments Synpac was acquired in July 2016 for £3.1 million of which 10% was deferred for 12 months. Sustainable EBITDA was estimated at the time to be £0.6 million and this was slightly exceeded. Synpac is based in Hessle, Yorkshire, and is a specialist converter of barrier films into pouches and bags primarily for the food industry. Barrier films confer properties to pouches, bags and sacks that extend the life of the contents, which is a critical factor in the food industry. Synpac has been integrated into the Flexipol management structure and brings considerable opportunity for our Films Division to grow into the area of specialist barrier film products, where both Synpac and Flexipol have product offerings that can be significantly expanded. Consistent with our stated strategy of forward integrating in the matrix business, we also made two small but strategically important investments in distributors of die-making and box making consumables and manufacturers of creasing matrix. The first in May 2016 was a 10% stake in CCM, based in West Virginia, USA. The agreement signed gives us the right to acquire a further stake over the next few years. CCM has performed steadily over the last 12 months achieving sales of US$7.2 million and EBITDA of US$0.4 million in FY2017 and we plan to increase our investment in this business over the coming months. We have also taken a stake in Mito, an Italian distributor of die-making and box making consumables and manufacturers of creasing matrix. As reported in May this year, as we are deemed to have significant control of both CCM and Mito, the Board determined that these investments should be accounted for as subsidiaries and therefore they have been consolidated into the results for the Group in FY2017. Banking We refinanced in June 2016 with Barclays, who have been our bankers for many years. This enabled us to finance the Synpac acquisition in particular. We extended our facilities by three years to June 2021 and increased them by £6 million to £20 million. The cost of borrowing averaged approximately 350bps over LIBOR for the first year and will reduce as leverage decreases.

Capital Allocation In a letter to shareholders last year I articulated four areas requiring investment during FY2017, as follows:
• Customer specific projects - BNL, our bearings business had won two new projects requiring £1.25 million investment in automatic assembly and injection moulding machines. The actual expenditure on these two projects in the year was £0.75 million; we decided not to implement auto-assembly on one of the projects due to teething problems we have experienced with this sort of equipment, instead using manual assembly which has proved very effective in this case. Both projects are on track to deliver the projected additional total sales of £2 million. We are hopeful that they will lead to other significant projects for the same customers.
• Capacity expansion - Last year, we anticipated capacity bottlenecks in three parts of our business and looked to invest in each to overcome them. Firstly, Flexipol, as planned, increased its extrusion capacity by about a third during the year. The installation of the new extrusion machine was slightly delayed but is fully operational and is producing to the quality and efficiency that we anticipated. Secondly, Bell, our mandrel business, also increased capacity by about a third during the year; and before the year-end, we committed to a further 20% additional capacity which is now being installed. Thirdly, in line with our projection, BNL added injection moulding capacity in Thailand where an increasing amount of its production is carried out as the business expands. In total, we spent approximately £1.5 million on additional non-customer specific capacity over the last year, which was 20% more than we had forecast.
• New product introduction - both Palagan and C&T Matrix have developed new products to be
introduced fully in FY2018. Palagan has suffered some delays caused by its Italian machinery supplier and so this is somewhat behind schedule. C&T has progressed well with patent registration, tooling and testing activity for an exciting new product for the die-making industry called Kingpin. So far we have only spent £0.2 million of the £0.6 million allocated to this area.
• Corporate – as discussed above, we have implemented the C&T forward integration strategy with
investments made in CCM and Mito. The cost to date of these investments was approximately £0.7 million, as projected. We also spent £2.8 million on the acquisition of Synpac increasing our debt to do so. We consider this sort of outright acquisition too opportunistic and uncertain in timing to be part of our explicit investment plans, but nonetheless they are an important part of our capital allocation strategy and contribute significantly towards the achievement of our five year target. Fees associated with these transactions and the bank refinancing amounted to an additional £0.7 5million.
In total, therefore we have spent approximately £6.7 million in these investment areas compared to the £4 million estimated 12 months ago. We also spent £0.4 million to restructure and relocate of Chinese operations. Finally we paid £1.1 million out in dividends. All of this amounts to a total of £8.2 million and was funded by free cash flow of £3.7 million and an increase in net debt of £4.5 million.
Strategy & Growth Turning now to the future, we can articulate some of the factors guiding the future development of the Group. In early FY2016 we launched a five year plan with the target of doubling EBITDA over the subsequent five years. This strategic goal links to the LTIP Growth Share awards announced on 2 October 2015 for the senior executive teams across the Group’s subsidiaries. Within the five-year plan, we have a number of strategic initiatives that we believe will drive this growth. These initiatives are continuously monitored for progress and are reviewed at regular intervals by the Board. As we move forward some initiatives are completed, others evolve into new areas and dynamically shift while others are brought forward, approved and incorporated into our strategy. Whilst we set strategic plans, our goal is to run the best business we possibly can and not to fall into the trap of rigidly managing a strategic plan rather than a dynamic business. The most important initiatives within the latest plan in terms of impact over the five year period are:
• In our Films Division - expanding the sales of specialist sacks, liners and pouches. We have an excellent range of products, particularly at Flexipol, some of which are patented. There are good opportunities to expand the range, service existing key accounts more fully and penetrate new key accounts with these products. Over the last two years, we have
o Added sales capacity at Flexipol and Palagan o Added Synpac’s range of barrier film pouches o Added film extrusion and bag conversion capacity at Flexipol o Introduced some new product capabilities
Although some further investment will be needed, this initiative has received considerable resources over the last two years and the priority is now the achievement of sales growth supported by efficient operational performance. This initiative is progressing well. The target for this initiative is to add £6.5 million of annual sales and £1.0 million of EBITDA in the period to FY2020.
• Developing new bearings projects with major OEMs and bringing already won business successfully into production. Our bearings business has long project gestation periods, with up to five years between tool order and product sales at full run rate. The current pipeline of business that is won but not yet into full production stands at £5.0 million of annualised sales value, all of which should come through over the next three to five years. This is an improvement of £0.7 million compared to twelve months ago. Further project opportunities with key accounts are in the pipeline for conversion. The initiative is going well and hinges on good key account management and development as well as clever design engineering and technical support, activities that our bearings business is increasingly effective at. The target for this initiative is to add £7.0 million of annual sales and £1.5 million of EBITDA in the period to FY2020.
• Developing new business in mandrels globally through the provision of in-depth technical service and product customization. Our mandrel business has a highly successful business model based on technical expertise and a wide range of solutions for hose manufacturers – the list of potential prospects is substantial. Over the last two years we have recruited additional sales and R&D resource, and added capacity in this business to enable us to deepen our competencies and to exploit this opportunity fully. This initiative is also progressing well. We have achieved considerable growth over the last 12 months through new customers, particularly in North America. We need to continue to support this business with further capacity, some of which needs to be in the US. The target for this initiative is to add £1.5 million of annual sales and £0.5 million of EBITDA in the period to FY2020.
• Forward integration and product range diversification in matrix . There is an opportunity in
our creasing matrix activities for profitable growth by getting closer to box-makers and die-
makers in the packaging and print consumables industry and by producing a wider range of products and moving forward into consumables distribution. This initiative is on track – we have established direct distribution in the UK where we are market leader, we have invested in CCM, a US matrix and consumables business, and in Mito, a consumables distributor in Italy. We have expanded our downstream activities in India, and we have taken control of sales and distribution in the Shanghai region in China. We also have a stream of new die-making and box-making products being launched, some of which are patented. The target for this initiative is to add £7 million of sales and £1 million of EBITDA in the period to FY2020.
Obviously any programme of initiatives, such as those listed above, has risks associated to their achievement. For example, we routinely face the possibility of customer inflicted delays and unforeseen technical difficulties, notwithstanding the management processes we have put in place to avoid or mitigate such issues. Attrition (i.e. customer losses) is also a factor that we have considered and made allowances for, but this allowance could be insufficient. Finally, the most unpredictable and impactful risk is what happens in the global economy. Our working assumptions over the long term are for slow growth (c.2-3% annually) and that current exchange rates remain broadly unchanged. We believe that both these assumptions are reasonable but they may prove to be incorrect, particularly over short periods.
Notwithstanding these risks, we believe we are reasonably on track with the initiatives and moving satisfactorily towards achieving our targets.
Capital Allocation - Looking Ahead The investment pipeline during FY2018 supports our growth objective as can be set out under the same headings as above:
• Customer specific projects - Our bearings business is expected to invest at least £0.3 million during FY2018 in moulding machines dedicated to certain new projects won in the home appliance and automotive sectors over the last twelve months.
• Capacity - We need to continue to add capacity for the underlying general growth that is now
evident at our bearings business. Similarly, our mandrels business will require further capacity, some in the USA, and some in the UK. We also will be adding a new conversion machine for Flexipol to make relatively simple products so freeing up capacity elsewhere for their most specialist product range, which continues to grow. In total about £1.5 million is earmarked for these areas during FY2018.
• New Product Introduction - Further expenditure on tooling and patent fees will most likely be
necessary for Kingpin. Palagan’s new machinery to enable full production of the new products that it has developed will also be received and paid for. New laboratory equipment for the Films division to enable technical product development in barrier films will also be acquired. Altogether approximately £0.7 million is likely to be spent in these two areas during FY2018.
• Corporate - We plan to exercise our option to acquire a further 39% stake in CCM in the near
future for a cost of approximately £1 million and to provide £0.2 million of additional working capital on loan alongside similar funding from CCM’s 51% shareholders to assist the business to expand its geographic reach. There will also be some restructuring of matrix and mandrel manufacturing which may require another £0.2 million of one-off costs. Whilst there are no immediate prospects of acquisitions, given the number of opportunities we are evaluating it would not be surprising if an infill acquisition were executed during the year; however we cannot accurately predict the cost or timing of this. Finally small deferred consideration payments are due for Synpac and Mito, amounting to £0.4 million.
The total capital required, if all these expenditures come through as anticipated, would be approximately £4.3 million. Added to this, in FY2018 we expect a further £1.5 million of replacement and/or efficiency improvement capital expenditure. There other are potential projects in the pipeline and, possibly, some

infill acquisitions which may surface. Following the recent equity issue, which raised circa £3.5 million for the Company, and the suspension of dividend payments discussed below, we now feel that we have sufficient financial flexibility to accommodate expenditure for these contingencies. Dividend After offering a scrip alternative for the last two dividend payments and having indicated that our growth opportunities necessitated a material increase in re-investment, we have decided that it makes sense to suspend dividend payments for at least the next two scheduled payments (representing an approximate cash saving of £1.7 million) and to conserve capital to facilitate expansion and future profit growth. We will review this decision regularly as we move forward. Post year-end fundraising As referred to above, on 26 May we announced that the Company had conditionally raised £3.74 million (£3.54 million, net of expenses) through the placing of 3,194,445 new ordinary shares at 117 pence per share, a discount of 4.5% to the prevailing price. The net proceeds of the Placing, together with the cash saving from the suspension of dividends referred to above, are to be applied primarily towards funding the number of organic growth opportunities outlined above and also in the proposed increase of the Company's stake in CCM. Outlook Trading for FY2018 started marginally below expectations but it is too early in the financial year to read much into this. We remain focussed on implementing the key initiatives outlined above as this will drive the long term growth of the Group and on improving day-to-day operational performance. The momentum of the Group as we finished FY2017 was strong and, if sustained, will deliver a strong performance in FY2018. The Board wishes to extend its sincere thanks to the Group’s employees, who have responded to new challenges extremely well. We continue to be highly profitable and cash generative as a Group. We look forward to another year of good progress in FY2018. Faisal Rahmatallah Chairman
Operational Review 2017
£0002016£000
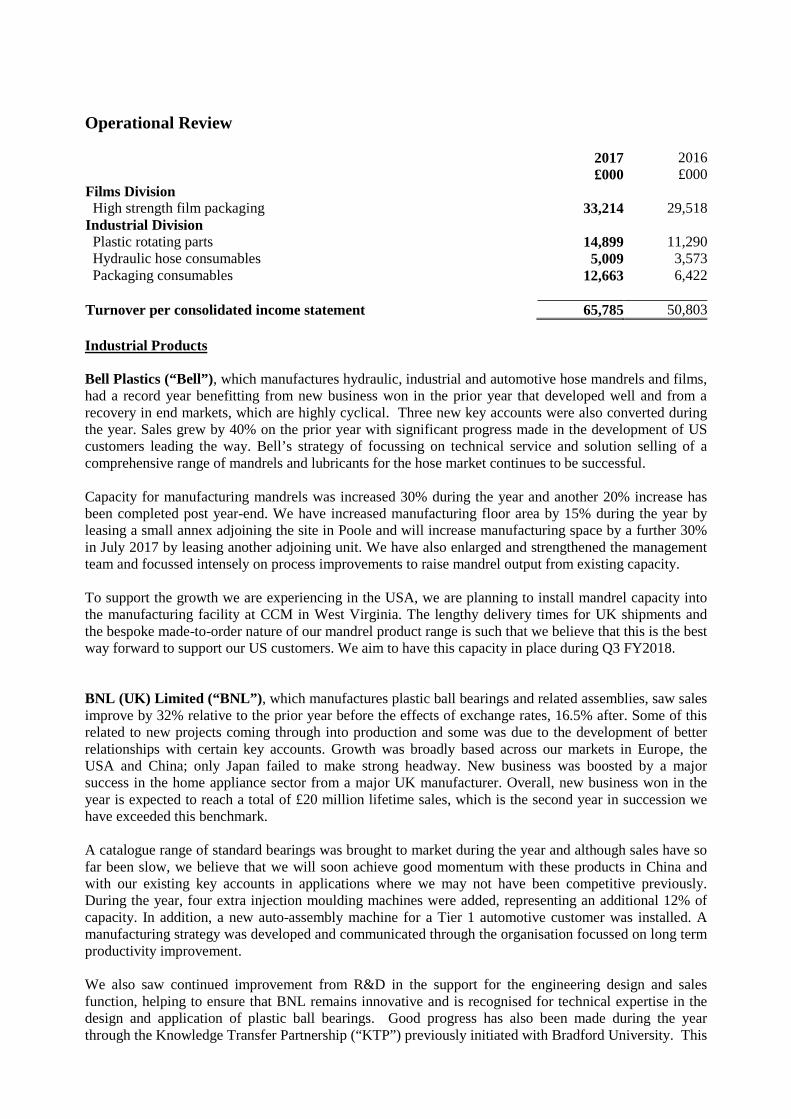
Films Division High strength film packaging 33,214 29,518Industrial Division Plastic rotating parts 14,899 11,290 Hydraulic hose consumables 5,009 3,573 Packaging consumables 12,663 6,422 Turnover per consolidated income statement 65,785 50,803 Industrial Products Bell Plastics (“Bell”), which manufactures hydraulic, industrial and automotive hose mandrels and films, had a record year benefitting from new business won in the prior year that developed well and from a recovery in end markets, which are highly cyclical. Three new key accounts were also converted during the year. Sales grew by 40% on the prior year with significant progress made in the development of US customers leading the way. Bell’s strategy of focussing on technical service and solution selling of a comprehensive range of mandrels and lubricants for the hose market continues to be successful. Capacity for manufacturing mandrels was increased 30% during the year and another 20% increase has been completed post year-end. We have increased manufacturing floor area by 15% during the year by leasing a small annex adjoining the site in Poole and will increase manufacturing space by a further 30% in July 2017 by leasing another adjoining unit. We have also enlarged and strengthened the management team and focussed intensely on process improvements to raise mandrel output from existing capacity. To support the growth we are experiencing in the USA, we are planning to install mandrel capacity into the manufacturing facility at CCM in West Virginia. The lengthy delivery times for UK shipments and the bespoke made-to-order nature of our mandrel product range is such that we believe that this is the best way forward to support our US customers. We aim to have this capacity in place during Q3 FY2018. BNL (UK) Limited (“BNL”) , which manufactures plastic ball bearings and related assemblies, saw sales improve by 32% relative to the prior year before the effects of exchange rates, 16.5% after. Some of this related to new projects coming through into production and some was due to the development of better relationships with certain key accounts. Growth was broadly based across our markets in Europe, the USA and China; only Japan failed to make strong headway. New business was boosted by a major success in the home appliance sector from a major UK manufacturer. Overall, new business won in the year is expected to reach a total of £20 million lifetime sales, which is the second year in succession we have exceeded this benchmark. A catalogue range of standard bearings was brought to market during the year and although sales have so far been slow, we believe that we will soon achieve good momentum with these products in China and with our existing key accounts in applications where we may not have been competitive previously. During the year, four extra injection moulding machines were added, representing an additional 12% of capacity. In addition, a new auto-assembly machine for a Tier 1 automotive customer was installed. A manufacturing strategy was developed and communicated through the organisation focussed on long term productivity improvement. We also saw continued improvement from R&D in the support for the engineering design and sales function, helping to ensure that BNL remains innovative and is recognised for technical expertise in the design and application of plastic ball bearings. Good progress has also been made during the year through the Knowledge Transfer Partnership (“KTP”) previously initiated with Bradford University. This
project will enable us to identify new materials enabling the performance envelope of our ball bearings to broaden. In particular higher loads, faster running speeds and higher temperatures are all aspects of plastic bearings that ideally would become feasible. BNL’s strategy continues to be to focus on major accounts and projects in substantial growing application areas where injection moulded plastic ball bearings have clear value-added advantages. These applications include steering columns, instrument control knobs, dishwashers, CCTV cameras, food conveyor systems and water applications. The new business pipeline at BNL (projects already won but not yet in production or not yet at full production rate) has increased from £4.3 million at the end of FY2016 to £5.0 million at the end of FY2017. This business is expected to flow through over the next three to four years. The pipeline of projects which we are working on to convert remains strong. C&T Matrix (“C&T”) , which manufactures creasing matrix, a consumable used by packaging manufacturers to crease cardboard, in both the UK and in China, had a transformational year. Operationally, after our investments in CCM and Mito, C&T now has activities in the UK, USA, Italy, India and China. Manufacturing of creasing matrix is carried out everywhere except India, whilst sales and distribution of die-making and box-making consumables is carried out in all these locations and in approximately 80 countries around the world through distributors with whom we have long term relationships. We have continued to make excellent progress in the UK with our direct sales strategy, having broken ties with our distributor during the financial year. We have also continued to add other consumables to our range so broadening our customer offering. In Q4 we relocated our Chinese factory from the outskirts of Beijing to Tianjin, about two hours away. This move has gone well and will result in lower costs in due course. We also expect to consolidate US and Italian manufacturing activities to the UK during the course of FY 2018, so reducing costs overall. C&T has two exciting new products coming to the market during FY2018. Both are injection moulded high volume consumables and are designed to save time and cost in the box-making process. Both products are patented and have been successfully tested. We look forward to seeing what the market acceptance is for both. C&T’s future growth will be based on bolt-on acquisitions or investments, the provision of outstanding technical service to box-makers and through broadening the range of die-making and die-cutting consumables made available to end users. Industrial Film Packaging Our Films Division had a mixed year with pro-forma sales up 1.5% and EBITDA unchanged. Strong progress at Flexipol was negated by a disappointing year at Palagan. Synpac, which was acquired during the year, was integrated into Flexipol as the two businesses have overlapping production capabilities and product ranges which can be developed strongly through the Flexipol management team’s guidance. In particular, the businesses together have a much broader range of barrier film capabilities that we believe may be harnessed successfully for future development. Work on synergies between the businesses achieved cost savings for the year attributable to the Divisional structure amounted to approximately £0.4 million. Flexipol Limited (“Flexipol”) had another strong year with revenue up 5.9% as additional extrusion capacity was increased by about a third to enable further growth over the next five years. The growth came mainly from the development of Flexipol’s existing key accounts whilst new accounts were gradually being developed. New types of sacks were introduced at the beginning of the year based on a
new conversion line acquired in FY2016 and, after a few teething problems, were successfully launched to the market. One of the three owner-founders of the business left at the beginning of the year and the management team was restructured and strengthened through internal promotion. The new management team also gradually took responsibility for Synpac after its acquisition in July 2016 and integrated Synpac’s functional activities into Flexipol’s, so that Synpac operates as a profit centre with its own identity, but managed within Flexipol’s structure. Joint development of Flexipol and Synpac’s range of barrier film pouches and sacks is now a focus for the combined teams. Synpac contributed in line with expectations following its acquisition in July 2016; we had estimated sustainable EBITDA at £0.6 million and this was slightly exceeded. We have inherited a well-established and highly knowledgeable team at Synpac, all of whom are enthusiastic to take Synpac forward. The business has an extremely strong reputation for quality and service in its marketplace, and our challenge is to build on this and develop further sales in logical areas given the capabilities at Flexipol that can be brought to bear. A significant amount of groundwork has been done over the last year targeting new accounts with Flexipol’s broadened range of product capabilities and I am pleased to report that this work is bearing fruit. Three new key accounts were converted in the financial year and the pipeline for further key account wins is strong. With the additional capacity and product capabilities now available at Flexipol, we believe the business is very well positioned to maintain the excellent growth rate it has achieved in the past. Palagan Limited (“Palagan”) had a disappointing year. After many years of sales growth and steady EBITDA performance, a combination of factors caused Palagan to falter. These were:
• Four key accounts were lost at the end of the prior financial year and although new business wins during the year will recover the lost volume in due course, it did impact sales negatively during FY2017.
• Wage rates in the Dunstable area, where Palagan is located, increased significantly towards the end of 2015 due to new employers entering the area and we had to recalibrate wage rates during the course of the year to stem staff turnover, which reached unacceptable levels. This increase in costs can be considered structural as it is unlikely that the local employment market will change significantly in the foreseeable future.
• Lower plant utilisation due to customer losses and a less experienced workforce resulted in higher levels of scrap than have been the norm at Palagan. This is something that the management team should be able to improve as the workforce and new production management team settle down.
• A new management structure was introduced during the year incorporating a new Production Director and a new Finance Director and two new positions, a Technical Director and a Business Development Manager. There have been significant one-off and additional costs associated with these changes but it has significantly increased the strength of the team at Palagan. We believe that this investment in people will pay off over the next year or two.
The team at Palagan are now focussed on getting the business back onto a growth trajectory. In particular, they have introduced some new products and restructured their sales process so that the large number of smaller accounts at Palagan are handled by an internal sales team, so freeing up the external salesforce to focus on key accounts and new business. We continue to work on synergies between Flexipol and Palagan; cost synergies have gone well contributing approximately £0.4 million to EBITDA during the year and, although sales synergies have been slow, we did finish the year with conversion of an excellent opportunity with a combined sales value of approximately £0.3 million.
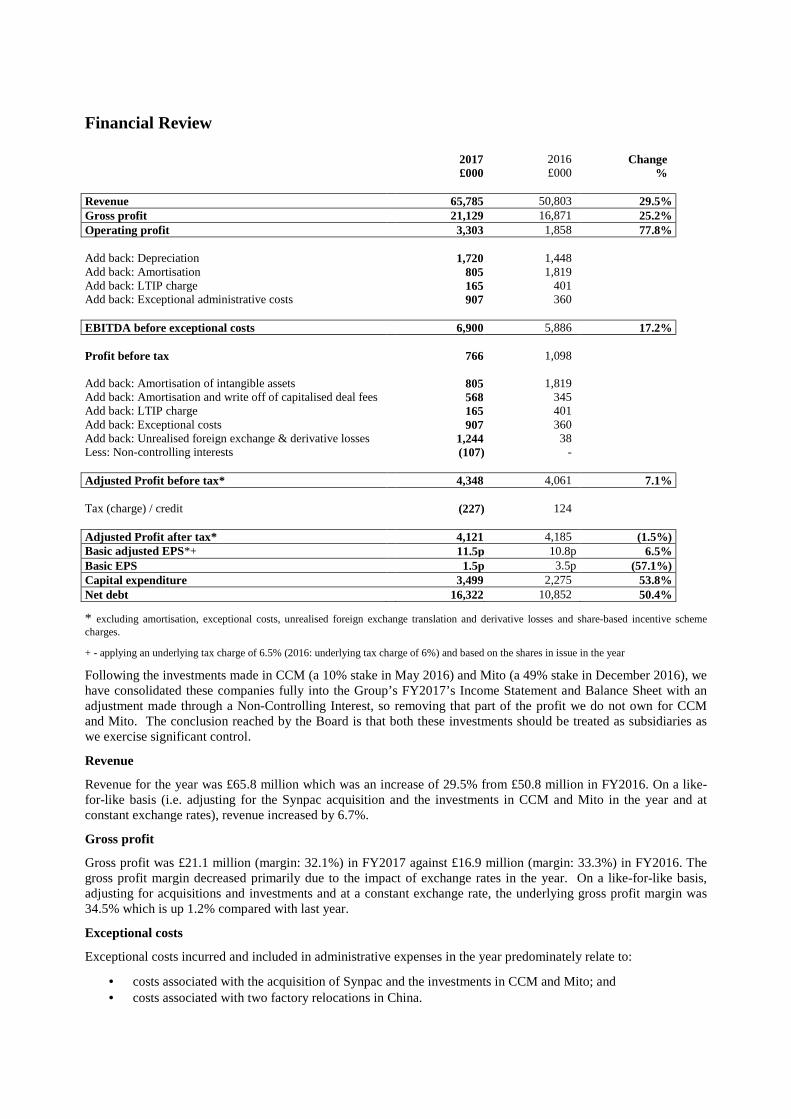
Financial Review 2017 2016 Change £000 £000 % Revenue 65,785 50,803 29.5% Gross profit 21,129 16,871 25.2% Operating profit 3,303 1,858 77.8% Add back: Depreciation 1,720 1,448 Add back: Amortisation 805 1,819 Add back: LTIP charge 165 401 Add back: Exceptional administrative costs 907 360 EBITDA before exceptional costs 6,900 5,886 17.2% Profit before tax 766 1,098 Add back: Amortisation of intangible assets 805 1,819 Add back: Amortisation and write off of capitalised deal fees 568 345 Add back: LTIP charge 165 401 Add back: Exceptional costs 907 360 Add back: Unrealised foreign exchange & derivative losses 1,244 38 Less: Non-controlling interests (107) - Adjusted Profit before tax* 4,348 4,061 7.1% Tax (charge) / credit (227) 124 Adjusted Profit after tax* 4,121 4,185 (1.5%) Basic adjusted EPS*+ 11.5p 10.8p 6.5% Basic EPS 1.5p 3.5p (57.1%) Capital expenditure 3,499 2,275 53.8% Net debt 16,322 10,852 50.4%
* excluding amortisation, exceptional costs, unrealised foreign exchange translation and derivative losses and share-based incentive scheme charges.
+ - applying an underlying tax charge of 6.5% (2016: underlying tax charge of 6%) and based on the shares in issue in the year
Following the investments made in CCM (a 10% stake in May 2016) and Mito (a 49% stake in December 2016), we have consolidated these companies fully into the Group’s FY2017’s Income Statement and Balance Sheet with an adjustment made through a Non-Controlling Interest, so removing that part of the profit we do not own for CCM and Mito. The conclusion reached by the Board is that both these investments should be treated as subsidiaries as we exercise significant control.
Revenue
Revenue for the year was £65.8 million which was an increase of 29.5% from £50.8 million in FY2016. On a like-for-like basis (i.e. adjusting for the Synpac acquisition and the investments in CCM and Mito in the year and at constant exchange rates), revenue increased by 6.7%.
Gross profit
Gross profit was £21.1 million (margin: 32.1%) in FY2017 against £16.9 million (margin: 33.3%) in FY2016. The gross profit margin decreased primarily due to the impact of exchange rates in the year. On a like-for-like basis, adjusting for acquisitions and investments and at a constant exchange rate, the underlying gross profit margin was 34.5% which is up 1.2% compared with last year.
Exceptional costs
Exceptional costs incurred and included in administrative expenses in the year predominately relate to:
• costs associated with the acquisition of Synpac and the investments in CCM and Mito; and • costs associated with two factory relocations in China.
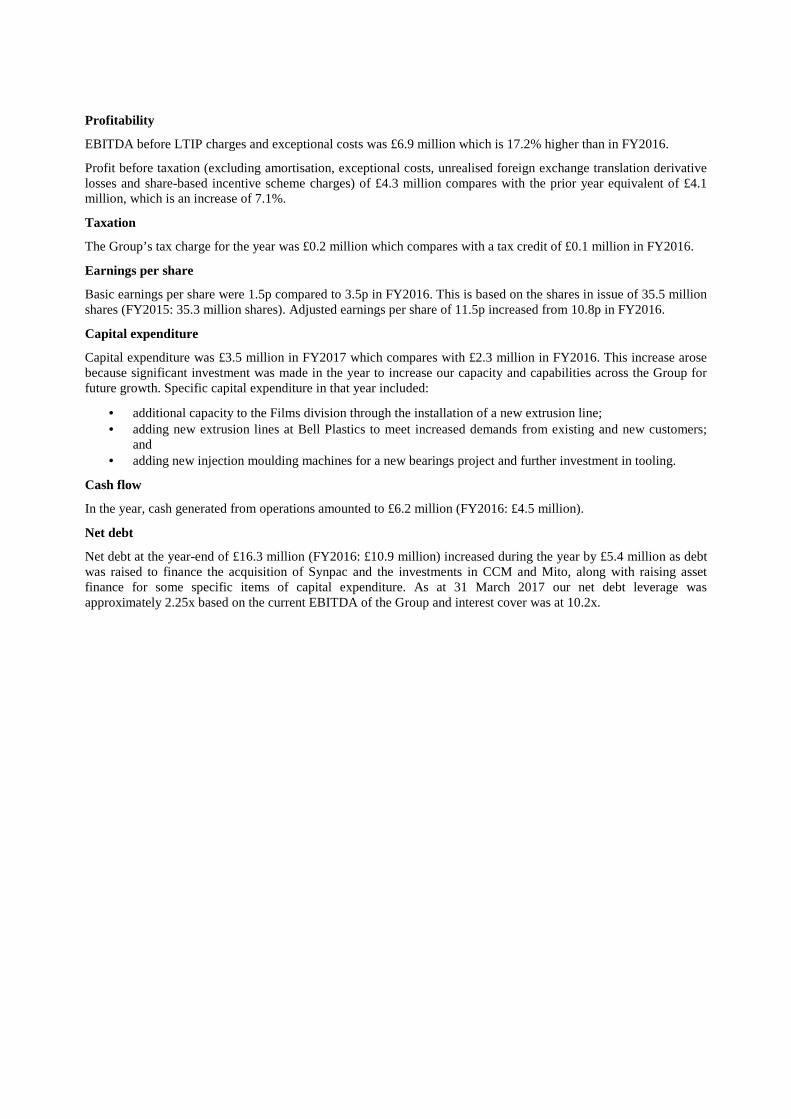
Profitability
EBITDA before LTIP charges and exceptional costs was £6.9 million which is 17.2% higher than in FY2016.
Profit before taxation (excluding amortisation, exceptional costs, unrealised foreign exchange translation derivative losses and share-based incentive scheme charges) of £4.3 million compares with the prior year equivalent of £4.1 million, which is an increase of 7.1%.
Taxation
The Group’s tax charge for the year was £0.2 million which compares with a tax credit of £0.1 million in FY2016.
Earnings per share
Basic earnings per share were 1.5p compared to 3.5p in FY2016. This is based on the shares in issue of 35.5 million shares (FY2015: 35.3 million shares). Adjusted earnings per share of 11.5p increased from 10.8p in FY2016.
Capital expenditure
Capital expenditure was £3.5 million in FY2017 which compares with £2.3 million in FY2016. This increase arose because significant investment was made in the year to increase our capacity and capabilities across the Group for future growth. Specific capital expenditure in that year included:
• additional capacity to the Films division through the installation of a new extrusion line; • adding new extrusion lines at Bell Plastics to meet increased demands from existing and new customers;
and • adding new injection moulding machines for a new bearings project and further investment in tooling.
Cash flow
In the year, cash generated from operations amounted to £6.2 million (FY2016: £4.5 million).
Net debt
Net debt at the year-end of £16.3 million (FY2016: £10.9 million) increased during the year by £5.4 million as debt was raised to finance the acquisition of Synpac and the investments in CCM and Mito, along with raising asset finance for some specific items of capital expenditure. As at 31 March 2017 our net debt leverage was approximately 2.25x based on the current EBITDA of the Group and interest cover was at 10.2x.
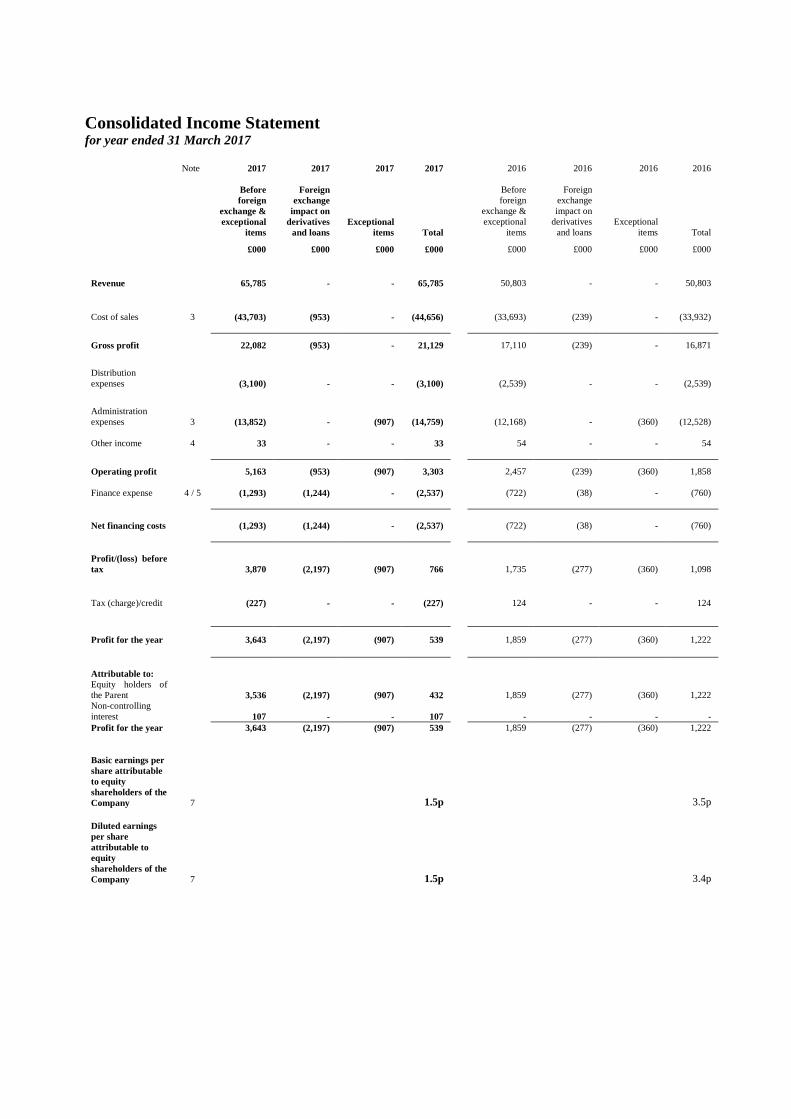
Consolidated Income Statement for year ended 31 March 2017
Note 2017 2017 2017 2017 2016 2016 2016 2016
Before foreign
exchange & exceptional
items
Foreign exchange
impact on derivatives
and loans Exceptional
items Total
Before foreign
exchange & exceptional
items
Foreign exchange impact on
derivatives and loans
Exceptional items Total
£000 £000 £000 £000 £000 £000 £000 £000
Revenue 65,785 - - 65,785 50,803 - - 50,803
Cost of sales 3 (43,703) (953) - (44,656) (33,693) (239) - (33,932)
Gross profit 22,082 (953) - 21,129 17,110 (239) - 16,871
Distribution expenses (3,100) - - (3,100) (2,539) - - (2,539)
Administration expenses 3 (13,852) - (907) (14,759) (12,168) - (360) (12,528) Other income 4 33 - - 33 54 - - 54
Operating profit 5,163 (953) (907) 3,303 2,457 (239) (360) 1,858
Finance expense 4 / 5 (1,293)
(1,244) - (2,537) (722)
(38) - (760)
Net financing costs (1,293)
(1,244) - (2,537) (722)
(38) - (760)
Profit/(loss) before tax 3,870 (2,197) (907) 766 1,735 (277) (360) 1,098
Tax (charge)/credit (227) - - (227) 124 - - 124
Profit for the year 3,643 (2,197) (907) 539 1,859 (277) (360) 1,222 Attributable to: Equity holders of the Parent 3,536
(2,197) (907) 432 1,859
(277) (360) 1,222
Non-controlling interest 107
- - 107 -
- - -
Profit for the year 3,643 (2,197) (907) 539 1,859 (277) (360) 1,222
Basic earnings per share attributable to equity shareholders of the Company 7
1.5p
3.5p Diluted earnings per share attributable to equity shareholders of the Company 7
1.5p
3.4p

Consolidated Statement of Comprehensive Income for year ended 31 March 2017
2017 2016 £000 £000
Profit for the year 539 1,222
Other comprehensive income Items that may be reclassified subsequently to profit or loss:
Foreign currency translation differences for foreign currency operations 607 5
Total comprehensive income 1,146 1,227
Total recognised income and expense for the year is attributable to: Equity holders of the parent 1,039 1,227 Non-controlling interest 107 -
Consolidated Statement of Changes in Shareholders’ Equity for year ended 31 March 2017 Reverse Capital Share Share Translation acquisition redemption Retained capital premium reserve reserve reserve earnings Total £000 £000 £000 £000 £000 £000 £000 Balance at 31 March 2015 353 20,888 634 2,640 (200) 2,034 26,349 Total recognised income and expense for the year - - 5 - - 1,222 1,227 Reserve correction - 63 - - 200 (263) - Dividends paid - - - - - (1,460) (1,460) LTIP charge - - - - - 401 401 Settlement of LTIP 2011 - - - - - (194) (194) Balance at 31 March 2016 353 20,951 639 2,640 - 1,740 26,323 Reverse Total Non- Share Share Translation acquisition Retained parent controlling Total capital premium reserve reserve earnings equity interest equity £000 £000 £000 £000 £000 £000 £000 £000 Balance at 31 March 2016 353 20,951 639 2,640 1,740 26,323 - 26,323 Total recognised income and expense for the year - - 607 - 539 1,146 (107) 1,039 Elimination of non-controlling interest - - - - - - (182) (182) Issue of share capital 4 445 - - (449) - - - Dividends paid - - - - (1,110) (1,110) - (1,110) LTIP charge - - - - 165 165 - 165 Settlement of LTIP 2011 - - - - (394) (394) - (394) Balance at 31 March 2017 357 21,396 1,246 2,640 491 26,130 (289) 25,841
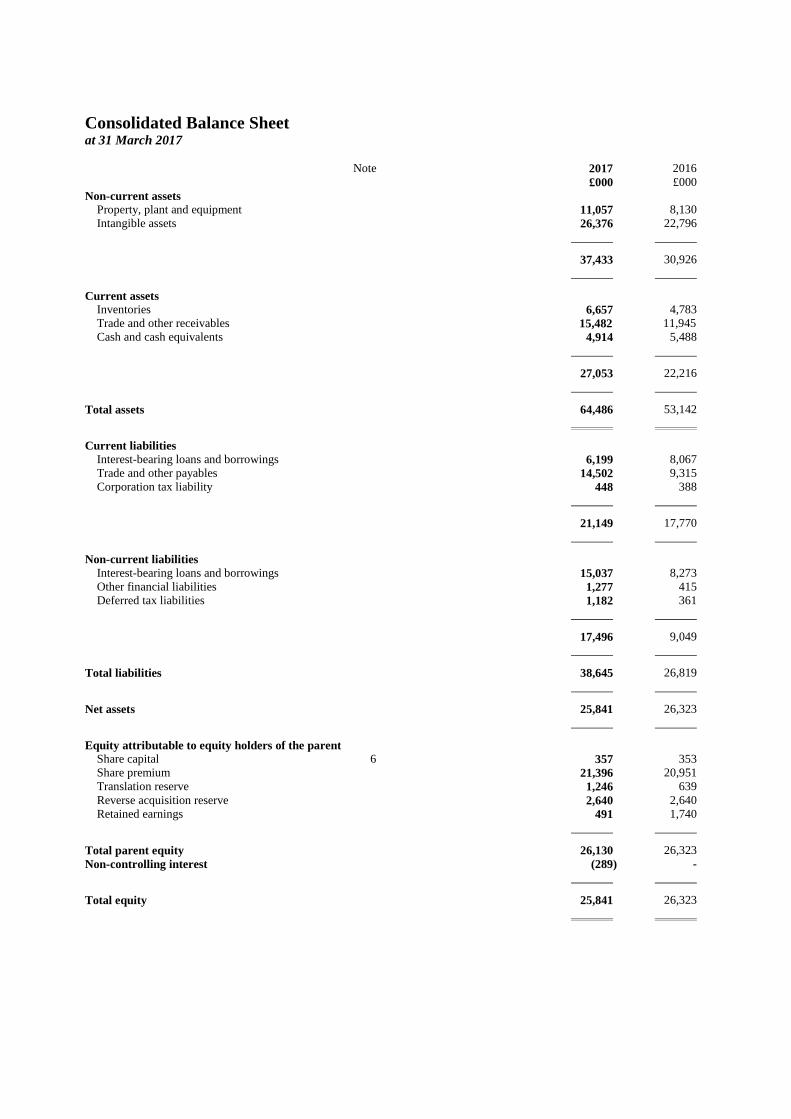
Consolidated Balance Sheet at 31 March 2017
Note 2017 2016 £000 £000
Non-current assets Property, plant and equipment 11,057 8,130 Intangible assets 26,376 22,796
37,433 30,926
Current assets Inventories 6,657 4,783 Trade and other receivables 15,482 11,945 Cash and cash equivalents 4,914 5,488
27,053 22,216
Total assets 64,486 53,142
Current liabilities Interest-bearing loans and borrowings 6,199 8,067 Trade and other payables 14,502 9,315 Corporation tax liability 448 388
21,149 17,770
Non-current liabilities Interest-bearing loans and borrowings 15,037 8,273 Other financial liabilities 1,277 415 Deferred tax liabilities 1,182 361
17,496 9,049
Total liabilities 38,645 26,819
Net assets 25,841 26,323
Equity attributable to equity holders of the parent Share capital 6 357 353 Share premium 21,396 20,951 Translation reserve 1,246 639 Reverse acquisition reserve 2,640 2,640 Retained earnings 491 1,740
Total parent equity 26,130 26,323 Non-controlling interest (289) -
Total equity 25,841 26,323
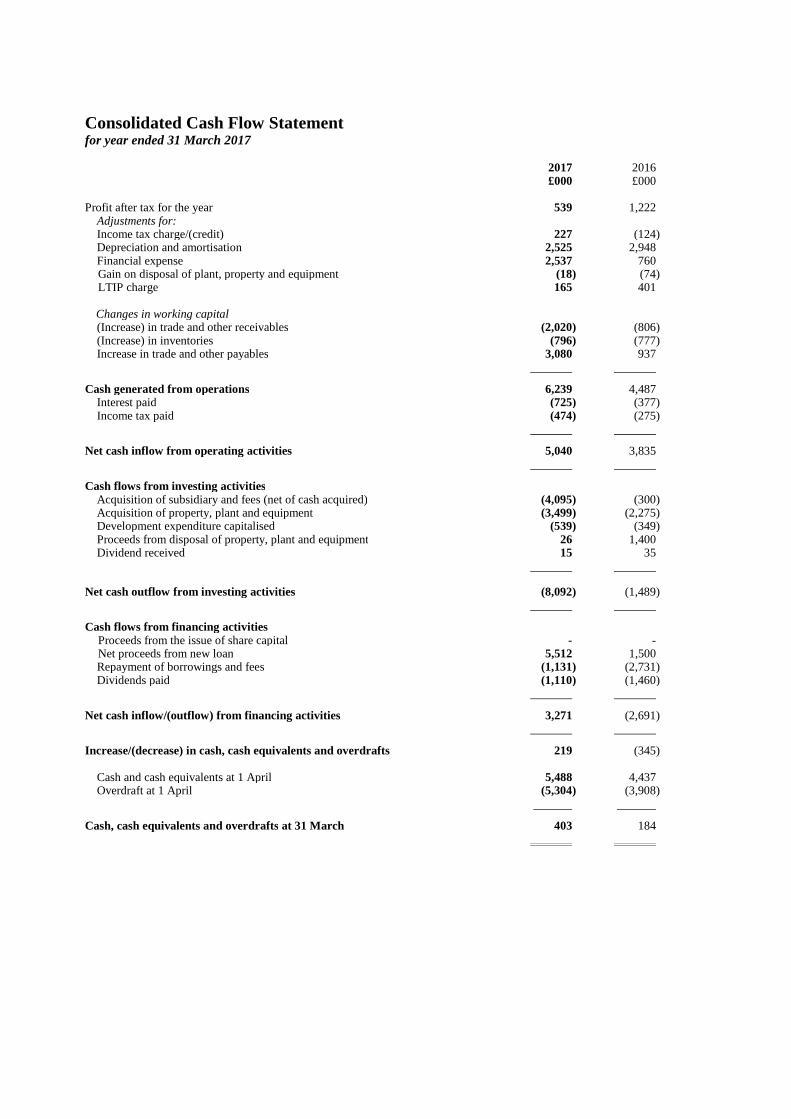
Consolidated Cash Flow Statement for year ended 31 March 2017
2017 2016 £000 £000
Profit after tax for the year 539 1,222 Adjustments for: Income tax charge/(credit) 227 (124) Depreciation and amortisation 2,525 2,948 Financial expense 2,537 760 Gain on disposal of plant, property and equipment (18) (74) LTIP charge 165 401
Changes in working capital (Increase) in trade and other receivables (2,020) (806) (Increase) in inventories (796) (777) Increase in trade and other payables 3,080 937
Cash generated from operations 6,239 4,487 Interest paid (725) (377) Income tax paid (474) (275)
Net cash inflow from operating activities 5,040 3,835
Cash flows from investing activities Acquisition of subsidiary and fees (net of cash acquired) (4,095) (300) Acquisition of property, plant and equipment (3,499) (2,275) Development expenditure capitalised (539) (349) Proceeds from disposal of property, plant and equipment 26 1,400 Dividend received 15 35
Net cash outflow from investing activities (8,092) (1,489)
Cash flows from financing activities Proceeds from the issue of share capital - - Net proceeds from new loan 5,512 1,500 Repayment of borrowings and fees (1,131) (2,731) Dividends paid (1,110) (1,460)
Net cash inflow/(outflow) from financing activities 3,271 (2,691)
Increase/(decrease) in cash, cash equivalents and overdrafts
219 (345)
Cash and cash equivalents at 1 April 5,488 4,437 Overdraft at 1 April (5,304) (3,908)
Cash, cash equivalents and overdrafts at 31 March 403 184
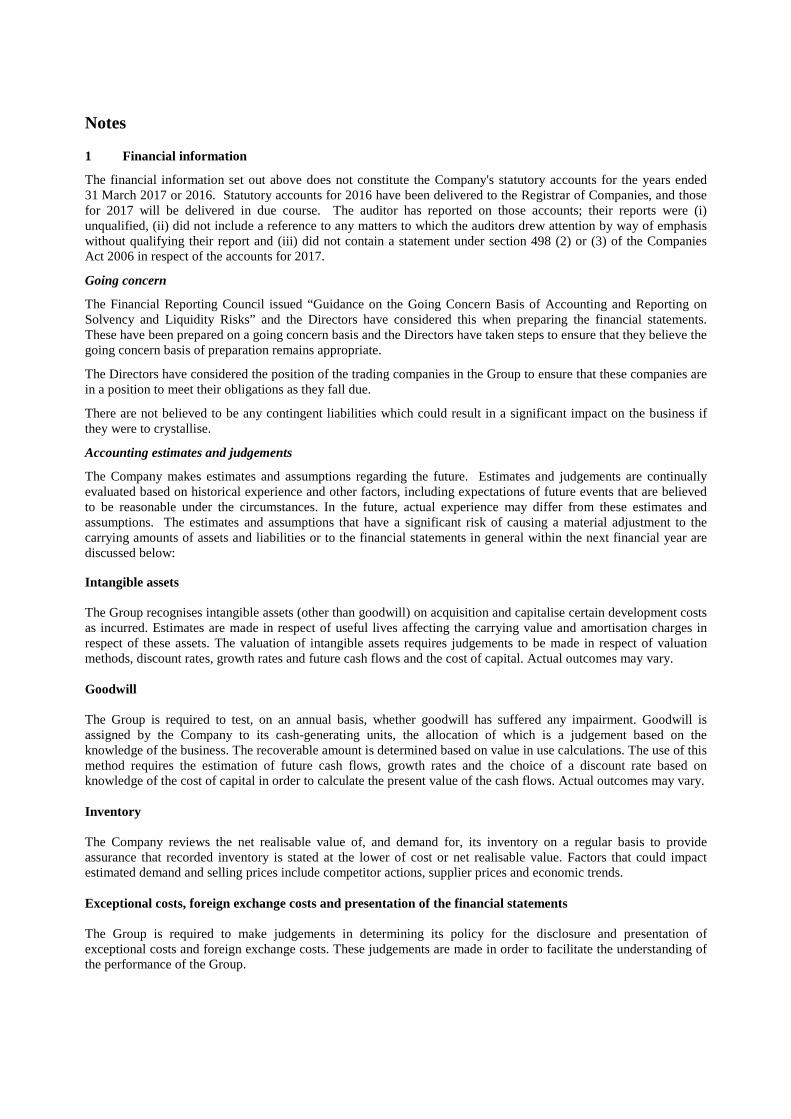
Notes
1 Financial information
The financial information set out above does not constitute the Company's statutory accounts for the years ended 31 March 2017 or 2016. Statutory accounts for 2016 have been delivered to the Registrar of Companies, and those for 2017 will be delivered in due course. The auditor has reported on those accounts; their reports were (i) unqualified, (ii) did not include a reference to any matters to which the auditors drew attention by way of emphasis without qualifying their report and (iii) did not contain a statement under section 498 (2) or (3) of the Companies Act 2006 in respect of the accounts for 2017.
Going concern
The Financial Reporting Council issued “Guidance on the Going Concern Basis of Accounting and Reporting on Solvency and Liquidity Risks” and the Directors have considered this when preparing the financial statements. These have been prepared on a going concern basis and the Directors have taken steps to ensure that they believe the going concern basis of preparation remains appropriate.
The Directors have considered the position of the trading companies in the Group to ensure that these companies are in a position to meet their obligations as they fall due.
There are not believed to be any contingent liabilities which could result in a significant impact on the business if they were to crystallise.
Accounting estimates and judgements
The Company makes estimates and assumptions regarding the future. Estimates and judgements are continually evaluated based on historical experience and other factors, including expectations of future events that are believed to be reasonable under the circumstances. In the future, actual experience may differ from these estimates and assumptions. The estimates and assumptions that have a significant risk of causing a material adjustment to the carrying amounts of assets and liabilities or to the financial statements in general within the next financial year are discussed below: Intangible assets The Group recognises intangible assets (other than goodwill) on acquisition and capitalise certain development costs as incurred. Estimates are made in respect of useful lives affecting the carrying value and amortisation charges in respect of these assets. The valuation of intangible assets requires judgements to be made in respect of valuation methods, discount rates, growth rates and future cash flows and the cost of capital. Actual outcomes may vary. Goodwill The Group is required to test, on an annual basis, whether goodwill has suffered any impairment. Goodwill is assigned by the Company to its cash-generating units, the allocation of which is a judgement based on the knowledge of the business. The recoverable amount is determined based on value in use calculations. The use of this method requires the estimation of future cash flows, growth rates and the choice of a discount rate based on knowledge of the cost of capital in order to calculate the present value of the cash flows. Actual outcomes may vary. Inventory The Company reviews the net realisable value of, and demand for, its inventory on a regular basis to provide assurance that recorded inventory is stated at the lower of cost or net realisable value. Factors that could impact estimated demand and selling prices include competitor actions, supplier prices and economic trends. Exceptional costs, foreign exchange costs and presentation of the financial statements The Group is required to make judgements in determining its policy for the disclosure and presentation of exceptional costs and foreign exchange costs. These judgements are made in order to facilitate the understanding of the performance of the Group.
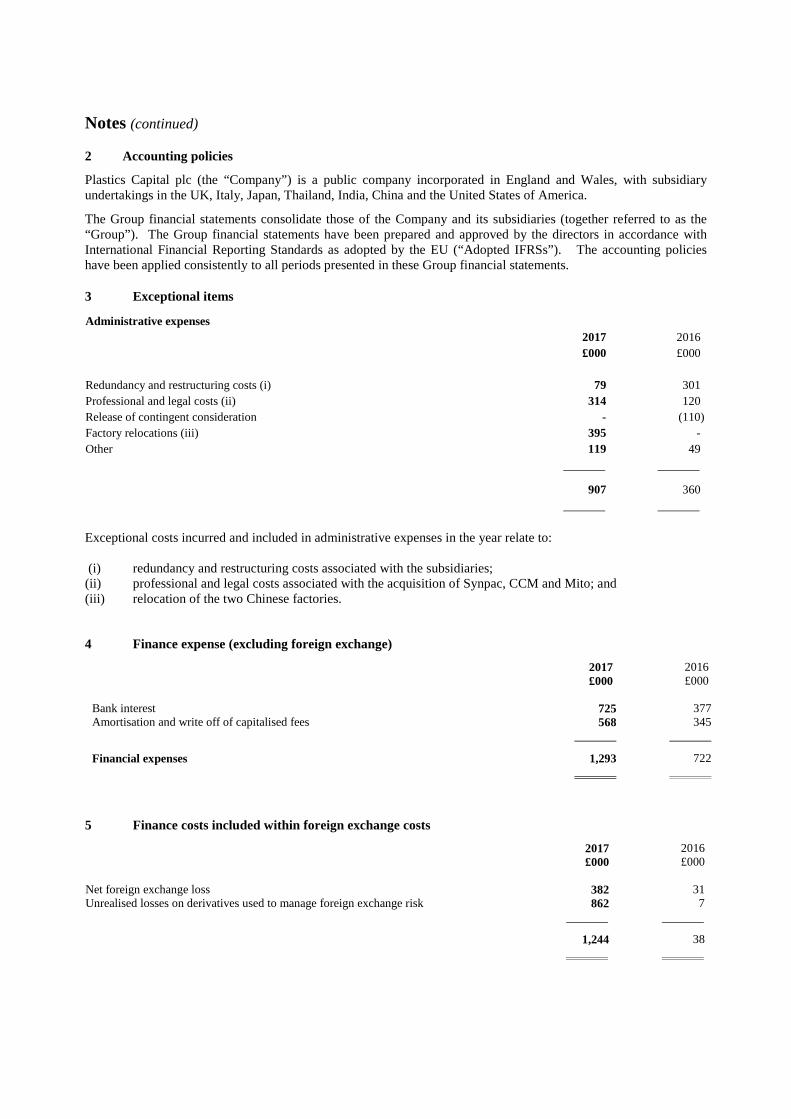
Notes (continued)
2 Accounting policies
Plastics Capital plc (the “Company”) is a public company incorporated in England and Wales, with subsidiary undertakings in the UK, Italy, Japan, Thailand, India, China and the United States of America.
The Group financial statements consolidate those of the Company and its subsidiaries (together referred to as the “Group”). The Group financial statements have been prepared and approved by the directors in accordance with International Financial Reporting Standards as adopted by the EU (“Adopted IFRSs”). The accounting policies have been applied consistently to all periods presented in these Group financial statements.
3 Exceptional items
Administrative expenses 2017 2016 £000 £000 Redundancy and restructuring costs (i) 79 301 Professional and legal costs (ii) 314 120 Release of contingent consideration - (110) Factory relocations (iii) 395 - Other 119 49
907 360
Exceptional costs incurred and included in administrative expenses in the year relate to: (i) redundancy and restructuring costs associated with the subsidiaries; (ii) professional and legal costs associated with the acquisition of Synpac, CCM and Mito; and (iii) relocation of the two Chinese factories.
4 Finance expense (excluding foreign exchange)
2017 2016 £000 £000
Bank interest 725 377 Amortisation and write off of capitalised fees 568 345
Financial expenses 1,293 722
5 Finance costs included within foreign exchange costs
2017 2016 £000 £000
Net foreign exchange loss 382 31 Unrealised losses on derivatives used to manage foreign exchange risk 862 7
1,244 38
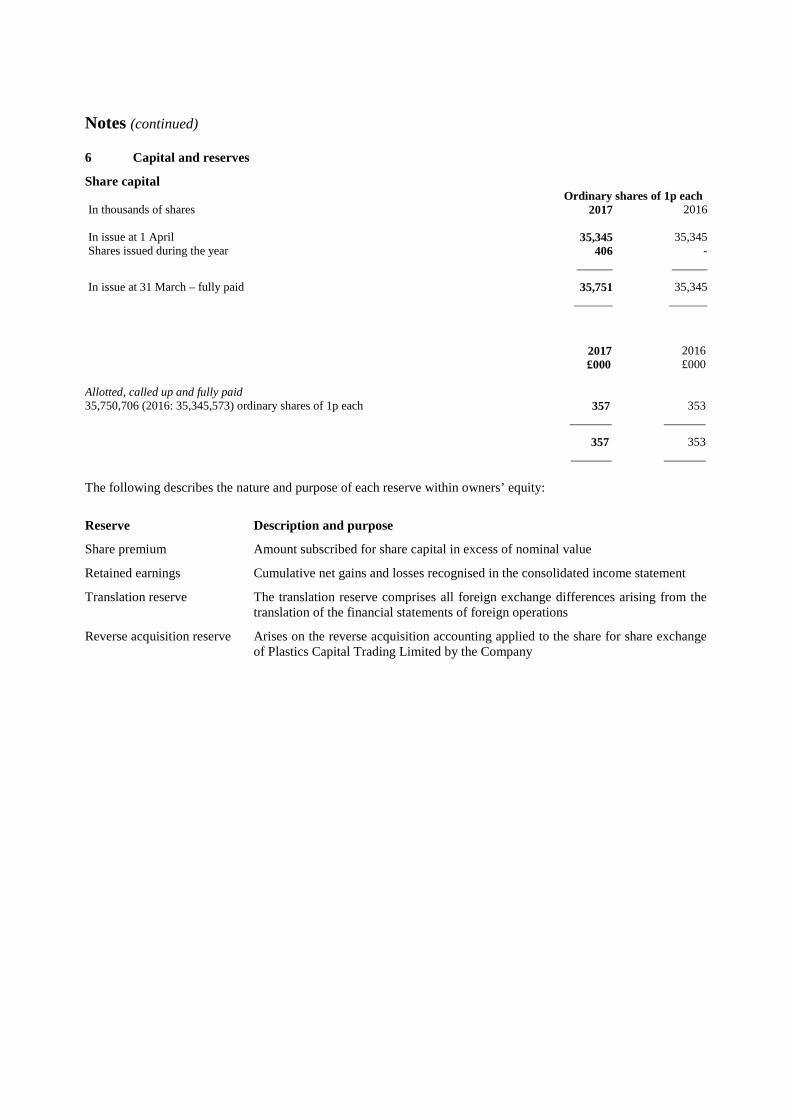
Notes (continued) 6 Capital and reserves
Share capital Ordinary shares of 1p each In thousands of shares 2017 2016 In issue at 1 April 35,345 35,345Shares issued during the year 406 -
In issue at 31 March – fully paid 35,751 35,345
2017 2016 £000 £000 Allotted, called up and fully paid 35,750,706 (2016: 35,345,573) ordinary shares of 1p each 357 353
357 353
The following describes the nature and purpose of each reserve within owners’ equity:
Reserve Description and purpose
Share premium Amount subscribed for share capital in excess of nominal value
Retained earnings Cumulative net gains and losses recognised in the consolidated income statement
Translation reserve The translation reserve comprises all foreign exchange differences arising from the translation of the financial statements of foreign operations
Reverse acquisition reserve Arises on the reverse acquisition accounting applied to the share for share exchange of Plastics Capital Trading Limited by the Company

Notes (continued)
7 Earnings per share 2017 2016 £000 £000
Numerator Earnings used in basic and diluted EPS Profit for the year 539 1,222
Earnings used in adjusted EPS have been based on the adjusted profit before tax as detailed in the Financial Review section on page 10. To this has been applied the actual corporation tax charge to calculate the adjusted profit after tax.
Denominator
Weighted average number of shares used in basic EPS * 34,957,994 34,463,255
Weighted average number of shares used in diluted EPS *+ 36,632,457 36,005,262
* - excludes shares held by Plastics Capital (Trustee) Limited for the LTIP. Treasury shares are not counted under IAS33.
+ - includes effects of share option schemes
8 Annual General Meeting
It is intended that the Annual General Meeting (“AGM”) will take place at Plastics Capital, Room 1.1, London Heliport, Bridges Court Road, London, SW11 3BE at 2.00pm on 1 August 2017. Notice of the AGM will be sent to shareholders with the financial statements.
9 Post Balance Sheet Event
On 26 May 2017, Plastics Capital undertook a Placing to raise £3.74 million, before expenses, by way of a Placing of 3,194,445 new Ordinary Shares at 117 pence per Placing Share. Following Admission of the Placing Shares on 31 May 2017, the total number of ordinary shares in issue was 38,945,151.
The net proceeds of the Placing, which amount to £3.54 million, will be applied, in part, towards the proposed increase of the Company’s stake in the CCM along with investing in other parts of the Group in order to increase capacity to satisfy increasing demand for the Group’s products and thereby accelerate organic growth.