fairfi eld-suisun unifi ed school district -...
TRANSCRIPT

Joel D. MonteroChief Executive Offi cer
JoJoJoJ elelle DDD. MoMoontntterereroooChiCChC ef ExexeExecutttiveiveivev ffiOfficerer
Fairfi eld-Suisun Unifi ed School District
Special Education ReviewOctober 5, 2010


FCMATJoel D. Montero, Chief Executive Officer
1300 17th Street - CITY CENTRE, Bakersfield, CA 93301-4533 . Telephone 661-636-4611 . Fax 661-636-4647422 Petaluma Blvd North, Suite. C, Petaluma, CA 94952 . Telephone: 707-775-2850 . Fax: 707-775-2854 . www.fcmat.org
Administrative Agent: Christine L. Frazier - Office of Kern County Superintendent of Schools
October 5, 2010
Jacki Cottingim-Dias, Ph.D., Superintendent
Fairfi eld Suisun Unifi ed School District
2490 Hilborn Road
Fairfi eld, CA 94534
Dear Superintendent Cottingim-Dias:
In April 2010, the Fairfi eld-Suisun Unifi ed School District entered into an agreement with the Fiscal Crisis and Management Assistance Team (FCMAT) for a special education review. Specifi cally, the agreement states that FCMAT will perform the following:
1. Nonpublic schoolsA. Review the process and procedures for placing students in nonpublic schools.B. Compare percentage of students enrolled in nonpublic schools from Fairfi eld-Suisun to
other districts within the SELPA and region and make recommendations for alternative district programs. Consider the impact of licensed care institutions as well as board and care facilities.
C. Review and make recommendations regarding the cost effi ciency of nonpublic school placements vs. district alternative programs.
2. Nonpublic agencies and contract servicesA. Review the process and procedure for providing students with nonpublic agency services.B. Provide cost comparison of contracting for speech therapist services or fully staffi ng
district speech therapist position.C. Compare the district’s speech therapist salary schedule to regional and SELPA salary
schedules. Make recommendations to address the ongoing decreases in direct-hired speech language programs and the increasing number of contracted therapists.
3. Review the special education transportation system for effi ciency and effectiveness, and determine any cost savings.
4. Determine if it would be cost-effective for the district to operate additional special education programs for severely handicapped students rather than contracting with the COE. Review the facility, staffi ng, transportation, and other operational areas for transfer feasibility.

5. Review the overall special education delivery system to determine if effi ciencies can be implemented. Conduct a comparison of the district’s special education local contribution on the general fund to other school districts within the SELPA.A. Identify programmatic weaknesses and gaps in service and make recommendations
to address these areas.6. Conduct a review of special education staffi ng ratios including administrative,
certifi cated, and classifi ed in each program and compare to districts within the SELPA and region and make recommendations if needed for improved operational effi ciency and cost effectiveness. A. Review multifunded positions budgeted within the special education department
and make recommendations regarding criteria that should be used to determine which positions should be multifunded (if any).
7. Review due process, compliance complaints, corrective actions ordered and make recommendations to improve effi cacy in managing these issues.
8. Evaluate the district’s fee-for-service process to regional districts for services provided and determine if the process is capturing all expenditures and that billing to regional districts refl ects actual cost.
9. Review the impact of licensed care institutions (LCI), such as foster homes, foster family agency homes, adult care facilities, group homes and their impact on the district.
This report contains the study team’s fi ndings and recommendations. It has been a pleasure to serve you, and please give our regards to all the employees of the Fairfi eld-Suisun Unifi ed School District.
Sincerely,
Joel D. MonteroChief Executive Offi cer

FAIRFIELD-SUISUN UNIFIED SCHOOL DISTRICT
vT A B L E O F C O N T E N T S
Table of ContentsForeword ......................................................................................................... vii
Introduction ..................................................................................................... 1
Executive Summary ....................................................................................... 5
Nonpublic Schools......................................................................................... 9
Nonpublic Agencies and Contract Services ........................................ 17
Transportation Effi ciency and Eff ectiveness ....................................... 27
Cost Eff ectiveness of County and District Operated Services ....... 33
Effi ciencies for Overall Delivery System ............................................... 37
Program Development .............................................................................. 39
Comparison of Local Contribution with Other Districts ................. 41
Staffi ng Ratios/Administrative Structures ............................................ 43
Multifunded Positions ................................................................................ 49
Due Process .................................................................................................... 51
Fee-for-Service Process .............................................................................. 53
Licensed Care Institutions ......................................................................... 55
Appendices .................................................................................................... 57

FISCAL CRISIS & MANAGEMENT ASSISTANCE TEAM
vi T A B L E O F C O N T E N T S

FAIRFIELD-SUISUN UNIFIED SCHOOL DISTRICT
viiF O R E W O R D
92/93 93/94 94/95 95/96 96/97 97/98 98/99 99/00 00/01 01/02 02/03 03/04 04/05 05/06 06/07 07/08 08/09 09/10
Projected
80
70
60
50
40
30
20
10
0
Study Agreements by Fiscal Year
Nu
mb
er o
f Stu
die
sForeword - FCMAT BackgroundThe Fiscal Crisis and Management Assistance Team (FCMAT) was created by legislation in accordance with Assembly Bill 1200 in 1992 as a service to assist local educational agencies (LEAs) in complying with fi scal accountability standards.
AB 1200 was established from a need to ensure that LEAs throughout California were adequately prepared to meet and sustain their fi nancial obligations. AB 1200 is also a statewide plan for county offi ces of education and school districts to work together on a local level to improve fi scal procedures and accountability standards. The legislation expanded the role of the county offi ce in monitoring school districts under certain fi scal constraints to ensure these districts could meet their fi nancial commitments on a multiyear basis. AB 2756 provides specifi c responsibilities to FCMAT with regard to districts that have received emergency state loans. These include compre-hensive assessments in fi ve major operational areas and periodic reports that identify the district’s progress on the improvement plans.
In January 2006, SB 430 (charter schools) and AB 1366 (community colleges) became law and expanded FCMAT’s services to those types of LEAs.
Since 1992, FCMAT has been engaged to perform nearly 750 reviews for local educational agencies, including school districts, county offi ces of education, charter schools and community colleges. Services range from fi scal crisis intervention to management review and assistance. FCMAT also provides professional development training. The Kern County Superintendent of Schools is the administrative agent for FCMAT. The agency is guided under the leadership of Joel D. Montero, Chief Executive Offi cer, with funding derived through appropriations in the state budget and a modest fee schedule for charges to requesting agencies.
Total Number of Studies 743Total Number of Districts in CA 1,050
Management Assistance 705 (94.886%)Fiscal Crisis/Emergency 38 (5.114%)
Note: Some districts had multiple studies.
Eight districts have received emergency loans from the state.
(Rev. 12/8/09)

FISCAL CRISIS & MANAGEMENT ASSISTANCE TEAM

FAIRFIELD-SUISUN UNIFIED SCHOOL DISTRICT
1I N T R O D U C T I O N
IntroductionBackgroundThe Fairfi eld-Suisun Unifi ed School District is located in northern California between San Francisco and Sacramento. With an enrollment of 22,496 (K-12), the district is composed of 31 schools including fi ve high schools, fi ve middle schools 20 elementary schools.
The district serves 9.3% of its K-12 student population in special education, and the statewide average for K-12 special education population is 10%. The projected budget for special educa-tion is $21,698,685 with a general fund contribution of $1,799,598. The costs for special educa-tion have increased 14% over the past three years.
In April 2010, the district requested that FCMAT review the district’s special education programs and services. The study agreement specifi es that FCMAT will perform the following:
1. Nonpublic schoolsA. Review the process and procedures for placing students in nonpublic schools.B. Compare percentage of students enrolled in nonpublic schools from Fairfi eld-Suisun
to other districts within the SELPA and region and make recommendations for alternative district programs. Consider the impact of licensed care institutions as well as board and care facilities.
C. Review and make recommendations regarding the cost effi ciency of nonpublic school placements vs. district alternative programs.
2. Nonpublic agencies and contract servicesA. Review the process and procedure for providing students with nonpublic agency
services.B. Provide cost comparison of contracting for speech therapist services or fully staffi ng
district speech therapist position.C. Compare the district’s speech therapist salary schedule to regional and SELPA salary
schedules. Make recommendations to address the ongoing decreases in direct-hired speech language programs and the increasing number of contracted therapists.
3. Review the special education transportation system for effi ciency and effectiveness, and determine any cost savings.
4. Determine if it would be cost-effective for the district to operate additional special education programs for severely handicapped students rather than contracting with the COE. Review the facility, staffi ng, transportation, and other operational areas for transfer feasibility.
5. Review the overall special education delivery system to determine if effi ciencies can be implemented. Conduct a comparison of the district’s special education local contribution on the general fund to other school districts within the SELPA.A. Identify programmatic weaknesses and gaps in service and make recommendations
to address these areas.

FISCAL CRISIS & MANAGEMENT ASSISTANCE TEAM
2 I N T R O D U C T I O N
6. Conduct a review of special education staffi ng ratios including administrative, certifi cated, and classifi ed in each program and compare to districts within the SELPA and region and make recommendations if needed for improved operational effi ciency and cost effectiveness. A. Review multifunded positions budgeted within the special education department
and make recommendations regarding criteria that should be used to determine which positions should be multifunded (if any).
7. Review due process, compliance complaints, corrective actions ordered and make recommendations to improve effi cacy in managing these issues.
8. Evaluate the district’s fee-for-service process to regional districts for services provided and determine if the process is capturing all expenditures and that billing to regional districts refl ects actual cost.
9. Review the impact of licensed care institutions (LCI), such as foster homes, foster family agency homes, adult care facilities, group homes and their impact on the district.
Study GuidelinesFCMAT visited the district February 25-26, 2010 to conduct interviews of county offi ce and district staff members and parents, collect data and review documents. This report is the result of those activities and is divided into the following sections:
I. Executive SummaryII. Nonpublic Schools
III. Nonpublic Agencies and Contract Services IV. Transportation Effi ciency and Effectiveness V. Cost Effectiveness of County & District Operated Programs
VI. Effi ciencies for Overall Delivery System VII. Program DevelopmentVIII. Comparison of Local Contribution with Other DistrictsIX. Staffi ng Ratios/ Administrative Structures X. Multifunded Positions
XI. Due Process XII. Fee-For-Service Process XIII. Licensed Care Institutions XIV. Appendices

FAIRFIELD-SUISUN UNIFIED SCHOOL DISTRICT
3I N T R O D U C T I O N
Study TeamThe study team was composed of the following members:
William P. Gillaspie, Ed.D JoAnn MurphyFCMAT Chief Management Analyst FCMAT ConsultantSacramento, CA Santee, CA Leonel Martinez Tim Purvis*FCMAT Public Information Specialist Director, TransportationBakersfi eld, CA Poway Unifi ed School District Poway, CA Anne Stone FCMAT Consultant Mike Rea*Mission Viejo, CA Executive Director West County Transportation AgencyTrina Frazier* Santa Rosa, CAAdministrator Fresno County SELPAMadera, CA
*As members of this study team, these consultants were not representing their employers but were working solely as independent contractors for FCMAT.

FISCAL CRISIS & MANAGEMENT ASSISTANCE TEAM
4 I N T R O D U C T I O N

FAIRFIELD-SUISUN UNIFIED SCHOOL DISTRICT
5E X E C U T I V E S U M M A R Y
Executive SummaryThe Fairfi eld-Suisun Unifi ed School District has a strong professional relationship with the Solano County Offi ce of Education and the Solano County SELPA. The SELPA provides direct services to the district. The district is satisfi ed with the county offi ce program delivery system and has no immediate plans to pursue a transfer of programs from the county offi ce to the district.
Although the district’s total expenditures projected for the 2010-11 fi scal year have decreased, the percentage of special education local contribution on the unrestricted general fund has increased. The percentage of local contribution for the 2009-10 fi scal year was 47.14%, and the percentage for the 2010-11 fi scal year is 54.38%.
District students comprise 46 percent of those served by the SELPA; however, they comprise 60 percent of the nonpublic school placements within the SELPA. Although the Special Education Local Plan Area (SELPA) offsets the costs for nonpublic school placements with out-of-home-care funds, total costs exceed revenue; therefore, all districts are required to contribute to excess costs to fund the program. This is one of the factors causing increased local contribution on the district’s general fund. The district is developing an alternative program (Successful Individuals Generating Maximum Achievement) that will create another level of student support before considering placements out of the district in a nonpublic school setting. The transportation cost for NPS students is generally lower than the district cost to transport these students; therefore, initiating this program will not necessarily reduce transportation costs.
Because of the signifi cant shortage of speech therapists in California, districts are forced to hire contract staff to provide mandated services. The district contracts with fi ve nonpublic agencies for more than 60% of its speech therapy services. In the 2010-11 fi scal year, the cost of hiring contract staff members instead of district personnel is projected to be $274,836. The district has developed a proposal to reduce the number of contract speech therapists, and FCMAT has made additional recommendations to that plan that are contained in the report.
At fi rst, the district’s home-to-school and special-education transportation costs appear to be unusually low. The district reported 24 special education bus routes on its 2008-09 TRAN report and costs of only $147,108. Most special education operations cost approximately$50,000 to $60,000 per route. However, the district’s seemingly low fi gure occurred because costs were not appropriately separated. The district’s actual special education transportation costs are relatively reasonable compared to other districts that FCMAT has observed.
The Solano County Offi ce of Education (SCOE) provides some transportation service for students that attend programs outside the district. The cost for this service is approximately double the district’s cost, but the county offi ce transports students who require the most intensive support and those who live the farthest from their academic programs.
Most district bell times are relatively close together. Separating these times could enhance special education bus route effi ciency and cost-effectiveness. Wednesdays are an early dismissal day for all but a few schools in the district, which creates additional transportation costs. These costs would be eliminated if all schools dismissed students at approximately the same time.
All the objective and measurable criteria for a school transportation department indicate that the district complies with all laws and regulations relative to vehicle maintenance, federal drug and alcohol testing, and driver training requirements.

FISCAL CRISIS & MANAGEMENT ASSISTANCE TEAM
6 E X E C U T I V E S U M M A R Y
Bus driver recruitment should be a priority since several bus routes are left without drivers every day, resulting in students who are late to school or home. One mechanic position is vacant and should be fi lled as soon as possible. The district should hire one full-time clerical support person to perform clerical duties in the shop and Operations Department. At present, the mechanics and shop supervisor spend a great deal of time performing clerical work, and additional clerical support would allow them to devote more time to mechanical tasks.
Although the district has no intention of pursuing a transfer of special education programs from the county offi ce, information on this option was requested for reference purposes. FCMAT found that such a transfer would not be feasible under current program conditions. Under the SELPA plan, the district is responsible for 46.54% of the fi nal cost of county offi ce programs. This percentage is based on the total percentage of district students, not the actual number or percentage of districts students attending county offi ce programs. If the district assumed responsibility for 23 special education programs, it would still be required to provide the average daily attendance (ADA) percentage of the fi nal program costs. Serving an additional 217 students would also require a staffi ng increase. The district and SELPA indicated that they are satisfi ed with the quality of programs offered by county offi ce and indicated that costs are reasonable.
The district has a strong collaborative relationship with the Solano County SELPA to provide disabled students with a wide range of options in district and regional programs. Recommendations have been made to achieve greater effi ciency in service delivery regarding the referral system for regional programs, staff training and behavioral supports in classrooms.
The district has a comprehensive range of program options and has identifi ed the areas of expan-sion needed for autistic and emotionally disturbed students at the secondary level. FCMAT supports those recommendations based on its review and observations of the program.
FCMAT completed a comprehensive analysis of the staffi ng ratios of certifi cated and classifi ed staff in special education programs. In addition, the administrative structure of the Special Education Department was compared to other districts of similar size. The district should increase support for students through the behavioral support team and increase program admin-istration to align the district special education administration with districts of comparable size. The latter is necessary to allow for greater department emphasis on program development and participation in district program improvement efforts.
The clerical staffi ng of the Special Education Department was also reviewed and found to be aligned with comparable districts. However, greater effi ciency can be achieved through workfl ow redistribution in the offi ce and other departments.
The regional fee-for-service process was reviewed, and FCMAT found that the district has not billed the county offi ce the full amount possible for specialized services such as speech therapy, occupational therapy, vision, orientation and mobility or behavior in regional programs. The district has a computerized system that can generate reports to ensure accuracy of billing in the future. With greater accuracy, the district would realize increased revenue of $157,766 annually.

FAIRFIELD-SUISUN UNIFIED SCHOOL DISTRICT
7E X E C U T I V E S U M M A R Y
The district has a high proportion of licensed care institutions within its boundaries (LCI) compared to other SELPA districts, and this creates factors and costs that are beyond the district’s control. Frequent monitoring of LCI placements is necessary along with program planning on how to deal with excess costs.

FISCAL CRISIS & MANAGEMENT ASSISTANCE TEAM
8 E X E C U T I V E S U M M A R Y

FAIRFIELD-SUISUN UNIFIED SCHOOL DISTRICT
9N O N P U B L I C S C H O O L S
Findings and RecommendationsNonpublic Schools
Process and Procedures for PlacementNinety Fairfi eld-Suisun Unifi ed School District students are in nonpublic school (NPS) place-ments, a high number for a district of this size. The Solano County Special Education Local Plan Area (SELPA) negotiates NPS rates with agencies, provides the master contract and invoices all districts in the SELPA. The SELPA expends approximately $700,000 in out-of-home-care funds to offset the costs of NPS placements. Because total NPS costs exceed the amount of out-of-home-care funds, all member districts have a contribution for excess costs. These costs may increase for the 2010-11 fi scal year if the Level 14 Licensed Children’s Institution (LCI) closes. LCIs are residential facilities licensed by the state to provide nonmedical care to children, including those with exceptional needs. Level 14 LCIs generate the highest per-pupil rate of out-of-home-care funds, which is based on bed count.
Staff members indicated that students who enter the district with NPS included on their Individualized Education Programs (IEPs) are usually placed in an NPS. The district has an infl ux of students from other areas of the state who have NPS placements. This includes some from the various parts of the Bay Area, which also have a high number of these students. The district should carefully review the information on each incoming (transferring) student with an NPS placement to determine whether the student can be served in a district or a county-offi ce operated program prior to placement in an NPS. The decision to place the student in an NPS program is sometimes made because of a lack of similar program options.
Students are designated as requiring an NPS placement for various reasons. In some cases, another county made the determination to place the student in a particular program. When the student moves to another county, the accepting district should review the student’s individual needs and determine where they can best be met. When students enter the district with NPS on their IEPs, the district is faced with factors beyond its control. Some of these students are homeless and have the protections of AB490, which allows the student to remain in a current placement until the end of the school year.
The Special Education Department’s program specialists spend a signifi cant amount of time managing NPS placements. Because these placements are in such a restrictive setting, student needs are usually more severe, which requires in-depth oversight and monitoring. Program specialists attend IEPs for NPS placements, sometimes three to fi ve times per week.
The Special Education Department uses a District Level Intervention Committee to place students in nonpublic schools, which has helped reduce the number of students in this setting. This committee provides site IEP teams with support and recommendations for students strug-gling in their placements. Most of the students referred require more intensive behavioral and social/emotional interventions. Committee recommendations can include further interventions at the site, alternative placement options or agency referrals.
The district and SELPA are integrating the district’s intervention committee and the SELPA referral process in 2010-11. Referrals from the district to county offi ce SH classes as well as nonpublic schools are already a direct referral process that does not involve the Solano SELPA unless assistance is requested on a case-by-case basis.

FISCAL CRISIS & MANAGEMENT ASSISTANCE TEAM
10 N O N P U B L I C S C H O O L S
The intervention committee meets once per month, and participants may include a site psychologist, special education administrator, behaviorist and site administrator or director. The committee usually reviews several referrals for NPS consideration on a designated day each month. The presenters include the site psychologist, site administrator and any other profes-sional the site invites. A specifi c referral packet and process is used, and the meeting calendar is developed at the beginning of the school year. Fairfi eld-Suisun Unifi ed is the only district in the SELPA that uses the intervention committee, and this process has been effective.
The intervention committee has tracked the number of referrals and placements in nonpublic schools. The following table shows data on these placements.
Referral and Nonpublic School Placements at Fairfi eld-Suisun Unifi edYear Number of Referrals Number of NPS Placements
2007-08 20 5
2008-09 29 6
2009-10 52 17
The Special Education Department does not offer intensive training to prepare teachers and instructional aides for serving NPS students entering the district with that designation on their IEPs. If this training was provided, some of these students could be served in existing district programs. The district hired a few teachers who previously worked for an NPS, and these teachers can serve some students with an NPS designation in their classrooms because they have the necessary training. Expanded training for more general education teachers would need to focus on the behavioral, social and emotional needs of students and how to work with students with specifi c behaviors. Teachers who serve this population should also be trained in Nonviolent Crisis Intervention (NCI) or a similar program.
RecommendationsThe district should:
1. Continue the process in which the SELPA provides the master contract and negoti-ates NPS rates.
2. Continue to use the intervention committee before consideration of an NPS place-ment.
3. Continue to collect from the intervention committee data that is useful to the department.
4. Determine whether the district can serve incoming students with an NPS designa-tion before considering the most restrictive environment.
5. Provide teachers and instructional aides with extensive behavioral, emotional and social training so they are equipped to serve students with these types of issues.
Percentage of Students Enrolled in Nonpublic SchoolsDistrict students make up 46 percent of those served by the SELPA, but 60 percent of those in nonpublic school placements, according to district data dated January 10, 2010. The following table compares Fairfi eld-Suisun Unifi ed to the other SELPA districts, including the percentage of NPS placements for each district and the percentage of ADA each district makes up of the

FAIRFIELD-SUISUN UNIFIED SCHOOL DISTRICT
11N O N P U B L I C S C H O O L S
SELPA. The district is faced with circumstances that are beyond its control, especially the number of incoming students with an NPS designation on their IEP.
Percentage of Students Enrolled in Nonpublic SchoolsDistrict % of NPS Placements % of ADA
in the SELPA
Benicia Unifi ed 1.10 10.09
Dixon Unifi ed 5.75 7.83
Fairfi eld-Suisun Unifi ed 59.80 46.54
Travis Unifi ed 7.14 10.65
Vacaville Unifi ed 26.21 24.89
Alternate District Programs - The district developed an alternative program called Successful Individuals Generating Maximum Achievement (SIGMA), which will create another level of support before consideration of an NPS placement. The Special Education Department indicated that adding this alternative program will increase the number of least-restrictive environment (LRE) placements offered by the district. An NPS placement is one of the most restrictive options available.
Individuals with Disability Education Act (IDEA) funds under the American Recovery and Reinvestment Act (ARRA) of 2009 will be used for the program’s start-up costs. The district has a detailed proposal for the fi rst through third year of the program. The district anticipates that when ARRA IDEA funds are expended in September 2011, the reduction in the number of NPS placements will demonstrate the cost effectiveness of the program and sustain the program in the following years.
The district’s proposal for the SIGMA program includes a description, background and outlook, staffi ng ratios/descriptions, transportation, entrance criteria, a referral process, parent involve-ment, exit criteria, expected outcomes and costs. The fi rst high school SIGMA class will begin at full capacity with 10 to 12 students in approximately July 2010. If the program is successful and cost-effi cient, the district plans to expand it.
The SELPA is developing a program called the Dynamic Education Linked to Achievement (DELTA), a nondiploma track program for students with moderate to severe cognitive disabilities and serious behavior challenges that interfere with learning. For students who meet the criteria, the district will have an additional program placement option that meets LRE, and will be avail-able before considering an NPS placement.
Another option before NPS placement is the SELPA’s Program for Effective Relationships and Learning (PERL) for students with social and emotional defi cits. These programs provide struc-tured, therapeutic and behavioral interventions to students in a self-contained classroom. The programs also provide students at several grade levels with services and supports that will enable them to succeed in the least-restrictive educational environment. The academic instruction is standards-based, but diversifi ed and fl exible.
RecommendationsThe district should:
1. Continue to pursue appropriate program options that are less restrictive than NPS placements such as the SIGMA program if it is proven to be cost effi cient.
2. Closely monitor the SIGMA program to ensure cost effectiveness that leads to sustainability.
FISCAL CRISIS & MANAGEMENT ASSISTANCE TEAM
12 N O N P U B L I C S C H O O L S
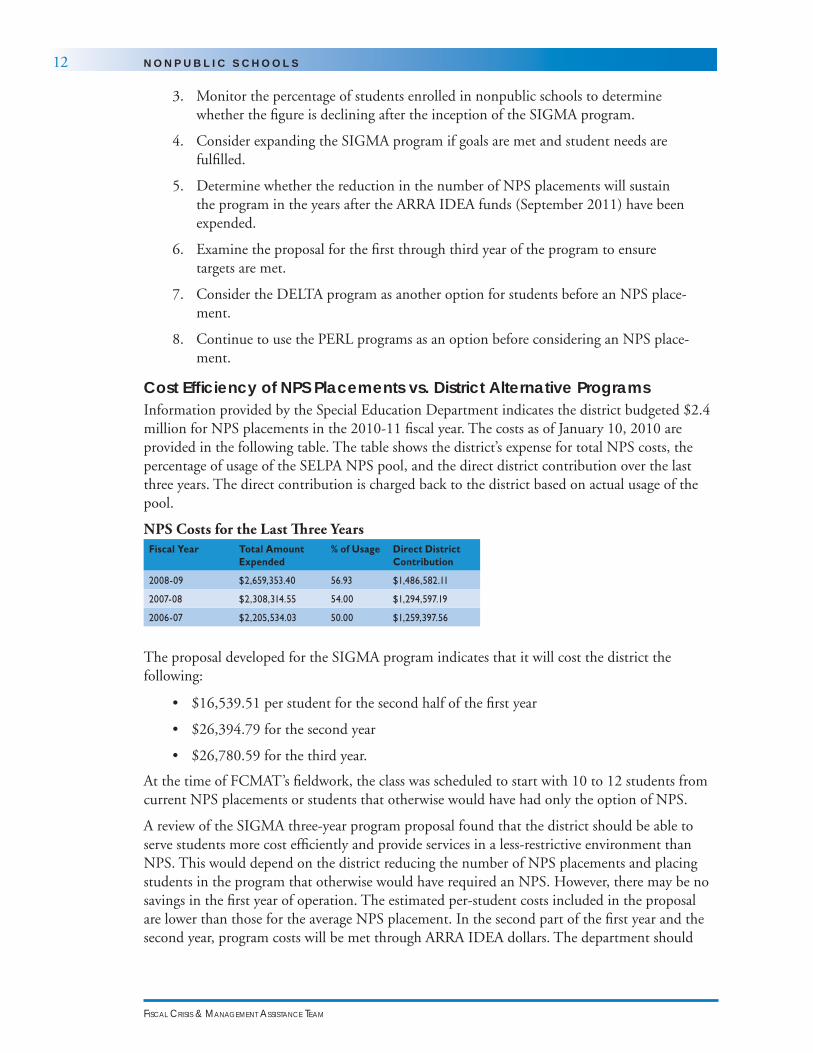
3. Monitor the percentage of students enrolled in nonpublic schools to determine whether the fi gure is declining after the inception of the SIGMA program.
4. Consider expanding the SIGMA program if goals are met and student needs are fulfi lled.
5. Determine whether the reduction in the number of NPS placements will sustain the program in the years after the ARRA IDEA funds (September 2011) have been expended.
6. Examine the proposal for the fi rst through third year of the program to ensure targets are met.
7. Consider the DELTA program as another option for students before an NPS place-ment.
8. Continue to use the PERL programs as an option before considering an NPS place-ment.
Cost Effi ciency of NPS Placements vs. District Alternative ProgramsInformation provided by the Special Education Department indicates the district budgeted $2.4 million for NPS placements in the 2010-11 fi scal year. The costs as of January 10, 2010 are provided in the following table. The table shows the district’s expense for total NPS costs, the percentage of usage of the SELPA NPS pool, and the direct district contribution over the last three years. The direct contribution is charged back to the district based on actual usage of the pool.
NPS Costs for the Last Th ree YearsFiscal Year Total Amount
Expended% of Usage Direct District
Contribution
2008-09 $2,659,353.40 56.93 $1,486,582.11
2007-08 $2,308,314.55 54.00 $1,294,597.19
2006-07 $2,205,534.03 50.00 $1,259,397.56
The proposal developed for the SIGMA program indicates that it will cost the district the following:
• $16,539.51 per student for the second half of the fi rst year
• $26,394.79 for the second year
• $26,780.59 for the third year.
At the time of FCMAT’s fi eldwork, the class was scheduled to start with 10 to 12 students from current NPS placements or students that otherwise would have had only the option of NPS.
A review of the SIGMA three-year program proposal found that the district should be able to serve students more cost effi ciently and provide services in a less-restrictive environment than NPS. This would depend on the district reducing the number of NPS placements and placing students in the program that otherwise would have required an NPS. However, there may be no savings in the fi rst year of operation. The estimated per-student costs included in the proposal are lower than those for the average NPS placement. In the second part of the fi rst year and the second year, program costs will be met through ARRA IDEA dollars. The department should

FAIRFIELD-SUISUN UNIFIED SCHOOL DISTRICT
13N O N P U B L I C S C H O O L S
analyze the SIGMA program to determine cost effi ciencies when the ARRA IDEA funds have been expended.
SIGMA Project Proposal Year 1
Site Staff Salary Benefi ts Total Half Year
0.25 Admin/Intake Coordinator 24,216.00 24,216.00 24,216.00 12,108.00
0.2 Secretary (step 3) 7,183.20 7,183.20 7,183.20 3,591.60
1.0 SE Teachers (range 3, step 5, masters) 53,429.00 16,028.70 69,457.70 34,728.85
0.2 APE Teacher (range 3, step 5) 10,506.20 3,151.86 13,658.06 6,829.03
2.0 Paraeducators w/AA (step 3) 42,840.00 12,852.00 55,692.00 27,846.00
.5 Behavior Assistant (step 3) 11,745.00 3,523.50 15,268.50 7,634.25
0.2 Psychologist (step 4, masters) 13,962.00 4,188.60 18,150.60 9,075.30
1.0 Mental Health Therapists - In Kind (County MH) - - - -
0.5 Behavior Specialist (step 3) 34,674.00 10,402.20 45,076.20 22,538.10
0.1 Occupational Therapist (step 3) 6,934.80 2,080.44 9,015.24 4,507.62
0.1 Speech Therapist (range 6, step 14, masters) 7,143.60 2,143.08 9,286.68 4,643.34
0.1 Nurse (range 4, step 5, masters) 5,342.90 1,335.73 6,678.69 3,339.31
Subtotal: 217,976.70 87,105.31 273,682.81 136,841.40
Annual Teacher Budget 2,000.00 1,000.00
ESY Costs – 30 - 5 hour days 20,711.62
Indirect Cost at 5% 13,684.14 6,842.07
Liability Costs 0.00
Transportation:
3 Bus Routes (1:4 staff to student) n/a
1 Program van & aide(s) n/a
Start Up Costs:
Environmental Modifi cations 7,500.00
Technology/Equipment 5,557.92
Curriculum
Total Projected Program Cost: 165,395.09
Per Child Cost (total cost/10 students): 16,539.51
Per Class Cost @ 10 students/class : 165,395.09
SIGMA Project ProposalYear 2
Site Staff Salary Benefi ts Total
0.5 Admin/Intake Coordinator 48,432.00 14,529.60 62,961.60
0.4 Secretary (step 3) 14,366.00 4,309.92 18,676.32
2.0 SE Teachers (range 3, step 5, masters) 106,858.00 32,057.40 138,915.40
0.2 APE Teacher (range 3, step 5) 10,506.20 3,151.86 13,658.06
4.0 Paraeducators w/AA (step 3) 85,680.00 25,704.00 111,384.00
1.0 Behavior Assistant (step 3) 23,490.00 7,047.00 30,537.00
0.2 Psychologist (step 4, masters) 13,962.00 4,188.60 18,150.60
1.0 Mental Health Therapists - In Kind (County MH) - - -
0.5 Behavior Specialist (step 3) 34,674.00 10,402.20 45,076.20
0.1 Occupational Therapist (step 3) 6,934.80 2,080.44 9,015.24
0.1 Speech Therapist (range 6, step 14, masters) 7,143.60 2,143.08 9,286.68
0.1 Nurse (range 4, step 5, masters) 5,342.90 1,335.73 6,678.63

FISCAL CRISIS & MANAGEMENT ASSISTANCE TEAM
14 N O N P U B L I C S C H O O L S
Subtotal: 357,389.90 106,949.83 464,339.73
Annual Teacher Budget 2,000.00
Indirect Cost at 5% 25,042.65
ESY Costs – 30 – 5 hour days 36,513.35
Liability Costs 0.00
Transportation:
3 Bus Routes (1:4 staff to student)
1 Program van & aide(s)
Total Projected Program Cost: 527,895.73
Per Child Cost (total cost/20 students): 26,394.79
Per Class Cost @ 10 students/class : 263,947.86
SIGMA Project ProposalYear 3
Site Staff Salary Benefi ts Total
0.5 Admin/Intake Coordinator 48,432.00 14,529.60 62,961.60
0.4 Secretary (step 3) 14,366.00 4,309.92 18,676.32
2.0 SE Teachers (range 3, step 5, masters) 106,858.00 32,057.40 138,915.40
0.2 APE Teacher (range 3, step 5) 10,454.40 3,136.32 13,590.72
4.0 Paraeducators w/AA (step 3) 85,680.00 25,704.00 111,384.00
1.0 Behavior Assistant (step 3) 29,200.00 8,760.00 37,960.00
0.2 Psychologist (step 4, masters) 13,962.00 4,188.60 18,150.60
1.0 Mental Health Therapists - In Kind (County MH) - - -
0.5 Behavior Specialist (step 3) 34,674.00 10,402.20 45,076.20
0.1 Occupational Therapist (step 3) 6,934.80 2,080.44 9,015.24
0.1 Speech Therapist (range 6, step 14, masters) 7,143.60 2,143.08 9,286.68
0.1 Nurse (range 4, step 5, masters) 5,342.90 1,335.73 6,678.63
Subtotal: 363,048.10 108,647.29 471,695.39
Annual Teacher Budget 2,000.00
ESY Costs – 30 – 5 hour days 36,513.35
Indirect Cost at 5% 25,410.44
Liability Costs 0.00
Transportation:
3 Bus Routes (1:4 staff to student)
1 Program van & aide(s)
Total Projected Program Cost: 535,619.17
Per Child Cost (total cost/20 students): 26,780.96
Per Class Cost @ 10 students/class : 267,809.59
RecommendationsThe district should:
1. Continue to analyze the total amount expended for NPS placements and total usage to determine whether there is a decrease because the SIGMA program. This information is provided by the SELPA.
2. Continuously monitor the SIGMA program to ensure cost effi ciency and to deter-mine whether the needs of the students in the program are met in a less-restrictive environment than an NPS placement.
FAIRFIELD-SUISUN UNIFIED SCHOOL DISTRICT
15N O N P U B L I C S C H O O L S
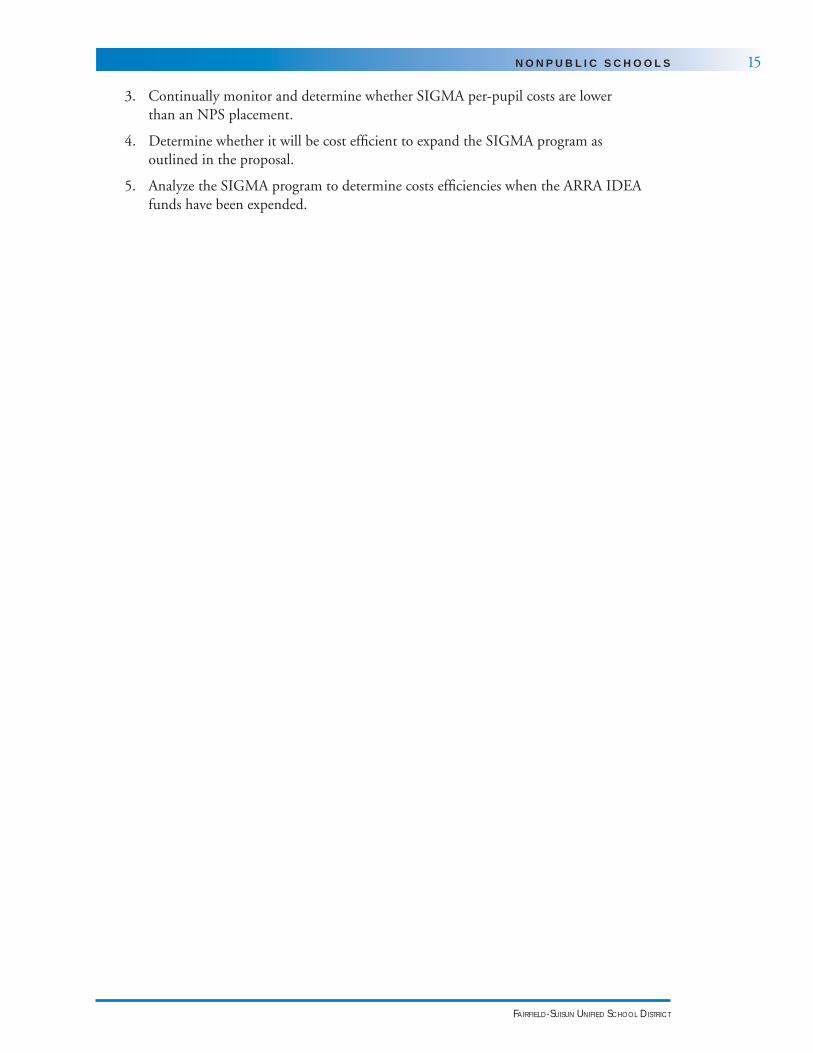
3. Continually monitor and determine whether SIGMA per-pupil costs are lower than an NPS placement.
4. Determine whether it will be cost effi cient to expand the SIGMA program as outlined in the proposal.
5. Analyze the SIGMA program to determine costs effi ciencies when the ARRA IDEA funds have been expended.

FISCAL CRISIS & MANAGEMENT ASSISTANCE TEAM
16 N O N P U B L I C S C H O O L S

FAIRFIELD-SUISUN UNIFIED SCHOOL DISTRICT
17N O N P U B L I C A G E N C I E S A N D C O N T R A C T S E R V I C E S
Nonpublic Agencies and Contract Services
Process and Procedures for Nonpublic Agency ServicesCalifornia has a shortage of speech therapists, and some districts offer stipends, create a separate salary schedule, or provide year-for year-credit to recruit these specialists.
Fairfi eld-Suisun Unifi ed contracts with fi ve nonpublic agencies (NPAs) for more than 60 percent of speech therapy services. The district has a caseload cap of 55 (40 for preschool) for each speech therapist. This requires the addition of therapists as these services are added to existing IEPs or students with these services on their IEPs are enrolled.
Cost Comparison of Contracted vs. District-Hired Speech Therapists The district contracts for 13 speech therapists (12.4 FTEs) at an estimated cost of $1,478,640 in 2009-2010 fi scal year. The following table provides a breakdown of speech therapy contracted services. The district directly employs 11 full- and part-time speech therapists (9.8 FTEs) at a cost of approximately $907,482 in 29=009-2010 fi scal year, including benefi ts. Speech therapists are on the same salary schedule as teachers.
Contracted Speech Th erapistsHourly Rate Annual Rate Number of Employees at This Rate Total Annual Amount
$70 $102,480 1 $102,480
$75 $109,800 5 $549,000
$80 $117,120 6 $702,720
$85 $124,440 1 $124,440
Total 13 $1,478,640
The Special Education Department provided FCMAT with a draft proposal that included two options for reducing the number of contracted speech therapy services with the goal of increasing the number of speech therapists employed by the district. The district believes employing more speech therapist will reduce the cost to deliver services and be more effective. The district expends $1,478,649 for a contracted 12.4 full-time equivalents (FTEs) speech therapists that provide services and fulfi ll IEP requirements. The Special Education Department expends approximately $907,482 for 9.8 FTE district-employed speech therapists. The district is concerned that it may not be able to hire additional therapists because the current pay is not competitive and there is no incentive.
The following table includes data on the two possible solutions developed by the Special Education Department. FCMAT analyzed the proposals for cost effi ciency and found that option 1 would cost the district approximately $73,588 more than it is expending for district-hired and contracted speech therapy services. Option 2 would save the district approximately $3,323 for the fi rst year for both district-hired and contracted services. In the second year, option 2 would cost the district more than it expends because of step-and -column increases.

FISCAL CRISIS & MANAGEMENT ASSISTANCE TEAM
18 N O N P U B L I C A G E N C I E S A N D C O N T R A C T S E R V I C E S
District Proposals to Reduce Contracted Speech Th erapyIn-House Staff -A- -B- -C- -D-
FTE 09/10 Salary 09/10 Benefi ts 09/10 Total 10/11 Total Option 1 Option 2
1.00 72,564.12 17,333.11 89,897.23 91,887.00 105,370.00 102,007.00
1.00 83,211.00 12,071.51 95,282.51 95,282.00 111,874.00 108,273.00
1.00 79,572.12 18,318.62 97,890.74 99,848.00 111,874.00 108,273.00
1.00 66,500.00 17,813.37 84,313.37 84,313.00 114,038.00 110,359.00
1.00 83,064.12 17,925.62 100,989.74 100,989.00 114,038.00 110,359.00
1.00 83,802.96 12,144.42 95,947.38 95,947.00 114,038.00 110,359.00
1.00 48,775.68 15,275.34 64,051.02 64,051.00 65,821.00 63,709.20
0.60 46,784.40 5,819.61 52,604.01 52,604.00 63,222.00 61,204.20
0.60 43,961.34 5,471.92 49,433.26 50,620.00 63,222.00 61,204.20
1.00 58,672.08 16,616.59 75,288.67 75,288.00 103,200.00 99,916.00
1.00 82,164.00 19,620.16 101,784.16 101,784.00 114,038.00 110,359.00
10.20 Total: 907,482.09 912,613.00 1,080,735.00 1,046,022.60
Cost per FTE: 88,968.83 89,471.86 105,954.41 102,551.24
Contracted Staff Conversion to In-House Staff
FTE Rate 0910 Total 1011 Total Option 1 Option 2
1.00 80/hr 117,120.00 117,120.00 105,954.41 102,551.24
1.00 80/hr 117,120.00 117,120.00 105,954.41 102,551.24
1.00 80/hr 117,120.00 117,120.00 105,954.41 102,551.24
1.00 80/hr 117,120.00 117,120.00 105,954.41 102,551.24
0.40 80/hr 46,848.00 46,848.00 42,381.76 41,020.49
1.00 80/hr 117,120.00 117,120.00 105,954.41 102,551.24
1.00 75/hr 109,800.00 109,800.00 105,954.41 102,551.24
1.00 75/hr 109,800.00 109,800.00 105,954.41 102,551.24
1.00 75/hr 109,800.00 109,800.00 105,954.41 102,551.24
1.00 75/hr 109,800.00 109,800.00 105,954.41 102,551.24
1.00 75/hr 109,800.00 109,800.00 105,954.41 102,551.24
1.00 70/hr 102,480.00 102,480.00 105,954.41 102,551.24
1.00 85/hr 124,440.00 124,440.00 105,954.41 102,551.24
12.40 Total: 1,408,368.00 1,408,368.00 1,313,834.71 1,271,635.32
Cost per FTE: 113,578.06 113,578.06 105,954.41 102,551.24
Grand Total: 2,315,850.09 2,320,981.00 2,394,569.71 2,317,657.92

FAIRFIELD-SUISUN UNIFIED SCHOOL DISTRICT
19N O N P U B L I C A G E N C I E S A N D C O N T R A C T S E R V I C E S
Summary of Option 1 and 2Year/Option Total Cost Savings from 2010-11
-A- 2009/10 2,315,850.09 n/a
-B- 2010/11 2,320,981.00 0.00
-C- Option 1 2,394,569.71 (73,588.71)
-D- Option 2 2,317,657.92 3,323.08
The district should consider three options for cost effi ciency and programmatic effectiveness. These include providing a stipend of $5,000, $4,000, or $3,000 per year as an incentive for each district-hired speech therapist. The next three tables show a cost breakdown of this annual stipend.
All three tables provide examples of high, mid (average), and low costs depending on the years of services of the speech therapists hired by the district. Districts can have a combination of experienced therapists. District-hired speech therapists are predominantly at the top of the certifi cated pay schedule. If the district decides to employ more speech therapists, the exact salary costs cannot be calculated until the staff members are hired and the newly hired staff members are placed on the salary schedule. However, districts generally provide up to fi ve years of experi-ence when hiring a new staff member. The therapists hired will likely have a low- and mid-range combination of experience.
The fi rst table below includes the approximate costs of offering a $5,000 annual stipend to each district-hired speech therapist. In this scenario, if all the speech therapists hired were at the top (high) end of the salary schedule, the savings to the district in the fi rst year would be approxi-mately $32,534. If the therapist’s salaries were a combination of high (top) to low, the district would save approximately $579,459 in the fi rst year.
Approximate Costs for $5000 Annual Stipend for Speech Th erapists.In-House Staff
-E- -F- -G-
1.00 94,897.23 102,248.15 53,350.20
1.00 100,282.51 102,248.15 53,350.20
1.00 102,890.74 102,248.15 53,350.20
1.00 89,313.37 102,248.15 53,350.20
1.00 105,989.74 102,248.15 53,350.20
1.00 100,947.38 102,248.15 53,350.20
1.00 69,051.02 102,248.15 53,350.20
0.60 57,604.01 56,302.78 29,501.28
0.60 54,433.26 56,302.78 29,501.28
1.00 80,288.67 102,248.15 53,350.20
1.00 106,784.16 102,248.15 53,350.20
10.20 962,482.09 1,032,838.92 539,154.40
Cost/FTE: 94,360.99 101,258.72 52,858.27

FISCAL CRISIS & MANAGEMENT ASSISTANCE TEAM
20 N O N P U B L I C A G E N C I E S A N D C O N T R A C T S E R V I C E S
Contracted Staff
FTE 5k Stipend4 5k High4 5k Low4
1.00 94,360.99 101,258.72 52,858.27
1.00 94,360.99 101,258.72 52,858.27
1.00 94,360.99 101,258.72 52,858.27
1.00 94,360.99 101,258.72 52,858.27
0.40 37,744.40 40,503.49 21,143.31
1.00 94,360.99 101,258.72 52,858.27
1.00 94,360.99 101,258.72 52,858.27
1.00 94,360.99 101,258.72 52,858.27
1.00 94,360.99 101,258.72 52,858.27
1.00 94,360.99 101,258.72 52,858.27
1.00 94,360.99 101,258.72 52,858.27
1.00 94,360.99 101,258.72 52,858.27
1.00 94,360.99 101,258.72 52,858.27
12.40 1,170,076.27 1,255,608.10 655,442.60
Cost/FTE: 94,360.99 101,258.72 52,858.27
Grand Total: 2,132,558.36 2,288,447.02 1,194,597.00
1 2009-10 Salary and Benefi ts, plus $5,000 stipend
2 2007-08 Salary Schedule, Column 6, Range 24 - plus $5,000 stipend
3 2007-08 Salary Schedule, Column 1, Range 1 - plus $5,000 stipend
4 In-House Staff Cost-per-FTE times Contracted Staff’s FTE
Summary of Table
$5,000 Stipend Option Total Cost Savings from 2010-11
-E- Cost/FTE 2,132,558.36 188,422.64
-F- High Salaries 2,288,447.02 32,533.98
-G- Low Salaries 1,194,597.00 1,126,384.00
High/Low Average 1,741,522.01 449,113.53
The following table includes the approximate costs of offering a proposed$4,000 annual stipend to each district-hired speech therapist. In this scenario, if all the speech therapists hired were at the top (high) of the salary schedule, the savings to the district would be approximately $55,134 in the fi rst year. If the therapist’s salaries were a combination of high (top) and low within the mid range the district would save approximately $602,059 in the fi rst year. If the therapists hired came in as fi rst year therapists, the district would save approximately $1,148,984 the fi rst year.

FAIRFIELD-SUISUN UNIFIED SCHOOL DISTRICT
21N O N P U B L I C A G E N C I E S A N D C O N T R A C T S E R V I C E S
Approximate Cost of $4,000 Annual Stipend for Speech Th erapists In-House Staff
-H- -I- -J-
FTE 4k Stipend1 4k High2 4k Low3
1.00 93,897.23 101,248.15 52,350.20
1.00 99,282.51 101,248.15 52,350.20
1.00 101,890.74 101,248.15 52,350.20
1.00 88,313.37 101,248.15 52,350.20
1.00 104,989.74 101,248.15 52,350.20
1.00 99,947.38 101,248.15 52,350.20
1.00 68,051.02 101,248.15 52,350.20
0.60 56,604.01 55,702.78 28,901.28
0.60 53,433.26 55,702.78 28,901.28
1.00 79,288.67 101,248.15 52,350.20
1.00 105,784.16 101,248.15 52,350.20
10.20 951,482.09 1,022,638.92 528,954.40
Cost/FTE: 93,282.56 100,258.72 51,858.27
Contracted Staff
FTE 4k Stipend4 4k High4 4k Low4
1.00 93,282.56 100,258.72 51,858.27
1.00 93,282.56 100,258.72 51,858.27
1.00 93,282.56 100,258.72 51,858.27
1.00 93,282.56 100,258.72 51,858.27
0.40 37,313.02 40,103.49 20,743.31
1.00 93,282.56 100,258.72 51,858.27
1.00 93,282.56 100,258.72 51,858.27
1.00 93,282.56 100,258.72 51,858.27
1.00 93,282.56 100,258.72 51,858.27
1.00 93,282.56 100,258.72 51,858.27
1.00 93,282.56 100,258.72 51,858.27
1.00 93,282.56 100,258.72 51,858.27
1.00 93,282.56 100,258.72 51,858.27
12.40 1,156,703.72 1,243,208.10 643,042.60
Cost/FTE: 93,282.56 100,258.72 51,858.27
Grand Total: 2,108,185.81 2,265,847.02 1,171,997.00
1 2009-10 Salary and Benefi ts, plus $4,000 stipend
2 2007-08 Salary Schedule, Column 6, Range 24 - plus $4,000 stipend
3 2007-08 Salary Schedule, Column 1, Range 1 - plus $4,000 stipend
4 In-House Staff Cost-per-FTE times Contracted Staff’s FTE

FISCAL CRISIS & MANAGEMENT ASSISTANCE TEAM
22 N O N P U B L I C A G E N C I E S A N D C O N T R A C T S E R V I C E S
Summary of Table 11
$4,000 Stipend Option Total Cost Savings from 2010-11
-H- Cost/FTE 2,108,185.81 212,795.19
-I- High Salaries 2,265,847.02 55,133.98
-J- Low Salaries 1,171,997.00 1,148,984.00
High/Low Average 1,718,922.01 602,058.99
The next table includes the approximate costs for offering a $3,000 annual stipend annually to each district hired speech therapists. In this scenario, if all the speech therapists hired were at the top (high) of the salary schedule, the district would save approximately $77,734 in the fi rst year. If the therapist’s salaries were a combination of high (top) and low within the mid range the district would save approximately $624,659 in the fi rst year. If the therapists hired came in as fi rst-year therapists, the district would save approximately $1,171,584 in the fi rst year.
Approximate Costs of $3000 Annual Stipend for Speech Th erapists In-House Staff
-K- -L- -M-
FTE 3k Stipend1 3k High2 3k Low3
1.00 92,897.23 100,248.15 51,350.20
1.00 98,282.51 100,248.15 51,350.20
1.00 100,890.74 100,248.15 51,350.20
1.00 87,313.37 100,248.15 51,350.20
1.00 103,989.74 100,248.15 51,350.20
1.00 98,947.38 100,248.15 51,350.20
1.00 67,051.02 100,248.15 51,350.20
0.60 55,604.01 55,102.78 28,301.28
0.60 52,433.26 55,102.78 28,301.28
1.00 78,288.67 100,248.15 51,350.20
1.00 104,784.16 100,248.15 51,350.20
10.20 940,482.09 1,012,438.92 518,754.40
Cost/FTE: 92,204.13 99,258.72 50,858.27
Contracted Staff
FTE 3k Stipend4 3k High4 3k Low4
1.00 92,204.13 99,258.72 50,858.27
1.00 92,204.13 99,258.72 50,858.27
1.00 92,204.13 99,258.72 50,858.27
1.00 92,204.13 99,258.72 50,858.27
0.40 36,881.65 39,703.49 20,343.31
1.00 92,204.13 99,258.72 50,858.27
1.00 92,204.13 99,258.72 50,858.27
1.00 92,204.13 99,258.72 50,858.27
1.00 92,204.13 99,258.72 50,858.27
1.00 92,204.13 99,258.72 50,858.27
1.00 92,204.13 99,258.72 50,858.27
1.00 92,204.13 99,258.72 50,858.27
1.00 92,204.13 99,258.72 50,858.27

FAIRFIELD-SUISUN UNIFIED SCHOOL DISTRICT
23N O N P U B L I C A G E N C I E S A N D C O N T R A C T S E R V I C E S
12.40 1,143,331.17 1,230,808.10 630,642.60
Cost/FTE: 92,204.13 99,258.72 50,858.27
Grand Total: 2,083,813.26 2,243,247.02
1 2009-10 Salary and Benefi ts, plus $3,000 stipend
2 2007-08 Salary Schedule, Column 6, Range 24 - plus $3,000 stipend
3 2007-08 Salary Schedule, Column 1, Range 1 - plus $3,000 stipend
4 In-House Staff Cost-per-FTE times Contracted Staff’s FTE
Summary of Table
$3,000 Stipend Option Total Cost Savings from 2010-11
-K- Cost/FTE 2,083,813.26 237,167.74
-L- High Salaries 2,243,247.02 77,733.98
-M- Low Salaries 1,149,397.00 1,171,584.00
High/Low Average 1,696,322.01 624,658.99
The fi gures in all three stipend scenarios are based on the health and welfare benefi t compensa-tion information that was provided to FCMAT. The data is based on current year 2009-10 information and should be analyzed by the Business Department to determine any unknown costs. It is unlikely that all the therapists hired by the district will be at the top of the salary schedule; however, the district should be aware of all possibilities to make an informed decision. The district may not be able to fi ll all the contracted therapist positions with district-employed therapists in the fi rst year, and contracting for some services would change all the cost break-downs provided in the above tables.
The Special Education Department wants to determine the programmatic and cost effectiveness of employing district speech therapists. If the district determines this is preferable to contracting for these services, it can consider alternative program delivery models to increase program effec-tiveness. Implementing these models can be more diffi cult than using contracted services and require extensive preparation, follow-through and monitoring for the special education director and his team of coordinators and program specialists. However, the resulting programmatic gains can lead to further cost savings and effi ciency.
If the district decides to implement these alternative models for speech services, it should also determine whether it is possible to reduce the number of students receiving these services, especially at the middle- and high-school levels. An investigation of these delivery models should include consideration of the severity scales, the consultation model, and an examination of frequency and duration through the Special Education Information System (SEIS).
RecommendationsThe district should:
1. Consider implementing other options to meet student needs instead of steadily increasing the number of contracted speech therapists.
2. Determine whether it would be cost-effi cient for the district to hire speech thera-pists and reduce the number of contracted services based on the options detailed in the above tables.
3. Determine whether to pursue the option of offering a stipend to speech therapists.

FISCAL CRISIS & MANAGEMENT ASSISTANCE TEAM
24 N O N P U B L I C A G E N C I E S A N D C O N T R A C T S E R V I C E S
4. Consider developing a memorandum of understanding (MOU) or making amend-ments to the existing MOU with the Fairfi eld-Suisun Unifi ed Teachers Association that would provide a stipend to speech therapists.
5. Prepare for the potential of retaining some contractual speech therapist services if services unable to hire a suffi cient number of speech therapist in the fi rst year or two.
6. Consider the programmatic benefi ts of hiring speech therapists.
7. Consider developing alternative service delivery models that would decrease the number of students receiving speech therapy from a speech therapist.
District-Hired Speech Therapist Salary ScheduleDistrict speech therapists are on the certifi cated salary schedule, and the other SELPA districts have comparable salary schedules for these positions. However, health packages may vary among the districts, making it diffi cult to compare data.
The district has an eight-year cap on year-for-year credit. That means a speech ther-apist with 15 years of experience in public education would be offered a maximum year-for-year credit of eight years. Further, the district provides this credit only if the speech therapist has been employed in the public school system. Staff members indicated that this contract language has prevented the district from hiring highly skilled speech therapists that would have had to start at the lowest end of the salary schedule.
The district has a memorandum of understanding (MOU) with the Fairfi eld-Suisun Unifi ed Teachers Association that is dated February 23, 2009. The MOU recognizes current shortages and the diffi culty in recruiting and hiring speech thera-pists, nurses and special education teachers. The document requires the district to pay a one-time hiring bonus of $5,000 to speech therapists hired after February 23, 2009 if they hold the proper credentials. The hiring bonus is prorated based on full-time equivalents (FTE) and is paid in two equal payments, half at signing and half at the completion of one year of service. The MOU was in effect through June
30, 2010 and may be renewed if the parties mutually agree. This agreement does not benefi t or offer an incentive to therapists who were with the district before February 23, 2009 when it went into effect.
Another MOU between the district and the association dated January 1, 2008 outlines the speech and language therapist maximum caseloads as provided by the Education Code. The document requires a yearly stipend of $2,000 to be provided to all qualifying speech and language pathologists who hold the certifi cate of clinical competence in speech-language pathology. The MOU also requires the stipend to be retroactive to July 1, 2007. Staff members indicated that speech and language pathologists can complete a supplemental time sheet for addi-tional pay when their caseloads exceed 55 or 40 for those serving preschool students. However few therapists complete this supplemental time sheet. The district also does not use the intern programs available in surrounding areas.
A proposal from the University of Pacifi c (UOP) and San Joaquin County Offi ce of Education outlines a program that would require the district to employ an intern for one year. A three-year commitment is required if the district chose to hire the intern after that, and interns that choose to leave before fulfi lling the commitment would be required to reimburse the district for their
Staff members indicated that this contract language has prevented the district from hiring highly skilled speech therapists that would have had to start at the lowest end of the
salary schedule.

FAIRFIELD-SUISUN UNIFIED SCHOOL DISTRICT
25N O N P U B L I C A G E N C I E S A N D C O N T R A C T S E R V I C E S
compensation. The district can also terminate the agreement if necessary. The district should pursue this option to recruit additional speech therapists.
Additional speech therapists can also be recruited at job fairs throughout California, especially the local ones. Many online services are also available.
RecommendationsThe district should:
1. Consider changing the eight-year cap for year-for-year credit to recruit and employ more therapists.
2. Consider granting year-for-year credit to highly qualifi ed speech therapists that have experience outside of public education.
3. Review the MOU for speech therapists to determine how the district could hire more therapists instead of contracting for these services.
4. Consider using an intern program to recruit more speech therapists to the area.
5. Consider attending job fairs throughout California to recruit speech therapists.
6. Consider utilizing online options when advertising speech therapists positions.
7. Examine effective service delivery options to prevent the steady rise in the number of contracted services.

FISCAL CRISIS & MANAGEMENT ASSISTANCE TEAM
26 N O N P U B L I C A G E N C I E S A N D C O N T R A C T S E R V I C E S

FAIRFIELD-SUISUN UNIFIED SCHOOL DISTRICT
27T R A N S P O R T A T I O N E F F I C I E N C Y A N D E F F E C T I V E N E S S
Transportation Effi ciency and Effectiveness Transportation is provided for special education students as a related service required by the IEP. Approximately 2,600 district special education students are identifi ed by their IEPs, and 23 are transported to programs outside the district by the Solano County Offi ce of Education. The district transports 377 of those special education students to district programs and approxi-mately 150 to programs operated by the county offi ce on regular home-to-school and special education routes. Ninety district special education students attend nonpublic schools (NPS), six transported by the county offi ce. The remaining NPS students are transported by families or by the NPS providers as a part of their contract. The district operates 14 home-to-school bus routes and 24 special education bus routes. Special Education students can be assigned to any bus route depending on their abilities and the timing and destination of the routes.
FinancesSchool transportation is severely underfunded in California. Until 1977, the state fully reim-bursed school districts for their reported operational costs (never capital costs) in the subsequent school year. From 1977 to 1982, the state began reducing the percentage of the reimbursement, and in the 1982-83 school year, funding was capped at the amount received that year (80 percent of costs). Since then, the state has only occasionally granted a cost-of-living adjustment (COLA). Consequently, the state now funds approximately 45 percent of reported school transportation costs. In the 2009-10 school year, the state further reduced the apportionment by 19.84%.
School transportation costs are captured on the Form TRAN or TRAN report, which is gener-ated with the unaudited actual report in September of the following fi scal year. The report is automatically fi lled in by the electronic accounting system, but districts manually enter some data such as the number of buses, students and miles.
The 2007-08 TRAN reports that the district transported 79 severely disabled/orthopedically impaired (SD/OI) students on 11 buses at a total cost of $130,194 and a cost of 44 cents per mile and $1,648 per pupil with no general fund local contribution. That year, the district also reported that 364 students with transportation requirements in their IEPs were also transported on home-to-school regular education bus routes. The district’s loading factor (the number of students divided by special education routes) was 7.2 students per route. These numbers do not take into account students attending county offi ce programs. The revenue received for 2007-08 was $131,752. Because this is more than total costs, the district would have permanently lost $1,558 in funding in any other year. However because of a deferral of funds that year, the state did not reduce this funding.
The 2008-09 TRAN shows that 321 SD/OI students were transported on 24 buses at a total cost of $147,108, and a cost of 45 cents per mile and $458 per pupil with a general fund local contribu-tion of $15,356. The district also reported that 637 students with transportation requirements in their IEPs were also transported on home-to-school bus routes that year. The district’s loading factor was 13.37 students per route, which is high compared to many districts that FCMAT has reviewed throughout the state. The 2009-10 loading factor is expected to be 14.04, which is also effi cient. The revenue received for 2008-09 was also $131,752 with a general fund contribution of $15,356. This is a low contribution amount compared to the average school district in the state.
In the TRAN report, costs are reported in two columns, home to school and SD/OI. Revenue is also received separately according to those two categories. If a district’s costs in either column are less than the revenue received, the state reduces the revenue to the level of costs. Although the approved apportionment has been reduced for the 2009-10 school year, districts must have costs that are greater than the approved apportionment established in the 2008-09 school year.

FISCAL CRISIS & MANAGEMENT ASSISTANCE TEAM
28 T R A N S P O R T A T I O N E F F I C I E N C Y A N D E F F E C T I V E N E S S
Only 377 transportation requests for special education students were received for the 2009-10 school year. Transportation Department staff members indicated that in prior years, a similar or lower number of transportation requests were received. If the data reported above was accurate, Fairfi eld Suisun Unifi ed would have the lowest SD/OI costs that FCMAT has seen in the state; however, SD/OI costs have not been reported properly.
Transportation Department costs are improperly allocated according to statements from the transportation director and the district accountant who budgets for the department. They believe approximately 70% of department costs should be allocated to special education and 30% to home-to-school transportation. This is a reasonable assumption based on the ratio of routes and the fact that special education routes generally are more costly than home-to school bus routes. If costs were appropriately allocated according to this assumption, SD/OI costs for 2008-09 would be $2,461,229 with a cost of $7,667 per pupil and $7.55 per mile and a signifi cantly higher local contribution. This is more comparable to special education transportation costs at most districts that FCMAT has reviewed.
The county offi ce’s Transportation Department transports 23 district students. The county offi ce formula allocates revenue based on total district ADA. The district will receive $507,197 this year to support special education (SD/OI) transportation. The formula bases excess costs on a ratio of the students transported to the total. Expected costs are $283,526 for 2009-10. The formula projects a credit of $223,670 to the district, and based on these costs, the county offi ce transports district SD/OI students at a cost of $14,176 each. The credit can be used to support the district’s special education transportation costs.
In the 2008-09 school year, the district took responsibility for transporting all SD/OI students that attend programs in the district. For years, the SELPA has worked toward a system in which districts transport their special education students to programs within their boundaries, and the county offi ce transports students who attend programs outside the district. It is reasonable for county-offi ce costs to be higher because it transports students with the most severe disabilities and those who live the farthest from their academic programs.
The district’s general fund contribution for transportation is reasonable.
Nonpublic School Student TransportationNinety district students attend nonpublic schools (NPSs), and only six are transported by the county offi ce. The rest are transported by other means. Some NPS programs include transporta-tion as a part of their service contract, and costs for this service range from $2,700 per year for a 180-day school year to $6,300. Other than the six students transported by the county offi ce, NPS transportation is less expensive than district transportation for SD/OI students. The district is exploring the possibility of developing an in-house program for some students served by NPS programs. Transportation to a district program may actually be more expensive, but this would have to be determined individually. Costs could be based on bell times, program location, and whether the Transportation Department could load the additional students on existing buses or require an additional bus and driver.

FAIRFIELD-SUISUN UNIFIED SCHOOL DISTRICT
29T R A N S P O R T A T I O N E F F I C I E N C Y A N D E F F E C T I V E N E S S
Bell Times and CalendarSeparating bell times for approximately half the programs by 45 minutes to an hour would allow for two runs per route, reducing the total number of bus routes and overall costs. In addition, some schools dismiss early on Wednesdays, and some do not, creating a need for additional time and miles on that day. If all schools dismissed early on the same day and approximately at the same time, there would be no additional cost for in-district transportation.
Special Education Transportation ServiceSome special education transportation users characterized the service as effective and the depart-ment as responsive. Others indicated that service is poor, buses are regularly late, and the depart-ment is unresponsive. Some Special Education Department staff members complained that it takes too long to schedule students on buses; however, students are usually scheduled in fi ve days. Because of the logistical challenges and frequent changes inherent to special education transpor-tation, scheduling new students or making changes to a student’s placement or home address normally take fi ve to 10 days. Bus driver shortages are the primary cause of late bus routes.
One primary clerk in the Special Education Department routes transportation requests to the Transportation Department. In the past, these requests were made with informal telephone calls, facsimile transmissions and e-mail communications. The clerk recently began using a paper transportation request form to document these requests; however, the form is inadequate. The form should include the student’s name, home address, pick-up and drop-off information, school of attendance and bell times, emergency telephone numbers and information regarding the student’s medical or special conditions, and whether the student has an aide or nurse provided by the district or if the Transportation Department needs to provide one. The Transportation Department staff should help develop this form.
Two years ago, the district took responsibility for transporting all special education students who attend programs in the district.
The district has no board policy or administrative regulation that addresses maximum bus ride times for special education students. The transportation staff makes informal efforts to limit ride times to an hour for locations in town and 90 minutes for those out of town, primarily for students that live in Cordelia. These are reasonable ride times for special education students.
Other Transportation ElementsFCMAT’s scope does not include a comprehensive evaluation of the Transportation Department. However, the areas of legal compliance and department operations were evaluated, the latter to determine whether any operational economies can be achieved.
Vehicle MaintenanceThe California Highway Patrol (CHP) motor carrier inspector annually provides a terminal-grade report on compliance with requirements related to vehicle maintenance, maintenance documentation, drug and alcohol testing and driver training. The district has consistently received a grade of “satisfactory,” which is the highest grade. A review of a sample of vehicle maintenance records found them to comply with laws and regulations. The district shop facility is generally serviceable with the typical amount of tools and equipment to ensure safety and productivity. Drivers generally indicated that vehicles are well maintained and that the Maintenance Department is responsive to their needs and concerns. Some staff members stated
The district has no board
policy or administrative regulation
that addresses maximum bus ride times for special education students.
FISCAL CRISIS & MANAGEMENT ASSISTANCE TEAM
30 T R A N S P O R T A T I O N E F F I C I E N C Y A N D E F F E C T I V E N E S S
they have an inadequate number of spare buses equipped for wheelchairs. Buses are generally clean in appearance.
In addition to approximately 50 school buses, the Vehicle Maintenance Department also main-tains 30 trucks, vans and automobiles for the district as well as 22 buses for the Solano County Offi ce of Education for a fee that is designed to generate revenue.
Driver TrainingSchool bus drivers are required to receive the greatest amount of training time of any commer-cial driver in the state. New drivers have to receive a minimum of 20 hours of training in the classroom and another 20 hours behind the wheel. The training is required to comply with the California Department of Education’s school bus driver training program. Teaching the curric-ulum properly generally takes at least 35 hours in the classroom and a similar or greater amount of time in actual driving. Drivers are also required to receive at least 10 hours of in-service training a year, and all training has to be provided by a state-certifi ed school bus driver instructor. The district has only one of these driver instructors on staff, the operations supervisor.
FCMAT reviewed a sample of driver training records and found them to comply with laws and regulations. A retired district director of transportation who is also a state-certifi ed school bus driver instructor occasionally helps with driver training.
The state requires certain bus drivers to participate in evacuation drills annually. At the time of fi eldwork, the routes at three district schools had not participated in evacuation drills for the current school year. Documentation of these evacuation drills is required to be maintained and can be inspected by the CHP at any time.
Department Staffi ngThe Transportation Department is staffed by a transportation director, one operations supervisor, one department secretary, two dispatchers, one shop supervisor and two mechanics. The district intends to have one school bus driver for each route, but two or more bus routes each day lack a driver. The department also has one bus aide, with other aides provided by the Special Education Department. The drivers of other routes fi ll in to cover the routes without drivers, so they do not run on time.
The department is recruiting for one mechanic and a second operations supervisor. It is critical for a mechanic to be recruited and hired as soon as possible. Based on the number of vehicles maintained by the department, the current shop staff would be unable to continue compensating for the mechanic shortage without experiencing burnout or a decrease in work quality in the long run. The shop supervisor indicated that the requirement for applicants to possess a Class B driver license (to test drive or shuttle buses) often disqualifi es candidates. The Human Resources Department should revise the criteria to accept otherwise qualifi ed applicants with a requirement that a probationary mechanic attain the license within three months of hiring.
The Transportation Department needs additional clerical support. The supervisor and mechanics should focus on direct vehicle maintenance while the clerical support maintains the required electronic and paper records. A new support clerk could also help organize and inventory the department’s bus parts supply, and assist with clerical needs in the operations and dispatch offi ce.
FAIRFIELD-SUISUN UNIFIED SCHOOL DISTRICT
31T R A N S P O R T A T I O N E F F I C I E N C Y A N D E F F E C T I V E N E S S
The department has a driver shortage that has left two or more routes without a regular driver throughout the 2009-10 school year. Some bus routes are regularly late because of this shortage. The department should prioritize bus driver recruiting and use common methods of advertising. Recruiting efforts can be enhanced through local newspapers, school newsletters, and buses with banners announcing the need for drivers. These vehicles can be parked at local shopping centers for maximum exposure. Staff members indicated that the transportation director is not certifi ed to drive a school bus.
RecommendationsThe district should:
1. Assign costs appropriately to better refl ect the actual cost of special education transportation.
2. Evaluate the potential cost benefi ts of bell time separations and dismissing all programs at approximately the same early time on Wednesdays.
3. Improve and enhance the special education transportation request form.
4. Ensure all school bus evacuation drills are annually completed for all bus riders.
5. Collaborate on specifi c special education bus driver training.
6. Determine whether to purchase one or more additional buses equipped for wheel-chairs.
7. Hire a driver as soon as possible.
8. Hire a full-time clerical support person to assume shop and transportation opera-tions responsibilities. This position can also assist with other department clerical needs.

FISCAL CRISIS & MANAGEMENT ASSISTANCE TEAM
32 T R A N S P O R T A T I O N E F F I C I E N C Y A N D E F F E C T I V E N E S S

FAIRFIELD-SUISUN UNIFIED SCHOOL DISTRICT
33C O S T E F F E C T I V E N E S S O F C O U N T Y A N D D I S T R I C T - O P E R A T E D P R O G R A M S
Cost Effectiveness of County & District-Operated Programs In determining whether it would be cost-effective for the district to operate additional special education programs, FCMAT considered the following factors:
• How county offi ce programs are funded
• How the funding model would need to change if programs were operated by the district
• The effect on the district’s facilities
The Solano County SELPA’s local plan details how county offi ce programs are funded. Section 24 I of the plan states the following:
State AB 602 and Federal Local Assistance Grant funds are distributed on an ADA basis, after regionalized services are funded fi rst. Regionalized services include funding for county operated programs…
A sample of the distribution model is included in the same section. According to the local plan, each SELPA district receives IDEA and 602 allocations based on the percentage of the district’s total ADA. The same percentage represents the district’s responsibility for county offi ce programs.
Local plan Section 25 K provides more specifi c information regarding county offi ce funding. This section clarifi es the responsibility of the districts, regionalized programs and county offi ce for providing the full range of options required in the SELPA.
In the 2010-2011 school year, the district is responsible for 46.54% of the fi nal cost of county offi ce programs. This fi gure is based on the total percentage of district students, not the actual number or percentage of districts students attending county offi ce programs.
The district and SELPA indicated they are satisfi ed with the quality of the programs offered by county offi ce, but they believe the county offi ce overcharges for programs. The county offi ce includes in its yearly budget a 3% reserve for unforeseen costs. At the end of the year, the SELPA has a mechanism to determine how any unexpended county offi ce funds will be disbursed. Last year, these funds were distributed to the districts based on their percentages, and Fairfi eld-Suisun Unifi ed received $672,396.71 for 2008-09.
Twenty-three county offi ce classes and two countywide itinerant teachers for the deaf/hard of hearing are housed in the district. According to the county offi ce, 217 district students attend a county offi ce program in the district, and two attend a county offi ce program in another district. Because this count was prepared by hand, the actual numbers may be slightly different. County offi ce lists indicate that 294 students are served by county offi ce programs housed at Fairfi eld-Suisun Unifi ed; therefore, many classes include students from other districts.
If the district assumed responsibility for some or all the county offi ce classes housed in the district, it would still be responsible for its ADA percentage of fi nal county offi ce costs according to the current funding model for county offi ce programs. Transferring 23 classes would signifi -cantly reduce total county offi ce expenditures, but the district would still be responsible for its cost to operate classes as well as county offi ce costs. The SELPA local plan does not provide for a change in the funding model after a transfer of programs.
A specifi c breakdown of the district’s cost to operate classes was not completed; however, the following is provided as a general comparison of costs for county offi ce programs and the same programs operated by the district. For 2009-10 the amount projected as Fairfi eld-Suisun

FISCAL CRISIS & MANAGEMENT ASSISTANCE TEAM
34 C O S T E F F E C T I V E N E S S O F C O U N T Y A N D D I S T R I C T - O P E R A T E D P R O G R A M S
Unifi ed’s percentage of fi nal county offi ce costs is $5,295,959. Any portion of credit for 2009-10 has not been computed and will be returned to the district in the fall of 2010. The county offi ce’s cost does not refl ect the actual cost to support the 23 classes the district would transfer.
Using range three, step fi ve of the certifi cated salary schedule, teacher salaries for 23 classes would cost $1,597,527. Assuming two instructional aides per class at step three of the classifi ed salary schedule, aide salaries for those classes would cost $1,280,916. Therefore, the total cost to staff the 23 classes at the most basic level would be $2,878,443.
Under the current funding model, the district would not receive any additional 602 or IDEA revenue to operate these classes since the revenue is being distributed by the district’s total ADA. Additional revenue would be generated if out-of-district students in these programs remained and the district billed for these services. If 60 students in these classes were from outside the district, the cost per child would be $10,665, excluding any DIS services, at the SELPA’s current regional program rate for the PERL program. The total income from these students would be $639,900. The actual rate for these classes would not necessarily be that of the PERL class; however all rates are determined through the SELPA.
Base cost of staffi ng 23 classesPositions Total Cost
Teacher - $69,457. 23 $1,597,527
Instructional Aide- $27,846 46 $1,280,916
Total base cost $2,878,443
Out-of-District students 60 $ 639,900
Adjusted base costs $2,238,543
Fairfi eld’s percentage of Total SCOE costs 09-10
$5,988,099.
Although savings to the district appear signifi cant, there are two unknown factors. Under the current funding model, the district’s continued fi scal responsibility for county offi ce programs is unclear. Further, the district infrastructure would be affected if it assumed responsibility for the 23 county offi ce classes. This transfer would have an impact on every department. Some of the additional responsibilities for the various departments would include the following:
• The Business Department would have additional payroll for processing the newly hired staff members, billing to other districts for regional programs, billing for supplies and curriculum, and monitoring budgets
• The Human Resources Department would have additional responsibilities to recruit and hire additional certifi cated, classifi ed, and substitute positions; perform more evaluations; and monitor additional credentials.
• The Educational Services Department would perform additional testing and monitoring as well as provide appropriate curriculum and training.
• The Facilities Department would have to determine which county offi ce facilities belong to the county offi ce and which to the district, which were traded between the entities, and which classrooms require rental or purchase agreements. This may result in additional fi nancial costs to the district.
• The Maintenance Department would continue the daily maintenance of classrooms, and handle the more involved projects such as painting and repairs.
•
FAIRFIELD-SUISUN UNIFIED SCHOOL DISTRICT
35C O S T E F F E C T I V E N E S S O F C O U N T Y A N D D I S T R I C T - O P E R A T E D P R O G R A M S
• The Transportation Department would probably be affected the least since the district provides transportation to district students attending county offi ce classes in the district. The county offi ce would continue transporting students from outside the district to classes and transporting districts students to a regional or county offi ce programs outside the district.
• Site administrators would have additional time constraints in attending IEP meetings, disciplinary hearings, budgeting sessions for the classes, and evaluations.
The Special Education Department would be affected the most since an additional 200 to 300 students would require IEPs and program monitoring. Additional staff members may also be required to provide additional related services, including occupational therapists and behaviorists. Since the district provides speech therapy to many of these students, additional speech therapists may not be needed except as part of the county offi ce attrition plan, which is discussed in a later section of this report.
Some or all of the above departments would require additional staff members to complete the required tasks.
The district is also required to review and follow the regulations in Ed Code 56207(a), which state that a request for a program transfer must be requested a year and a day before it occurs. The code also stipulates the requirements of the two entities, including the rights of personnel.
RecommendationsThe district should:
1. Retain the current arrangement to provide service to special education students with no transfer of programs from the county offi ce.
2. Complete the following if and when it decides to transfer programs:
a. Determine the exact cost of classroom operation including teacher, aides, related services providers, materials and supplies.
b. Determine the exact cost of additional district offi ce staff to provide the appropriate level of support for the transferred classes.
c. Begin discussions at the SELPA to determine how county offi ce programs could be funded so that the district is not responsible for the district program operation and a percentage of county offi ce costs based on its ADA. These discussions should include consideration of the transfer’s impact on the SELPA member districts.
d. Begin discussion at the SELPA to determine how students from other districts who are in county offi ce programs could be served by the county offi ce or district when a transfer occurs.
e. Determine the negotiated amount to be billed for each out-of-district student based on the type of program.

FISCAL CRISIS & MANAGEMENT ASSISTANCE TEAM
36 C O S T E F F E C T I V E N E S S O F C O U N T Y A N D D I S T R I C T - O P E R A T E D P R O G R A M S
3. If a transfer is planned, inform the SELPA and county offi ce in writing of its intent to transfer programs at least one year and a day before it occurs. The district should also complete the following.
a. Develop a plan based on the requirements in Ed. Code 56207(a).
b. Begin holding meetings with the families that would be affected by the transfer to ensure they understand the process and their role.

FAIRFIELD-SUISUN UNIFIED SCHOOL DISTRICT
37E F F I C I E N C I E S F O R O V E R A L L D E L I V E R Y S Y S T E M
Effi ciencies for Overall Delivery System Interviews with teachers and support staff members from special education programs in the district, county offi ce and SELPA indicate these entities have a strong collaborative relationship to provide district and regional programs for students with disabilities. These programs represent a wide range of options for students.
However, the district can achieve greater effi ciency in service delivery. Until recently, the district has been reactive rather than proactive regarding program development. It lacks a program plan-ning process that includes analysis of trends and needs for students with disabilities over the next few years. Programs are developed in response to a crisis in student needs or as a result of a legal challenge.
The districts indicated that the SELPA controls enrollment in regional programs, and the lengthy placement process results in delays of necessary services. The district does not have appropriate interim placement options that it can use until regional programs and services are provided. Greater effi ciency in service delivery can be achieved by evaluating the referral and placement process for regional programs and creating interim district options to meet student needs if a delay occurs.
The district staff reported that instructional aides lack adequate training before assignment to special education classrooms. Staff development is imperative in special education because it saves money in the long run. Staff members could be provided with a predetermined and limited amount of release time for training. If this is impossible, the district could explore using courses such as those offered by the Los Angeles County Offi ce of Education Online Paraeducator Academy Courses. A list of courses is attached as Appendix A to this report.
The district has created a strong program component with four behavior specialists serving 75 students throughout the district. These specialists provide training to general education teachers and develop positive behavior plans for students and classrooms. This cutting-edge program design will expand the program options for students and increase effi ciency of program resources by reducing the need for costly out-of-district placements.
RecommendationsThe district should:
1. Develop long-range program planning by using data from the state and SELPA that outlines trends and changing needs in special education.
2. Continue the strong collaborative efforts with the county and SELPA to allow for future program options.
3. Consider working with the other SELPA member districts to develop a detailed and common method of charging staff, programs, revenue limit, etc.
4. Work closely with the SELPA to ensure that the referral and placement process facilitates the effi cient delivery of programs and services.
5. Create interim program options/alternatives that appropriately meet student needs if delays occur.

FISCAL CRISIS & MANAGEMENT ASSISTANCE TEAM
38 E F F I C I E N C I E S F O R O V E R A L L D E L I V E R Y S Y S T E M
6. Explore options for providing training for instructional aides before initial assign-ment in special education classrooms including the use of online or video training.
7. Continue to expand options for behavior specialists to support student retention in general education classrooms with appropriate behavioral training and supports.
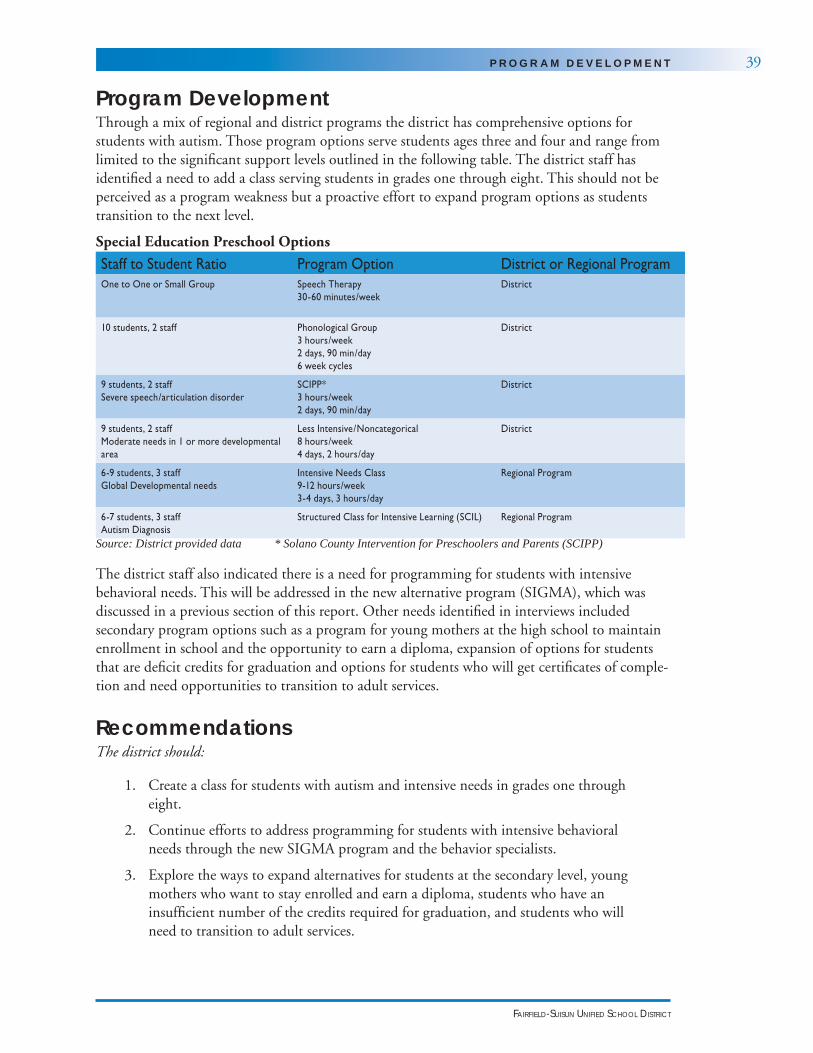
FAIRFIELD-SUISUN UNIFIED SCHOOL DISTRICT
39P R O G R A M D E V E L O P M E N T
Program DevelopmentThrough a mix of regional and district programs the district has comprehensive options for students with autism. Those program options serve students ages three and four and range from limited to the signifi cant support levels outlined in the following table. The district staff has identifi ed a need to add a class serving students in grades one through eight. This should not be perceived as a program weakness but a proactive effort to expand program options as students transition to the next level.
Special Education Preschool OptionsStaff to Student Ratio Program Option District or Regional ProgramOne to One or Small Group Speech Therapy
30-60 minutes/weekDistrict
10 students, 2 staff Phonological Group3 hours/week2 days, 90 min/day6 week cycles
District
9 students, 2 staffSevere speech/articulation disorder
SCIPP*3 hours/week2 days, 90 min/day
District
9 students, 2 staffModerate needs in 1 or more developmental area
Less Intensive/Noncategorical8 hours/week4 days, 2 hours/day
District
6-9 students, 3 staffGlobal Developmental needs
Intensive Needs Class9-12 hours/week3-4 days, 3 hours/day
Regional Program
6-7 students, 3 staffAutism Diagnosis
Structured Class for Intensive Learning (SCIL) Regional Program
Source: District provided data * Solano County Intervention for Preschoolers and Parents (SCIPP)
The district staff also indicated there is a need for programming for students with intensive behavioral needs. This will be addressed in the new alternative program (SIGMA), which was discussed in a previous section of this report. Other needs identifi ed in interviews included secondary program options such as a program for young mothers at the high school to maintain enrollment in school and the opportunity to earn a diploma, expansion of options for students that are defi cit credits for graduation and options for students who will get certifi cates of comple-tion and need opportunities to transition to adult services.
RecommendationsThe district should:
1. Create a class for students with autism and intensive needs in grades one through eight.
2. Continue efforts to address programming for students with intensive behavioral needs through the new SIGMA program and the behavior specialists.
3. Explore the ways to expand alternatives for students at the secondary level, young mothers who want to stay enrolled and earn a diploma, students who have an insuffi cient number of the credits required for graduation, and students who will need to transition to adult services.

FISCAL CRISIS & MANAGEMENT ASSISTANCE TEAM
40 P R O G R A M D E V E L O P M E N T

FAIRFIELD-SUISUN UNIFIED SCHOOL DISTRICT
41C O M P A R I S O N O F L O C A L C O N T R I B U T I O N W I T H O T H E R D I S T R I C T S
Comparison of Local Contribution with Other Districts The district has completed the maintenance of effort (MOE) and maintained the necessary local plan contribution as required by the state. Although the information in MOE is specifi ed, not every district computes each area in the same way. FCMAT did not perform an analysis of the MOE because there were no indications that it was not completed accurately. The following information is limited to how a district calculates its local contribution.
Districts take different approaches when considering special education local contribution. When any of the following occurs, it may appear that one district has a larger local contribution than another, but the two districts may actually be quite similar. A similar discussion of the local contribution is taking place throughout the state.
• One district may charge all the related services, such as the psychologists, speech therapists, and nurses to special education while another district divides the costs between general education and special education.
• One district may include special education transportation as a special education cost, while another district may not.
• One district may include the revenue limit while another district may not.
• One district may include the nonpublic school revenue limit while another may not.
• Other factors could also cause differences in MOE between districts.
The district requested information from several other SELPA districts regarding their local contribution and how they calculated their percentages, but information was received from only one district. The county offi ce Business Department provided the additional district information. The data supported the discrepancy issues discussed earlier and is not limited to this SELPA. As a result, it would not be appropriate to use this information to develop a comparison with Fairfi eld-Suisun Unifi ed.
It may be more important to determine whether a district’s local contribution changes from one year to another, whether the local contribution signifi cantly decreased, and whether the district continued to meet the required MOE.
FCMAT found that the district’s special education budget has continued to affect the general fund. Staff members indicated the data is determined in the same way from year to year.
District Local Contribution Over Th ree YearsYear Expenditures Local Contribution Percentage Local Contribution
08-09 $20,044,612 $ 8,134,449 40.58%
09-10 $21,872,297 $ 9,840,197 47.14%
10-11 $21,698,685 $11,799,598 54.38%
The staff indicated that one major reason for the increase in local contribution from 2008-09 to 2009-10 was a signifi cant change in benefi t calculations. Costs related to staff salaries, nonpublic schools and agency costs have also signifi cantly increased special education expenditures as is discussed in another section of this report.
Although the total expenditures projected for 2010-11 decreased because of a drop in projected revenue, the percentage of local contribution has increased. If projected revenue increases and expenditures are maintained at the budgeted level or decreased, the percentage of local contribu-tion will also decrease.

FISCAL CRISIS & MANAGEMENT ASSISTANCE TEAM
42 C O M P A R I S O N O F L O C A L C O N T R I B U T I O N W I T H O T H E R D I S T R I C T S
RecommendationsThe district should:
1. Consider developing a detailed and common method of charging staff, programs and revenue limit in conjunction with the SELPA.

FAIRFIELD-SUISUN UNIFIED SCHOOL DISTRICT
43S T A F F I N G R A T I O S / A D M I N I S T R A T I V E S T R U C T U R E
Staffi ng Ratios/Administrative Structure
Staffi ng RatiosThe Education Code does not indicate the maximum caseloads for special day classes (SDC); however, the educational consulting fi rm School Services of California Inc. (SSC) has established guidelines for recommended caseloads. SSC developed these guidelines using data it collected throughout the state.
A comparison of classifi ed and certifi cated staffi ng was completed by FCMAT. Caseloads for all classes were consistent with SSC guidelines and operate at the low end of enrollment. This will allow the district to manage growth in those classrooms effi ciently and effectively.
Classifi ed and Certifi cated Staffi ng Case Loads (Average)Classifi ed and Certifi cated Staffi ng Case Loads
Program Grade Level FTEs Aides Per Class (FTE)
Caseload Averages
*SSC Recommended Caseloads
Severely Disabled (DHH,ASD,ED)*Regional Classes
Elementary School 3 2 8 8-10
Middle School 2 2 10 8-10
High School 4 2 8 8-10
(PERL) K-12 9 1.3 7 8-10
Functional Academics K-12 10.0*** Avg 2 10 8-10
Noncategorical Elem 12.0 1 12 12-15
K-12 Resource Learning Center ElemMiddleHigh School
19.317.019.5
.5
.5
.5
2618****24
282828
Vocational High School 5.0 1.0 17 12-15
Adult RSP 2 .5 28 14
*School Services of CaliforniaNote: This table does not include one-to-one paraprofessionals**Deaf and hard of hearing (DHH) Autism spectrum disorder (ASD) Emotional disturbance (ED)*** 1.0 new functional academics class is scheduled but not open at this time**** The RSP numbers are lower at middle school due to a combination RSP/SDC programs at Range, Green Valley and Sullivan
Information published by the California Basic Educational Data System (CBEDS 2007-08) indicates that the ratio of psychologists to students in California school districts is one to 1,328. The district maintains a ratio of school psychologists to students of one to 1,100. Through a realignment of school psychologist duties, the district could establish a staffi ng ratio consistent with the CBEDS standard and redistribute three FTE resources to increasing support for the behavior specialists’ services and other areas where additional help is needed. However, 4 FTE psychologists are assigned to DIS psychology positions to support the PERL program. This is consistent with the Solano SELPA recommended staffi ng formula for PERL classes. When this staffi ng formula is considered, the district is adequately staffed at a ratio of approximately 1,300:1 (students to psychologists) and 4 FTE to support the PERL program.

FISCAL CRISIS & MANAGEMENT ASSISTANCE TEAM
44 S T A F F I N G R A T I O S / A D M I N I S T R A T I V E S T R U C T U R E
The state ratio of FTE nurses to students for 2008-09 is one to 2,219. The district maintains a ratio of nurses to students of one to 2,812.
Designated Instruction Services CaseloadsFCMAT used School Services Inc. guidelines to review the caseloads of speech therapists, occupational therapists and adapted physical education specialists. The following table provides the comparative data. FCMAT found that the district’s caseloads are within the SSC guidelines. The preschool is operating at a lower caseload level; however, this may be because of the intensive level of services for students with autism.
Comparison of District caseloads vs. SSC Guidelines
Caseloads District Schools Services, Inc
Adapted Physical Education 41.5 55
Occupational Therapy 34.0 35-45
Speech Therapy K-12 (51) Prek (28) K-12 (55) Prek (30)
Administrative StructureTo complete a comparative analysis of the administrative supports in the Special Education Department for the certifi cated and classifi ed staff, FCMAT focused on four school districts with a comparable enrollment, ethnicity index, Academic Performance Index (API) scores, largest ethnic group, and percentage of students receiving free and reduced lunch. The following table lists the school districts and comparable data.
Comparable Districts used for review of administrative structuresDistrict Enrollment Pupil Count Ethnicity
IndexAPI scores
Largest Ethnic Group
% Free and Reduced Lunch
Fairfi eld-Suisun Unifi ed 22,496 2332 66% 735 Hispanic 49.3%
Hayward Unifi ed 22,098 2276 50% 689 Hispanic 60%
Manteca Unifi ed 23,077 2133 55% 735 Hispanic 47%
Redlands Unifi ed 21,427 2393 53% 791 Hispanic 50.2%
Lake Elsinore Unifi ed 21,756 2386 48.5% 788 Hispanic 48.5%
Source: California Department of Education Dataquest 2008-09
Key:
Enrollment: K-12 enrollment in general education
Pupil Count: Students with disabilities ages 0-22
Ethnicity Index: Intended to measure how much “diversity” or “variety” a district has among ethnic group in its student population
API: Academic performance Index measures the academic performance and growth of schools based on a variety of tests and establishes a statewide ranking of schools according to those scores
Largest Ethnic Group: The ethnicity with the highest representation in the district
Free and Reduced Lunch: A program to provide food for students from low income families
The team gathered data from the four districts through the chief business offi cials. When no response was received, the information was gathered from district websites. The following table provides an overview of the number of administrative positions, and other areas of responsibility were included in some cases. Program specialists, managers, coordinators, lead speech therapists and school psychologists, compliance offi cers, and teachers on special assignment were placed in

FAIRFIELD-SUISUN UNIFIED SCHOOL DISTRICT
45S T A F F I N G R A T I O S / A D M I N I S T R A T I V E S T R U C T U R E
one administrative support category. The classifi ed staff was included although a breakdown of individual duties was not available.
Comparison of Certifi cated and Classifi ed Administrative Support Structures in the Special Education DepartmentsDistrict Certifi cated Administration Program Specialist, Managers or
CoordinatorsClassifi ed Support
Fairfi eld SuisunUnifi ed
1.0 Director, Special Education 3 Program Coordinators1 TOSA Workability
4.04.0
Hayward Unifi ed 1.0 Director, Special Education 1.0 Compliance Offi cer4.5 Program Specialists
5.5
Lake Elsinore Unifi ed 1.0 Executive Director, Special Education 1.0 Assistant Director1.0 Program Specialist1.0 Sr Asst Sp Ed
4.3
Manteca Unifi ed 1.0 Director, Student Services/ Special Education
2.0 Department Supervisors Special Education3.0 Program Specialists1.0 Lead Psychologist1.0 Lead Speech
2.0
Redlands Unifi ed 1.0 Director Special Education/Health Services 3 Coordinators 6.0
Average 1.0 Director 5.0 Program Specialists, Managers, Coordinators
5.0
Each district has one director of special education, and two of fi ve directors have additional departmental responsibilities. The average number of administrative support positions such as program specialists and managers is fi ve. Based on this comparative analysis, Fairfi eld Suisun Unifi ed is below the average level of administrative support positions at the program specialist/manager level.
District and school site staff members indicated in interviews that the Special Education Department is reactive rather than proactive in programming. Staff members stated that most of the director of special education’s time and resources are spent in due process, which limits the opportunity for program development and participation in district program improvement efforts.
The district should consider establishing a compliance offi cer position with duties that focus on due process and compliance. If resources from the reduction in school psychologist positions are used, no additional costs would be incurred in creating this position. While the director of special education should provide direction and support for mediated agreements and settlements, this additional position will provide the opportunity for the director to focus on program devel-opment.
Other concerns included the impact of 90 to 100 IEP meetings per year for students in nonpublic schools on the time and resources of the program specialists who serve as administra-tive designees. The redirection of one FTE school psychologist could assist with this function and allow program specialists to provide release time for more training and program support.
Clerical DutiesThe average number of clerical support positions in comparable districts is fi ve FTEs, and the district’s current level of clerical support is four FTEs. In 2008-09, district staffi ng in this area was reduced from fi ve FTEs to four, and based on the comparative data from other districts, Fairfi eld-Suisun Unifi ed is appropriately staffed. To help the district achieve greater effi ciency, FCMAT completed an in-depth analysis of the clerical duties in the special education offi ce. Each classifi ed staff member was asked to list the duties of his or her assignment and the

FISCAL CRISIS & MANAGEMENT ASSISTANCE TEAM
46 S T A F F I N G R A T I O S / A D M I N I S T R A T I V E S T R U C T U R E
percentage of time dedicated to each task. The results are shown in the following. The clerical staff was also interviewed by FCMAT.
Clerical Duties Task Analysis in the Special Education Department
Data Summary of Findings for Pie Chart:
• Seventy percent of the duties performed are appropriate for the Special Education Department.
• Seven percent are duplicated, reducing effi ciency.
• Eight percent would be performed by other departments in most districts.
CommunicationThe Special Education Department lacks a systematic method for managing phone calls from the district and general public. No general phone line is assigned to the department. The phone number posted with the SELPA and the district website is for the administrative secretary who supports the director of special education. As a result 15% of her day is spent receiving calls that could be redirected in the department. The staff indicated that most calls come from district staff members needing support.
Greater effi ciency could be achieved if a general outside line was established for the department. The staff reported that a line is available, but has not been used for that purpose. Once the general line is established, the clerical staff should establish a system for phone coverage, defi ning the order in which phone calls are handled and shared responsibility for this duty.
Duplication of EffortLarge special education departments have three areas of workfl ow that require organization and prioritization to maximize effi ciency. These are communication, the budget and personnel. The duties related to all three areas are assigned to two clerical staff positions, and there is frequent overlap and duplication of effort. The remaining clerical positions focus on managing student information and records.
The staff reported that some are areas such and Medi-Cal and ARRA budgets could be better organized and operate more effi ciently; however, time limitations prevent this from occurring. Next year, the director plans to create a self-sustaining clerical position to manage Medi-Cal and ARRA budgets and invoicing.
Communication
Duplication of Effort
Other Departments
Appropriate Duties
FAIRFIELD-SUISUN UNIFIED SCHOOL DISTRICT
47S T A F F I N G R A T I O S / A D M I N I S T R A T I V E S T R U C T U R E
Greater effi ciency could be achieved if the workfl ow for the budget and personnel was stream-lined, with the administrative secretary responsible for all items related to budget, invoices, coding etc., while the other administrative secretary focuses on personnel and staffi ng issues. A third area involves student information and programming, which should include the extended school year.
Tasks from Other DepartmentsThe Special Education Department is responsible for monitoring the status of cardiopulmonary resuscitation (CPR) and fi rst-aid training for 140 instructional aides. The department is required to track when renewals are due and notify employees of the pending status. In other districts, this is a function of the Human Resources Department. The district should determine whether this is an appropriate function for the clerical staff in the Special Education Department.
The staff indicated that 10% of each work day is spent arranging transportation for all special education students, including the extended school year. During the fi rst few weeks of school, as much as 30% of clerical time is spent in this function. In addition, a signifi cant amount of time is spent each day making follow up phone calls to parents who have unresolved issues related to student transportation. In a previous section, a recommendation was made for a staffi ng increase in transportation. This may help resolve many of the issues absorbed by the special education staff.
RecommendationsThe district should:
1. Maintain staffi ng formulas for SDC classes and resource learning centers as currently defi ned.
2. Monitor classroom enrollment and maintain classes at staffi ng ratios that are close to maximum. The district should make necessary program adjustment in mid-year if the enrollment in these classes is not consistent with the staffi ng formula.
3. Develop a systematic plan for managing general information phone calls from the district staff and the general public. An existing unused line should be used as the general information number, and the phone number listed in the SELPA and website directory should be changed to that of the general line rather than the administrative secretary’s line.
4. Divide the duties of the clerical staff into budget and personnel categories to avoid overlap and increase productivity.
5. Determine whether the Special Education Department should maintain responsi-bility for monitoring the CPR and fi rst aid certifi cations for instructional aides in the department.
6. Reinstate the one FTE in clerical support reduced in 2008-09 to align with districts of comparable size.

FISCAL CRISIS & MANAGEMENT ASSISTANCE TEAM
48 S T A F F I N G R A T I O S / A D M I N I S T R A T I V E S T R U C T U R E

FAIRFIELD-SUISUN UNIFIED SCHOOL DISTRICT
49M U LT I F U N D E D P O S I T I O N S
Multifunded Positions FCMAT reviewed Special Education Department’s multifunded positions and interviewed staff members regarding the criteria and process used to determine the percentage of positions charged to special education and general education. District psychologists and the nurses are multifunded with 80% charged to the general education and 20% charged to special education. The criteria used were based on the approximate amount of time services were provided in each department. This is an appropriate criterion to designate percentages for multifunded positions.
The criteria used are sometimes unclear according to district staff members. Questions remain about the two additional multifunded positions, the coordinator of student services (90% general education and 10% special education) and the statistical technician (90% general education 10% and special education). Greater openness regarding the criteria used in decisions regarding multifunded positions will assist in effi ciency. This can be facilitated through an annual review of multifunded position with department heads and the business offi ce.
RecommendationsThe district should:
1. Continue the process for determining the percentage of multifunded positions for the general and special education departments.
2. Ensure that the rationale for multifunded positions is clearly communicated with department heads.
3. Facilitate an annual discussion between the business offi ce and appropriate depart-ment heads regarding multifunded positions before the start of the school year.

FISCAL CRISIS & MANAGEMENT ASSISTANCE TEAM
50 M U LT I F U N D E D P O S I T I O N S

FAIRFIELD-SUISUN UNIFIED SCHOOL DISTRICT
51D U E P R O C E S S
Due ProcessThroughout interviews, many staff members voiced concerns that the Special Education Department is reactive rather than proactive. Staff also members indicated because of his involve-ment with due process and compliance complaints, the director of special education is diffi cult to access for program development and program improvement efforts. A review of due process fi lings, compliance complaints, and corrective actions ordered confi rmed that an inordinate amount of administrative time is required, which diverts energy and resources from proactive efforts.
In 2008-09, six compliance complaints were fi led by an advocate on behalf of students and one by the California Department of Education. The district was found out of compliance half the time, which led to corrective actions. In 2009-10, six more compliance complaints were fi led in which the district was found out of compliance and required to complete corrective actions. The compliance fi lings centered on the following two primary issues:
• The failure to provide the services outlined in the IEP
• Procedural problems related to the components of the IEP and independent evaluations
No comparative data is available from the California Department of Education on the number of complaints and/or corrective actions in districts across the state. The district should examine its internal procedures for monitoring the implementation of the programs and services in the IEP. This should help avoid the need for future fi lings.
During the 2008-09 school year, seven due process cases were fi led, all of them regarding the alleged denial of a free appropriate public education (FAPE). An additional six due process cases were fi led during the 2009-10 school year, fi ve cases over assessment and one case over the denial of FAPE.
The fundamental enforcement tool of the Individuals with Disabilities Improvement Act of 2004 (IDEA) is the right of parents or local school districts to fi le a complaint on any issue related to identifi cation, evaluation, educational placement or the provision of FAPE. The system was originally designed to protect the substantive rights of students with disabilities; however, IDEA has become the most frequently litigated educational statute, with FAPE being the primary issue.
No comparative data was available on the relationship between the number of due process fi lings and a district the size of Fairfi eld-Suisun; however, FCMAT believes that the number of requests is reasonable based on the collective experience of team members, As the district moves towards a redistribution of some of the resources outlined in the staffi ng section, greater emphasis can be placed on resolution of issues and concerns at the lowest level to avoid costly use of time and resources in formal complaint procedures. The department could benefi t from an additional staff position assigned as a compliance offi cer to handle the due process and compliance issues. This will provide the director of special education with the opportunity to focus on programmatic improvement and development.
FISCAL CRISIS & MANAGEMENT ASSISTANCE TEAM
52 D U E P R O C E S S
RecommendationsThe district should:
1. Establish fi rm procedures to ensure that the provision of services consistent with the IEP is monitored closely and corrected immediately in delays in service occur.
2. Use this opportunity to redistribute resources (outlined in the staffi ng section) and redistribute the duties for complaints and due process management. This should be accomplished to facilitate administrative focus on program development and district program improvement efforts.

FAIRFIELD-SUISUN UNIFIED SCHOOL DISTRICT
53F E E - F O R - S E R V I C E P R O C E S S
Fee-for-Service Process
Billing Regional ProgramsThrough the SELPA fi nance committee and governance body, the SELPA has developed guidelines on what a district can bill for and the amount the district can bill. The amounts are reviewed yearly and consider the staff ’s average salary and benefi ts, direct costs, and indirect costs of 5%, which is the same rate the county offi ce charges districts. The total amount is divided by typical enrollment for a cost per student. The revenue limit is deducted if appropriate, and the rate for a full year is calculated. Students are not billed on actual attendance but on days of enrollment and are billed at mid-year (December) with the balance at year-end (June).
Rates have been developed for preschool and elementary SCIL classes, PERL classes, adaptive physical education, vision, orientation and mobility, speech therapy, occupational therapy and behaviorist services.
The district bills other districts and the county offi ce when district staff members provide speech therapy in a county offi ce class for the deaf/hard of hearing, vision and orientation/mobility services, adaptive physical education in county offi ce classes, and the base rate for out-of-district students in the PERL regional classes. These services have been billed at the full SELPA rate.
The district has not billed the full amount possible for speech therapy, occupational therapy, vision, orientation and mobility, or behavior in the regional programs. Further, the district has not billed at all for speech therapy provided in other county offi ce classes. In 2007, the secretary responsible for billing received instructions indicating billing was based on enrollment and frequency/duration of services and not the full allowable SELPA rates. Therefore a detailed and laborious process was developed in which class lists were generated by the staff, IEPs were reviewed for enrollment date as well as frequency and duration of services, and a calculation was made using a percentage of the SELPA rate.
The district has a computerized IEP system that can generate reports to facilitate this process. In addition, if the full SELPA rates were used for billing rather than the frequency and duration of services, this time-consuming task will be much more manageable and profi table.
For example, an out-of-district student receiving speech therapy from a district speech therapist in a regional program could have been billed for $1,357 for a half-year program, but was billed for $75.35.
A recalculation of the billing for August to December 2009 resulted in a $28,120.41 increase in district revenue or $56,240.82 for a full year of services assuming that each of the students was enrolled for the entire half-year. The data is as follows:
Total possible amount billed for related services $31,690.00
Actual amount billed for related services $3,569.59
Increased revenue to district for ½ year of services $28,120.41
Increased revenue to district for a full year of services $56,240.82
The district has not billed the full amount possible for
speech therapy, occupational
therapy, vision, orientation
and mobility, or behavior in the regional programs.

FISCAL CRISIS & MANAGEMENT ASSISTANCE TEAM
54 F E E - F O R - S E R V I C E P R O C E S S
A query through the district’s computerized IEP provided a list of 80 students receiving speech therapy from a district therapist in a county offi ce class. This number may include approximately eight students that are billed because they attend a county offi ce program for the hard-of-hearing/deaf. The SELPA billing plan allows for speech therapy billing at the rate of $2,713 per year per child. Assuming that 70, not 80, students receive speech therapy from a district thera-pist, the district could bill the county offi ce for $189,910. This amount would be added to the overall cost of operating county offi ce programs. The district is responsible for 46.54% of fi nal county offi ce costs or in this case, $88,384.11 leaving $101,526 in additional revenue. The above described increases in speech therapist services revenue, along with the changes in other billing practices described earlier in this report could increase district revenue by $157,766.82. The data is as follows:
70 students receiving district speech therapy at $2713/student $189,910
46.54% district responsibility $88,384
Additional revenue for district $101,526
Additional revenue for corrected billing $56,240.82
Total yearly additional revenue $157,766.82
The county offi ce is reducing its number of therapists through attrition. When a speech therapist retires or resigns, the position is not fi lled, and the responsibility of providing those services falls on the districts. Because additional speech therapy positions are costly, it is even more important for the district to bill whenever possible to help offset costs.
RecommendationsThe district should:
1. Use the computerized IEP system to develop billing information for all out-of-district students in regional programs and include in this report all of these student-related services.
2. Bill at the full SELPA rate allowed for all out-of-district students in regional programs that related services instead of basing the rate on frequency and duration.
3. Use the computerized IEP system to develop billing information for all county offi ce students receiving speech therapy from district speech therapists and any other district providers.
4. Bill for these services at the SELPA allowable rates.

FAIRFIELD-SUISUN UNIFIED SCHOOL DISTRICT
55L I C E N S E D C A R E I N S T I T U T I O N S
Licensed Care Institutions
Licensed Care Institutions (Group Homes), Foster Family Homes and Adult Care Facilities Four licensed care institutions (LCIs) are within district boundaries, and eight district students are placed in these group homes. In comparison to other districts in the SELPA, Fairfi eld-Suisun Unifi ed reportedly has a higher proportional number of LCIs. This has a fi nancial impact on the district since students who require this level of support usually have more severe behavior, social and emotional needs that call for more intensive services. Having LCIs in the district creates factors and costs that are beyond the district’s control.
One adult facility is located in the district and serves one adult student. Information on this facility, such as the number of placements in foster family homes, is diffi cult to obtain because this information is usually not provided to educational institutions. The California Department of Social Services (CDSS) and the University of California at Berkeley Collaboration maintain a website that includes a Child Welfare Dynamic Report System. The website shows the total number of Children in the Child Welfare Supervised Foster Care System as of July 1, 2009. For Solano County, the total number of in-county and out-of-county placements is 402. Of these, 321 live in Solano County for a total of 79.9%. The number of placements in Solano County from other counties in California is 81. The following table shows additional details of in-county and out-of-county placements.
In-County and Out-of-County Placements
Solano County total number of students in Foster Care (In-County & Out-of-County Placements)
402
Number of In-County Solano Students 321
In-County Solano Percentage 79.9
Number of Students Placed in Solano From Other Counties 81
County Number of Students
Alameda 5
Butte 1
Calaveras 1
Contra Costa 10
Fresno 1
Madera 2
Napa 15
Nevada 1
Sacramento 12
San Joaquin 10
San Mateo 1
Shasta 3
Sonoma 3
Stanislaus 1
Tehama 2
Yolo 7
Out of State 6
Total 81

FISCAL CRISIS & MANAGEMENT ASSISTANCE TEAM
56 L I C E N S E D C A R E I N S T I T U T I O N S
RecommendationsThe district should:
1. Frequently monitor the impact of LCIs on the district and plan for dealing with the associated costs.
2. Keep in mind that the factors and costs associated with LCIs are sometimes beyond the district’s control.

FAIRFIELD-SUISUN UNIFIED SCHOOL DISTRICT
57A P P E N D I C E S
AppendicesA. Los Angeles County Offi ce of Education Online Paraeducator
Academy CoursesB. Study Agreement

FISCAL CRISIS & MANAGEMENT ASSISTANCE TEAM
58 A P P E N D I C E S

FAIRFIELD-SUISUN UNIFIED SCHOOL DISTRICT
59A P P E N D I C E S

FISCAL CRISIS & MANAGEMENT ASSISTANCE TEAM
60 A P P E N D I C E S

FAIRFIELD-SUISUN UNIFIED SCHOOL DISTRICT
61A P P E N D I C E S
FISCAL CRISIS & MANAGEMENT ASSISTANCE TEAM
62 A P P E N D I C E S

FAIRFIELD-SUISUN UNIFIED SCHOOL DISTRICT
63A P P E N D I C E S

FISCAL CRISIS & MANAGEMENT ASSISTANCE TEAM
64 A P P E N D I C E S

FAIRFIELD-SUISUN UNIFIED SCHOOL DISTRICT
65A P P E N D I C E S

FISCAL CRISIS & MANAGEMENT ASSISTANCE TEAM
66 A P P E N D I C E S