failure modes, effects and diagnostic analysis€¦ · safety engineering tools, detail product...
TRANSCRIPT

The document was prepared using best effort. The authors make no warranty of any kind and shall not be liable in any event for incidental or consequential damages in connection with the application of the document.
© All rights reserved.
Failure Modes, Effects and Diagnostic Analysis
Project: 8800C Vortex Flowmeter
Customer:
Rosemount Inc. Chanhassen, MN
USA
Contract No.: ROS 02/07-14 Report No.: ROS 02/07-14 R001
Version V2, Revision R1.0, September 2003 William M. Goble – John C. Grebe

© exida.com L.L.C. fmeda rosemount 8800c_v2.10, September 3, 2003 William M. Goble – John C. Grebe Page 2 of 15
Management summary This report summarizes the results of the Failure Modes, Effects, and Diagnostic Analysis (FMEDA) of the 8800C Vortex Flowmeter. A Failure Modes, Effects, and Diagnostic Analysis is one of the steps to be taken to achieve functional safety certification per IEC 61508 of a device. From the FMEDA, failure rates and Safe Failure Fraction are determined. The FMEDA that is described in this report concerns only the hardware of the PRODUCT, electronic and mechanical. For full functional safety certification purposes all requirements of IEC 61508 must be considered.
The 8800C Vortex Flowmeter is a 4 – 20 mA smart device. It contains self-diagnostics and is programmed to send it’s output to a specified failure state, either high or low upon internal detection of a failure.
The 8800C Vortex Flowmeter is classified as a Type B1 device according to IEC61508, having a hardware fault tolerance of 0. The analysis shows that the device has a safe failure fraction between 60 and 90% (assuming that the logic solver is programmed to detect over-scale and under-scale currents) and therefore may be used up to SIL 1 as a single device.
The failure rates for the 8800C Vortex Flowmeter are as follows:
λH = 75 * 10-9 failures per hour
λL = 352 * 10-9 failures per hour
λDU = 296 * 10-9 failures per hour
Table 1 lists the failure rates for 8800C Vortex Flowmeter according to IEC 61508, assuming that the logic solver can detect both over-scale and under-scale currents.
Table 1: Failure rates according to IEC 61508
Failure Categories λsd λsu* λdd λdu SFF
Low trip 352 FIT 344 FIT 75 FIT 296 FIT 72.3%
High trip 75 FIT 344 FIT 352 FIT 296 FIT 72.3%
(*Note that the SU category includes failures that do not cause a spurious trip)
A user of the 8800C Vortex Flowmeter can utilize these failure rates in a probabilistic model of a safety instrumented function (SIF) to determine suitability in part for safety instrumented system (SIS) usage in a particular safety integrity level (SIL). A full table of failure rates for different operating conditions is presented in section 4.5 along with all assumptions.
Type B component: “Complex” component (using micro controllers or programmable logic); for
details see 7.4.3.1.3 of IEC 61508-2.

© exida.com L.L.C. fmeda rosemount 8800c_v2.10, September 3, 2003 William M. Goble – John C. Grebe Page 3 of 15
Table of Contents
Management summary.................................................................................................... 2
1 Purpose and Scope................................................................................................... 4
2 Project management ................................................................................................. 5 2.1 exida.com.................................................................................................................... 5 2.2 Roles of the parties involved........................................................................................ 5 2.3 Standards / Literature used ......................................................................................... 5 2.4 Reference documents.................................................................................................. 6
2.4.1 Documentation provided by the customer......................................................... 6 2.4.2 Documentation generated by exida.com........................................................... 6
3 Product Description................................................................................................... 7
4 Failure Modes, Effects, and Diagnostics Analysis .................................................... 8 4.1 Description of the failure categories ............................................................................ 8 4.2 Methodology – FMEDA, Failure rates .......................................................................... 9
4.2.1 FMEDA.............................................................................................................. 9 4.2.2 Failure rates ...................................................................................................... 9
4.3 Assumptions ................................................................................................................ 9 4.4 Behavior of the safety logic solver ............................................................................. 10 4.5 Results....................................................................................................................... 11
5 Using the FMEDA results........................................................................................ 12 5.1 Converting failure rates to IEC 61508 format............................................................. 12 5.2 PFDAVG calculation 8800C Vortex Flowmeter............................................................. 13
6 Terms and Definitions ............................................................................................. 14
7 Status of the document ........................................................................................... 15 7.1 Liability....................................................................................................................... 15 7.2 Releases.................................................................................................................... 15 7.3 Future Enhancements ............................................................................................... 15 7.4 Release Signatures ................................................................................................... 15

© exida.com L.L.C. fmeda rosemount 8800c_v2.10, September 3, 2003 William M. Goble – John C. Grebe Page 4 of 15
1 Purpose and Scope Generally three options exist when doing an assessment of sensors, interfaces and/or final elements.
Option 1: Hardware assessment according to IEC 61508 Option 1 is a hardware assessment by exida.com according to the relevant functional safety standard(s) like DIN V VDE 0801, IEC 61508 or EN 954-1. The hardware assessment contains a FMEDA to determine the fault behavior and the different failure rates resulting in the Safe Failure Fraction (SFF) and the average Probability of Failure on Demand (PFDAVG). This option for pre-existing hardware devices shall provide the safety instrumentation engineer with the required failure data as per IEC 61508 / IEC 61511 and does not contain any software assessment.
Option 2: Hardware assessment with proven-in-use consideration according to IEC 61508 / IEC 61511 Option 2 is an assessment by exida.com according to the relevant functional safety standard(s) like DIN V VDE 0801, IEC 61508 or EN 954-1. The hardware assessment contains a FMEDA to determine the fault behavior and the different failure rates resulting in the Safe Failure Fraction (SFF) and the average Probability of Failure on Demand (PFDAVG). The option contains in addition an assessment of the proven-in-use demonstration of the device and its software including the modification process. This option for pre-existing programmable electronic devices shall provide the safety instrumentation engineer with the required failure data as per IEC 61508 / IEC 61511 and justify the reduced fault tolerance requirements of IEC 61511 for sensors, final elements and other PE field devices.
Option 3: Full assessment according to IEC 61508 Option 3 is a full assessment by exida.com according to the relevant application standard(s) like IEC 61511 or EN 298 and the necessary functional safety standard(s) like DIN V VDE 0801, IEC 61508 or EN 954-1. The full assessment extends option 1 by an assessment of all fault avoidance and fault control measures during hardware and software development. This option is most suitable for newly developed software based field devices and programmable controllers to demonstrate full compliance with IEC 61508 to the end-user.
This assessment shall be done according to option 1.
This document shall describe the results of the Failure Modes, Effects, and Diagnostic Analysis (FMEDA) of the 8800C Vortex Flowmeter. From these failure rates, the safe failure fraction (SFF) and example PFDAVG values are calculated.

© exida.com L.L.C. fmeda rosemount 8800c_v2.10, September 3, 2003 William M. Goble – John C. Grebe Page 5 of 15
2 Project management
2.1 exida.com
exida.com is one of the world’s leading knowledge companies specializing in automation system safety and availability with over 100 years of cumulative experience in functional safety. Founded by several of the world’s top reliability and safety experts from assessment organizations like TUV and manufacturers, exida.com is a partnership with offices around the world. exida.com offers training, coaching, project oriented consulting services, internet based safety engineering tools, detail product assurance and certification analysis and a collection of on-line safety and reliability resources. exida.com maintains a comprehensive failure rate and failure mode database on process equipment.
2.2 Roles of the parties involved
Rosemount Inc. Manufacturer of the 8800C Vortex Flowmeter
exida.com Project leader of the FMEDA
2.3 Standards / Literature used The services delivered by exida.com were performed based on the following standards / literature.
[N1] IEC 61508-2: 1999 Functional Safety of Electrical/Electronic/Programmable Electronic Safety-Related Systems
[N2] FMD-91 & FMD-97, RAC 1991, 1997
Failure Mode / Mechanism Distributions, Reliability Analysis Center. Statistical compilation of failure mode distributions for a wide range of components
[N3] NPRD-95, RAC 1995 Nonelectronic Parts Reliability Data, Reliability Analysis Center. Statistical compilation of failure rate data, incl. mechanical and electrical sensors
[N4] SN 29500 Failure rates of components
[N5] US MIL-STD-1629 Failure Mode and Effects Analysis, National Technical Information Service, Springfield, VA. MIL 1629.
[N6] Telcordia (Bellcore) Failure rate database and models
Statistical compilation of failure rate data over a wide range of applications along with models for estimating failure rates as a function of the application.
[N7] Safety Equipment Reliability Handbook, 2003
exida.com L.L.C, Safety Equipment Reliability Handbook, 2003, ISBN 0-9727234-0-4
[N8] Goble, W.M. 1998 Control Systems Safety Evaluation and Reliability, ISA, ISBN #1-55617-636-8. Reference on FMEDA methods

© exida.com L.L.C. fmeda rosemount 8800c_v2.10, September 3, 2003 William M. Goble – John C. Grebe Page 6 of 15
2.4 Reference documents
2.4.1 Documentation provided by the customer
[D1] 0880-7600, AG, July 21, 1999 Schematic Diagram, Vortex Sensor Board
[D2] 0880-7603, AC, May 6, 1999 Schematic Diagram, Vortex Output Board
[D3] 0880-7606, A, March 28, 1996 Schematic Diagram, Vortex Terminal Board
[D4] 0880-7609, A, June 26, 1996 Schematic Diagram Vortex LCD Board
[D5] ASIC-****, 0.3, March 23, 2001 Modac-3 Product Definition
[D6] ASIC-2069, 1.1, March 9, 2001 Edinburgh Vortex Sigma-Delta III ASIC SSD
[D7] ASIC-2067, 2.4, July 11, 2001 Vortex Digital Signal Processing with Embedded Coprocessor
2.4.2 Documentation generated by exida.com
[R1] Vortex.xls, September 17, 2002
System FMEDA, 8800C Vortex flowmeter
[R2] FMEDA 8800C _v1.doc, final, September 17, 2002
FMEDA report, 8800C Vortex flowmeter

© exida.com L.L.C. fmeda rosemount 8800c_v2.10, September 3, 2003 William M. Goble – John C. Grebe Page 7 of 15
3 Product Description The 8800C Vortex Flowmeter is a 4 – 20 mA smart device. The 8800C is most commonly used for gases, liquids and steam. The model includes a non-clogging sensor and an all-welded meter body that requires no process seals and purges fugitive emissions. The different devices can be equipped with or without display.
The 8800C Vortex Flowmeter is classified as a Type B2 device according to IEC61508, having a hardware fault tolerance of 0. It contains self-diagnostics and is programmed to send it’s output to a specified failure state, either high or low upon internal detection of a failure.
This flow meter features HART communication. The pulse output option is not recommended for safety applications. For safety instrumented systems usage it is assumed that the 4 – 20 mA output is used as the primary safety variable. All other possible output variants are not covered by this report.
Type B component: “Complex” component (using micro controllers or programmable logic); for
details see 7.4.3.1.3 of IEC 61508-2.
© exida.com L.L.C. fmeda rosemount 8800c_v2.10, September 3, 2003 William M. Goble – John C. Grebe Page 8 of 15
4 Failure Modes, Effects, and Diagnostics Analysis
The Failure Modes, Effects, and Diagnostic Analysis was done based on the documentation provided by Rosemount Inc. and is documented in [R1] and [R2]. When the effect of a certain failure mode could not be analyzed theoretically, the failure modes were introduced on component level and the effects of these failure modes were examined on system level.
4.1 Description of the failure categories
In order to judge the failure behavior of the 8800C Vortex Flowmeter, the following definitions for the failure of the product were considered.
Fail-Safe State State where output exceeds the user defined threshold.
Fail Safe Failure that causes the module / (sub)system to go to the defined fail-safe state without a demand from the process. Safe failures are divided into safe detected (SD) and safe undetected (SU) failures.
Fail Dangerous Failure that deviates the measured input state or the actual output by more than 2% of span and that leaves the output within active scale.
Fail Dangerous Undetected Failure that is dangerous and that is not being diagnosed by internal diagnostics.
Fail Dangerous Detected Failure that is dangerous but is detected by internal diagnostics (These failures may be converted to the selected fail-safe state).
Fail High Failure that causes the output signal to go to the maximum output current (> 21,5 mA, output saturate high)
Fail Low Failure that causes the output signal to go to the minimum output current (< 3,6 mA, output saturate low)
Fail No Effect Failure of a component that is part of the safety function but that has no effect on the safety function.
Annunciation Undetected Failure that does not directly impact safety but does impact the ability to detect a future fault (such as a fault in a diagnostic circuit) and that is not detected by internal diagnostics.
The failure categories listed above expand on the categories listed in [N1] which are only safe and dangerous, both detected and undetected. The reason for this is that, depending on the application, a Fail High or a Fail Low can either be safe or dangerous and may be detected or undetected depending on the programming of the logic solver. Consequently, during a Safety Integrity Level (SIL) verification assessment the Fail High and Fail Low failure categories need to be classified as either safe or dangerous.
The Annunciation Undetected failures are provided for those who wish to do reliability modeling more detailed than required by IEC61508. In IEC 61508 [N1] the No Effect and Annunciation Undetected failures are defined as safe undetected failures even though they will not cause the safety function to go to a safe state. Therefore they need to be considered in the Safe Failure Fraction calculation.

© exida.com L.L.C. fmeda rosemount 8800c_v2.10, September 3, 2003 William M. Goble – John C. Grebe Page 9 of 15
4.2 Methodology – FMEDA, Failure rates
4.2.1 FMEDA
A Failure Modes and Effects Analysis (FMEA) is a systematic way to identify and evaluate the effects of different component failure modes, to determine what could eliminate or reduce the chance of failure, and to document the system in consideration.
An FMEDA (Failure Mode Effect and Diagnostic Analysis) is an FMEA extension. It combines standard FMEA techniques with extension to identify online diagnostics techniques and the failure modes relevant to safety instrumented system design. It is a technique recommended to generate failure rates for each important category (safe detected, safe undetected, dangerous detected, dangerous undetected, fail high, fail low) in the safety models. The format for the FMEDA is an extension of the standard FMEA format from MIL STD 1629A, Failure Modes and Effects Analysis.
4.2.2 Failure rates
The failure rate data used by exida.com in this FMEDA is from a proprietary component failure rate database derived using the Telcordia (N6) failure rate database/models, the SN29500 (N4) failure rate database and other sources. The rates were chosen in a way that is appropriate for safety integrity level verification calculations. The rates were chosen to match operating stress conditions typical of an industrial field environment similar to IEC 645-1, Class C. It is expected that the actual number of field failures will be less than the number predicted by these failure rates.
The user of these numbers is responsible for determining their applicability to any particular environment. Accurate plant specific data may be used for this purpose. If a user has data collected from a good proof test reporting system that indicates higher failure rates, the higher numbers shall be used. Some industrial plant sites have high levels of stress. Under those conditions the failure rate data is adjusted to a higher value to account for the specific conditions of the plant.
4.3 Assumptions
The following assumptions have been made during the Failure Modes, Effects, and Diagnostic Analysis of the 8800C Vortex Flowmeter.
• Only a single component failure will fail the entire product
• Failure rates are constant, wear out mechanisms are not included.
• Propagation of failures is not relevant.
• All components that are not part of the safety function and cannot influence the safety function (feedback immune) are excluded.
• The HART protocol is only used for setup, calibration, and diagnostics purposes, not for safety critical operation.
• The application program in the logic solver is constructed in such a way that Fail High and Fail Low failures are detected regardless of the effect, safe or dangerous, on the safety function.
© exida.com L.L.C. fmeda rosemount 8800c_v2.10, September 3, 2003 William M. Goble – John C. Grebe Page 10 of 15
• The stress levels are average for an industrial environment and can be compared to the Ground Fixed classification of MIL-HNBK-217F. Alternatively, the assumed environment is similar to:
o IEC 645-1, Class C (sheltered location) with temperature limits within the manufacturer’s rating and an average temperature over a long period of time of 40ºC. Humidity levels are assumed within manufacturer’s rating.
• External power supply failure rates are not included.
4.4 Behavior of the safety logic solver
Depending on the application, the following scenarios are possible:
• Low Trip: the safety function will go to the predefined fail-safe state when the process value below a predefined low set value. A current < 3.6mA (Fail Low) is below the specified trip-point.
• High Trip: the safety function will go to the predefined fail-safe state when the process value exceeds a predefined high set value. A current > 21.5mA (Fail High) is above the specified trip-point.
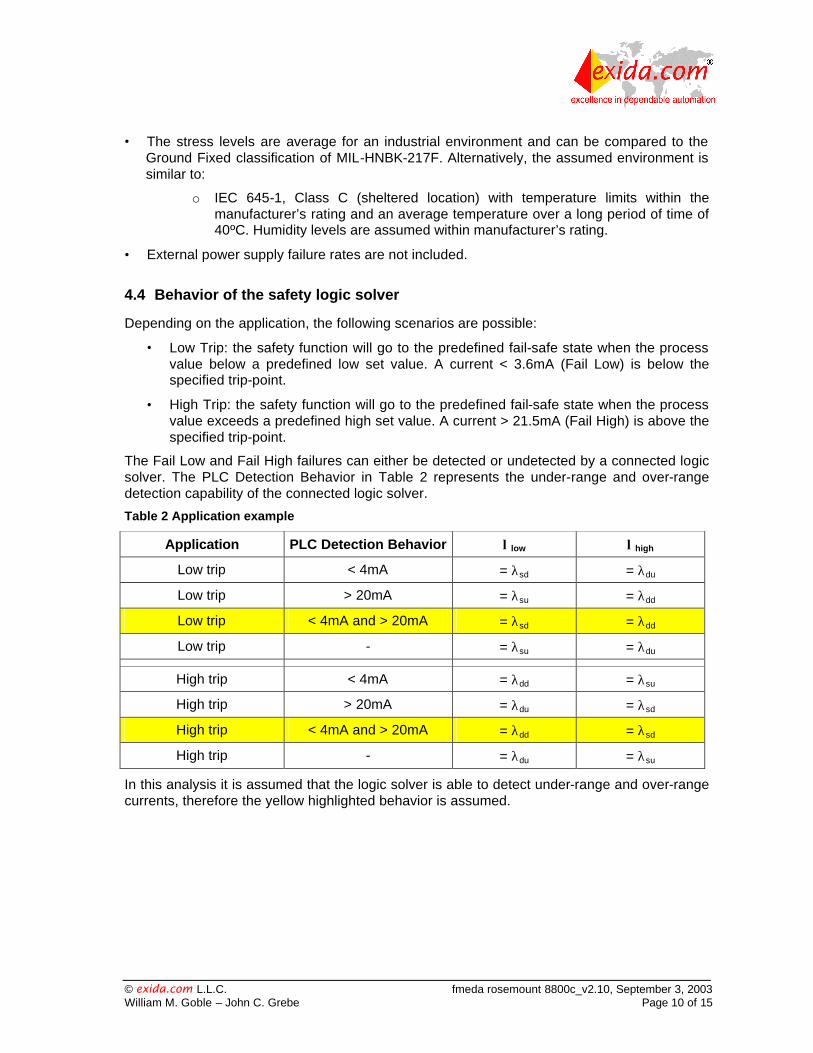
The Fail Low and Fail High failures can either be detected or undetected by a connected logic solver. The PLC Detection Behavior in Table 2 represents the under-range and over-range detection capability of the connected logic solver.
Table 2 Application example
Application PLC Detection Behavior λlow λhigh
Low trip < 4mA = λsd = λdu
Low trip > 20mA = λsu = λdd
Low trip < 4mA and > 20mA = λsd = λdd
Low trip - = λsu = λdu
High trip < 4mA = λdd = λsu
High trip > 20mA = λdu = λsd
High trip < 4mA and > 20mA = λdd = λsd
High trip - = λdu = λsu
In this analysis it is assumed that the logic solver is able to detect under-range and over-range currents, therefore the yellow highlighted behavior is assumed.

© exida.com L.L.C. fmeda rosemount 8800c_v2.10, September 3, 2003 William M. Goble – John C. Grebe Page 11 of 15
4.5 Results
Using reliability data extracted from the exida.com component reliability database the following failure rates resulted from the 8800C Vortex Flowmeter FMEDA.
Table 3 Failure rates 8800C Vortex Flowmeter
Failure category Failure rate (in FITs)
Fail High (detected by the logic solver) 75
Fail Low (detected by the logic solver) 352
Fail detected (int. diag.) 310
Fail low (inherently) 42
Fail Dangerous Undetected 296
No Effect 344
Annunciation Undetected 0
It is assumed that upon the detection of a failure the output will be sent downscale, all detected failure categories are sub-categories of the fail low failure category.
According to IEC 61508 [N1], the Safe Failure Fraction (SFF) of the 8800C Vortex Flowmeter should be calculated. The SFF is the fraction of the overall failure rate of a device that results in either a safe fault or a diagnosed unsafe fault. As both the Fail High and Fail Low failure categories are assumed to be detected by the logic solver (regardless of the fact if their effect is safe or dangerous), the Safe Failure Fraction can be calculated independently of the 8800C Vortex Flowmeter application.
This is reflected in the following formulas for SFF:
SFF = 1 – λdu / λtotal
Note that according to IEC61508 definition the No Effect and Annunciation Undetected failures are classified as safe and therefore need to be considered in the Safe Failure Fraction calculation and are included in the total failure rate.
Table 4 Safe Failure Fraction of 8800C Vortex Flowmeter
8800C Vortex Flowmeter SFF
8800C Vortex Flowmeter 72.3%
The architectural constraint type for 8800C Vortex Flowmeter is B. The SFF and required SIL determine the level of hardware fault tolerance that is required per requirements of IEC 61508 [N1] or IEC 61511. The SIS designer is responsible for meeting other requirements of applicable standards for any given SIL as well.
© exida.com L.L.C. fmeda rosemount 8800c_v2.10, September 3, 2003 William M. Goble – John C. Grebe Page 12 of 15
5 Using the FMEDA results
5.1 Converting failure rates to IEC 61508 format
The failure rates that are derived from the FMEDA for the 8800C Vortex Flowmeter are in a format different from the IEC 61508 format. This section will explain how the failure rates can be converted into the IEC 61508 format.
First of all, depending on the application, the high and low failure rates of the 8800C Vortex Flowmeter must be classified as either safe or dangerous. Assume an application where a safety action needs to be performed if the flow in a pipe drops below a certain level. The 8800C Vortex Flowmeter will therefore be configured with a low trip level. A low failure of the transmitter will cause the transmitter output to go through the low trip level. Consequently the transmitter will indicate that the safety action needs to be performed. Therefore a low failure can be classified as a safe failure for this application. A high failure on the other hand will cause the transmitter output to move away from the trip level and therefore not cause a trip. The failure will prevent the transmitter from indicating that the safety action needs to be performed and is therefore classified as a dangerous failure for this application.
Assuming that the logic solver can detect both over-range and under-range, a low failure can be classified as a safe detected failure and a high failure can be classified as a dangerous detected failure. For this application the following would then be the case:
λH = λDD = 75 * 10-9 failures per hour
λL = λSD = 352 * 10-9 failures per hour
λDU = 296 * 10-9 failures per hour
In a similar way the high and low failure rates can be classified as respectively safe detected and dangerous detected in case the application has a high trip level. The failure rates as displayed above are the same failure rates as stored in the exida.com equipment database that is part of the online SIL verification tool, SILver.
Furthermore the No Effect failures and Annuncation Undetected failure are classified as Safe Undetected failures according to IEC 61508. Note that these failures will not affect system reliability or safety, and should not be included in spurious trip calculations.
Note that the dangerous undetected failures will of course remain dangerous undetected.
© exida.com L.L.C. fmeda rosemount 8800c_v2.10, September 3, 2003 William M. Goble – John C. Grebe Page 13 of 15
5.2 PFDAVG calculation 8800C Vortex Flowmeter
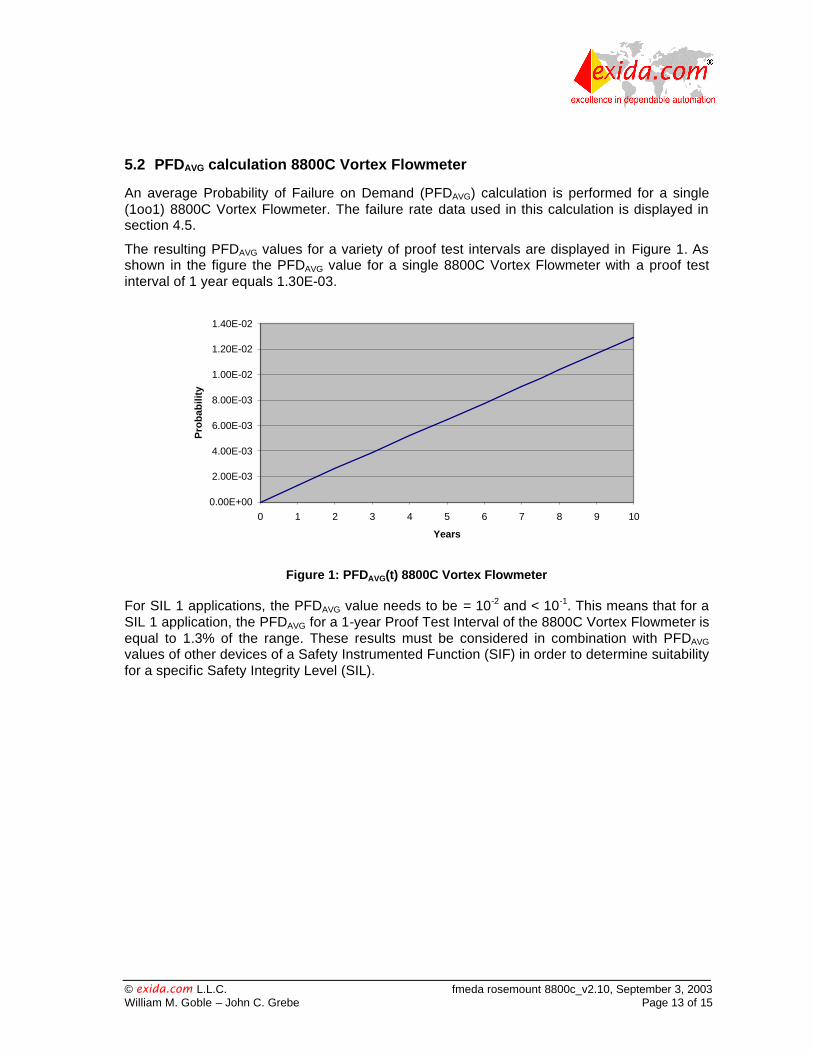
An average Probability of Failure on Demand (PFDAVG) calculation is performed for a single (1oo1) 8800C Vortex Flowmeter. The failure rate data used in this calculation is displayed in section 4.5.
The resulting PFDAVG values for a variety of proof test intervals are displayed in Figure 1. As shown in the figure the PFDAVG value for a single 8800C Vortex Flowmeter with a proof test interval of 1 year equals 1.30E-03.
Figure 1: PFDAVG(t) 8800C Vortex Flowmeter
For SIL 1 applications, the PFDAVG value needs to be = 10-2 and < 10-1. This means that for a SIL 1 application, the PFDAVG for a 1-year Proof Test Interval of the 8800C Vortex Flowmeter is equal to 1.3% of the range. These results must be considered in combination with PFDAVG values of other devices of a Safety Instrumented Function (SIF) in order to determine suitability for a specific Safety Integrity Level (SIL).
0.00E+00
2.00E-03
4.00E-03
6.00E-03
8.00E-03
1.00E-02
1.20E-02
1.40E-02
0 1 2 3 4 5 6 7 8 9 10
Years
Pro
bab
ility

© exida.com L.L.C. fmeda rosemount 8800c_v2.10, September 3, 2003 William M. Goble – John C. Grebe Page 14 of 15
6 Terms and Definitions
FIT Failure In Time (1x10⁻⁹ failures per hour)
FMEDA Failure Mode Effect and Diagnostic Analysis
HART Highway Addressable Remote Transducer HFT Hardware Fault Tolerance
Low demand mode Mode, where the frequency of demands for operation made on a safety-related system is no greater than one per year and no greater than twice the proof test frequency.
PFDAVG Average Probability of Failure on Demand SFF Safe Failure Fraction summarizes the fraction of failures, which lead to
a safe state and the fraction of failures which will be detected by diagnostic measures and lead to a defined safety action.
SIF Safety Instrumented Function SIL Safety Integrity Level
SIS Safety Instrumented System – Implementation of one or more Safety Instrumented Functions. A SIS is composed of any combination of sensor(s), logic solver(s), and final element(s).
Type A component “Non-Complex” component (using discrete elements); for details see 7.4.3.1.3 of IEC 61508-2
Type B component “Complex” component (using micro controllers or programmable logic); for details see 7.4.3.1.3 of IEC 61508-2

© exida.com L.L.C. fmeda rosemount 8800c_v2.10, September 3, 2003 William M. Goble – John C. Grebe Page 15 of 15
7 Status of the document
7.1 Liability
exida.com prepares FMEDA reports based on methods advocated in International standards. Failure rates are obtained from a collection of industrial databases. exida.com accepts no liability whatsoever for the use of these numbers or for the correctness of the standards on which the general calculation methods are based.
7.2 Releases
Version: V0 Revision: R1.0 Version History: V0, R1.0: Draft report September 17, 2002 V1, R1.0 Initial release September 17, 2002 V2, R1.0 Updated format, September 08, 2003 Authors: William M. Goble – John C. Grebe Review: V0, R1.0 William M. Goble V2, R1.0 Rachel Amkreutz September 05, 2003 Release status: Released to client
7.3 Future Enhancements
At request of client.
7.4 Release Signatures