factsheet on finalised cases of financial misconduct … › documents › 2013 › factsheet...
TRANSCRIPT

FACTSHEET ON FINALISED CASES
OF FINANCIAL MISCONDUCT FOR
THE 2012/2013 FINANCIAL
YEAR
TROUCTION NTRODU

2
I TABLE OF CONTENTS
INTRODUCTION AND BACKGROUND 4
OBJECTIVES OF THE STUDY
4
METHODOLOGY
5
STATISTICAL OVERVIEW
5
(a) Total number of finalised cases of financial misconduct reported by national and
provincial departments for the 2012/2013 financial year
5
(b) Total number of finalised cases of financial misconduct reported by national
departments for the 2012/2013 financial year
6
(c) Total number of finalised cases of financial misconduct reported by provincial
departments for the 2012/2013 financial year
7
(d) Types of financial misconduct cases reported by national and provincial
departments
7
(e) Levels of employees charged with financial misconduct 8
(f) Outcome of financial misconduct cases 9
(g) Sanctions imposed in cases of financial misconduct 11
(h) Amount of money involved in financial misconduct cases reported by national
and provincial departments
12
(i) Criminal proceedings instituted against employees charged with financial
misconduct
13
TRENDS ANALYSIS OF CASES OF FINANCIAL MISCONDUCT REPORTED FOR
THE FINANCIAL YEARS 2009/2010 TO THE 2012/2013
14
(a) Decrease in financial misconduct cases for the 2012/2013 financial year 14
(b) Increase in cases in the categories “fraud and theft” 15
(c) High number of SMS members charged with financial misconduct 15
(d) Increase in the percentage of employees found guilty of financial misconduct 16
(e) Comparison of sanctions imposed in the Public Service 16
(f) Decrease in the amount of money involved in financial misconduct 17
(g) Decrease in criminal proceedings instituted in cases of financial misconduct 18
(h) Recovery of money lost through financial misconduct 18
CASES OF FINANCIAL MISCONDUCT NOT FINALISED AS AT 31 MARCH 2013
19
(a) Total number of cases of financial misconduct reported by national and provincial
departments as not finalised by 31 March 2013
19
(b) Types of financial misconduct cases reported by national and provincial
departments as not finalised as at 31 March 2013
21
CONCLUSION
21

3
Appendix A: List of the 21 national departments that submitted a nil return 23
Appendix B: List of the 48 provincial departments that submitted a nil return 24
Appendix C: Breakdown of financial misconduct cases reported by provincial
departments
26
Appendix D: Breakdown of the amount of money involved in financial
misconduct cases reported by national departments
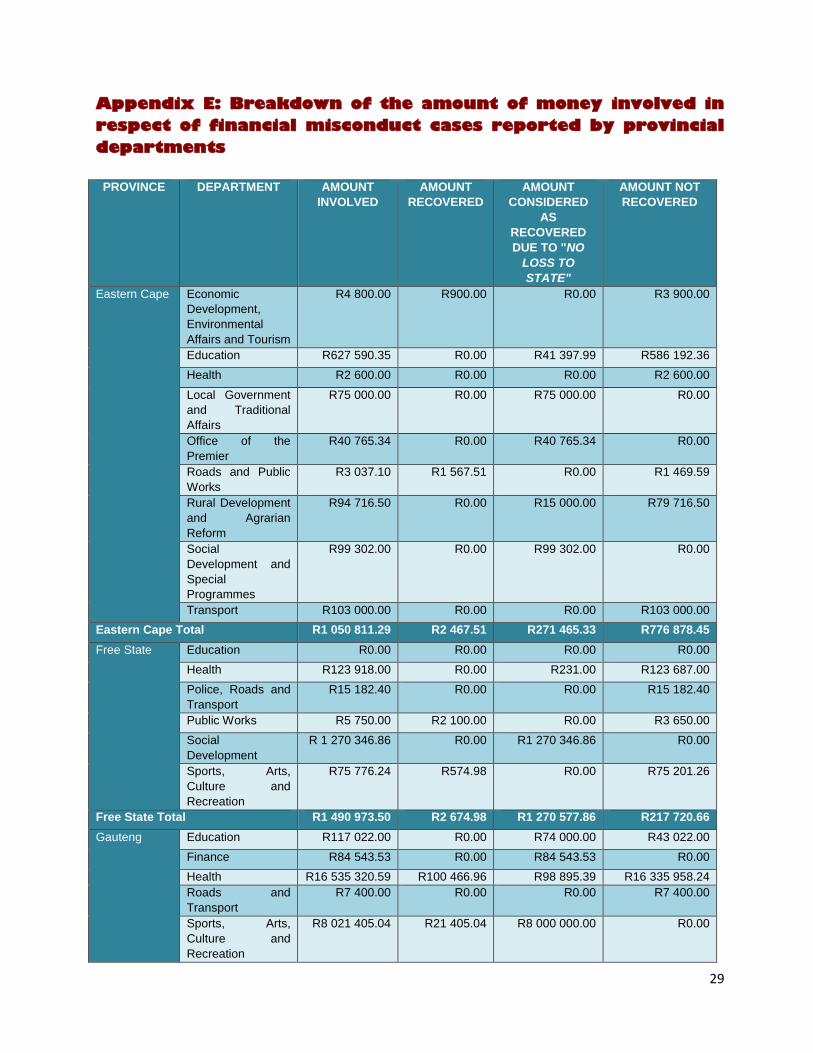
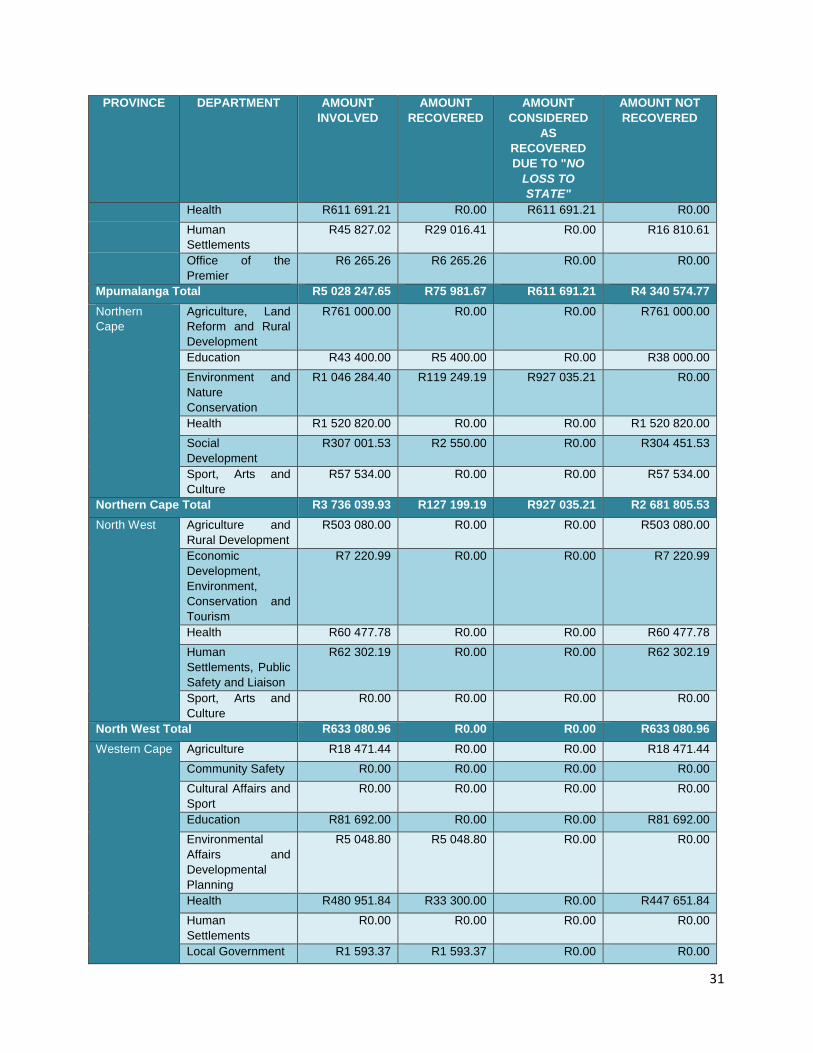
Appendix E: Breakdown of the amount of money involved in financial
misconduct cases reported by provincial departments
Appendix F: Breakdown of the Provincial departments which reported that the
full amount involved in respect of financial misconduct was
either recovered/considered no loss to the State/ or there was
a combination of recovered and no loss to the state
28
29
33

4
INTRODUCTION AND BACKGROUND
The Public Finance Management Act, 1999 (PFMA)1, read with Chapter 4 of the Treasury
Regulations, 20022, compels all Public Service departments to report on finalised cases of
financial misconduct to, amongst others, the Public Service Commission (PSC).
The PSC has since the 2001/2002 financial year, published reports on finalised cases of
financial misconduct to give effect to its constitutional mandate, which, amongst others, is to
investigate, monitor and evaluate the organisation and administration, and the personnel
practices of the Public Service and also the above-mentioned legislative framework. The
PSC’s reports on financial misconduct have served as a tool for Parliament, the provincial
Legislatures and departments, to monitor financial misconduct in the Public Service and to put
measures in place to minimise financial misconduct and to eradicate the Public Service of
corruption.
This Factsheet on finalised cases of Financial Misconduct for the 2012/2013 financial year
comprises of statistical information on finalised cases of financial misconduct reported by
national and provincial departments for the 2012/2013 financial year and includes trends
analysis of finalised cases of financial misconduct reported by national and provincial
departments for the 2009/2010, 2010/2011, 2011/2012 and 2012/2013 financial years.
According to the Treasury Regulations, 2002, an Accounting Officer must as soon as a
disciplinary case on financial misconduct is completed, report to amongst others the PSC.
Thus, the PSC has over the past financial years, reported on finalised cases of financial
misconduct. However, for the 2012/2013 financial year, in order to monitor the time taken by
departments to finalise financial misconduct cases, the PSC increased its scope on the
reporting of financial misconduct to include cases that were not finalised as at 31 March 2013.
This Factsheet thus also includes a statistical overview of the cases of financial misconduct
that were reported by national and provincial departments as not finalised as at 31 March
2013.
OBJECTIVES OF THE STUDY
The objectives of the Factsheet on Finalised Cases of Financial Misconduct for the 2012/2013
financial year were to:
provide a statistical overview of finalised cases of financial misconduct reported by
national and provincial departments for the 2012/2013 financial year;
provide trends analysis of cases reported since the 2009/2010 financial year; and
provide a statistical overview of cases of financial misconduct that were reported by
national and provincial departments as not finalised as at 31 March 2013.
1 Republic of South Africa. The Public Finance Management Act No.1 of 1999.
2 Republic of South Africa. Treasury Regulations, 2002 published in Government Gazette No 23463 dated 25 May 2002.
5
METHODOLOGY
The following methodology was followed in the execution of the project:
A circular was forwarded to all national and provincial departments reminding them to
submit reports on finalised cases of financial misconduct for the 2012/2013 financial
year to the PSC. The formats for reporting financial misconduct were forwarded to
departments and also up-loaded on the PSC’s Website.
Telephonic follow-ups were made with departments to confirm receipt of the circular.
On expiry of the due date for inputs, which was 28 June 2013, follow-ups were made
telephonically as well as through electronic mail with departments that did not submit
their reports by the due date.
Reports on finalised cases of financial misconduct from departments were captured
onto a database. In instances where the report was unclear or incomplete information
was provided, follow-up enquiries were made with the respective departments.
Information was analysed and this “Factsheet on Finalised Cases of Financial
Misconduct for the 2012/2013 Financial Year” was compiled.
STATISTICAL OVERVIEW
(a) Total number of finalised cases of financial misconduct
reported by national and provincial departments for
the 2012/2013 financial year
There has been 100% compliance by all national and provincial departments in submitting
reports on finalised cases of financial misconduct for the 2012/2013 financial year to the PSC,
as required by the PFMA3 and the Treasury Regulations4. Departments were requested to
ensure that the reports were signed off by the accounting officer prior to it being submitted to
the PSC. Despite the request, the following departments submitted reports that were not
signed off by the respective accounting officer:
PROVINCE DEPARTMENT
Eastern Cape Province Education
Local Government and Traditional Affairs
Office of the Premier
Transport
North West Province
Economic Development, Environment Conservation
and Tourism
Education and Training
Finance
3 Republic of South Africa. The Public Finance Management Act No.1 of 1999.
4 Republic of South Africa. Treasury Regulations, 2002 published in Government Gazette No 23463 dated 25 May 2002.

6
PROVINCE DEPARTMENT
Health
Local Government and Traditional Affairs
Office of the Premier
Public Works, Roads and Transport
Social Development, Women, Children and People
with Disabilities
Sport, Arts and Culture
Northern Cape Health
A total of 807 finalised cases of financial misconduct were reported by national and provincial
departments for the 2012/2013 financial year. Of the 43 national departments, 21 departments
submitted a “nil return”. A “nil return” means that the department reported that no financial
misconduct cases were finalised in the 2012/2013 financial year. With regard to provincial
departments, 48 of the 112 departments submitted a “nil return”. These findings suggest that
departments either do not have the capacity to investigate and finalise cases of financial
misconduct or they do not regard prioritisation of the investigation of such cases as a strategic
matter. Appendix A provides a list of the 21 national departments that submitted a “nil return”.
Appendix B provides a list of the 48 provincial departments that submitted a “nil return”.
Figure 1 below shows that of the 807 cases of finalised financial misconduct reported, 236
(29.2%) were reported by national
departments and 571 (70.8%) were
reported by provincial departments.
Figure 1: Total number of finalised cases of financial misconduct reported by the national and provincial departments for the 2012/2013 financial year
(b) Total number of finalised cases of financial misconduct
reported by national departments for the 2012/2013
financial year
Table 1 below shows that of the 236 finalised
cases of financial misconduct reported by
national departments for the 2012/2013
financial year, the Department of Police
(South African Police Services [SAPS])
reported the highest number of cases 72
(30.5%). The Department of Social
Development reported the second highest
number of cases 42 (17.8%), followed by the
Department of Defence with 30 cases
(12.7%).
NATIONAL DEPARTMENTS NO. OF CASES
Police (SAPS) 72
Social Development 42
Defence 30
Rural Development and Land Reform
17
Public Works 14
Correctional Services 10
Labour
9
236
571
National Provincial

7
The following departments finalised the
lowest number of cases in the 2012/2013
financial year, with one case each:
Cooperative Governance
Energy
Government Communication and
Information Systems (GCIS)
Independent Police Investigative
Directorate (IPID)
Mineral Resources
Science and Technology
Trade and Industry
(c) Total number of finalised cases of financial misconduct
reported by provincial departments for the 2012/2013
financial year
Figure 2 below shows that of the 571 finalised cases of financial misconduct reported by the
provincial departments for the
2012/2013 financial year, the
Gauteng Province reported the
highest number of cases 189 (33.1%).
The Western Cape Province reported
the second highest number of cases
105 (18.4%), followed by KwaZulu-
Natal Province which reported 80
(14%) cases. The Mpumalanga
Province reported the least number of
cases of 16 (2.8%). Appendix C
provides a breakdown of the 571
finalised cases of financial
misconduct reported by each
provincial department for the
2012/2013 financial year.
(d) Types of financial misconduct cases reported by
national and provincial departments
Treasury Regulations 4.3.15 stipulate that departments must, amongst others, report on the
type of financial misconduct the official is alleged to have committed. The PSC catergorised
the types of financial misconduct cases reported by departments for statistical purposes.
5 Republic of South Africa. Treasury Regulations, 2002 published in Government Gazette No 23463 dated 25 May 2002.
NATIONAL DEPARTMENTS NO. OF CASES
National Prosecuting Authority 9
Home Affairs 8
Statistics South Africa 5
Environmental Affairs 3
Health 3
Water Affairs 3
Higher Education and Training 2
DoJCD 2
Cooperative Governance 1
Energy 1
GCIS 1
IPID 1
Mineral Resources 1
Science and Technology 1
Trade and Industry 1
Table 1: Number of finalised cases of financial misconduct reported per national department
0
50
100
150
200
Ga
ute
ng
We
ste
rn C
ap
e
Kw
aZ
ulu
-Nata
l
Ea
ste
rn C
ap
e
Lim
pop
o
Nort
h W
est
Fre
e S
tate
No
rthe
rn C
ap
e
Mp
um
ala
ng
a
189
105
8059
35 33 30 24 16
Num
be
r o
f ca
se
s
Province
Figure 2: Number of finalised cases of financial misconduct
reported by provincial departments

8
Table 2 below reflects the categories of financial misconduct and description of cases
reported by departments that fall into such categories.
Table 2: Description of the types of financial misconduct cases categorised by the PSC
Figure 3 shows that of the 807 cases
of finalised financial misconduct
reported by national and provincial
departments for the 2012/2013
financial year, “Theft” was the type of
financial misconduct with the highest
number of cases 225 (27.9%). This
was followed by “Fraud” with 209
(25.9%) cases and “Financial
mismanagement” with 157 (19.5%)
cases. The type of financial
misconduct with the least number of
cases reported was “Corruption” with
14 (1.7%) cases. Figure 3: Types of financial misconduct cases reported by
both national and provincial departments for the 2012/2013
financial year
(e) Levels of employees charged with financial misconduct
Treasury Regulations 4.3.17, stipulate that departments must report on, amongst others, the
ranks of the employees that have been charged with financial misconduct. Due to the
different rank designations in departments, the PSC requested departments to indicate the
salary levels of employees instead of ranks, for statistical purposes.
6 Republic of South Africa. Prevention and Combating of Corrupt Activities Act, No 12 of 2004.
7 Republic of South Africa. Treasury Regulations, 2002 published in Government Gazette No 23463 dated 25 May 2002.
TYPE DESCRIPTION
Corruption For a comprehensive description of corruption, refer to the
Prevention and Combating of Corrupt Activities Act, 20046.
Fraud The unlawful and intentional making of a misrepresentation which
causes actual and/or potential prejudice to another.
Financial Mismanagement Expenditure other than unauthorised expenditure, incurred in
contravention of, or that is not in accordance with a requirement of
any applicable legislation.
Theft The unlawful taking with the intent to steal something which is prone
to being stolen.
Misappropriation and abuse The wrongful, improper or excessive use of public funds and/or
assets in a person’s care.
Gross negligence Any act or omission without considering the consequences thereof.
0
50
100
150
200
250
Th
eft
Fra
ud
Fin
an
cia
lm
ism
an
ag
em
en
t
Mis
ap
pro
pri
atio
na
nd
abu
se
Gro
ss n
eg
lige
nce
Corr
uption
225 209
157123
79
14
Num
be
r o
f ca
se
s
Types of financial misconduct

9
Figure 4 below shows that of the 807 cases of financial misconduct reported by national and
provincial departments, 541
(66.7%) cases were reported in
respect of salary levels 1 to 8. The
highest number of cases 127
(15.7%) was reported in respect of
employees on salary level 5.
Although financial misconduct
prevails at all salary levels in the
public service, it appears to be most
prevalent at salary levels 2 to 9.
The findings suggest that
departments should develop and
implement systems that would
assist in detection and prevention
of financial maladministration.
The Departments of Police (SAPS), Education: Eastern Cape, Social Development and
Special Programmes: Eastern Cape, Education: Gauteng, Office of the Premier: Western
Cape, Social Development: Western Cape and Statistics South Africa reported cases with
salary levels reflected as “Grade” “PL”, “Band”, “Intern”. Given that the salary levels did not
fall within the salary levels 1 to 16, the PSC catergorised them as “Other”. In 50 (6.2%) cases,
the salary levels were reflected as “Other”. A total of 152 (18.8%) cases were reported in
respect of employees on salary leveIs 9-12 (Middle Management). In respect of employees on
the Senior Management Service (SMS) level (salary levels 13-15), departments reported that
they have finalised 64 (7.9%) cases in the 2012/2013 financial year.
(f) Outcome of financial misconduct cases
Treasury Regulations 4.3.18, stipulate that departments must report on, amongst others, the
outcome of disciplinary proceedings in respect of finalised cases of financial misconduct. The
PSC has categorised the outcomes for statistical purposes. The categories of the outcomes of
the disciplinary proceedings reported by national and provincial departments are indicated in
Table 3 below:
CATEGORY DESCRIPTION
Guilty Cases where the Chairperson of the disciplinary hearing had found the employee guilty
of the charge(s), or the employee pleaded guilty to the charges.
Withdrawn Cases where the employee was charged with misconduct, but the charge(s) was/were
withdrawn. The reasons for the withdrawal of the charges are ascribed to a lack of
evidence, the timeframe since the incident occurred, the employee repaying the loss
and in some cases the transfer of the employee to another department.
Not guilty Cases where the Chairperson of the disciplinary hearing has found the employee not
guilty of the charge(s).
Retired/
Deceased/Resigned/
Absconded
Cases where, whilst the disciplinary case was pending –
the employee attained the prescribed retirement age and retired from the Public
Service (Retired);
the employee passed on (Deceased);
8 Republic of South Africa. Treasury Regulations, 2002 published in Government Gazette No 23463 dated 25 May 2002.
Figure 4: Levels of employees charged with financial misconduct for the 2012/2013 financial year
0
20
40
60
80
100
120
140
1 2 3 4 5 6 7 8 9
10
11
12
13
14
15
Oth
er
3
64
7974
127
70 71
53
71
28 27 26
42
20
2
50
Nu
mb
er
of ca
se
s
Salary Levels

10
CATEGORY DESCRIPTION
the employee has left the employ of the Public Service (Resigned); and
the employee absented him/herself from his/her official duties without permission
for a period exceeding one calendar month (Absconded). Table 3: Outcome of financial misconduct cases reported
Figure 5 below provides an overview of the outcome of financial misconduct cases reported
to the PSC by national and provincial
departments for the 2012/2013
financial year. Of the 807 cases
reported, employees were found guilty
of financial misconduct in 689 (85.4%)
cases. Employees were found not
guilty in 66 (8.2%) cases and 26
(3.2%) cases were withdrawn. In the
remaining 26 (3.2%) cases, it was
reported that the employees resigned
(18), retired (3), were deceased (3) or
absconded (2) prior to the finalisation
of the financial misconduct case
against him/her.
Section 16B (6) of the Public Service Act, 103 of 1994 (as amended)9, indicates that “If notice
of a disciplinary hearing was given to an employee, the relevant executive authority shall not
agree to a period of notice of resignation which is shorter than the prescribed period of notice
of resignation applicable to that employee". Departments are to ensure compliance with
Section 16B (6) of the Public Service Act, 103 of 1994 (as amended), when dealing with
resignations whilst disciplinary action is being instituted against the employee.
Departments are advised to take cognisance of the consequences for non-compliance with
the Public Service Act, 103 of 1994 (as amended). Section 16A of the Public Service Act, 103
of 1994 (as amended), amongst others, stipulates that:
“(1) An executive authority shall –
(a) immediately take appropriate disciplinary steps against a head of department
who does not comply with a provision of this Act or a regulation, determination or
directive made thereunder;
(b) immediately report to the Minister the particulars of such non-compliance; and
(c) as soon as possible report to the Minister the particulars of the disciplinary steps
taken.
(2) A head of a department shall—
9 Republic of South Africa. The Public Service Act 103 of 1994, (as amended).
Figure 5: Outcome of finalised cases of financial misconduct reported for the 2012/2013 financial year
689
66
26 18
3
32
Guilty
Not guilty
Withdrawn
Resigned
Deceased
Retired
Absconded
11
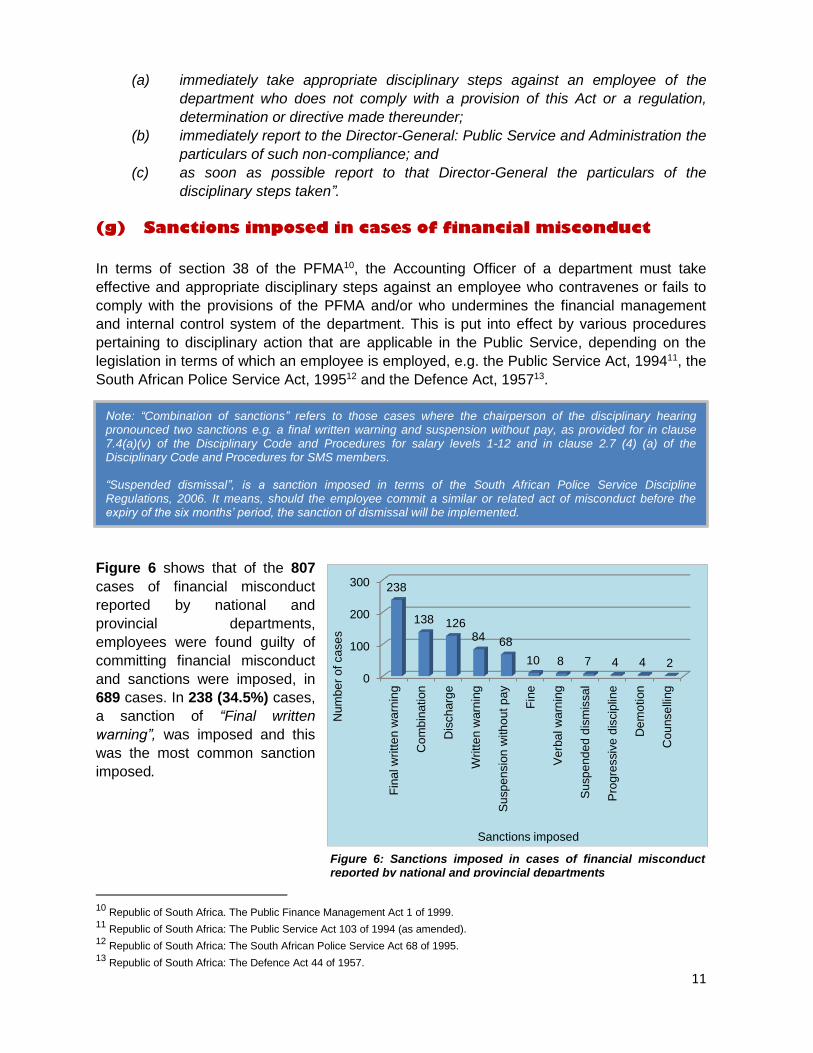
Note: “Combination of sanctions” refers to those cases where the chairperson of the disciplinary hearing pronounced two sanctions e.g. a final written warning and suspension without pay, as provided for in clause 7.4(a)(v) of the Disciplinary Code and Procedures for salary levels 1-12 and in clause 2.7 (4) (a) of the Disciplinary Code and Procedures for SMS members. “Suspended dismissal”, is a sanction imposed in terms of the South African Police Service Discipline Regulations, 2006. It means, should the employee commit a similar or related act of misconduct before the expiry of the six months’ period, the sanction of dismissal will be implemented.
(a) immediately take appropriate disciplinary steps against an employee of the
department who does not comply with a provision of this Act or a regulation,
determination or directive made thereunder;
(b) immediately report to the Director-General: Public Service and Administration the
particulars of such non-compliance; and
(c) as soon as possible report to that Director-General the particulars of the
disciplinary steps taken”.
(g) Sanctions imposed in cases of financial misconduct
In terms of section 38 of the PFMA10, the Accounting Officer of a department must take
effective and appropriate disciplinary steps against an employee who contravenes or fails to
comply with the provisions of the PFMA and/or who undermines the financial management
and internal control system of the department. This is put into effect by various procedures
pertaining to disciplinary action that are applicable in the Public Service, depending on the
legislation in terms of which an employee is employed, e.g. the Public Service Act, 199411, the
South African Police Service Act, 199512 and the Defence Act, 195713.
Figure 6 shows that of the 807
cases of financial misconduct
reported by national and
provincial departments,
employees were found guilty of
committing financial misconduct
and sanctions were imposed, in
689 cases. In 238 (34.5%) cases,
a sanction of “Final written
warning”, was imposed and this
was the most common sanction
imposed.
10
Republic of South Africa. The Public Finance Management Act 1 of 1999. 11
Republic of South Africa: The Public Service Act 103 of 1994 (as amended). 12
Republic of South Africa: The South African Police Service Act 68 of 1995. 13
Republic of South Africa: The Defence Act 44 of 1957.
0
100
200
300
Fin
al w
ritt
en w
arn
ing
Co
mb
ina
tion
Dis
ch
arg
e
Writt
en
warn
ing
Su
sp
ensio
n w
ith
ou
t p
ay
Fin
e
Ve
rba
l w
arn
ing
Su
sp
end
ed
dis
mis
sa
l
Pro
gre
ssiv
e d
iscip
line
Dem
otion
Cou
nse
lling
238
138 12684 68
10 8 7 4 4 2
Nu
mb
er
of ca
se
s
Sanctions imposed
Figure 6: Sanctions imposed in cases of financial misconduct reported by national and provincial departments
12
This was followed by the “Combination of sanctions” that was imposed in 138 (20%) cases
and employees were “Discharged” in 126 (18.3%) cases. The sanction “Counseling” was
imposed in 2 (0.3%) cases and it was the least imposed sanction.
(h) Amount of money involved in financial misconduct
cases reported by national and provincial departments
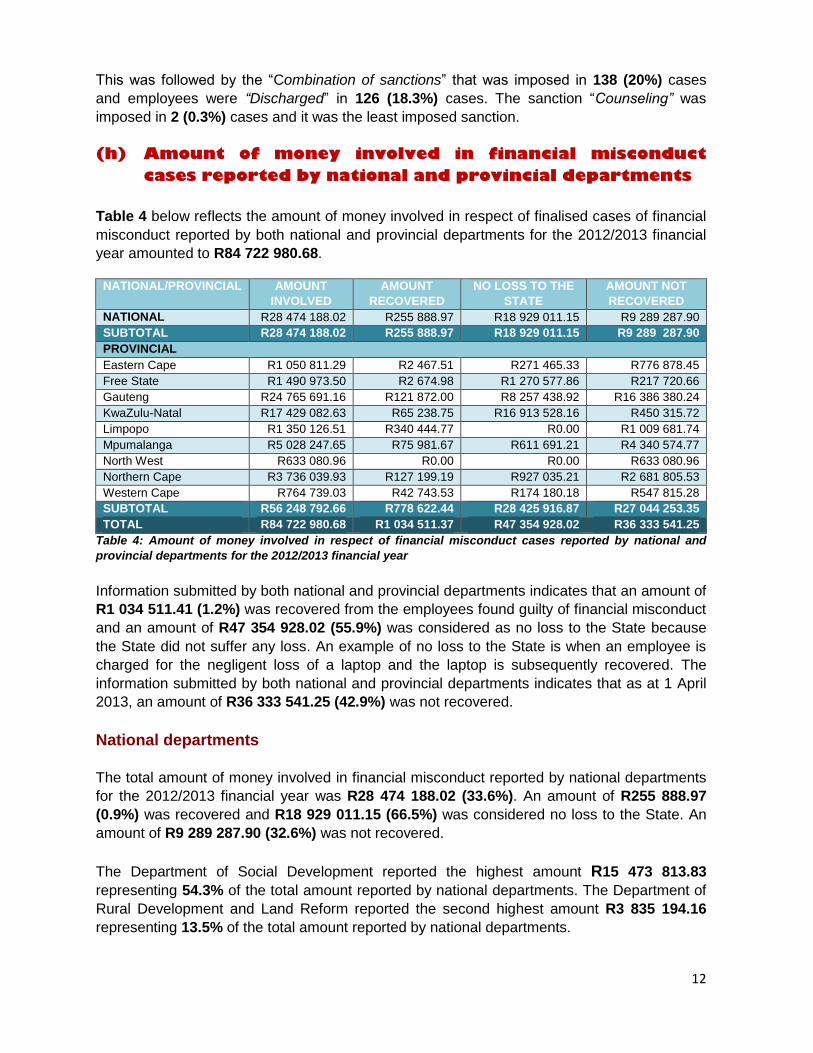
Table 4 below reflects the amount of money involved in respect of finalised cases of financial
misconduct reported by both national and provincial departments for the 2012/2013 financial
year amounted to R84 722 980.68.
NATIONAL/PROVINCIAL AMOUNT
INVOLVED
AMOUNT
RECOVERED
NO LOSS TO THE
STATE
AMOUNT NOT
RECOVERED
NATIONAL R28 474 188.02 R255 888.97 R18 929 011.15 R9 289 287.90
SUBTOTAL R28 474 188.02 R255 888.97 R18 929 011.15 R9 289 287.90
PROVINCIAL
Eastern Cape R1 050 811.29 R2 467.51 R271 465.33 R776 878.45
Free State R1 490 973.50 R2 674.98 R1 270 577.86 R217 720.66
Gauteng R24 765 691.16 R121 872.00 R8 257 438.92 R16 386 380.24
KwaZulu-Natal R17 429 082.63 R65 238.75 R16 913 528.16 R450 315.72
Limpopo R1 350 126.51 R340 444.77 R0.00 R1 009 681.74
Mpumalanga R5 028 247.65 R75 981.67 R611 691.21 R4 340 574.77
North West R633 080.96 R0.00 R0.00 R633 080.96
Northern Cape R3 736 039.93 R127 199.19 R927 035.21 R2 681 805.53
Western Cape R764 739.03 R42 743.53 R174 180.18 R547 815.28
SUBTOTAL R56 248 792.66 R778 622.44 R28 425 916.87 R27 044 253.35
TOTAL R84 722 980.68 R1 034 511.37 R47 354 928.02 R36 333 541.25
Table 4: Amount of money involved in respect of financial misconduct cases reported by national and
provincial departments for the 2012/2013 financial year
Information submitted by both national and provincial departments indicates that an amount of
R1 034 511.41 (1.2%) was recovered from the employees found guilty of financial misconduct
and an amount of R47 354 928.02 (55.9%) was considered as no loss to the State because
the State did not suffer any loss. An example of no loss to the State is when an employee is
charged for the negligent loss of a laptop and the laptop is subsequently recovered. The
information submitted by both national and provincial departments indicates that as at 1 April
2013, an amount of R36 333 541.25 (42.9%) was not recovered.
National departments
The total amount of money involved in financial misconduct reported by national departments
for the 2012/2013 financial year was R28 474 188.02 (33.6%). An amount of R255 888.97
(0.9%) was recovered and R18 929 011.15 (66.5%) was considered no loss to the State. An
amount of R9 289 287.90 (32.6%) was not recovered.
The Department of Social Development reported the highest amount R15 473 813.83
representing 54.3% of the total amount reported by national departments. The Department of
Rural Development and Land Reform reported the second highest amount R3 835 194.16
representing 13.5% of the total amount reported by national departments.

13
The Department of Justice and Constitutional Development reported the lowest amount of R1
478.40 (0.01%) and the full amount involved was recovered. The Departments of Trade and
Industry, Environmental Affairs, Science and Technology, GCIS and IPID reported that the full
amount involved in financial misconduct was considered no loss to the State.
The Departments of Corporate Governance and Energy reported that they each finalised one
(1) case of financial misconduct, however, they did not indicate the amount of money involved
in financial misconduct.
Appendix D provides a breakdown of the amount of money involved in respect of cases of
financial misconduct reported by national departments for the 2012/2013 financial year.
Provincial departments
The total amount of money involved in respect of financial misconduct cases reported by
provincial departments for the 2012/2013 financial year was R56 248 792.66 (66.4%). An
amount of R778 622.64 (1.4%) was recovered. R28 425 916.87 (50.5%) was considered no
loss to the State and R27 044 253.35 (48.1%) was not recovered. Appendix E provides a
breakdown of the amount involved in the cases of financial misconduct reported by provincial
departments.
The Gauteng Province reported the highest amount of money involved, with a total of R24 765
691.16, representing (44%) of the total amount involved in financial misconduct cases
reported by provinces. Kwazulu-Natal Province reported the second highest amount with a
total of R17 429 082.63, representing (40%) of the total amount involved in financial
misconduct cases reported by provinces. The North West Province reported the lowest
amount involved, R633 080.96 (1.1%).
A number of provincial departments reported that the full amount involved in financial
misconduct for the 2012/2013 financial year was either recovered, there was no loss to the
State or there was a combination of both recovery/no loss to the State. A list of these
departments are indicated in Appendix F.
(i) Criminal proceedings instituted against employees
charged with financial misconduct
Treasury Regulations 12.5 and 4.3.114, and the Prevention and Combating of Corrupt
Activities (PCCA) Act, 200415, are the legislative frameworks that guide departments on
criminal proceedings to be instituted against employees charged with financial misconduct.
Furthermore, Paragraph 2.6 of the Disciplinary Code and Procedures for the Public Service
(salary levels 1-12) and Paragraph 2.2.2 of the Disciplinary Code and Procedures for
members of the SMS stipulates that “If an employee commits misconduct that is also a
criminal offence, the criminal procedure and the disciplinary procedure will continue as
separate and different proceedings”.
14
Republic of South Africa. Treasury Regulations, 2002 published in Government Gazette No 23463 dated 25 May 2002. 15
Republic of South Africa. Prevention and Combatting of Corrupt Activities Act, Act No. 12 of 2004.

14
Figure 7 below indicates of the 807 employees that were charged with financial misconduct,
criminal proceedings were instituted
against employees in 158 (19.6%) of
the cases. In 491 (60.8%) cases,
departments indicated that no
criminal proceedings were instituted
against employees charged with
financial misconduct. In 116 (14.4%)
cases, the departments failed to
indicate whether or not criminal
proceedings where instituted against
employees who were charged with
financial misconduct. In 42 (5.2%)
cases, departments indicated that
further action was not applicable.
TRENDS ANALYSIS OF FINANCIAL
MISCONDUCT CASES REPORTED FOR THE
FINANCIAL YEARS 2009/2010 TO 2012/2013
(a) Decrease in financial misconduct cases for the
2012/2013 financial year
Figure 8 below shows that in comparison with the 2011/2012 financial year, there has been a
decrease in the number of financial misconduct cases reported in the 2012/2013 financial year
by 436 i.e. from 1243 to 807 cases. In the past four financial years, the highest number of
financial misconduct cases was reported in 2011/2012 financial year (1243 cases). It is the
first time in four years that the number of cases reported as finalised is below 1000.
Figure 8: Number of financial misconduct cases reported for the financial years 2009/2010 to 2012/2013
Figure 7: Breakdown of the responses by departments regarding criminal proceedings instituted against employees
0
500
1000
1500
200
9/2
01
0
201
0/2
01
1
201
1/2
01
2
201
2/2
01
3
11351035
1243
807
Nu
mb
er
of ca
se
s
Financial years
158
491
42
116
Criminal actiontaken
No criminal actiontaken
Not applicable
Not indicated
15
(b) Increase in cases in the categories “fraud” and “theft”
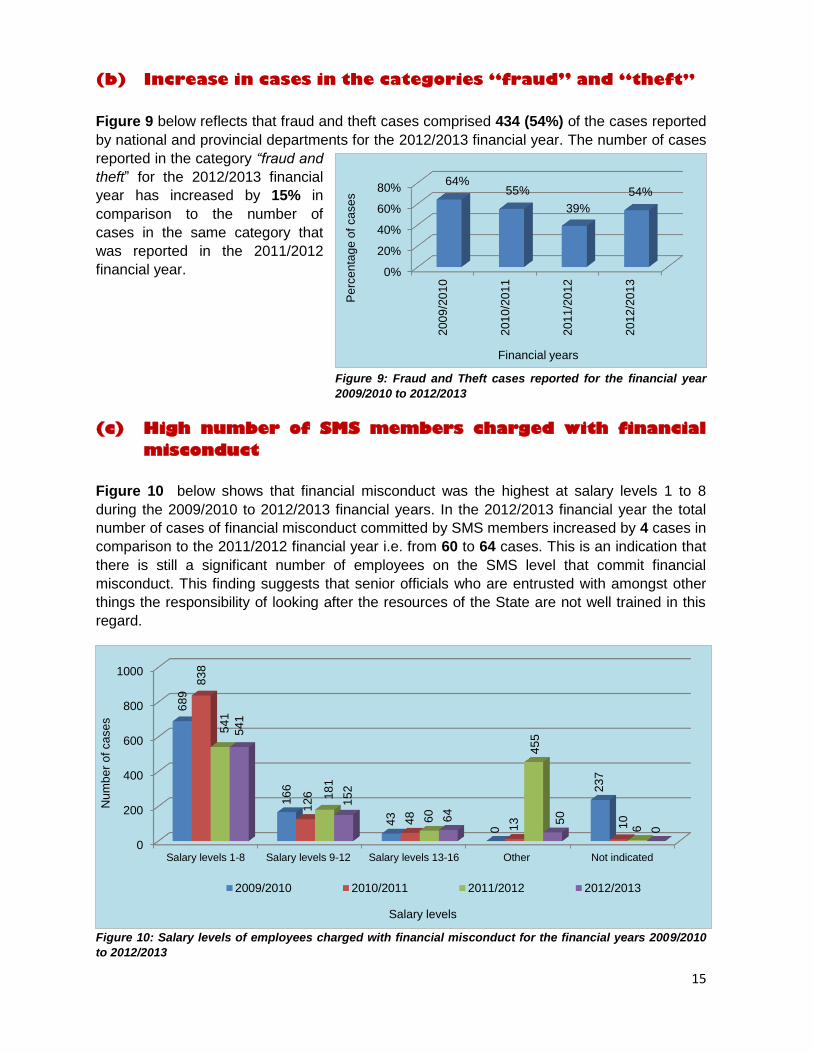
Figure 9 below reflects that fraud and theft cases comprised 434 (54%) of the cases reported
by national and provincial departments for the 2012/2013 financial year. The number of cases
reported in the category “fraud and
theft” for the 2012/2013 financial
year has increased by 15% in
comparison to the number of
cases in the same category that
was reported in the 2011/2012
financial year.
Figure 9: Fraud and Theft cases reported for the financial year
2009/2010 to 2012/2013
(c) High number of SMS members charged with financial
misconduct
Figure 10 below shows that financial misconduct was the highest at salary levels 1 to 8
during the 2009/2010 to 2012/2013 financial years. In the 2012/2013 financial year the total
number of cases of financial misconduct committed by SMS members increased by 4 cases in
comparison to the 2011/2012 financial year i.e. from 60 to 64 cases. This is an indication that
there is still a significant number of employees on the SMS level that commit financial
misconduct. This finding suggests that senior officials who are entrusted with amongst other
things the responsibility of looking after the resources of the State are not well trained in this
regard.
Figure 10: Salary levels of employees charged with financial misconduct for the financial years 2009/2010
to 2012/2013
0
200
400
600
800
1000
Salary levels 1-8 Salary levels 9-12 Salary levels 13-16 Other Not indicated
68
9
16
6
43
0
23
7
83
8
12
6
48
13 10
54
1
18
1
60
45
5
6
54
1
15
2
64
50
0
Nu
mb
er
of ca
se
s
Salary levels
2009/2010 2010/2011 2011/2012 2012/2013
0%
20%
40%
60%
80%
200
9/2
01
0
201
0/2
01
1
201
1/2
01
2
201
2/2
01
3
64%55%
39%
54%
Pe
rce
nta
ge
of
ca
se
sFinancial years

16
70%
75%
80%
85%
90%
200
9/2
01
0
201
0/2
01
1
201
1/2
01
2
201
2/2
01
3
88%
84%
76%
85%
Pe
rce
nta
ge
of
em
plo
ye
es fo
un
d
gu
ilty
Financial years
(d) Increase in the percentage of employees found guilty of
financial misconduct
Figure 11 below shows that there has been an increase of 9% in the percentage of
employees found guilty of
financial misconduct in the
2012/2013 financial year in
comparison to the 2011/2012
financial year i.e. from 76% to
85%. The percentage of
employees found guilty over
the past four financial years
exceeds 75% per financial
year.
Figure 11: Percentage of employees that were found guilty for the
financial years 2009/2010 to 2012/2013
(e) Comparison of sanctions imposed in the Public Service
The Disciplinary Code and Procedures for the Public Service (salary levels 1-12) and the
Disciplinary Code and Procedures for members of the SMS provide a framework within which
departments must manage disciplinary matters. Although the Disciplinary Codes and
Procedures for the Public Service (salary levels 1-12) and for the members of the SMS
provide examples of sanctions that can be imposed, the Presiding Officer recommends to the
Director General/Head of Department the type of sanction to be imposed. The Presiding
Officer considers the type of sanction to impose following consideration of the merits of the
case and the mitigating and aggravating circumstances. Given that discipline is a
management function and is dealt with by the respective departments, there will always be
inconsistencies in the sanctions imposed for misconduct of a similar nature.
Reports submitted by departments for the 2012/2013 financial year reveal that there is no
consistency in the sanctions imposed for similar transgressions within the departments and
amongst them. There is a
need for uniformity of
sanctions for similar charges,
in order to create certainty
and to ensure deterrence.
Figure 12 indicates the most
common sanctions imposed
for the financial years
2009/2010 to 2012/2013.
Figure 12: Most common sanctions imposed in financial misconduct
cases over the past four financial years
0%
10%
20%
30%
40%
50%
Final writtenwarning
Discharge Combination
49
%
21
%
12
%
35
%
23
%
9%
35
%
24
%
17
%
35
%
18
%
20
%
Pe
rce
nta
ge
of
sa
nctio
ns
imp
ose
d
Sanctions
2009/2010 2010/2011 2011/2012 2012/2013

17
Figure 12 shows that in comparison to the 2011/2012 financial year, a sanction of discharge
imposed against employees found guilty of financial misconduct in the 2012/2013 financial
year decreased by 6% and a combination of sanctions increased by 3%.
In order to ensure fairness and to avoid labour disputes, departments should ensure that there
is consistency in the sanction imposed for transgressions of a similar nature. Furthermore,
departments should consider precedents set in previous cases when considering the sanction
to be imposed.
(f) Decrease in the amount of money involved in financial
misconduct
Although all national and provincial departments submitted reports on finalised cases of
financial misconduct for the 2012/2013 financial year, not all departments indicated the
amount of money involved in the cases reported. Thus, the amounts reflected in this report
are based on the information provided by departments. Figure 13 below shows that there has
been a 63.1% decrease in the amount of money involved in financial misconduct cases
reported for the 2012/2013 financial year in comparison to the 2011/2012 financial year i.e.
from R229 866 763.15 (2011/2012) to R84 722 780.68 (2012/2013) financial year.
Figure 13: Total amount involved in financial misconduct cases reported for the financial years 2009/2010
to 2012/2013
Figure 13 above shows that there has also been a decrease in the number of cases reported
in the 2012/2013 financial year by 436 (35.1%), in comparison to that reported in the
2011/2012 financial year i.e. from 1243 to 807 cases.
0
200,000,000
400,000,000
600,000,000
800,000,000
1,000,000,000
2009/2010 2010/2011 2011/2012 2012/2013
R346,529,669
R932,276,822
R229,866,763
R84,722,980
Am
ou
nt in
vo
lve
d
Financial years

18
(g) Decrease in criminal proceedings instituted in cases of
financial misconduct
In terms of section 34 (1) of the PCCA Act16, any person who holds a “position of authority” is
compelled to report offences of theft, fraud, extortion, forgery or uttering of a forged document
involving amounts of R100
000.00 or more to the
SAPS. Figure 14 shows
that for the 2012/2013
financial year, departments
instituted criminal action in
158 (20%) of the financial
misconduct cases and in
491 (61%) of the cases, no
criminal proceedings were
instituted.
Figure 14: Criminal proceedings instituted against employees charged
with financial misconduct for the financial years 2009/2010 to 2012/2013
Figure 14 above furthermore shows that there has been a 14% decrease in criminal
proceedings instituted compared to the 2011/2012 financial year. In (42) 5% of the cases
reported for the 2012/2013 financial year, departments failed to indicate whether criminal
proceedings were instituted or not. In (116) 14% of the cases departments indicated that
criminal proceedings are not applicable.
(h) Recovery of money lost through financial misconduct
Section 38(c) (i) of the PFMA17 ,read in conjunction with Treasury Regulations, Part 5,
paragraph 12.5.118, requires accounting officers to take effective steps to collect all money
owing to the department.
Figure 15 below shows that in the 2012/2013 financial year both national and provincial
departments reported that a total of R48 389 439.39 (57.1%) was recovered from the
employees found guilty of financial misconduct or the financial misconduct did not result in any
loss to the State and an amount of R36 333 541.25 (42.9%) has not been recovered at the
time of reporting to the PSC. There has been a decrease in the recovery of money lost
through financial misconduct in the 2012/2013 financial year by 8.9% i.e. from 66% to 57.1%,
in comparison to the 2011/2012 financial year.
16
Republic of South Africa. Prevention and Combatting of Corrupt Activities Act, Act No. 12 of 2004. 17
Republic of South Africa. The Public Finance Management Act No.1 of 1999. 18
Republic of South Africa. Treasury Regulations, 2002 published in Government Gazette No 23463 dated 25 May 2002.
0%
10%
20%
30%
40%
50%
60%
70%
80%
Criminalaction taken
No criminalaction taken
Not indicated Not applicable
22
%
57
%
14
%
7%
17
%
72
%
9%
1%
34
%
26
%
38
%
1%
20
%
61
%
5%
14
%
Pe
rce
nta
ge
of
cri
min
al p
roce
ed
ing
s
2009/2010 2010/2011 2011/2012 2012/2013
19
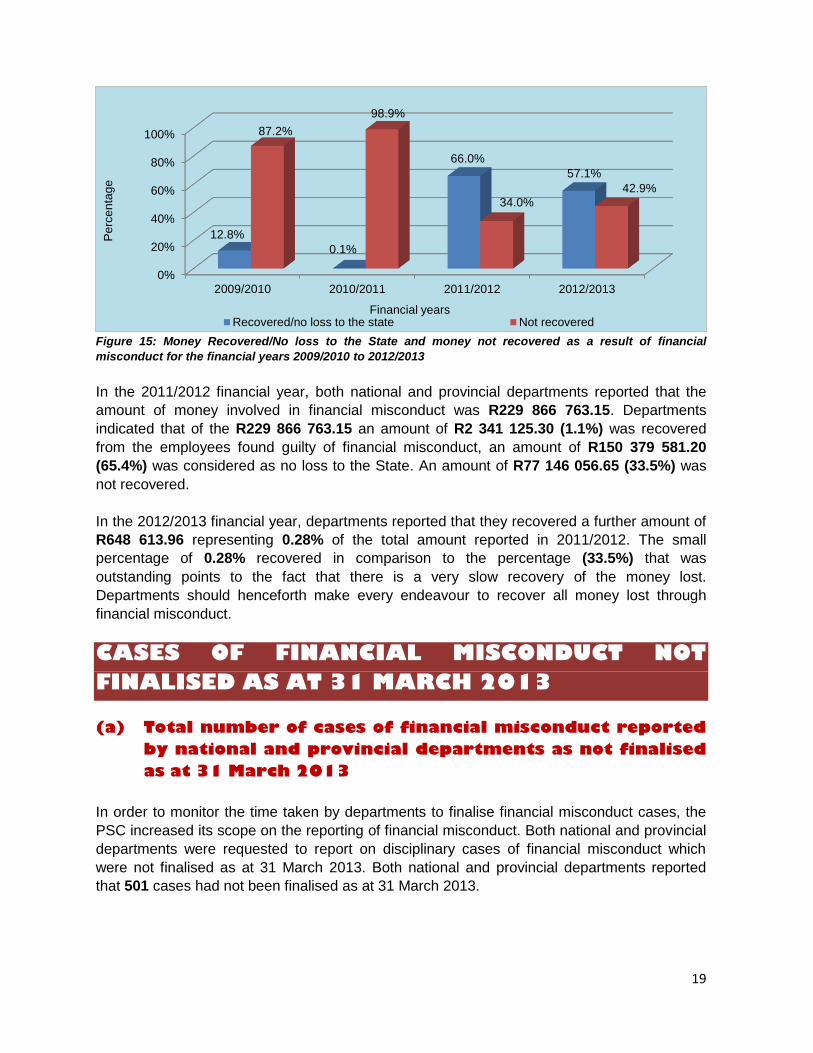
Figure 15: Money Recovered/No loss to the State and money not recovered as a result of financial
misconduct for the financial years 2009/2010 to 2012/2013
In the 2011/2012 financial year, both national and provincial departments reported that the
amount of money involved in financial misconduct was R229 866 763.15. Departments
indicated that of the R229 866 763.15 an amount of R2 341 125.30 (1.1%) was recovered
from the employees found guilty of financial misconduct, an amount of R150 379 581.20
(65.4%) was considered as no loss to the State. An amount of R77 146 056.65 (33.5%) was
not recovered.
In the 2012/2013 financial year, departments reported that they recovered a further amount of
R648 613.96 representing 0.28% of the total amount reported in 2011/2012. The small
percentage of 0.28% recovered in comparison to the percentage (33.5%) that was
outstanding points to the fact that there is a very slow recovery of the money lost.
Departments should henceforth make every endeavour to recover all money lost through
financial misconduct.
CASES OF FINANCIAL MISCONDUCT NOT
FINALISED AS AT 31 MARCH 2013
(a) Total number of cases of financial misconduct reported
by national and provincial departments as not finalised
as at 31 March 2013
In order to monitor the time taken by departments to finalise financial misconduct cases, the
PSC increased its scope on the reporting of financial misconduct. Both national and provincial
departments were requested to report on disciplinary cases of financial misconduct which
were not finalised as at 31 March 2013. Both national and provincial departments reported
that 501 cases had not been finalised as at 31 March 2013.
0%
20%
40%
60%
80%
100%
2009/2010 2010/2011 2011/2012 2012/2013
12.8%
0.1%
66.0%
57.1%
87.2%
98.9%
34.0%
42.9%
Pe
rce
nta
ge
Financial yearsRecovered/no loss to the state Not recovered

20
102
399
National Provincial
Figure 16 provides a breakdown of the
number of cases reported by national and
provincial departments as not finalised as at
31 March 2013. Of the 501 cases reported as
not finalised, 102 (20.4%) of the cases were
reported by national departments and 399
(79.6%) of the cases were reported by
provincial departments.
Some of the key reasons provided by national and provincial departments for non finalisation
of the 501 financial misconduct cases were as follows:
Investigation in progress
Awaiting approval of sanction
Sanction to be implemented
Outcome of appeal to be implemented
Official appealed sanction/ Awaiting outcome of appeal
Case finalised after the 31 March 2013
Awaiting investigation report and charge sheet
Investigating Officer to be appointed
Disciplinary hearing postponed
Disciplinary hearing in progress
Case to be dealt with by external investigators
Referred to Legal Services for opinion.
The Disciplinary Code and Procedures for the Public Service (salary levels 1-12) and the
Disciplinary Code and Procedures for the members of the SMS stipulate, amongst others, the
following:
The employee/member must be given notice at least five (5) working days before the date
of the hearing.
The disciplinary hearing must be held within ten (10) working days after the notice is
delivered to the employee/member.
The Chairperson must communicate the final outcome of the hearing to the
employee/member within five (5) working days after the conclusion of the disciplinary
enquiry, and the outcome must be recorded on the employee’s/member’s personal file.
The employer shall not implement the sanction during an appeal by the employee (salary
levels 1-12)
Figure 16: Total number of cases of financial
misconduct reported by national and provincial
departments not finalised as at 31 March 2013

21
Nothing in the Disciplinary Code and Procedures detracts a member’s right to utilise
dispute settlement mechanisms provided under the Labour Relations Act (members of the
SMS).
Despite the above stipulations in the Disciplinary Code and Procedures, there is still a large
number of cases reported as not finalised within the set timeframes.
b) Types of cases of financial misconduct reported by
national and provincial departments as not finalised as
at 31 March 2013
The PSC catergorised the types of cases of financial misconduct reported by departments for
statistical purposes. Table 2 titled “Description of the types of financial misconduct cases
categorised by the PSC”, reflects the categories of financial misconduct and the description of
cases reported by departments that fall into these categories.
Figure 17: Types of financial misconduct cases reported by national and provincial departments as not
finalised as at 31 March 2013
Figure 17 above further shows that of the 501 financial misconduct cases reported as not
finalised as at 31 March 2013, “Financial Mismanagement” is the type of financial misconduct
with the highest number of cases 230 (45.9%). This was followed by “Fraud” with 81 (16.2%)
cases and “Misappropriation and abuse” with 59 (11.8%) cases. The category with the least
number of cases reported as not finalised as at 31 March 2013 was “Corruption” with 12
(2.4%) cases.
CONCLUSION
Trends contained in this Factsheet show that there has been a decrease in the number of
finalised cases of financial misconduct reported by national and provincial departments for the
2012/2013 financial year in comparison to that reported in the past four (4) financial years.
The decrease in the number of finalised cases of financial misconduct could be either as a
0
100
200
300
Fin
an
cia
lM
ism
an
ag
em
en
t
Fra
ud
Mis
ap
pro
pri
atio
n a
nd
abu
se
Gro
ss N
eglig
en
ce
Not
ind
ica
ted
Th
eft
Corr
uption
230
8159 56 38 25 12
Num
be
r o
f ca
se
s
Types of financial misconduct
22
result of inadequate or poor reporting. The PSC has engaged with National Treasury for them
to address the challenge of inadequate or poor reporting. During the drafting of this Factsheet,
National Treasury was in the process of developing a Treasury Instruction relating to financial
misconduct, which will be forwarded to departments.
The statistics contained in this report show that financial misconduct is still a serious challenge
in the Public Service. Despite disciplinary action being taken against perpetrators, the
sanctions imposed in most cases seem to be very lenient and inconsistent, thus making it
difficult to prevent other public servants from committing financial misconduct of a similar
nature in the future. There is a need for uniformity to create certainty and to ensure
deterrence. Departments should consider issuing harsher sanctions, which will to a large
extent deter other public servants from committing misdemeanors relating to financial
misconduct.
According to the reports received from national and provincial departments a substantial
number of cases of financial misconduct were not finalised by 31 March 2013. The delay in
finalising the investigations and disciplinary hearings relating to financial misconduct may
result in the perpetrators committing further misdemeanors or exiting the Public Service
without action being taken against them. Departments should ensure that adequate
investigative capacity is made available to finalise such cases.
The exact number of cases of financial misconduct finalised and not finalised as well as the
amount of money involved has not been verified by the PSC and the information contained in
this Factsheet is based on reports received from national and provincial departments.
The findings contained in this Factsheet suggest that departments should develop and
implement systems that would assist in detection and prevention of financial
maladministration. Departments should also make concerted efforts in recovering money lost
to the State through financial misconduct by including in the letter of sanction to the employee
concerned, that the amount of money involved in the case will be recovered from his/her
salary. Recovery of money lost to the State through financial misconduct can improve the
quality of financial management amongst government officials.
The PSC trusts that the statistical information and trends contained in this Factsheet will assist
departments to put necessary measures in place to contribute to the eradication of financial
misconduct in the Public Service.

23
Appendix A: List of the 21 national departments that
submitted a “nil return”
DEPARTMENT
1 Agriculture, Forestry and Fisheries
2 Arts and Culture
3 Basic Education
4 Civilian Secretariat of Police
5 Communications
6 Economic Development
7 Human Settlements
8 International Relations and Cooperation
9 Military Veterans
10 National Treasury
11 Performance Monitoring and Evaluation
12 Public Administration Leadership and Management Academy
13 Public Enterprises
14 Public Service and Administration
15 Office of the Public Service Commission
16 Sport and Recreation South Africa
17 The Presidency
18 Tourism
19 Traditional Affairs
20 Transport
21 Women, Children and People with Disabilities
24
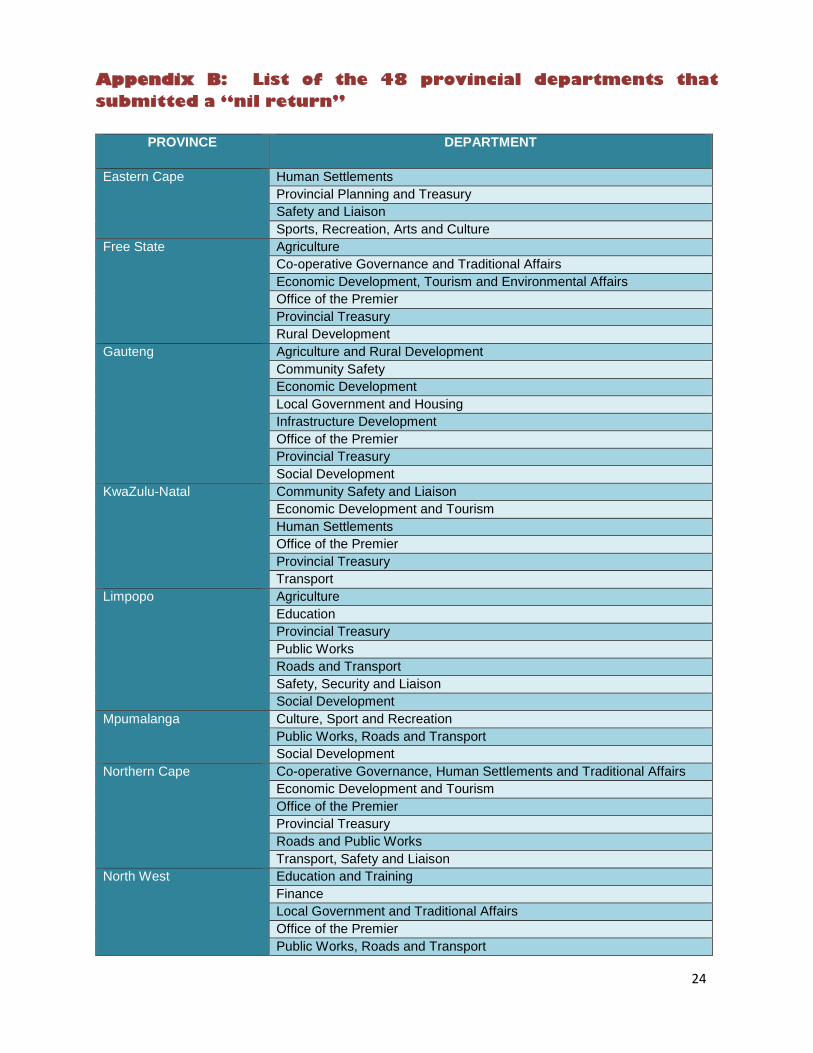
Appendix B: List of the 48 provincial departments that
submitted a “nil return”
PROVINCE
DEPARTMENT
Eastern Cape
Human Settlements
Provincial Planning and Treasury
Safety and Liaison
Sports, Recreation, Arts and Culture
Free State
Agriculture
Co-operative Governance and Traditional Affairs
Economic Development, Tourism and Environmental Affairs
Office of the Premier
Provincial Treasury
Rural Development
Gauteng
Agriculture and Rural Development
Community Safety
Economic Development
Local Government and Housing
Infrastructure Development
Office of the Premier
Provincial Treasury
Social Development
KwaZulu-Natal
Community Safety and Liaison
Economic Development and Tourism
Human Settlements
Office of the Premier
Provincial Treasury
Transport
Limpopo
Agriculture
Education
Provincial Treasury
Public Works
Roads and Transport
Safety, Security and Liaison
Social Development
Mpumalanga
Culture, Sport and Recreation
Public Works, Roads and Transport
Social Development
Northern Cape
Co-operative Governance, Human Settlements and Traditional Affairs
Economic Development and Tourism
Office of the Premier
Provincial Treasury
Roads and Public Works
Transport, Safety and Liaison
North West
Education and Training
Finance
Local Government and Traditional Affairs
Office of the Premier
Public Works, Roads and Transport

25
Social Development, Women, Children and People with Disabilities
Western Cape
Economic Development and Tourism
Provincial Treasury

26
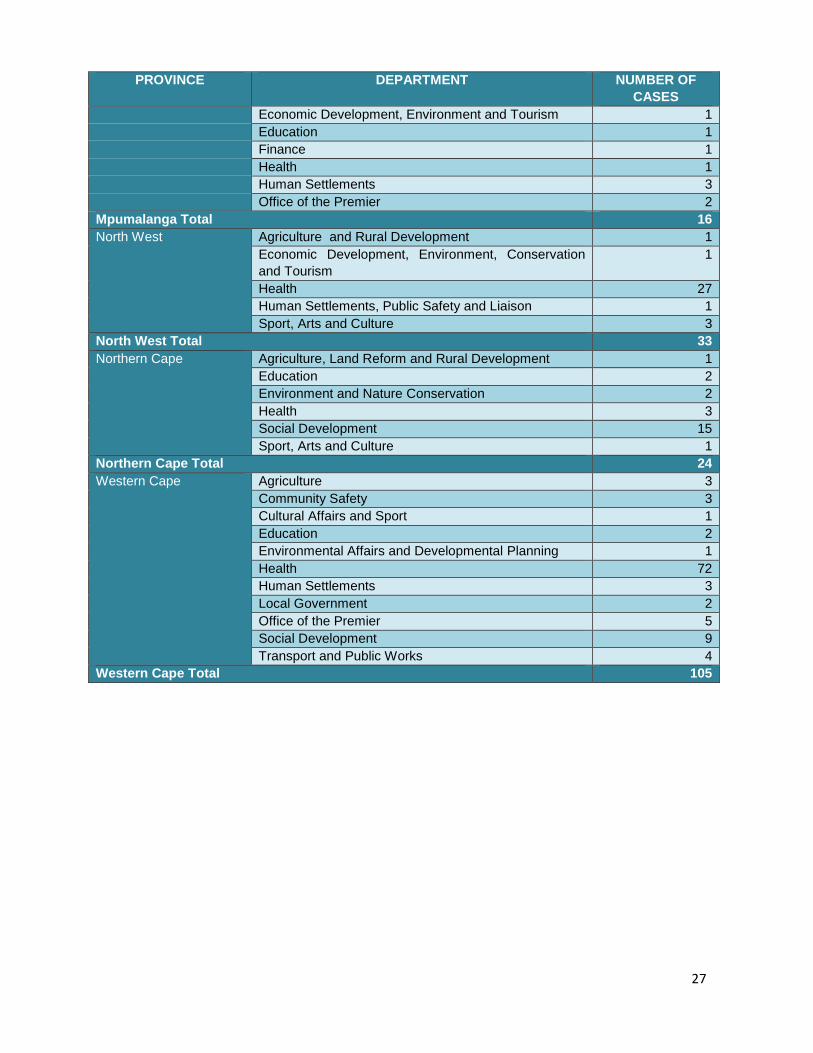
Appendix C: Breakdown of financial misconduct cases
reported by provincial departments
PROVINCE DEPARTMENT NUMBER OF
CASES
Eastern Cape Economic Development, Environmental Affairs and
Tourism
3
Education 33
Health 2
Local Government and Traditional Affairs 1
Office of the Premier 2
Roads and Public Works 4
Rural Development and Agrarian Reform 7
Social Development and Special Programmes 6
Transport 1
Eastern Cape Total 59
Free State Education 3
Health 7
Police, Roads and Transport 1
Public Works 1
Social Development 15
Sports, Arts, Culture and Recreation 3
Free State Total 30
Gauteng Education 17
Finance 4
Health 164
Roads and Transport 1
Sports, Arts, Culture and Recreation 3
Gauteng Total 189
KwaZulu-Natal Agriculture, Environmental Affairs and Rural
Development
7
Arts and Culture 2
Cooperative Governance and Traditional Affairs 8
Education 24
Health 4
Public Works 27
Social Development 2
Sports and Recreation 6
KwaZulu-Natal Total 80
Limpopo Cooperative Governance, Human Settlements and
Traditional Affairs
7
Economic Development, Environment and Tourism 19
Health 3
Office of the Premier 5
Sports, Arts and Culture 1
Limpopo Total 35
Mpumalanga Agriculture, Rural Development and Land
Administration
5
Community Safety and Liaison 1
Co-operative Governance and Traditional Affairs 1
27
PROVINCE DEPARTMENT NUMBER OF
CASES
Economic Development, Environment and Tourism 1
Education 1
Finance 1
Health 1
Human Settlements 3
Office of the Premier 2
Mpumalanga Total 16
North West Agriculture and Rural Development 1
Economic Development, Environment, Conservation
and Tourism
1
Health 27
Human Settlements, Public Safety and Liaison 1
Sport, Arts and Culture 3
North West Total 33
Northern Cape Agriculture, Land Reform and Rural Development 1
Education 2
Environment and Nature Conservation 2
Health 3
Social Development 15
Sport, Arts and Culture 1
Northern Cape Total 24
Western Cape Agriculture 3
Community Safety 3
Cultural Affairs and Sport 1
Education 2
Environmental Affairs and Developmental Planning 1
Health 72
Human Settlements 3
Local Government 2
Office of the Premier 5
Social Development 9
Transport and Public Works 4
Western Cape Total 105

28
Appendix D: Breakdown of the amount of money involved in
respect of financial misconduct cases reported by national
departments
DEPARTMENT AMOUNT
INVOLVED
AMOUNT
RECOVERED
AMOUNT
CONSIDERED AS
RECOVERED DUE
TO "NO LOSS TO
STATE"
AMOUNT NOT
RECOVERED
Cooperative Governance R0.00 R0.00 R0.00 R0.00
Correctional Services R1 357 457.35 R153 742.86 R997 680.32 R206 034.12
Defence R274 513.16 R3 929.68 R148 868.07 R121 715.41
Energy R0.00 R0.00 R0.00 R0.00
Environmental Affairs R620 069.51 R0.00 R620 069.51 R0.00
Government
Communication and
Information System
R2 100.00 R0.00 R2 100.00 R0.00
Health R1 124 039.59 R0.00 R0.00 R1 124 039.59
Higher Education and
Training
R 97 118.00 R0.00 R0.00 R97 118.00
Home Affairs R2 600.00 R0.00 R1 400.00 R1 200.00
Independent Police
Investigative Directorate
R29 121.81 R0.00 R29 121.81 R0.00
Justice and Constitutional
Development
R1 478.40 R1 478.40 R0.00 R0.00
Labour R3 349 109.64 R29 315.38 R39 484.00 R3 280 310.26
Mineral Resources R12 842.00 R0.00 R0.00 R12 842.00
National Prosecuting
Authority
R321 816.87 R0.00 R291 552.42 R30 264.45
Public Works R443 854.49 R1 147.75 R353 401.27 R89 305.47
Rural Development and
Land Reform
R3 835 194.16 R0.00 R81 976.24 R3 753 217.92
Science and Technology R756 969.30 R0.00 R756 969.30 R0.00
Social Development R15 473 813.83 R0.00 R15 446 522.23 R27 291.60
Police R492 050.57 R32 805.04 R136 873.91 R322 371.62
Statistics South Africa R186 611.44 R2 434.00 R0.00 R184 177.44
Trade and Industry R22 992.07 R0.00 R22 992.07 R0.00
Water Affairs R70 435.83 R31 035.86 R0.00 R39 399.97
TOTAL R28 474 188.02 R255 888.97 R18 929 011.15 R9 289 287.90
29
Appendix E: Breakdown of the amount of money involved in
respect of financial misconduct cases reported by provincial
departments
PROVINCE DEPARTMENT AMOUNT
INVOLVED
AMOUNT
RECOVERED
AMOUNT
CONSIDERED
AS
RECOVERED
DUE TO "NO
LOSS TO
STATE"
AMOUNT NOT
RECOVERED
Eastern Cape Economic
Development,
Environmental
Affairs and Tourism
R4 800.00 R900.00 R0.00 R3 900.00
Education R627 590.35 R0.00 R41 397.99 R586 192.36
Health R2 600.00 R0.00 R0.00 R2 600.00
Local Government
and Traditional
Affairs
R75 000.00 R0.00 R75 000.00 R0.00
Office of the
Premier
R40 765.34 R0.00 R40 765.34 R0.00
Roads and Public
Works
R3 037.10 R1 567.51 R0.00 R1 469.59
Rural Development
and Agrarian
Reform
R94 716.50 R0.00 R15 000.00 R79 716.50
Social
Development and
Special
Programmes
R99 302.00 R0.00 R99 302.00 R0.00
Transport R103 000.00 R0.00 R0.00 R103 000.00
Eastern Cape Total R1 050 811.29 R2 467.51 R271 465.33 R776 878.45
Free State Education R0.00 R0.00 R0.00 R0.00
Health R123 918.00 R0.00 R231.00 R123 687.00
Police, Roads and
Transport
R15 182.40 R0.00 R0.00 R15 182.40
Public Works R5 750.00 R2 100.00 R0.00 R3 650.00
Social
Development
R 1 270 346.86 R0.00 R1 270 346.86 R0.00
Sports, Arts,
Culture and
Recreation
R75 776.24 R574.98 R0.00 R75 201.26
Free State Total R1 490 973.50 R2 674.98 R1 270 577.86 R217 720.66
Gauteng Education R117 022.00 R0.00 R74 000.00 R43 022.00
Finance R84 543.53 R0.00 R84 543.53 R0.00
Health R16 535 320.59 R100 466.96 R98 895.39 R16 335 958.24
Roads and
Transport
R7 400.00 R0.00 R0.00 R7 400.00
Sports, Arts,
Culture and
Recreation
R8 021 405.04 R21 405.04 R8 000 000.00 R0.00

30
PROVINCE DEPARTMENT AMOUNT
INVOLVED
AMOUNT
RECOVERED
AMOUNT
CONSIDERED
AS
RECOVERED
DUE TO "NO
LOSS TO
STATE"
AMOUNT NOT
RECOVERED
Gauteng Total R24 765 691.16 R121 872.00 R8 257 438.92 R16 386 380.24
KwaZulu-
Natal
Agriculture,
Environmental
Affairs and Rural
Development
R18 400.00 R6 900.00 R2 400.00 R9 100.00
Arts and Culture R2 107.45 R0.00 R2 107.45 R0.00
Cooperative
Governance and
Traditional Affairs
R62 515.62 R27 760.00 R0.00 R34 755.62
Education R334 072.00 R0.00 R0.00 R334 072.00
Health R16 155.85 R16 155.85 R0.00 R0.00
Public Works R4 368 384.71 R14 422.90 R4 347 873.71 R6 088.10
Social
Development
R66 300.00 R0.00 R0.00 R66 300.00
Sports and
Recreation
R12 561 147.00 R0.00 R12 561 147.00 R0.00
Kwazulu-Natal Total R17 429 082.63 R65 238.75 R16 913 528 .16 R450 315.72
Limpopo Cooperative
Governance,
Human
Settlements and
Traditional Affairs
R382 082.16 R285 082.16 R0.00 R97 000.00
Economic
Development,
Environment and
Tourism
R763 759.77 R0.00 R0.00 R763 759.77
Health R43 198.23 R16 316.63 R0.00 R26 881.60
Office of the
Premier
R134 410.05 R39 045.98 R0.00 R95 364.07
Sports, Arts and
Culture
R26 676.30 R0.00 R0.00 R26 676.30
Limpopo Total R1 350 126.51 R340 444.77 R0.00 R1 009 681.74
Mpumalanga Agriculture, Rural
Development and
Land
Administration
R120 087.85 R9 000.00 R0.00 R111 087.85
Community Safety
and Liaison
R4 350.00 R4 350.00 R0.00 R0.00
Co-operative
Governance and
Traditional Affairs
R26 000.00 R26 000.00 R0.00 R0.00
Economic
Development,
Environment and
Tourism
R91 750.00 R1 350.00 R0.00 R90 400.00
Education R4 000 000.00 R0.00 R0.00 R4 000 000.00
Finance R122 276.31 R0.00 R0.00 R122 276.31
31
PROVINCE DEPARTMENT AMOUNT
INVOLVED
AMOUNT
RECOVERED
AMOUNT
CONSIDERED
AS
RECOVERED
DUE TO "NO
LOSS TO
STATE"
AMOUNT NOT
RECOVERED
Health R611 691.21 R0.00 R611 691.21 R0.00
Human
Settlements
R45 827.02 R29 016.41 R0.00 R16 810.61
Office of the
Premier
R6 265.26 R6 265.26 R0.00 R0.00
Mpumalanga Total R5 028 247.65 R75 981.67 R611 691.21 R4 340 574.77
Northern
Cape
Agriculture, Land
Reform and Rural
Development
R761 000.00 R0.00 R0.00 R761 000.00
Education R43 400.00 R5 400.00 R0.00 R38 000.00
Environment and
Nature
Conservation
R1 046 284.40 R119 249.19 R927 035.21 R0.00
Health R1 520 820.00 R0.00 R0.00 R1 520 820.00
Social
Development
R307 001.53 R2 550.00 R0.00 R304 451.53
Sport, Arts and
Culture
R57 534.00 R0.00 R0.00 R57 534.00
Northern Cape Total R3 736 039.93 R127 199.19 R927 035.21 R2 681 805.53
North West Agriculture and
Rural Development
R503 080.00 R0.00 R0.00 R503 080.00
Economic
Development,
Environment,
Conservation and
Tourism
R7 220.99 R0.00 R0.00 R7 220.99
Health R60 477.78 R0.00 R0.00 R60 477.78
Human
Settlements, Public
Safety and Liaison
R62 302.19 R0.00 R0.00 R62 302.19
Sport, Arts and
Culture
R0.00 R0.00 R0.00 R0.00
North West Total R633 080.96 R0.00 R0.00 R633 080.96
Western Cape Agriculture R18 471.44 R0.00 R0.00 R18 471.44
Community Safety R0.00 R0.00 R0.00 R0.00
Cultural Affairs and
Sport
R0.00 R0.00 R0.00 R0.00
Education R81 692.00 R0.00 R0.00 R81 692.00
Environmental
Affairs and
Developmental
Planning
R5 048.80 R5 048.80 R0.00 R0.00
Health R480 951.84 R33 300.00 R0.00 R447 651.84
Human
Settlements
R0.00 R0.00 R0.00 R0.00
Local Government R1 593.37 R1 593.37 R0.00 R0.00

32
PROVINCE DEPARTMENT AMOUNT
INVOLVED
AMOUNT
RECOVERED
AMOUNT
CONSIDERED
AS
RECOVERED
DUE TO "NO
LOSS TO
STATE"
AMOUNT NOT
RECOVERED
Office of the
Premier
R2 801.40 R2 801.40 R0.00 R0.00
Social
Development
R174 180.18 R0.00 R174 180.18 R0.00
Transport and
Public Works
R0.00 R0.00 R0.00 R0.00
Western Cape Total R764 739.03 R42 743.57 R174 180.18 R547 815.28
TOTAL COST
R56 248 792.44
R778 622.44
R28 425 916.87
R27 044 253.35

33
Appendix F: List of the Provincial departments which
reported that the full amount involved in respect of financial
misconduct was either recovered/considered no loss to the
State or there was a combination of recovered and no loss to
the State
(1) The following provincial departments reported that the full amount involved in financial
misconduct for the 2012/2013 financial year was recovered:
PROVINCE
DEPARTMENT
KwaZulu-Natal Health
Mpumalanga Community Safety and Liaison
Co-operative Governance and Traditional Affairs
Office of the Premier
Western Cape Environmental Affairs and Developmental Planning
Local Government
Office of the Premier
(2) The following provincial departments reported that the full amount involved in financial
misconduct for the 2012/2013 financial year was considered as no loss to the State:
PROVINCE
DEPARTMENT
Eastern Cape Local Government and Traditional Affairs
Office of the Premier
Social Development and Special Programmes
Free State Social Development
Gauteng Finance
KwaZulu-Natal Arts and Culture
Sports and Recreation
Mpumalanga Health
Western Cape Social Development
(3) The following provincial departments reported that there was a combination of recovery
and no loss to the State with regard to the full amount involved in financial misconduct:
PROVINCE
DEPARTMENT
Gauteng Sport, Arts and Culture
Northern Cape Environment and Nature Conservation