facts - university of toronto · university of toronto facts & figures 2012 4. vice-president...
TRANSCRIPT

Facts & Figures
2012
C
M
Y
CM
MY
CY
CMY
K
1 FandF_2011.pdf 1 2/2/2012 3:20:47 PM

Facts and Figures is prepared annually by the Office of the
Assistant Vice-President, Government, Institutional and Community Relations. Facts and Figures provides answers
to some of the most frequently asked questions about the
University. It is designed and organized to serve as a useful
and reliable source of reference information from year to year.
The reader of Facts and Figures should take care when
attempting to use the enclosed information comparatively.
While some definitions are common to other universities,
many others are not. Our office maintains some comparative
databases and has access to others. Please contact us for
assistance in using Facts and Figures comparatively.
Each year we try to improve Facts and Figures to make it as
useful as possible. We are always grateful for suggestions for
improvement.
Facts and Figures can also be accessed on the Internet at http://www.utoronto.ca/about-uoft/quickfacts/factsandfigures.htm
Other official publications of the University can be found on
the About U of T website: http://www.utoronto.ca/about-uoft/measuring-our-performance.htm
Facts & Figures 2012 Project Manager: Xuelun Liang
Xuelun can be reached via e-mail at:
Contributors include: Brian Armstrong, Michelle Broderick,
Helen Choy, Arlene Clement, Maya Collum, Vinitha Gengatharan,
Phil Harper, Jane Harrison, Rick Haywood, Lari Langford,
Jason Lee, Jennifer Leigh, Maureen Lynham, Barry Murphy,
Al Nausedas, Alex Nishri, Corinne Pask-Aubé, Lou Ranalli,
José Sigouin, and Donna Wall.
Government, Institutional and Community Relations
Room 5, Simcoe Hall
27 King's College Circle
Toronto, Ontario
M5S 1A1
http://www.universityrelations.utoronto.ca/gicr

CONTENTS
Part A General 3
1. Organization of Senior Administration
2. Academic Divisions and Units
3. Degrees, Diplomas and Certificates Offered by Division
Part B Finances 15
University of Toronto Financial Statements
1. Statement of Operations
2. Changes in Surplus/Deficit
3. Operating Fund Expense Summary
4. Operating Fund: Academic Expense Summary
5. Restricted Funds
University of Toronto Budget Reports
6. Expense Budget Summary
7. Academic Costs
Part C Research 25
1. Research Funds Awarded by Sector
2. Research Funds Awarded by Administrative Site
3. Academic Linkages between the University of Toronto and
International Institutions
4. Technology Transfer Activities
Part D Students 29
1. Enrolment by Campus and Faculty/College
2. Enrolment by Program Mix
3. Enrolment by Age and Gender Balance
4. International Student Enrolment by Geographic Origin
5. International Student Enrolment by Geographic Origin: Five-
Year Trend
6. Ten-Year Enrolment Trends: All Students
7. Gender Balance of Graduate and Undergraduate
Enrolments by Field of Study
8. Undergraduate Intake by Faculty
9. Graduate Intake by Faculty
10. Total Intake
11. Degrees Awarded by Field of Study & Gender
12. Tuition Fee Schedule for Domestic & International Students
13. Tuition Fee Schedule for Self-Funded Programs
Part E Graduates 51
1. Graduates by Region
2. Number of Degree Affiliations by College or Faculty
3. Total Annual Gifts Received
4. Percentage of Pledge Dollars by Donor Sector
University of Toronto Facts & Figures 2012 1

Part F Student Awards 57
1. Undergraduate Student Support : Admission Scholarships,
In-Course Scholarships and Bursaries by Faculty and
College
2. OSAP and University of Toronto Advanced Planning for
Students Program (UTAPS) by Faculty and College
3. Graduate Student Support by Source
4. Graduate Student Support by S.G.S. Division
Part G Faculty and Administrative Staff 65
1. Distribution of Full-Time Appointed Tenured/Tenure Stream
Faculty by Major Division and Main Appointment
2. Distribution of Full-Time Tenured/Tenure Stream Faculty by
Rank and Gender
3. Age Distribution of Tenured/Tenure Stream Faculty
4. Distribution of Full and Part-Time (>=25%) Academic Staff
and Librarians by Rank and Gender
5. All Active Faculty with Teaching/Research Responsibilities
6. Distribution of Full and Part-Time Administrative and Union
Staff
7. Gross Operating Fund Full-Time Equivalent Staff
Part H Library 73
1. Library Collections
2. Number of Loans
Part I Physical Plant 77
1. Usage of Assignable Space
2. Number of Buildings and Square Metres
3. Area of U of T Properties
4. Number of Parking Spaces
5. Number of Public Assembly Facilities
6. Number of University of Toronto Students in Residence
Part J Computing and Communications 83
1. Number of UTORmail Accounts at Year End
2. Number of Messages Delivered by UTORmail Post Office
3. Number of Web Transactions
4. Institutional Internet Services
- Virtual Private Network (VPN)
5. Campus Wireless Network
6. Usage of Electronic Student Services
University of Toronto Facts & Figures 2012 2

Part AGeneral
Organization of Senior Administration 4
Academic Divisions and Units 6
Degrees, Diplomas and Certificates Offered by
Division 10
University of Toronto Facts & Figures 2012 3
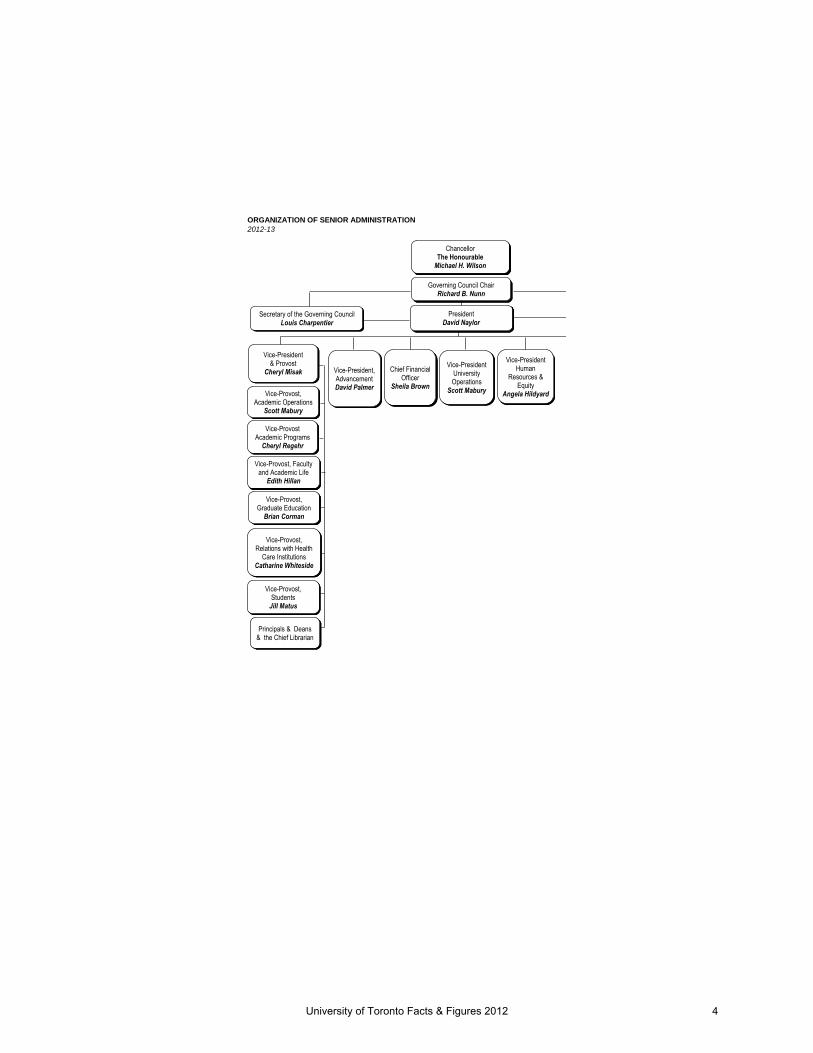
ORGANIZATION OF SENIOR ADMINISTRATION
2012-13
Chancellor The Honourable
Michael H. Wilson
Governing Council Chair Richard B. Nunn
President David Naylor
Vice-President, Advancement David Palmer
Vice-President Human
Resources & Equity
Angela Hildyard
Vice-President & Provost
Cheryl Misak
Vice-Provost, Students
Jill Matus
Vice-Provost, Graduate Education
Brian Corman
Vice-Provost, Faculty and Academic Life
Edith Hillan
Vice-Provost, Relations with Health
Care Institutions Catharine Whiteside
Vice-Provost, Academic Operations
Scott Mabury
Vice-President University Operations
Scott Mabury
Secretary of the Governing Council Louis Charpentier
Vice-Provost Academic Programs
Cheryl Regehr
Principals & Deans & the Chief Librarian
Chief Financial Officer
Sheila Brown
University of Toronto Facts & Figures 2012 4

Vice-President Research
Paul Young
Vice-President University Relations
Judith Wolfson
Vice- President & Principal,
UofT Mississauga Hargurdeep Saini
Vice- President & Principal,
UofT Scarborough Franco Vaccarino
Vice-Chair Judy Goldring
Senior Legal Council Steve Moate
University of Toronto Facts & Figures 2012 5

ACADEMIC DIVISIONS AND UNITS
2012-13
Faculty of Applied Science and Engineering
Aerospace Studies, Institute for
Chemical Engineering and Applied Chemistry, Department of
Civil Engineering, Department of
Electrical and Computer Engineering, The Edward S. Rogers Sr. Department of
Engineering Science, Division of
Materials Science and Engineering, Department of
Mechanical and Industrial Engineering, Department of
John H. Daniels Faculty of Architecture, Landscape, and Design
Faculty of Arts and Science (St. George Campus)
Anthropology, Department of
Art, Department of
Astronomy & Astrophysics, Department of
Astronomy & Astrophysics, Dunlap Institute for
Cell and Systems Biology, Department of
Chemistry, Department of
Cinema Studies Institute
Classics, Department of
Comparative Literature, Centre for
Computer Science, Department of
Criminology & Sociolegal Studies, Centre for
Diaspora and Transnational Studies, Centre for
Drama, Theatre, and Performance Studies, Centre for
Earth Sciences, Department of
East Asian Studies, Department of
Ecology and Evolutionary Biology, Department of
Economics, Department of
English, Department of
Environment, School of
European, Russian and Eurasian Studies, Centre for
French, Department of
Geography, Department of
Germanic Languages & Literatures, Department of
Global Affairs, Munk School of
History, Department of
History & Philosophy of Science & Technology, Institute for the
Industrial Relations and Human Resources, Centre for
Italian Studies, Department of
Linguistics, Department of
Mathematics, Department of
Medieval Studies, Centre for
Near & Middle Eastern Civilizations, Department of
Philosophy, Department of
Physics, Department of
Political Science, Department of
Psychology, Department of
Sexual Diversity Studies, Mark S. Bonham Centre for
Slavic Languages & Literatures, Department of
Sociology, Department of
University of Toronto Facts & Figures 2012 6

ACADEMIC DIVISIONS AND UNITS (continued)
2012-13
Faculty of Arts and Science (St. George Campus) (continued)
Spanish & Portuguese, Department of
Statistical Sciences, Department of
Study of Religion, Department for the
Theoretical Astrophysics, Canadian Institute for (CITA)
Women and Gender Studies, Institute for
Faculty of Arts and Science - Colleges (St. George Campus)
Constituent Colleges:
Innis College
New College
University College
Woodsworth College
Federated Colleges:
St. Michael's College
Trinity College
Victoria College
School of Continuing Studies
Faculty of Dentistry
Faculty of Forestry
Faculty of Information
Faculty of Kinesiology and Physical Education
Faculty of Law
Joseph L. Rotman School of Management
Faculty of Medicine
Anesthesia, Department of
Biochemistry, Department of
Cellular & Biomolecular Research, The Terrence Donnelly Centre for
Family and Community Medicine, Department of
Health Policy, Management and Evaluation, Institute of
Immunology, Department of
Laboratory Medicine and Pathobiology, Department of
Medical Biophysics, Department of
Medical Imaging, Department of
Medical Research, The Banting and Best Department of
Medical Science, Institute of
Medicine, Department of
Molecular Genetics, Department of
Nutritional Sciences, Department of
Obstetrics and Gynaecology, Department of
Occupational Science and Occupational Therapy, Department of
Ophthalmology and Vision Sciences, Department of
Otolaryngology - Head and Neck Surgery, Department of
University of Toronto Facts & Figures 2012 7
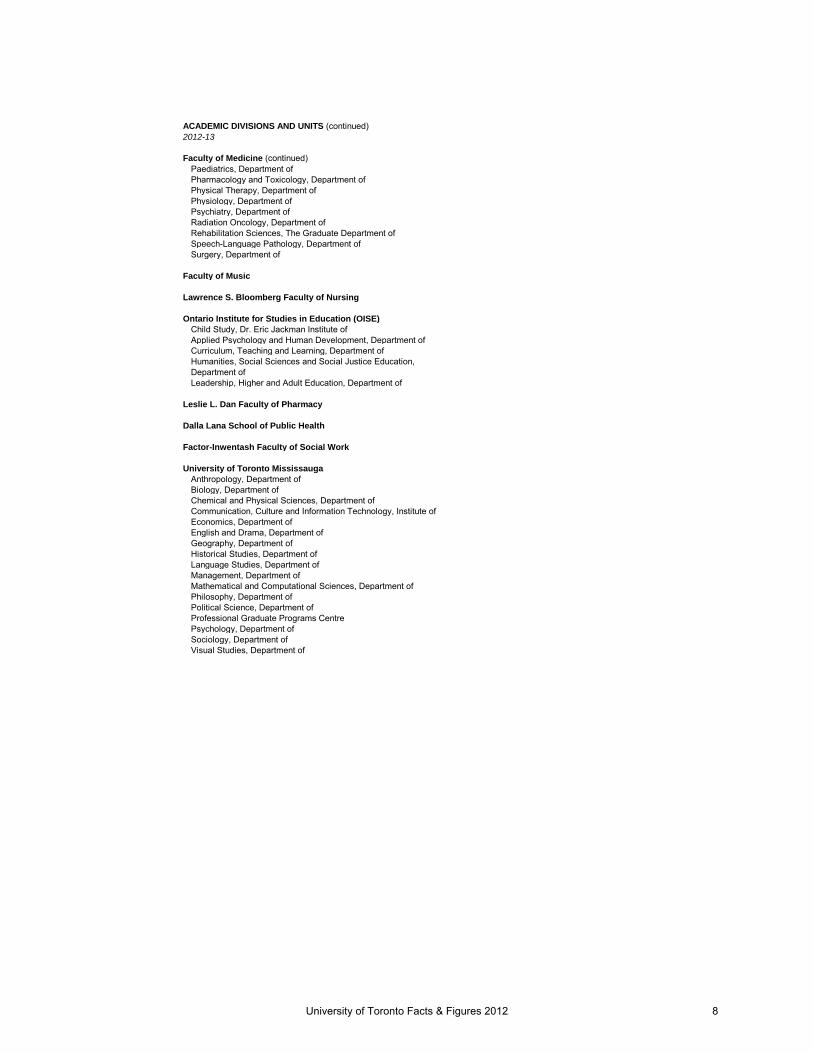
ACADEMIC DIVISIONS AND UNITS (continued)
2012-13
Faculty of Medicine (continued)
Paediatrics, Department of
Pharmacology and Toxicology, Department of
Physical Therapy, Department of
Physiology, Department of
Psychiatry, Department of
Radiation Oncology, Department of
Rehabilitation Sciences, The Graduate Department of
Speech-Language Pathology, Department of
Surgery, Department of
Faculty of Music
Lawrence S. Bloomberg Faculty of Nursing
Ontario Institute for Studies in Education (OISE)
Child Study, Dr. Eric Jackman Institute of
Applied Psychology and Human Development, Department of
Curriculum, Teaching and Learning, Department of
Humanities, Social Sciences and Social Justice Education,
Department of
Leadership, Higher and Adult Education, Department of
Leslie L. Dan Faculty of Pharmacy
Dalla Lana School of Public Health
Factor-Inwentash Faculty of Social Work
University of Toronto Mississauga
Anthropology, Department of
Biology, Department of
Chemical and Physical Sciences, Department of
Communication, Culture and Information Technology, Institute of
Economics, Department of
English and Drama, Department of
Geography, Department of
Historical Studies, Department of
Language Studies, Department of
Management, Department of
Mathematical and Computational Sciences, Department of
Philosophy, Department of
Political Science, Department of
Professional Graduate Programs Centre
Psychology, Department of
Sociology, Department of
Visual Studies, Department of
University of Toronto Facts & Figures 2012 8
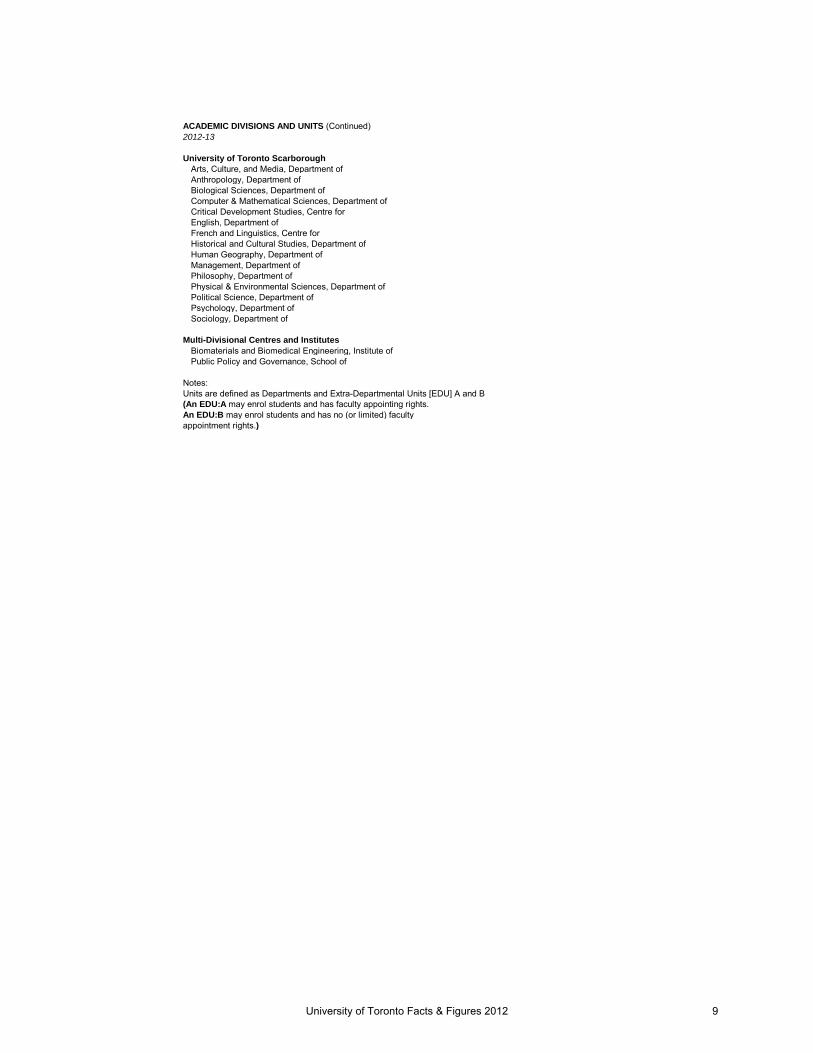
ACADEMIC DIVISIONS AND UNITS (Continued)
2012-13
University of Toronto Scarborough
Arts, Culture, and Media, Department of
Anthropology, Department of
Biological Sciences, Department of
Computer & Mathematical Sciences, Department of
Critical Development Studies, Centre for
English, Department of
French and Linguistics, Centre for
Historical and Cultural Studies, Department of
Human Geography, Department of
Management, Department of
Philosophy, Department of
Physical & Environmental Sciences, Department of
Political Science, Department of
Psychology, Department of
Sociology, Department of
Multi-Divisional Centres and Institutes
Biomaterials and Biomedical Engineering, Institute of
Public Policy and Governance, School of
Notes:
Units are defined as Departments and Extra-Departmental Units [EDU] A and B
(An EDU:A may enrol students and has faculty appointing rights.
An EDU:B may enrol students and has no (or limited) faculty
appointment rights.)
University of Toronto Facts & Figures 2012 9

DEGREES, DIPLOMAS AND CERTIFICATES OFFERED BY DIVISION
2012-13
Faculty of Applied Science and Engineering:
Undergraduate
Bachelor of Applied Science B.A.Sc.
Bachelor of Applied Science in Engineering Science B.A.Sc. In Engineering Science
Graduate
Master of Applied Science M.A.Sc.
Master of Engineering M.Eng.
Master of Engineering in Design and Manufacturing M.Eng.D.M.
Master of Health Science M.H.Sc.
Doctor of Philosophy Ph.D.
John H. Daniels Faculty of Architecture, Landscape, and Design:
Undergraduate
Honours Bachelor of Arts B.A., Hons.
Graduate
Master of Architecture M.Arch.
Master of Landscape Architecture M.L.A.
Master of Urban Design M.U.D.
Faculty of Arts and Science, St. George Campus:
Undergraduate
Honours Bachelor of Arts B.A., Hons.
Honours Bachelor of Science B.Sc., Hons.
Bachelor of Commerce B.Com.
Graduate
Master of Arts M.A.
Master of Science M.Sc.
Master of Financial Economics (with Rotman School
of Management) M.F.E.
Master of Global Affairs M.G.A.
Master of Industrial Relations and Human Resources M.I.R.H.R.
Master of Mathematical Finance M.M.F.
Master of Public Policy M.P.P.
Master of Science in Applied Computing M.Sc.A.C.
Master of Science in Planning M.Sc.Pl.
Master of Urban Design Studies M.U.D.S.
Master of Visual Studies M.V.S.
Doctor of Philosophy Ph.D.
Faculty of Dentistry:
Undergraduate
Doctor of Dental Surgery D.D.S.
Graduate
M.Sc./Dental Specialty Program M.Sc.
Doctor of Philosophy Ph.D.
Faculty of Forestry:
Graduate
Master of Forest Conservation M.F.C.
Master of Science in Forestry M.Sc.F.
Doctor of Philosophy Ph.D.
University of Toronto Facts & Figures 2012 10

DEGREES, DIPLOMAS AND CERTIFICATES OFFERED BY DIVISION
(continued)
2012-13
Faculty of Information:
Undergraduate
Honours Bachelor of Arts (with U of T Mississauga) B.A., Hons.
Graduate
Master of Information M.I.
Master of Museum Studies M.M.St.
Doctor of Philosophy Ph.D.
Graduate Diploma of Advanced Study in Information
Studies G.Dip.I.St
Faculty of Kinesiology and Physical Education:
Undergraduate
Bachelor of Physical and Health Education B.P.H.E.
Bachelor of Kinesiology B.Kin.
Graduate
Master of Science M.Sc.
Doctor of Philosophy Ph.D.
Faculty of Law:
Undergraduate
Juris Doctor J.D.
Graduate
Global Professional Master of Laws G.P.LL.M.
Master of Laws LL.M.
Master of Studies in Law M.S.L.
Doctor of Juridical Science S.J.D.
Joseph L. Rotman School of Management:
Graduate
Omnium Global Executive Master of Business
Administration E.M.B.A.
Master of Business Administration M.B.A.
Master of Finance M.F.
Master of Financial Economics (with Arts & Science) M.F.E.
Doctor of Philosophy Ph.D.
Faculty of Medicine:
Undergraduate
Doctor of Medicine M.D.
Bachelor of Science, Medical Radiation Sciences B.Sc.Med.Rad.Sc.
Bachelor of Science, Physician Assistant B.Sc.P.A.
University of Toronto Facts & Figures 2012 11

DEGREES, DIPLOMAS AND CERTIFICATES OFFERED BY DIVISION
(continued)
2012-13
Faculty of Medicine (continued):
Graduate
Master of Science M.Sc.
Master of Science in Biomedical Communications M.Sc.BMC
Master of Health Informatics M.H.I.
Master of Health Science M.H.Sc.
Master of Management of Innovation M.M.I.
Master of Public Health M.P.H.
Master of Science in Community Health M.Sc.C.H.
Master of Science in Occupational Therapy M.Sc.O.T.
Master of Science in Physical Therapy M.Sc.P.T.
Doctor of Philosophy Ph.D.
Diploma in Community Health Dip.C.H.
Post Doctoral
Diploma in Child Psychiatry D.Child Psych.
Diploma in Clinical Chemistry D.Cl.Chem.
Diploma in Industrial Health D.I.H.
Faculty of Music:
Undergraduate
Bachelor of Music B.Mus.
Bachelor of Music in Performance Mus Bac.Perf.
Advanced Certificate in Performance Adv.Cert.Perf.
Artist Diploma Art.Dip.Mus.
Diploma in Operatic Performance Dip.Op.Perf.
Graduate
Master of Music M.Mus.
Master of Arts M.A.
Doctor of Musical Arts D.M.A.
Doctor of Philosophy Ph.D.
Lawrence S. Bloomberg Faculty of Nursing:
Undergraduate
Bachelor of Science in Nursing B.Sc.N.
Graduate
Master of Nursing M.N.
Doctor of Philosophy Ph.D.
Graduate Diploma in Anesthesia Care G.Dip.NPAC.
Post Masters Nurse Practioner Diploma Dip.N.P.
University of Toronto Facts & Figures 2012 12

DEGREES, DIPLOMAS AND CERTIFICATES OFFERED BY DIVISION
(continued)
2012-13
Ontario Institute for Studies in Education (OISE):
Undergraduate
Bachelor of Education (consecutive) B.Ed.
Diploma in Technological Education Dip.T.Ed.
Graduate
Master of Education M.Ed.
Master of Teaching M.T.
Master of Arts M.A.
Doctor of Education Ed.D.
Doctor of Philosophy Ph.D.
Leslie L. Dan Faculty of Pharmacy:
Undergraduate
Bachelor of Science in Pharmacy B.Sc.Phm.
Doctor of Pharmacy Pharm.D.
Graduate
Master of Science M.Sc.
Doctor of Philosophy Ph.D.
School of Public Policy and Governance:
Master of Public Policy M.P.P.
Factor-Inwentash Faculty of Social Work:
Graduate
Master of Social Work M.S.W.
Doctor of Philosophy Ph.D.
Diploma in Social Service Administration D.S.S.A.
University of Toronto Mississauga:
Undergraduate
Honours Bachelor of Arts B.A., Hons.
Honours Bachelor of Science B.Sc., Hons.
Bachelor of Business Administration B.B.A.
Bachelor of Commerce B.Com.
University of Toronto Facts & Figures 2012 13

DEGREES, DIPLOMAS AND CERTIFICATES OFFERED BY DIVISION
(continued)
2012-13
University of Toronto Mississauga (continued):
Graduate
Master of Arts M.A.
Master of Science M.Sc.
Doctor of Philosophy Ph.D.
Master of Biotechnology M.Biotech
Master of Management & Professional Accounting M.M.P.A.
Diploma in Investigative & Forensic Accounting D.I.F.A.
University of Toronto Scarborough:
Undergraduate
Honours Bachelor of Arts B.A., Hons.
Honours Bachelor of Science B.Sc., Hons.
Bachelor of Business Administration B.B.A.
Certificate in Business Cert.Bus.
Graduate
Master of Arts M.A.
Master of Science M.Sc.
Masters in Environmental Science M.Env.Sc.
Doctor of Philosophy Ph.D.
Woodsworth College:
Undergraduate
Certificate in Human Resource Management C.H.R.M.
Certificate in Teaching English to Speakers of Other
Languages C.T.E.S.O.L.
COMBINED PROGRAMS:
Master of Business Administration and Jeffrey Skoll
Bachelor of Applied Science B.A.Sc./M.B.A.
Master of Health Science in Health Administration
and Master of Nursing M.H.Sc./M.N.
Master of Health Science in Health Administration
and Master of Social Work M.H.Sc./M.S.W.
Doctor of Medicine and Doctor of Philosophy M.D./Ph.D.
Juris Doctor and Certificate in Environmental Studies J.D./Certificate in Environmental
Studies
Juris Doctor and Master of Arts (Criminology,
Economics, English, European, Russian and
Eurasian Studies) J.D./M.A.
Juris Doctor and Master of Business Administration J.D./M.B.A.
Juris Doctor and Master of Global Affairs J.D./M.G.A.
Juris Doctor and Master of Information J.D./M.I.
Juris Doctor and Master of Social Work J.D./M.S.W.
Juris Doctor and Doctor of Philosophy (Economics,
Philosophy, Political Science) combined programs J.D./Ph.D.
CONCURRENT TEACHER EDUCATION PROGRAMS:
Bachelor of Arts and Bachelor of Education B.A., Hons./B.Ed.
Bachelor of Science and Bachelor of Education B.Sc., Hons./B.Ed.
Bachelor of Music and Bachelor of Education B.Mus./B.Ed.
Bachelor of Physical Education & Health and
Bachelor of Education B.P.H.E./B.Ed.
University of Toronto Facts & Figures 2012 14

Part BFinances
University of Toronto Financial Statements
Statement of Operations 16
Changes in Surplus/Deficit 18
Operating Fund: Expense Summary 19
Operating Fund: Academic Expense Summary 20
Restricted Funds 21
University of Toronto Budget Reports
Expense Budget Summary 22
Academic Costs 23
University of Toronto Facts & Figures 2012 15

UNIVERSITY OF TORONTO FINANCIAL STATEMENTS 2011-12STATEMENT OF OPERATIONS
for the year ended April 30, 2012.
(with comparative figures for the year ended April 30, 2011)
(millions of dollars)
OPERATING
FUND
ANCILLARY
OPERATIONS
CAPITAL
FUND
RESTRICTED
FUNDS
TOTAL
2012
TOTAL
2011Revenues
Government Grants for general operations 702.2 702.2 691.0
Student Fees 837.8 7.3 2.3 847.4 764.3
0.4 60.0 359.9 420.3 406.4
Sales, services and sundry income 124.7 145.3 1.3 271.3 260.1
Investment income
Endowments 49.8 25.5 75.3 91.7
Other 24.2 0.5 1.0 1.3 27.0 43.9
Donations 0.7 6.4 52.8 59.9 63.7
Total Revenues 1,738.7 154.2 71.0 439.5 2,403.4 2,321.1
Government & other grants & contracts for
restricted purposes
University of Toronto Facts & Figures 2012 16

UNIVERSITY OF TORONTO FINANCIAL STATEMENTS 2011-12STATEMENT OF OPERATIONS (continued)
for the year ended April 30, 2012.
(with comparative figures for the year ended April 30, 2011)
(millions of dollars)
OPERATING
FUND
ANCILLARY
OPERATIONS
CAPITAL
FUND
RESTRICTED
FUNDS
TOTAL
2012
TOTAL
2011Expenses
Salaries 902.4 6.0 217.6 1,126.0 1,082.0
Benefits 389.0 1.7 19.8 410.5 377.9
Materials and supplies 82.0 1.7 138.5 222.2 206.3
Scholarships, fellowships and bursaries 150.8 150.8 141.4
Amortization of capital assets 10.9 12.8 112.7 0.6 137.0 132.1
Cost of sales and services 84.6 84.6 80.4
Utilities 42.2 8.4 2.4 53.0 51.0
Repairs and maintenance 52.6 16.5 3.6 9.0 81.7 79.8
Travel and conferences 22.5 21.1 43.6 40.9
Interest on long-term debt 16.7 16.3 1.3 34.3 32.6
External contracted services 25.3 21.2 46.5 49.6
Telecommunications 10.6 1.3 11.9 11.2
Other 19.2 3.6 13.0 35.8 28.7
Total Expenses 1,724.2 148.0 119.9 445.8 2,437.9 2,313.9
University of Toronto Facts & Figures 2012 17

UNIVERSITY OF TORONTO FINANCIAL STATEMENTS 2011-12CHANGES IN SURPLUS/DEFICIT
for the year ended April 30, 2012.
(with comparative figures for the year ended April 30, 2011)
(millions of dollars)
OPERATING
FUND
ANCILLARY
OPERATIONS
CAPITAL
FUND
RESTRICTED
FUNDS
TOTAL
2012
TOTAL
2011Net Income (loss) 14.5 6.2 (48.9) (6.3) (34.5) 7.2
Net transfers between funds (21.2) 2.7 14.7 3.8
Transfer of capital assets funding (62.3) 62.3
Unrealized gain (loss) on swap contracts
Change in internally restricted 48.9 (1.0) 17.7 (1.8) 63.8 45.8
Change in investments in capital assets 25.8 (20.7) 5.1 (27.1)
Transfers of donations to endowments (3.3) (3.3) (2.1)
Transfer to internally restricted endowments 7.6 7.6 (10.9)
(20.1) 33.7 25.1 38.7 12.9
Unrestricted deficit, beginning of year 5.4 (115.4) (63.9) (173.9) (186.8)
Unrestricted surplus (deficit), end of year (14.7) (81.7) (38.8) (135.2) (173.9)
Net change in unrestricted surplus (deficit) for
the year
University of Toronto Facts & Figures 2012 18

UNIVERSITY OF TORONTO FINANCIAL STATEMENTS 2011-12
OPERATING FUND: EXPENSE SUMMARY
Expense Summary for the year ended April 30, 2012
(with comparative totals for the year ended April 30, 2011)
(thousands of dollars)
ACADEMIC
SALARIES
OTHER
SALARIES
STAFF
BENEFITS
TOTAL
SALARIES
AND
BENEFITS
SUPPLIES
AND OTHER
EXPENSES
SCHOLARSHIPS
FELLOWSHIPS
BURSARIES
TOTAL
ELIMINATIONS
AND RECLASS-
IFICATIONS*
TOTAL
DIVISIONAL
EXPENSE
Academic 499,480 223,983 154,448 877,910 172,273 1,050,183 96,611 1,146,794
Academic Services 12,646 24,364 8,350 45,360 41,152 86,512 (2,141) 84,371
Campus & Student Services 25,627 5,161 30,788 11,649 42,437 4,944 47,380
Student Assistance 5,175 665 5,840 795 150,558 157,192 318 157,511Operation & Maintenance of
Physical Plant 46,425 10,892 57,316 152,359 209,675 (63,191) 146,484
Administration 67,313 15,342 82,655 28,529 111,184 8,966 120,150
Interest 16,685 16,685
Renovations and Alterations 13,268 13,268 1,652 14,920
Amortization 10,868 10,868
Other Expenditures 23,475 3,801 27,276 24,725 52,001 (10,766) 41,235
Sub-Total 512,125 416,361 198,658 1,127,145 444,750 150,558 1,722,453 63,945 1,786,398
Eliminations (20,363) (5,758) 190,362 164,240 (100,511) 216 63,945
Total Expenses 491,762 410,603 389,020 1,291,385 344,239 150,774 1,786,398 1,786,398
2010-11 Comparatives 468,922 397,400 357,556 1,223,978 317,840 141,406 1,683,124
Percentage Change 4.9% 3.3% 8.8% 5.5% 8.3% 6.6% 6.1%
*Eliminations and Reclassifications are external recovery of salaries and benefits as well as internal departmental changes between different functional groups.
University of Toronto Facts & Figures 2012 19

UNIVERSITY OF TORONTO FINANCIAL STATEMENTS 2011-12
OPERATING FUND: ACADEMIC EXPENSE SUMMARY
For the year ending April 30, 2012
(with comparative totals for the year ended April 30, 2011)
(thousands of dollars)
NET
EXPENSES
2011-12
NET
EXPENSES
2010-11
Arts & Science, Colleges & Schools:
Faculty of Arts & Science $247,770 $243,493
Federated Colleges Block Grant 14,029 13,907
Graduate Centres & Institutes 6,381 6,672
Mississauga, University of Toronto 77,585 72,606
Scarborough, University of Toronto 75,549 75,904
School of Continuing Studies 19,903 17,351
School of Graduate Studies 5,214 5,168
Transitional Year Program 1,562 1,601
Health Science Faculties/Schools:
Faculty of Dentistry 37,136 35,228
Faculty of Medicine 149,618 144,831
Faculty of Nursing 10,429 12,773
Faculty of Pharmacy 15,559 14,648
Faculty of Kinesiology & Physical Education 27,028 25,936
Other Professional Faculties:
Faculty of Applied Science & Engineering 82,802 80,606
Faculty of Architecture, Landscape, and Design 8,674 7,865
Faculty of Forestry 3,103 3,020
Faculty of Information 8,324 8,190
Faculty of Law 19,480 18,955
Management, Rotman School of 78,287 71,124
Faculty of Music 14,117 12,937
OISE/UT (includes University of Toronto
Schools) 60,037 59,278
Faculty of Social Work 7,092 6,479
Other Academic 177,114 151,240
Total Academic Expense $1,146,794 $1,089,812
University of Toronto Facts & Figures 2012 20

UNIVERSITY OF TORONTO FINANCIAL STATEMENTS 2011-12RESTRICTED FUNDS
Endowments and Expendable Funds at Fair Value
for the year ending April 30, 2012 (with comparative figures for the year ended April 30, 2011)
(thousands of dollars)
ENDOWMENT FUNDS EXPENDABLE FUNDS
2012 2011 2012 2011
l'Anson Fund $2,357 $2,440 $793 $671
Connaught Funds 75,814 78,496 7,776 5,963
Departmental Funds 186,971 190,290 151,802 139,913
Faculty Endowment Funds 460,440 464,559 10,519 10,589
Miscellaneous Funds 30,086 30,514 18,329 20,934Ontario Student Opportunity Trust Funds Phase 1 266,618 276,012 22,870 20,958Ontario Student Opportunity Trust Funds Phase 2 32,053 33,196 3,014 2,627Ontario Trust for Student Support 58,118 54,053 3,590 2,886
Research Funds 107,272 111,037 188,656 201,908
Student Aid Funds 298,386 298,796 35,389 33,609
Total University of Toronto $1,518,115 $1,539,393 $442,738 $440,058
Affiliated Universities 496,403 402,985 na na
Total $2,014,518 $1,942,378 na na
University of Toronto Facts & Figures 2012 21

UNIVERSITY OF TORONTO BUDGET REPORTSEXPENSE BUDGET SUMMARY
Time Series Comparison of Major Budget Categories, based on net expense budgets
2010-11 to 2012-13
(Millions of dollars)
PERCENT PERCENT
INCREASE OVER INCREASE OVER
PRIOR YEAR PRIOR YEAR
Academic 984.2 6% 931.2 6% 875.8
Academic Services 68.6 4% 65.9 3% 63.9
Student Services 4.6 52% 3.0 52% 2.0
Student Assistance 108.3 10% 98.9 9% 90.4
Facilities & Services 82.3 5% 78.4 5% 74.6
Utilities 54.4 1% 53.9 -1% 54.7
Administration 146.4 4% 141.4 10% 128.9
General University Expense 118.8 22% 97.5 35% 72.1
Municipal Taxes 5.3 2% 5.2 2% 5.1
Total Expense Budget Summary 1,572.8 7% 1,475.3 8% 1,367.6
Administrative costs as % of Total Costs 9% 10% 9%
Facilities & Services costs as % of Total Costs 5% 5% 5%
General University Costs as % of Total Costs 8% 7% 5%
2012-13 2011-12 2010-11
University of Toronto Facts & Figures 2012 22

UNIVERSITY OF TORONTO BUDGET REPORTSACADEMIC COSTS
Time Series Comparison of Major Academic Costs, based on Net Expense Budgets
2010-11 to 2012-13
(Millions of dollars)
PERCENT PERCENT
INCREASE INCREASE
PERCENT OVER PERCENT OVER PERCENT
OF PRIOR OF PRIOR OF
2012-13 BUDGET YEAR 2011-12 BUDGET YEAR 2010-11 BUDGET
Gross Expense Budget 1,332.4 1,281.7 1,218.1
Recoveries (196.1) (190.7) (192.1)
Divisional Income (152.2) (159.8) (150.2)
Net Expense Budget 984.2 6% 931.2 6% 875.8
Arts & Science, Colleges & Schools 475.8 48% 8% 439.5 47% 6% 413.7 47%
Health Sciences 163.5 17% 7% 153.4 16% 10% 139.2 16%
Other Professional Faculties 249.1 25% 5% 237.1 25% 5% 225.2 26%
Other Academic Costs 95.7 10% -5% 101.2 11% 4% 97.7 11%
Net Expense Budget 984.2 100% 931.2 100% 875.8 100%
Instructional Salaries 590.2 44% 3% 573.7 45% 5% 548.4 45%
Other Salaries & Wages 198.1 15% 1% 196.6 15% 4% 189.6 16%
Benefits 171.1 13% 2% 167.0 13% 6% 157.0 13%
Supplies & Services 310.4 23% 8% 288.0 22% 7% 269.6 22%
Student Awards 62.5 5% 11% 56.4 4% 6% 53.4 4%
Gross Expense Budget 1,332.4 100% 1,281.7 100% 1,218.1 100%
University of Toronto Facts & Figures 2012 23

University of Toronto Facts & Figures 2012 24
Part CResearch
Research Funds Awarded by Sector 26
Research Funds Awarded by Administrative Site 26
Academic Linkages between the University of
Toronto and International Institutions 27
Technology Transfer Activities 28
University of Toronto Facts & Figures 2012 25

RESEARCH FUNDS AWARDED BY SECTOR
(thousands of dollars)
2008-09 2009-10 2010-11
Federal Granting Councils $338,555 $330,991 $347,579
Other Federal 93,795 135,319 153,125
Government of Ontario 163,994 152,730 185,580
Other Government 766 1,105 2,085
Corporations 66,121 57,552 79,235
International 23,182 23,521 29,625
Not-for-Profit 141,961 169,403 209,953
Inter-institutional Collaboration 71,650 64,664 74,745
Grand Total $900,024 $935,285 $1,081,927
Note: All indirect costs are included.
RESEARCH FUNDS AWARDED BY ADMINISTRATIVE SITE
(thousands of dollars)
2008-09 2009-10 2010-11
University of Toronto $435,173 $445,886 $460,528
Partner Hospitals 464,851 489,399 621,400
Grand Total $900,024 $935,285 $1,081,928
Note: All indirect costs are included.
University of Toronto Facts & Figures 2012 26

ACADEMIC LINKAGES BETWEEN THE UNIVERSITY OF TORONTO AND INTERNATIONAL INSTITUTIONS
December 2012
REGIONNUMBER OF
MOUS*Africa 5
Asia 77
Europe 99
Middle East 6
North America 17
Oceania 12
Latin America & Caribbean 14
Total 230
*Memoranda of Understanding (MOUs) are formal
arrangements between institutions which outline
how they plan to cooperate over a specified
period of time (normally, five years).
The areas included in MOUs are:
- joint research activities,
- participation in each institution's seminars and academic meetings,
- exchange of academic materials,
- short-term academic programs, and
- exchange of students.
Africa 2%
Asia 34%
Europe 43%
Middle East 3%
North America 7%
Oceania 5%
Latin America & Caribbean
6%
University of Toronto Facts & Figures 2012 27

TECHNOLOGY TRANSFER ACTIVITIES
DISCLOSURE ACTIVITY
2008-09 2009-10 2010-11
Number of UofT Inventions* Disclosed 148 136 192
COMMERCIALIZATION ACTIVITY
2008-09 2009-10 2010-11Number of New License Agreements Signed 21 25 20
Gross Invention Revenue** 8,753,460 3,027,017 3,229,626
New Start-up Companies 7 18 23
* Includes copyright disclosures.
** Includes revenue paid to Inventors and other institutions
All figures exclude affiliated hospitals.
Data as at August 24, 2012
University of Toronto Facts & Figures 2012 28

Part D
Students
Enrolment by Campus and Faculty/College 30
Enrolment by Program Mix 32
Enrolment by Age and Gender Balance 33
International Student Enrolment by Geographic
Origin 34
International Student Enrolment by Geographic
Origin: Five-Year Trend 36
Ten-Year Enrolment Trends: All Students 39
Gender Balance of Graduate and Undergraduate
Enrolments by Field of Study 40
Undergraduate Intake by Faculty 41
Graduate Intake by Faculty 42
Total Intake 43
Degrees Awarded by Field of Study and Gender 44
Tuition Fee Schedule for Domestic and
International Students 45
Tuition Fee Schedule for Self-Funded Programs 50
University of Toronto Facts & Figures 2012 29

ENROLMENT BY CAMPUS AND FACULTY/COLLEGE
November 1, 2012
Full- Part- Percent Full- Part- Percent Percent Under-
FACULTY/COLLEGE BY CAMPUS Time Time Female Time Time Female Total Female graduate Graduate Total
St. George Campus
Applied Science & Engineering 4,575 839 24% 1,684 268 26% 7,366 24% 4,820 1,764 6,584
Architecture Landscape & Design 311 11 62% 361 12 53% 695 51% 285 365 649
Arts & Science 23,934 2,873 59% 3,515 135 48% 30,457 58% 22,473 3,556 26,029
Innis 1,785 127 56% 0 0 --- 1,912 56% 1,656 0 1,656
New 4,324 441 55% 0 0 --- 4,765 55% 4,003 0 4,003
St. Michael's 4,442 318 58% 0 0 --- 4,760 58% 4,104 0 4,104
Trinity 1,729 102 62% 0 0 --- 1,831 62% 1,667 0 1,667
University 3,930 316 60% 0 0 --- 4,246 60% 3,686 0 3,686
Victoria 3,209 234 68% 0 0 --- 3,443 68% 3,042 0 3,042
Woodsworth 4,515 1,335 57% 0 0 --- 5,850 57% 4,316 0 4,316
Dentistry 327 0 57% 132 1 56% 460 61% 327 132 459
Forestry 0 0 --- 97 5 53% 102 55% 0 99 99
Information 0 0 --- 441 133 72% 574 73% 0 481 481
Kinesiology & Physical Ed. 846 28 55% 64 3 52% 941 55% 773 65 838
Law 607 43 48% 125 6 57% 781 48% 649 127 775
Management 0 0 1,227 6 31% 1,233 30% 0 1,232 1,232
Medicine 4,213 5 50% 2,811 200 64% 7,229 56% 4,237 2,881 7,117
Music 572 12 53% 259 4 55% 847 54% 589 260 849
Nursing 338 0 89% 284 33 91% 655 91% 338 294 632
STUDENTS STUDENTSSTUDENTS
GRADUATE
STUDENTS
UNDERGRADUATE ALL FTE
University of Toronto Facts & Figures 2012 30
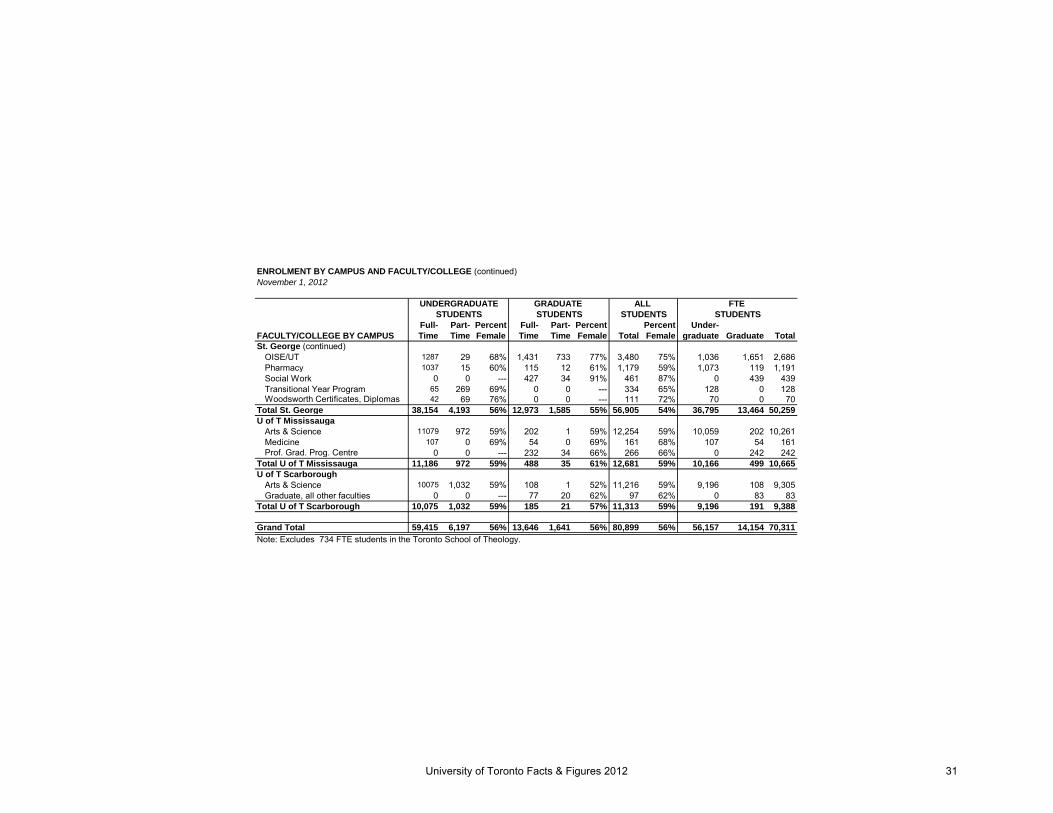
ENROLMENT BY CAMPUS AND FACULTY/COLLEGE (continued)
November 1, 2012
Full- Part- Percent Full- Part- Percent Percent Under-
FACULTY/COLLEGE BY CAMPUS Time Time Female Time Time Female Total Female graduate Graduate Total
St. George (continued)
OISE/UT 1287 29 68% 1,431 733 77% 3,480 75% 1,036 1,651 2,686
Pharmacy 1037 15 60% 115 12 61% 1,179 59% 1,073 119 1,191
Social Work 0 0 --- 427 34 91% 461 87% 0 439 439
Transitional Year Program 65 269 69% 0 0 --- 334 65% 128 0 128Woodsworth Certificates, Diplomas 42 69 76% 0 0 --- 111 72% 70 0 70
Total St. George 38,154 4,193 56% 12,973 1,585 55% 56,905 54% 36,795 13,464 50,259
U of T Mississauga
Arts & Science 11079 972 59% 202 1 59% 12,254 59% 10,059 202 10,261
Medicine 107 0 69% 54 0 69% 161 68% 107 54 161
Prof. Grad. Prog. Centre 0 0 --- 232 34 66% 266 66% 0 242 242
Total U of T Mississauga 11,186 972 59% 488 35 61% 12,681 59% 10,166 499 10,665
U of T Scarborough
Arts & Science 10075 1,032 59% 108 1 52% 11,216 59% 9,196 108 9,305
Graduate, all other faculties 0 0 --- 77 20 62% 97 62% 0 83 83
Total U of T Scarborough 10,075 1,032 59% 185 21 57% 11,313 59% 9,196 191 9,388
Grand Total 59,415 6,197 56% 13,646 1,641 56% 80,899 56% 56,157 14,154 70,311
Note: Excludes 734 FTE students in the Toronto School of Theology.
STUDENTS
GRADUATE
STUDENTS STUDENTS STUDENTS
UNDERGRADUATE ALL FTE
University of Toronto Facts & Figures 2012 31
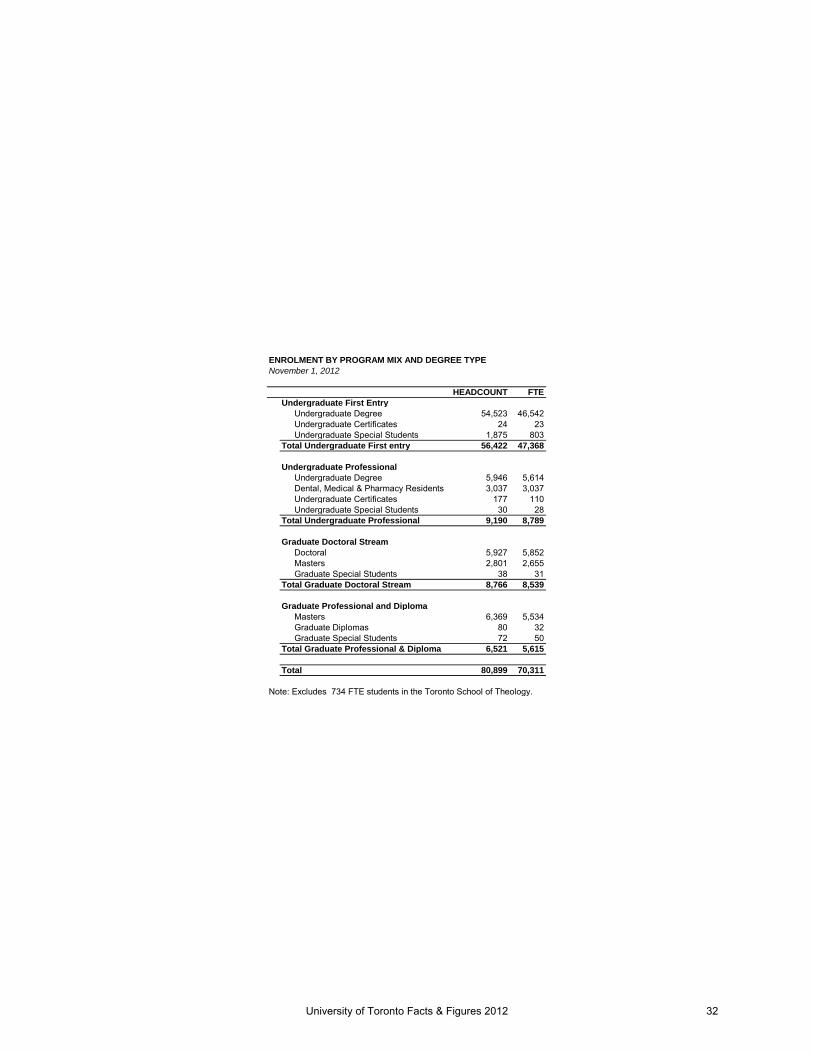
ENROLMENT BY PROGRAM MIX AND DEGREE TYPE
November 1, 2012
HEADCOUNT FTE
Undergraduate First Entry
Undergraduate Degree 54,523 46,542
Undergraduate Certificates 24 23
Undergraduate Special Students 1,875 803
Total Undergraduate First entry 56,422 47,368
Undergraduate Professional
Undergraduate Degree 5,946 5,614
Dental, Medical & Pharmacy Residents 3,037 3,037
Undergraduate Certificates 177 110
Undergraduate Special Students 30 28
Total Undergraduate Professional 9,190 8,789
Graduate Doctoral Stream
Doctoral 5,927 5,852
Masters 2,801 2,655
Graduate Special Students 38 31
Total Graduate Doctoral Stream 8,766 8,539
Graduate Professional and Diploma
Masters 6,369 5,534
Graduate Diplomas 80 32
Graduate Special Students 72 50
Total Graduate Professional & Diploma 6,521 5,615
Total 80,899 70,311
Note: Excludes 734 FTE students in the Toronto School of Theology.
University of Toronto Facts & Figures 2012 32
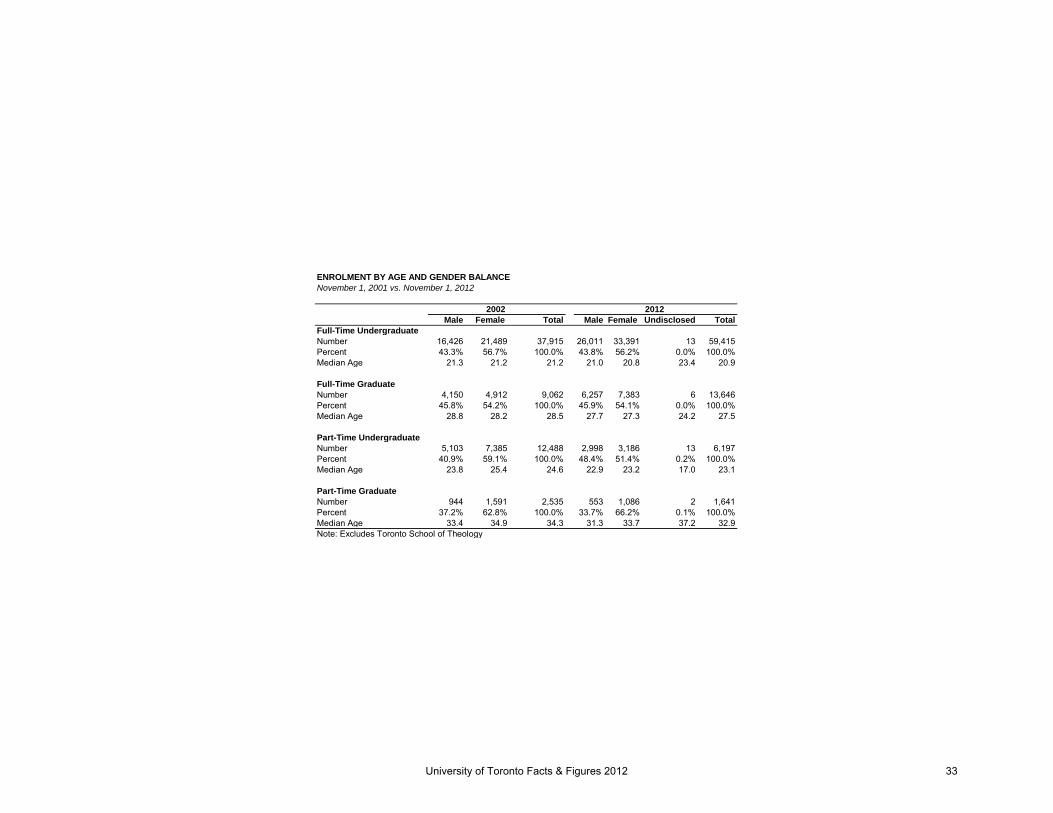
ENROLMENT BY AGE AND GENDER BALANCE
November 1, 2001 vs. November 1, 2012
Male Female Total Male Female Undisclosed Total
Full-Time Undergraduate
Number 16,426 21,489 37,915 26,011 33,391 13 59,415
Percent 43.3% 56.7% 100.0% 43.8% 56.2% 0.0% 100.0%
Median Age 21.3 21.2 21.2 21.0 20.8 23.4 20.9
Full-Time Graduate
Number 4,150 4,912 9,062 6,257 7,383 6 13,646
Percent 45.8% 54.2% 100.0% 45.9% 54.1% 0.0% 100.0%
Median Age 28.8 28.2 28.5 27.7 27.3 24.2 27.5
Part-Time Undergraduate
Number 5,103 7,385 12,488 2,998 3,186 13 6,197
Percent 40.9% 59.1% 100.0% 48.4% 51.4% 0.2% 100.0%
Median Age 23.8 25.4 24.6 22.9 23.2 17.0 23.1
Part-Time Graduate
Number 944 1,591 2,535 553 1,086 2 1,641
Percent 37.2% 62.8% 100.0% 33.7% 66.2% 0.1% 100.0%
Median Age 33.4 34.9 34.3 31.3 33.7 37.2 32.9
Note: Excludes Toronto School of Theology
20122002
University of Toronto Facts & Figures 2012 33

INTERNATIONAL STUDENT ENROLMENT BY GEOGRAPHIC ORIGIN
November 1, 2012
Country Count
% of
Undergraduate
China (People's Republic) 4,476 48.5%
South Korea 632 6.8%
India 343 3.7%
United States 302 3.3%
Hong Kong 279 3.0%
Malaysia 218 2.4%
Pakistan 196 2.1%
Saudi Arabia 166 1.8%
United Kingdom 156 1.7%
Japan 155 1.7%
Nigeria 136 1.5%
Brazil 114 1.2%
Taiwan 112 1.2%
Bangladesh 107 1.2%
Australia 84 0.9%
Note: In Fall 2012, the largest percentage of undergraduate international students were from China (48.5%) followed by South Korea (6.8%).
Top 15 Countries
Asia 6,868 74%
Americas 708 8%
Europe 716 8%
Middle East 545 6%
Africa & Oceania
395 4%
Undergraduate (Total: 4,318)
Asia 6,868 74%
Americas 708 8%
Europe 716 8%
Middle East 545 6%
Africa & Oceania
395 4%
Undergraduate (Total: 9,232)
University of Toronto Facts & Figures 2012 34

INTERNATIONAL STUDENT ENROLMENT BY GEOGRAPHIC ORIGIN (continued)
November 1, 2012
Country Count % of Graduate
China (People's Republic) 558 26.9%
United States 346 16.7%
India 204 9.8%
Iran 157 7.6%
Germany 66 3.2%
Mexico 40 1.9%
South Korea 38 1.8%
United Kingdom 33 1.6%
Egypt 32 1.5%
Turkey 32 1.5%
Israel 31 1.5%
Japan 28 1.3%
Saudi Arabia 27 1.3%
Colombia 26 1.3%
Taiwan 26 1.3%
Note: In Fall 2012, the largest percentage of graduate international students were from the China (26.9%) followed by
U.S.A. (16.7%).
Top 15 Countries
Asia 954 46%
Americas 474 23%
Europe 289 14%
Middle East 311 15%
Africa & Oceania
48 2%
Graduate (Total: 2,077)
University of Toronto Facts & Figures 2012 35

INTERNATIONAL STUDENT ENROLMENT: FIVE-YEAR TREND
November 1, 2008 to November 1, 2012
Notes:
1. In Fall 2008, the largest percentage of undergraduate international students were from China including Hong Kong
(34.3%) followed by the South Korea (11.7%).
2. In Fall 2012, the largest percentage of undergraduate international students were from China excluding Hong Kong
(48.5%) followed by South Korea (6.8%).
2008 2009 2010 2011 2012
Oceania & Africa 354 380 386 375 395
Middle East 428 446 466 532 545
Europe 533 576 573 635 716
Americas 683 704 637 642 708
Asia 4,235 4,726 5,361 6,109 6,868
6,832
8,293 9,232
6,233
7,423
0
2,000
4,000
6,000
8,000
10,000
12,000
Undergraduate Students
University of Toronto Facts & Figures 2012 36

INTERNATIONAL STUDENT ENROLMENT: FIVE-YEAR TREND (continued)
November 1, 2008 to November 1, 2012
AsiaAmericas
Europe
Totals
Notes:
1. In Fall 2008, the largest percentage of graduate international students were from USA (21.2%) followed by China
including Hong Kong (16.2%) .
2. In Fall 2012, the largest percentage of graduate international students were from the China (26.9%) excluding
Hong Kong followed by USA (16.7%).
2008 2009 2010 2011 2012
Oceania & Africa 56 48 51 50 48
Middle East 237 255 248 268 311
Europe 260 261 246 263 289
Americas 479 476 471 449 474
Asia 601 610 660 797 954
1,650 1,676 1,827
2,077
1,633
0
500
1,000
1,500
2,000
2,500
Graduate Students
University of Toronto Facts & Figures 2012 37

INTERNATIONAL STUDENT ENROLMENT: FIVE-YEAR TREND (continued)
November 1, 2008 to November 1, 2012
Note: Includes both degree seeking and non-degree seeking students.
2008 2009 2010 2011 2012
Oceania & Africa 410 428 437 425 443
Middle East 665 701 714 800 856
Europe 793 837 819 898 1,005
Americas 1,162 1,180 1,108 1,091 1,182
Asia 4,836 5,336 6,021 6,906 7,822
8,482 9,099
10,120
11,309
7,866
0
2,000
4,000
6,000
8,000
10,000
12,000
14,000
Total International Students
University of Toronto Facts & Figures 2012 38

TEN-YEAR ENROLMENT TRENDS, ALL STUDENTS
November 1, 2003 - November 1, 2012
Total % Female Total % Female Total % Female Total % Female
2003 55,369 57.9% 11,928 55.9% 3,535 49.9% 1,569 41.9%
2004 55,624 56.9% 12,068 55.4% 4,318 49.3% 1,628 41.6%
2005 58,182 56.5% 11,961 55.8% 4,982 49.1% 1,659 42.4%
2006 58,915 56.1% 12,287 56.5% 5,312 48.8% 1,753 43.4%
2007 59,508 55.5% 13,508 56.7% 5,655 49.3% 1,725 42.0%
2008 59,794 55.4% 13,891 57.2% 6,233 49.3% 1,633 42.1%
2009 61,632 55.4% 14,476 56.7% 6,832 49.8% 1,650 43.5%
2010 62,666 55.6% 14,622 56.3% 7,423 50.2% 1,676 44.6%
2011 64,120 55.7% 14,965 56.3% 8,293 50.2% 1,827 44.4%
2012 65,612 55.7% 15,287 55.4% 9,232 50.7% 2,077 49.6%
* Total students include domestic students and international students.
Notes:
1. Excludes students in the Toronto School of Theology.
2. Excludes students enrolled in OISE Additional Qualification courses.
Graduate
TOTAL STUDENTS* INTERNATIONAL STUDENTS
Undergraduate Graduate Undergraduate
University of Toronto Facts & Figures 2012 39

GENDER BALANCE OF UNDERGRADUATE AND GRADUATE ENROLMENT BY FIELD OF STUDY
November 1, 2012
STATISTICS CANADA
FIELD OF STUDY Total % Female Total % Female
Biological Sciences 4,354 60% 585 51%
Education & Physical Education 2,469 64% 2,231 77%
Engineering & Applied Sciences 5,648 25% 2,378 31%
Fine & Applied Arts 1,691 69% 403 59%
General Arts and Science 11,913 58% 0 --
Health Professions 7,132 55% 3,113 66%
Humanities and Related 7,910 63% 1,656 60%
Math & Physical Sciences 5,386 43% 988 29%
Social Sciences 19,109 61% 3,933 54%
Total 65,612 56% 15,287 55%
Notes:
1. 'Education & Physical Education' includes the Faculty of Kinesiology and Physical Education
and the Ontario Institute for Studies in Education (OISE).
2. Excludes students in Additional Qualification courses (OISE).
3. Excludes students in the Toronto School of Theology.
UNDERGRADUATE GRADUATE
University of Toronto Facts & Figures 2012 40

UNDERGRADUATE INTAKE BY FACULTY
November 1, 2012
TOTAL HEADCOUNT PERCENTAGE OF TOTAL HEADCOUNT
GTA Other Other Inter- GTA Other Other Inter-
Area Ontario Canada national Total Area Ontario Canada national Total
Applied Science 646 93 164 537 1,440 44.9% 6.5% 11.4% 37.3% 100%
Architecture, Landscape & Design 75 24 35 65 199 37.7% 12.1% 17.6% 32.7% 100%
Arts & Science
St George 3,402 690 521 1,656 6,269 54.3% 11.0% 8.3% 26.4% 100%
Mississauga 2,130 269 117 722 3,238 65.8% 8.3% 3.6% 22.3% 100%
Scarborough 2,318 180 116 585 3,199 72.5% 5.6% 3.6% 18.3% 100%
Total Arts & Science 7,850 1,139 754 2,963 12,706 61.8% 9.0% 5.9% 23.3% 100%
Dentistry 22 17 9 0 48 45.8% 35.4% 18.8% 0.0% 100%
Kinesiology & Physical Education 185 33 9 11 238 77.7% 13.9% 3.8% 4.6% 100%
Law 94 40 39 22 195 48.2% 20.5% 20.0% 11.3% 100%
Medicine 127 82 28 1 238 53.4% 34.5% 11.8% 0.4% 100%
Music 105 26 26 7 164 64.0% 15.9% 15.9% 4.3% 100%
Nursing 63 44 7 2 116 54.3% 37.9% 6.0% 1.7% 100%
OISE/UT 530 126 31 10 697 76.0% 18.1% 4.4% 1.4% 100%
Pharmacy 82 52 21 2 157 52.2% 33.1% 13.4% 1.3% 100%
Total Undergraduate 9,779 1,676 1,123 3,620 16,198 60.4% 10.3% 6.9% 22.3% 100%
Notes:
1. Excludes Transitional Year Program, Academic Bridging Program and Woodsworth diploma and certificate programs.
2. Intake data is not available for Post-Graduate Medical Education.
University of Toronto Facts & Figures 2012 41

GRADUATE INTAKE BY FACULTY
November 1, 2012
TOTAL HEADCOUNT PERCENTAGE OF TOTAL HEADCOUNT
GTA Other Other Inter- GTA Other Other Inter-
Area Ontario Canada national Total Area Ontario Canada national Total
Applied Science & Engineering 282 82 83 215 662 42.6% 12.4% 12.5% 32.5% 100%
Architecture, Landscape & Design 54 13 25 21 113 47.8% 11.5% 22.1% 18.6% 100%
Arts & Science 598 241 263 241 1,343 44.5% 17.9% 19.6% 17.9% 100%
18 7 7 36 68 26.5% 10.3% 10.3% 52.9% 100%
42 7 7 10 66 63.6% 10.6% 10.6% 15.2% 100%
Dentistry 4 4 3 3 14 28.6% 28.6% 21.4% 21.4% 100%
Forestry 16 8 2 9 35 45.7% 22.9% 5.7% 25.7% 100%
Information 125 64 26 17 232 53.9% 27.6% 11.2% 7.3% 100%
Kinesiology & Physical Education 15 2 2 2 21 71.4% 9.5% 9.5% 9.5% 100%
Law 37 8 16 35 96 38.5% 8.3% 16.7% 36.5% 100%
Management 311 47 51 170 579 53.7% 8.1% 8.8% 29.4% 100%
Medicine 538 171 108 65 882 61.0% 19.4% 12.2% 7.4% 100%
Music 46 22 29 20 117 39.3% 18.8% 24.8% 17.1% 100%
Nursing 80 37 21 2 140 57.1% 26.4% 15.0% 1.4% 100%
OISE/UT 424 88 52 63 627 67.6% 14.0% 8.3% 10.0% 100%
Pharmacy 15 5 3 0 23 65.2% 21.7% 13.0% 0.0% 100%
Social Work 143 71 24 2 240 59.6% 29.6% 10.0% 0.8% 100%
Total Graduate 2,748 877 722 911 5,258 52.3% 16.7% 13.7% 17.3% 100%
Note: Includes Graduate diplomas in Medicine and Music.
UTM Professional Graduate
UTSC Professional Masters
University of Toronto Facts & Figures 2012 42

TOTAL INTAKE
November 1, 2012
TOTAL HEADCOUNT PERCENTAGE OF TOTAL HEADCOUNT
GTA Other Other Inter- GTA Other Other Inter-
Area Ontario Canada national Total Area Ontario Canada national Total
Total Undergraduate 9,779 1,676 1,123 3,620 16,198 60.4% 10.3% 6.9% 22.3% 100%
Total Graduate 2,748 877 722 911 5,258 52.3% 16.7% 13.7% 17.3% 100%
Undergraduate & Graduate 12,527 2,553 1,845 4,531 21,456 58.4% 11.9% 8.6% 21.1% 100%
University of Toronto Facts & Figures 2012 43
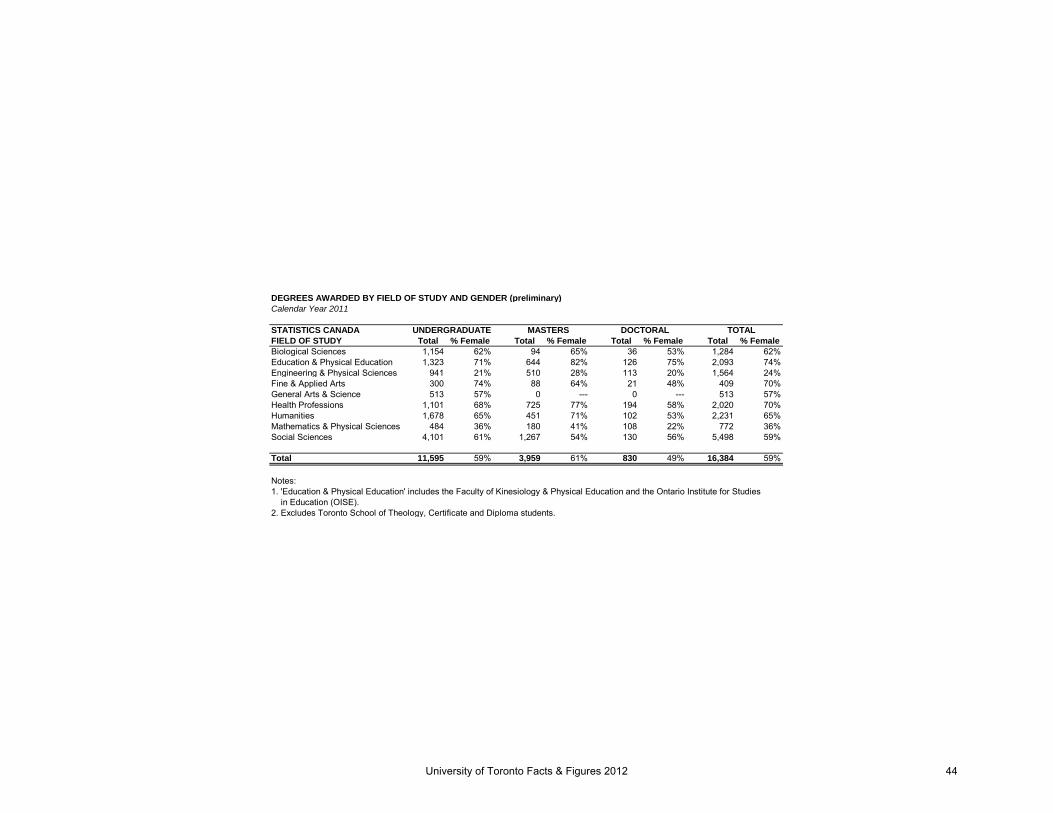
DEGREES AWARDED BY FIELD OF STUDY AND GENDER (preliminary)
Calendar Year 2011
STATISTICS CANADA
FIELD OF STUDY Total % Female Total % Female Total % Female Total % Female
Biological Sciences 1,154 62% 94 65% 36 53% 1,284 62%
Education & Physical Education 1,323 71% 644 82% 126 75% 2,093 74%
Engineering & Physical Sciences 941 21% 510 28% 113 20% 1,564 24%
Fine & Applied Arts 300 74% 88 64% 21 48% 409 70%
General Arts & Science 513 57% 0 --- 0 --- 513 57%
Health Professions 1,101 68% 725 77% 194 58% 2,020 70%
Humanities 1,678 65% 451 71% 102 53% 2,231 65%
Mathematics & Physical Sciences 484 36% 180 41% 108 22% 772 36%
Social Sciences 4,101 61% 1,267 54% 130 56% 5,498 59%
Total 11,595 59% 3,959 61% 830 49% 16,384 59%
Notes:
1. 'Education & Physical Education' includes the Faculty of Kinesiology & Physical Education and the Ontario Institute for Studies
in Education (OISE).
2. Excludes Toronto School of Theology, Certificate and Diploma students.
UNDERGRADUATE MASTERS DOCTORAL TOTAL
University of Toronto Facts & Figures 2012 44
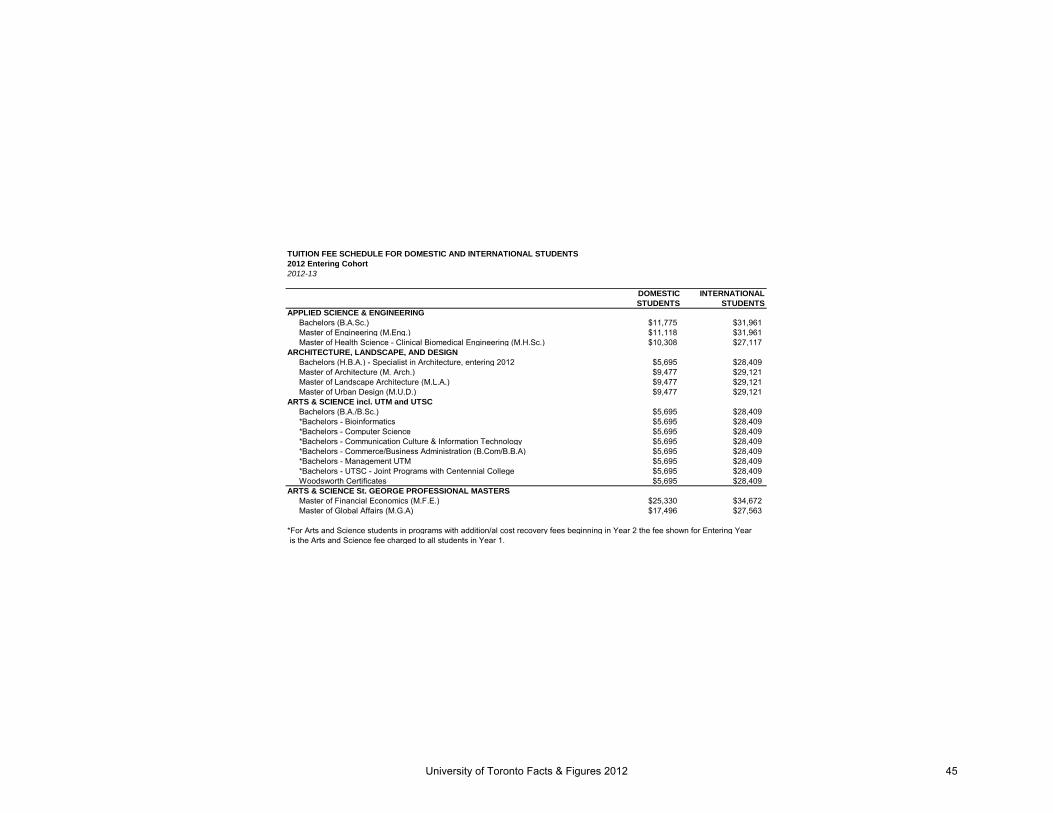
TUITION FEE SCHEDULE FOR DOMESTIC AND INTERNATIONAL STUDENTS
2012 Entering Cohort
2012-13
DOMESTIC INTERNATIONAL
STUDENTS STUDENTS
APPLIED SCIENCE & ENGINEERING
Bachelors (B.A.Sc.) $11,775 $31,961
Master of Engineering (M.Eng.) $11,118 $31,961
Master of Health Science - Clinical Biomedical Engineering (M.H.Sc.) $10,308 $27,117
ARCHITECTURE, LANDSCAPE, AND DESIGN
Bachelors (H.B.A.) - Specialist in Architecture, entering 2012 $5,695 $28,409
Master of Architecture (M. Arch.) $9,477 $29,121
Master of Landscape Architecture (M.L.A.) $9,477 $29,121
Master of Urban Design (M.U.D.) $9,477 $29,121
ARTS & SCIENCE incl. UTM and UTSC
Bachelors (B.A./B.Sc.) $5,695 $28,409
*Bachelors - Bioinformatics $5,695 $28,409
*Bachelors - Computer Science $5,695 $28,409
*Bachelors - Communication Culture & Information Technology $5,695 $28,409
*Bachelors - Commerce/Business Administration (B.Com/B.B.A) $5,695 $28,409
*Bachelors - Management UTM $5,695 $28,409
*Bachelors - UTSC - Joint Programs with Centennial College $5,695 $28,409
Woodsworth Certificates $5,695 $28,409
ARTS & SCIENCE St. GEORGE PROFESSIONAL MASTERS
Master of Financial Economics (M.F.E.) $25,330 $34,672
Master of Global Affairs (M.G.A) $17,496 $27,563
*For Arts and Science students in programs with addition/al cost recovery fees beginning in Year 2 the fee shown for Entering Year
is the Arts and Science fee charged to all students in Year 1.
University of Toronto Facts & Figures 2012 45

TUITION FEE SCHEDULE FOR DOMESTIC AND INTERNATIONAL STUDENTS (continued)
2012 Entering Cohort
2012-13
DOMESTIC INTERNATIONAL
STUDENTS STUDENTS
ARTS & SCIENCE St. GEORGE PROFESSIONAL MASTERS (continued)
Master of Industrial Relations & Human Resources (M.I.R.H.R.) $8,863 $25,328
Master of Industrial Relations & Human Resources (M.I.R.H.R.) 12 month Advanced
Standing Option $13,297 $37,992
Master of Public Policy (M.P.P.) $14,693 $28,715
Master of Science in Applied Computing (M.Sc.A.C.) $9,331 $19,845
Master of Science in Planning (M.Sc.Pl.) $8,462 $22,513
Master of Urban Design Studies (M.U.D.S.) $8,462 $22,513
Master of Visual Studies (M.V.S.) $7,160 $22,513
UTM PROFESSIONAL MASTERS
Diploma in Investigative and Forensic Accounting (D.I.F.A.) $13,330 $14,582
Master of Science in Biomedical Communications (M.Sc.BMC.) $9,926 $24,499
Master of Biotechnology (M.Biotech.) $14,729 $27,561
Master of Management of Innovation (M.M.I.) $26,923 $37,914
Master of Management & Professional Accounting (M.M.P.A.) $30,194 $36,764
UTSC PROFESSIONAL MASTERS
Masters in Environmental Science (M.Env.Sc.) $10,220 $28,409
DENTISTRY
Doctor of Dental Surgery (D.D.S.) $30,763 $58,710
Master of Science with Speciality Training - MOH Funded
Oral and Maxillofacial Surgery; Oral Medicine and Oral Pathology $2,261 n/a
Oral Pathology; Oral Medicine $2,868 n/a
Master of Science with Speciality Training - Non-MOH Funded
Dental Public Health $9,559 $20,413
Oral and Maxillofacial Surgery; Oral Pathology and Oral Medicine $25,004 $48,253
University of Toronto Facts & Figures 2012 46

TUITION FEE SCHEDULE FOR DOMESTIC AND INTERNATIONAL STUDENTS (continued)
2012 Entering Cohort
2012-13
DOMESTIC INTERNATIONAL
STUDENTS STUDENTS
DENTISTRY (continued)
Other $23,082 $44,768
PhD with Specialty Training
MOH Funded $4,601 n/a
Dental Public Health $8,456 $18,296
Other non-MOH funded $15,402 $30,828
FORESTRY
Master of Forest Conservation (M.F.C.) $8,228 $25,328
INFORMATION
Bachelors - Interactive Digital Media (with UTM) $5,695 $28,409
Master of Information (M.I.) $8,712 $25,328
Master of Museum Studies (M.M.St.) $8,863 $23,384
Diploma of Advanced Study in Information Studies $8,712 $25,328
KINESIOLOGY AND PHYSICAL EDUCATION
Bachelor of Physical Education & Health (B.P.E.H.) $5,695 $24,709
LAW
Global Professional Master of Law (G.P.L.L.M.) $27,864 $39,218
Juris Doctor (J.D.) $27,420 $35,980
Master of Laws (L.L.M.) $7,722 $25,328
Masters in Studies in Law (M.S.L.) $7,722 $16,886
Doctor of Juridical Science (S.J.D.) $7,160 $16,886
MANAGEMENT
Master of Business Administration, 2 Year Program (M.B.A.) $41,258 $48,293
Master of Business Administration, 3 Year Program ( M.B.A.) $28,055 $32,839
Master of Finance (M.F.) $38,909 $46,190
University of Toronto Facts & Figures 2012 47

TUITION FEE SCHEDULE FOR DOMESTIC AND INTERNATIONAL STUDENTS (continued)
2012 Entering Cohort
2012-13
DOMESTIC INTERNATIONAL
STUDENTS STUDENTS
MEDICINE
Doctor of Medicine (M.D.) $19,546 $56,284
Bachelor of Health Sciences - Physician Assistant Education (B.Sc.P.A.) $10,674 n/a
Bachelor - Radiation Sciences (B.Sc.Med.Rad.Sc.) $6,437 $23,720
Health Science Graduate Diplomas $8,863 $20,413
M.Sc. Occupational Therapy and Physical Therapy (M.Sc.O.T.) (M.Sc.P.T.) $8,863 $22,513
Master of Health Science (M.H.Sc.) - excluding Biomedical Engineering $8,863 $22,513
Master of Health Informatics (M.H.I.) $8,863 $22,513
Master of Science in Community Health (M.Sc.CH.) $8,863 $22,513
Combined MD/PhD $13,353 $36,585
MUSIC
Undergraduate (Mus.Bac.) $5,695 $24,709
Operatic Performance Diploma (Dip.Op.Perf.) $8,055 $24,709
Advanced Certificate in Performance (Adv.Cert.Perf.) $8,055 $24,709
Master of Music in Performance (Mus.M. (Performance)) $8,604 $22,513
Master of Music in Composition (Mus.M. (Composition)) $8,604 $22,513
Doctor of Musical Arts (Performance) & (Composition) D.M.A. $8,328 $16,886
NURSING
Bachelor of Science in Nursing (B.Sc.N) $7,642 $28,409
Concurrent Diploma in Anaesthesia/MN $14,551 $22,240
Diploma in Anaesthesia $14,551 $22,240
Master of Nursing (M.N.) $10,123 $28,409
Post-Masters Nurse Practioner Diploma Program (part-time) $7,133 $10,849
University of Toronto Facts & Figures 2012 48

TUITION FEE SCHEDULE FOR DOMESTIC AND INTERNATIONAL STUDENTS (continued)
2012 Entering Cohort
2012-13
DOMESTIC INTERNATIONAL
STUDENTS STUDENTS
OISE/UT
Bachelor of Education (B.Ed.); Technical & Vocational Diplomas or Certificates $6,317 $28,409
Concurrent Teacher Education Program (CTEP) $5,943 $28,409
Master of Teaching in Elementary and Secondary Education (M.T.) $8,863 $22,513
M.A. in Child Study $8,863 $22,513
Master of Education (M.Ed.) $8,863 $22,513
Doctor of Education (Ed.D.) $8,375 $22,513
PHARMACY
Bachelor of Science in Pharmacy (B.Sc. Pharm.) $14,994 $28,143
Doctor of Pharmacy (Pharm.D.) $36,514 $36,514
Combined Bachelor/Pharm.D. $36,514 $36,514
S.G.S. (annual fee)
Doctoral Stream $7,160 $16,886
SOCIAL WORK
Master of Social Work (M.S.W.) $8,072 $22,513
Diploma in Social Service Administration (D.S.S.A.) $7,160 $16,886
TRANSITIONAL YEAR PROGRAM
Regular $4,840 n/a
Extended $2,419 n/a
University of Toronto Facts & Figures 2012 49

TUITION FEE SCHEDULE FOR SELF-FUNDED PROGRAMS
2012-13
2012
ENTERING
COHORT
Summer Program in Medieval Latin
Domestic $1,000
International $1,000
Masters of Mathematical Finance $40,000
International Dentist Advanced Placement Program $37,926
Executive Masters of Business Administration $93,000$89,000
(CDN)
OISE/UT- Laboratory School - Half Day Program $10,549
OISE/UT- Laboratory School - Full Day Program $16,448
OISE/UT- Laboratory School - Bloorview MacMillan $14,924
Executive Masters of Business Administration (OMNIUM
GEMBA)
University of Toronto Facts & Figures 2012 50

Part EGraduates
Graduates by Region 52
Number of Degree Affiliations by College or Faculty 53
Total Annual Gifts Received 54
Percentage of Pledge Dollars by Donor Sector 55
University of Toronto Facts & Figures 2012 51

GRADUATES BY REGION
As of Fall 2012
NUMBER PERCENTAGE
OF LIVING OF LIVING
Canada
Ontario
Metro Toronto 228,509 44.9%
Central Ontario 143,132 28.1%
South-western Ontario 24,294 4.8%
Eastern Ontario 22,697 4.5%
Northern Ontario 7,980 1.6%
Subtotal Ontario 426,612 83.9%
Rest of Canada
British Columbia 12,963 2.5%
Alberta 7,381 1.5%
Quebec 5,832 1.1%
Nova Scotia 2,696 0.5%
Manitoba 2,144 0.4%
Saskatchewan 1,601 0.3%
Newfoundland 1,174 0.2%
New Brunswick 1,129 0.2%
Prince Edward Island 330 0.1%
Northwest Territories 180
Yukon Territory 122
Nunavut 36
Unknown within Canada 750 0.1%
Canada Total 462,950 91.0%
United States 23,511 4.6%
International 22,033 4.3%
International Total 45,544 9.0%
Grand Total 508,494 100.0%
Notes:
2. Regional Breakdown is based on data as of November 14,
1. The number of individuals (both living and deceased) who
have graduated from the University of Toronto is 595,061
as of Fall 2012.
0.1%
2012
University of Toronto Facts & Figures 2012 52

NUMBER OF DEGREE AFFILIATIONS
BY COLLEGE OR FACULTY
As of Fall 2012
NUMBER OF
DEGREE
AFFILIATIONS
Arts & Science Programs
Constituent Colleges:
Innis College 9,330
New College 22,377
University College 50,946
Woodsworth College 22,835
Federated Colleges:
St. Michael's College 34,553
Trinity College 20,298
Victoria College 43,303
University of Toronto Mississauga 41,767
University of Toronto Scarborough 40,401
Other Faculties
Applied Science & Engineering 53,469
Architecture, Landscape & Design 4,018
Dentistry 11,475
Forestry 2,940
123,482
Information 7,077
Kinesiology & Physical Education 5,619
Joseph L. Rotman School of Management 12,853
Law 9,344
Medicine, Doctor of 15,932
Other Medicine 19,197
Music 5,806
Nursing 11,781
OISE/UT:
Undergraduate 54,443
Graduate 25,960
Institute of Child Study 2,471
Pharmacy 12,018
Physical & Occupational Therapy 7,585
Social Work 8,805
Woodsworth Certificate & Diploma 7,331
Notes:
2. Graduates with multiple degrees are counted in more than one
constituency.
3. A single degree may be affiliated with more than one constituency.
Graduate Studies/
Graduate Institutes & Centres
1. Honorary degrees are excluded.
4. Excludes Toronto School of Theology.
University of Toronto Facts & Figures 2012 53

TOTAL ANNUAL GIFTS RECEIVED
2007-08 to 2011-12
$0
$20,000,000
$40,000,000
$60,000,000
$80,000,000
$100,000,000
$120,000,000
$140,000,000
$160,000,000
$180,000,000
$200,000,000
$220,000,000
$240,000,000
2007-08 2008-09 2009-10 2010-11 2011-12
Gifts-in-kind
Realized Planned Gifts
Pledges & One-time-only Gifts
University of Toronto Facts & Figures 2012 54

PERCENTAGE OF PLEDGE DOLLARS BY DONOR SECTOR
2011-12
Total Value = $80,627,656
Alumni 45%
Friends 22%
Organizations & Foundations
11%
Corporations 22%
Total Value: $128,243,910
University of Toronto Facts & Figures 2012 55

University of Toronto Facts & Figures 2012 56

Part FStudent
Awards
Undergraduate Student Support : Admission
Scholarships, In-Course Scholarships and Bursaries
by Faculty and College 58
OSAP and University of Toronto Advanced Planning
for Students Program (UTAPS) by Faculty and
College 60
Graduate Student Support by Source 64
Graduate Student Support by School of Graduate
Studies Division 64
University of Toronto Facts & Figures 2012 57

UNDERGRADUATE STUDENT SUPPORT: ADMISSION SCHOLARSHIPS, IN-COURSE SCHOLARSHIPS AND BURSARIES
BY FACULTY AND COLLEGE
2011-12
First Entry Undergraduate
FACULTY / COLLEGE Number Value ($) Number Value ($) Number Value ($)
Applied Science and Engineering 698 $2,062,441 291 $699,841 1,952 $8,976,616
Arts and Science, St. George
Innis College 71 $200,814 190 $302,465 290 $690,825
New College 135 $330,966 272 $330,727 763 $1,833,519
St. Michael's College 94 $217,098 261 $443,979 571 $1,253,731
Trinity College 265 $699,992 568 $737,235 348 $953,076
University College 350 $634,002 820 $696,327 747 $2,034,983
Victoria College 211 $691,053 677 $875,447 797 $1,811,092
Woodsworth College 80 $237,711 147 $205,056 1,751 $3,341,758
Music 35 $107,225 105 $229,345 211 $524,839
Kinesiology and Physical Education 11 $24,877 44 $79,593 94 $209,933
Transitional Year Program - $0 30 $6,367 168 $264,092
U of T Mississauga 304 $520,000 183 $203,602 1,145 $4,154,646
U of T Scarborough 351 $699,214 443 $350,752 1,539 $4,526,871
Total 2,605 $6,425,392 4,031 $5,160,736 10,376 $30,575,982
ADMISSION IN-COURSE
SCHOLARSHIPS SCHOLARSHIPS BURSARIES
University of Toronto Facts & Figures 2012 58

UNDERGRADUATE STUDENT SUPPORT: ADMISSION SCHOLARSHIPS, IN-COURSE SCHOLARSHIPS AND BURSARIES
BY FACULTY AND COLLEGE
(continued)
Second Entry Undergraduate
FACULTY / COLLEGE Number Value ($) Number Value ($) Number Value ($)
Dentistry 3 $3,696 70 $54,010 281 $826,636
Law 9 $33,850 100 $126,834 486 $2,810,614
Medicine 3 $11,342 280 $232,684 1,183 $4,854,576
Radiation Sciences - $0 1 $300 120 $207,230
Physician Assistant - $0 - $0 6 $26,500
Nursing 3 $6,644 33 $63,395 240 $605,523
OISE/UT Undergraduate 12 $34,660 31 $41,642 457 $1,214,699
Pharmacy 18 $14,487 73 $45,858 1,214 $2,192,186
Total 48 $104,678 588 $564,722 3,987 $12,737,963
Undergraduate Total 2,653 $6,530,070 4,619 $5,725,459 14,363 $43,313,945
Note:
1. Dependant Scholarship is not included in these numbers.
2. By Fiscal Year (journal date between May 1, 2011 to April 30, 2012)
ADMISSION IN-COURSE
SCHOLARSHIPS SCHOLARSHIPS BURSARIES
University of Toronto Facts & Figures 2012 59

OSAP AND UNVERSITY OF TORONTO ADVANCED PLANNING FOR STUDENTS PROGRAM (UTAPS) BY FACULTY
AND COLLEGE
2011-2012
First Entry Undergraduate
Faculty/College Number Value ($) Number Value ($)
Applied Science and Engineering 1,728 3,518 49% 1,728 $13,450,672 1,412 $7,281,886
Arts & Science St. George 8,615 20,270 43% 8,615 $72,890,382 1,410 $4,409,672
Innis College 654 1,438 45% 654 $5,518,716 116 $389,800
New College 1,576 3,410 46% 1,576 $13,393,730 226 $684,900
St. Michael's College 1,427 3,872 37% 1,427 $11,589,729 180 $493,400
Trinity College 517 1,520 34% 517 $4,230,099 93 $322,722
University College 1,534 3,489 44% 1,534 $12,843,383 271 $909,750
Victoria College 1,097 2,854 38% 1,097 $8,795,496 144 $461,100
Woodsworth College 1,810 3,687 49% 1,810 $16,519,229 380 $1,148,000
Music 190 508 37% 190 $1,644,947 34 $64,650
Kinesiology & Physical Education 291 727 40% 291 $2,288,287 16 $19,800
Transitional Year Program 63 71 89% 63 $845,696 24 $55,150
U of T Mississauga 4,308 9,471 45% 4,308 $33,736,468 772 $3,258,750
U of T Scarborough 4,768 8,400 57% 4,768 $34,883,624 718 $3,176,632
Total 19,963 42,965 46% 19,963 $159,740,076 4,386 $18,266,539
OSAP Recipients as a Percentage
of Full-Time Enrolment
OSAP UTAPS
University of Toronto Facts & Figures 2012 60

OSAP AND UNVERSITY OF TORONTO ADVANCED PLANNING FOR STUDENTS PROGRAM (UTAPS) BY FACULTY
AND COLLEGE
2011-2012 (continued)
Second Entry Undergraduate
Faculty/College Number Value ($) Number Value ($)
Dentistry 214 316 68% 214 $3,116,548 213 $758,319
Law 287 590 49% 287 $2,964,730 - $0
Medicine 652 952 68% 652 $9,541,614 - $0
Radiation Sciences 214 336 64% 214 $2,738,068 66 $108,400
Physician Assistant 13 28 46% 13 $250,068 6 $26,500
Nursing 193 325 59% 193 $2,820,412 98 $177,800
OISE/UT Undergraduate 388 1,076 36% 388 $4,542,659 158 $534,350
Pharmacy 671 949 71% 671 $6,555,658 614 $1,487,834
Woodsworth - Cert. 35 48 73% 35 $300,098 5 $9,200
Total 2,667 4,620 58% 2,667 $32,829,855 1,160 $3,102,403
Undergraduate Total 22,630 47,585 48% 22,630 $192,569,931 5,546 $21,368,942
OSAP Recipients as a Percentage
of Full-Time Enrolment
OSAP UTAPS
University of Toronto Facts & Figures 2012 61

OSAP AND UNVERSITY OF TORONTO ADVANCED PLANNING FOR STUDENTS PROGRAM (UTAPS) BY FACULTY
AND COLLEGE
2011-2012 (continued)
Graduate
Faculty Number Value ($) Number Value ($)
Applied Science & Engineering 151 1,079 14% 151 $1,475,887 113 $604,015
Architecture, Landscape, & Design 175 293 60% 175 $1,703,947 167 $871,900
Arts & Science 245 2,596 9% 245 $2,395,648 202 $1,132,491
Dentistry 7 93 8% 7 $102,615 6 $16,358
Forestry 25 75 33% 25 $331,806 22 $56,300
Information 180 416 43% 180 $1,773,446 177 $843,750
Kinesiology & Physical Education 11 43 26% 11 $98,613 8 $20,800
Law 11 81 14% 11 $215,561 10 $13,977
Management 87 702 12% 87 $826,947 1 $3,100
Medicine 357 2,245 16% 357 $4,441,411 347 $1,044,072
Music 20 172 12% 20 $211,092 20 $82,700
Nursing 7 252 3% 7 $50,563 5 $25,800
OISE/UT 296 1,153 26% 296 $3,083,648 261 $1,260,900
Pharmacy 3 94 3% 3 $8,708 2 $3,200
OSAP Recipients as a Percentage
of Full-Time Enrolment
OSAP UTAPS
University of Toronto Facts & Figures 2012 62

OSAP AND UNVERSITY OF TORONTO ADVANCED PLANNING FOR STUDENTS PROGRAM (UTAPS) BY FACULTY
AND COLLEGE
2011-2012 (continued)
Graduate
Faculty Number Value ($) Number Value ($)
Social Work 163 380 43% 163 $1,668,746 162 $679,100
UTM Graduate Programs 29 72 40% 29 $386,574 25 $70,833
UTSc Graduate Programs 16 54 30% 16 $287,411 16 $55,500
Graduate Total 1,783 9,800 18% 1,783 $19,062,623 1,544 $6,784,796
Grant Total 24,413 57,385 43% 24,413 $211,632,554 7,090 $28,153,739
Notes:
1. By Fiscal Year (journal date between May 1, 2011 to April 30, 2012)2. UTAPS for School of Graduate Studies is included in the Graduate totals.
3. UTAPS at Law, Management and Medicine is distributed as part of their grants programs and are not included above.
4. UTAPS data in this table refers to grants awards to OSAP recipients only.
5. OSAP amounts include Federal/Ontario loans/grants.
OSAP Recipients as a Percentage
of Full-Time Enrolment
OSAP UTAPS
University of Toronto Facts & Figures 2012 63

GRADUATE STUDENT SUPPORT BY SOURCE
2011-12
(millions of dollars)
GRADUATE STUDENT SUPPORT
BY SCHOOL OF GRADUATE STUDIES DIVISION
2011-12
(millions of dollars)
*Includes affiliated hospitals.
Research Stipends
$58.7 25%
Employment Income $47.8 21%
UofT Fellowships
$38.5 17%
External Awards $37.4 16%
Merit Awards $29.7 13%
Bursaries $18.8 8%
Total $230.9*
Division I - Humanities
$33.5 14%
Division II - Social Sciences
$57.9 25%
Division III - Physical Sciences
$64.3 28%
Division IV - Life Sciences
$75.3 33%
Total $230.9*
University of Toronto Facts & Figures 2012 64
Part GFaculty and
Administrative
Staff
Distribution of Full-Time Appointed Tenured/Tenure
Stream Faculty by Major Division and Main
Appointment 66
Distribution of Full-Time Tenured/Tenure Stream
Faculty by Rank and Gender 67 Age Distribution of Tenured/Tenure Stream Faculty 67
Distribution of Full and Part-Time (>=25%)
Academic Staff and Librarians by Rank and Gender 68
All Active Faculty with Teaching/Research
Responsibilities 69
Distribution of Full and Part-Time Administrative and
Union Staff 70
Gross Operating Fund Full-Time Equivalent Staff 72
University of Toronto Facts & Figures 2012 65
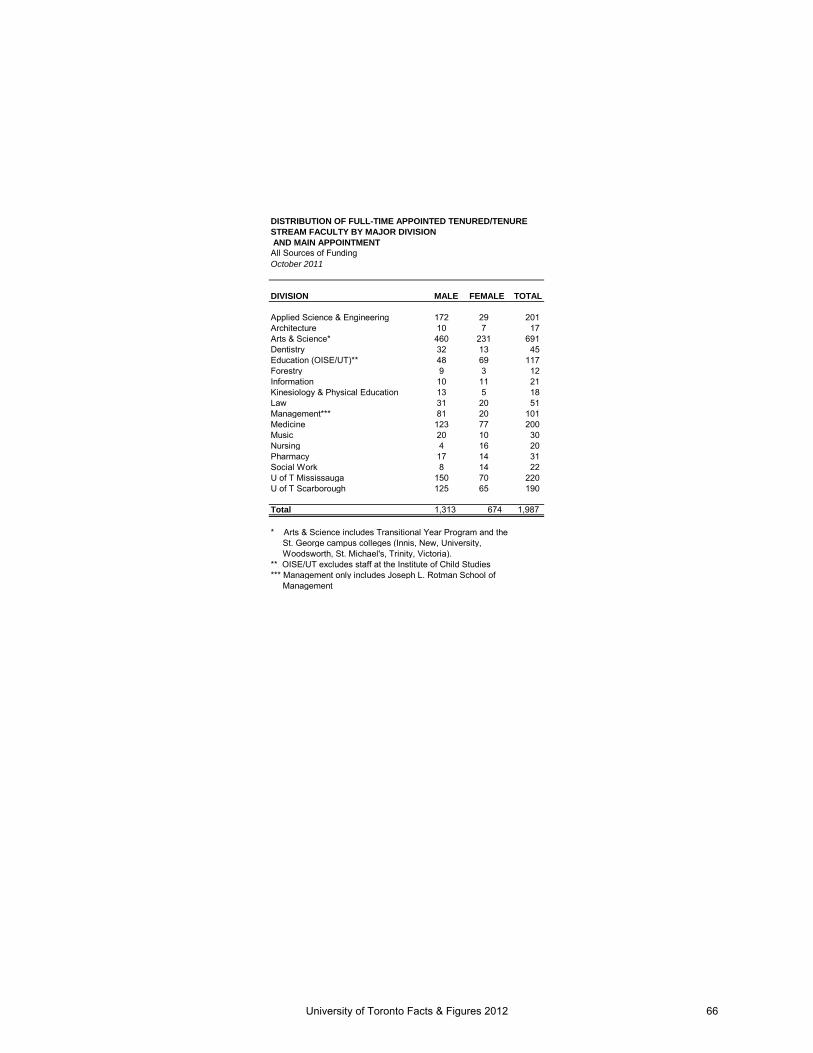
DISTRIBUTION OF FULL-TIME APPOINTED TENURED/TENURE
STREAM FACULTY BY MAJOR DIVISION
AND MAIN APPOINTMENT
All Sources of Funding
October 2011
DIVISION MALE FEMALE TOTAL
Applied Science & Engineering 172 29 201
Architecture 10 7 17
Arts & Science* 460 231 691
Dentistry 32 13 45
Education (OISE/UT)** 48 69 117
Forestry 9 3 12
Information 10 11 21
Kinesiology & Physical Education 13 5 18
Law 31 20 51
Management*** 81 20 101
Medicine 123 77 200
Music 20 10 30
Nursing 4 16 20
Pharmacy 17 14 31
Social Work 8 14 22
U of T Mississauga 150 70 220
U of T Scarborough 125 65 190
Total 1,313 674 1,987
* Arts & Science includes Transitional Year Program and the
St. George campus colleges (Innis, New, University,
Woodsworth, St. Michael's, Trinity, Victoria).
** OISE/UT excludes staff at the Institute of Child Studies
*** Management only includes Joseph L. Rotman School of
Management
University of Toronto Facts & Figures 2012 66

DISTRIBUTION OF FULL-TIME TENURED/TENURE STREAM
FACULTY BY RANK AND GENDER
All Sources of Funding
October 2011
RANK MALE FEMALE TOTAL
Professor 659 215 874
Associate Professor 433 280 713
Assistant Professor 213 175 388
Assistant Professor (conditional) 8 4 12
Total 1,313 674 1,987
Note: Includes Faculties of Medicine and Dentistry.
AGE DISTRIBUTION OF FULL-TIME TENURED/TENURE
STREAM FACULTY
October 2011
AVERAGE
RANK AGE
Professor 56.3
Associate Professor 47.2
Assistant Professor 37.3
Assistant Professor (conditional) 31.3
Note: Total number of Full-time Tenured/Tenure Stream
Faculty = 1,987.
University of Toronto Facts & Figures 2012 67

DISTRIBUTION OF FULL AND PART-TIME (>=25%) ACADEMIC
STAFF AND LIBRARIANS BY RANK AND GENDER
All Sources of Funding
October 2011
RANK
Male Female Total
Professor 780 245 1,025
Associate Professor 504 327 831
Assistant Professor 262 230 492
Assistant Professor (cond.) 11 5 16
Lecturer (Health Sciences)
Senior Instructure/Instructor
(PhysEd) 6 4 10
Senior Lecturer/Lecturer 151 152 303
Senior Tutor 7 4 11
Sub-Total 1,721 967 2,688
Librarian 41 106 147
Total 1,762 1,073 2,835
RANK
Male Female Total
Professor 61 21 82
Associate Professor 33 20 53
Assistant Professor 26 39 65
Assistant Professor (cond.)
Lecturer (Health Sciences) 1 1 2
Instructor (PhysEd) 1 1
Senior Lecturer/Lecturer 53 88 141
Senior Tutor 1 1
Sub-Total 175 170 345
Librarian 2 4 6
Total 177 174 351
FULL-TIME
PART-TIME
University of Toronto Facts & Figures 2012 68

DISTRIBUTION OF FULL AND PART-TIME (>=25%) ACADEMIC
STAFF AND LIBRARIANS BY RANK AND GENDER (continued)
All Sources of Funding
October 2011
RANK
Male Female Total
Professor 841 266 1,107
Associate Professor 537 347 884
Assistant Professor 288 269 557
Assistant Professor (cond.) 11 5 16
Lecturer (Health Sciences) 1 1 2
Instructor (PhysEd) 7 4 11
Senior Lecturer/Lecturer 204 240 444
Senior Tutor/Tutor 7 5 12
Sub-Total 1,896 1,137 3,033
Librarian 43 110 153
Total 1,939 1,247 3,186
Notes:
1. Includes Faculty of Medicine and Dentistry
2. Includes both tenured/tenure stream, non-tenure stream professorial
ranks, teaching stream and other academics
3. Does not include those currently identified as members of CUPE
4. The Senior Tutor/Tutor group is being phased out.
ALL ACTIVE FACULTY WITH TEACHING/RESEARCH
RESPONSIBILITIES
Fall 2011
FULL
TIME
PART
TIME TOTAL
Professorial 2,138 166 2,304
Teaching Stream 327 156 483
Term-limited, Sessional and Stipendiary 0 1,081 1,081
Clinical 2,487 2,545 5,032
Other 601 2,080 2,681
Total 5,553 6,028 11,581
Notes:
1. Includes faculty with active appointments only who are contributing to the
teaching and/or research mission of the University regardless of pay source.
2. Excludes Research Fellows
3. Excludes Teaching Assistants
4. "Professorial" includes tenure/tenure-stream and other appointed professors
(Assistant, Associate, Full).
5. "Teaching Stream" includes lecturers, Instructors and other teaching faculty with
continuing appointments.
6. "Term-limited, Sessional and Stipendiary" includes casual instructors teaching
a course(s).
7. "Clinical" includes faculty contributing to the education of Medical students
located at the University and other clinical settings e.g., hospitals.
8. "Other" includes Research Associates, other faculty with graduate
appointments, and status only appointments.
ALL
3902 Unit 3.
University of Toronto Facts & Figures 2012 69

DISTRIBUTION OF FULL AND PART-TIME ADMINISTRATIVE
AND UNION STAFF
September 2011
EMPLOYEE GROUP Male Female Total
Non-Unionized Employees
Research Associates 200 98 298
USW-exempt Admin staff* 347 569 916
Total non-unionized employees 547 667 1,214
Unionized Employees
89 Chestnut St. Hospitality Workers 48 30 78
Administrative staff* 1,092 2,313 3,405
Child Care Workers 1 31 32
Library Workers 50 80 130
Operating Engineers and Building
Management Systems Technicians 87 2 89
Police 31 16 47
Research Associates & Officers 1 3 4
Service Workers 344 259 603
Sessional Lecturers 0 0 0
Teaching Assistants and OISE Graduate
Assistants 0 0 0
Trades and Services** 77 2 79
Total unionized employees 1,731 2,736 4,467
Total 2,278 3,403 5,681
EMPLOYEE GROUP Male Female Total
Non-Unionized Employees
Research Associates 13 25 38
USW-exempt Admin staff* 4 20 24
Total non-unionized employees 17 45 62
Unionized Employees
89 Chestnut St. Hospitality Workers 0 0 0
Administrative staff* 52 167 219
Child Care Workers 0 6 6
Library Workers 5 10 15
Operating Engineers and Building
Management Systems Technicians 0 0 0
Police 0 0 0
Research Associates & Officers 1 2 3
Service Workers 21 10 31
Sessional Lecturers 417 422 839
Teaching Assistants and OISE Graduate
Assistants 2,444 2,084 4,528
Trades and Services** 0 0 0
Total unionized employees 2,940 2,701 5,641
Total 2,957 2,746 5,703
FULL-TIME
PART-TIME
University of Toronto Facts & Figures 2012 70

DISTRIBUTION OF FULL AND PART-TIME ADMINISTRATIVE
AND UNION STAFF (continued)
September 2011
EMPLOYEE GROUP Male Female Total
Non-Unionized Employees
Research Associates 213 123 336
USW-exempt Admin staff* 351 589 940
Total non-unionized employees 564 712 1,276
Unionized Employees
89 Chestnut St. Hospitality Workers 48 30 78
Administrative staff* 1,144 2,480 3,624
Child Care Workers 1 37 38
Library Workers 55 90 145
Operating Engineers and Building
Management Systems Technicians 87 2 89
Police 31 16 47
Research Associates & Officers 2 5 7
Service Workers 365 269 634
Sessional Lecturers 417 422 839
Teaching Assistants and OISE Graduate
Assistants 2,444 2,084 4,528
Trades and Services** 77 2 79
Total unionized employees 4,671 5,437 10,108
Total 5,235 6,149 11,384
* Excludes Non University of Toronto Departments.
** Trades and Services includes Machinists, Carpenters, Electrical Workers, Sheet Metal
Workers, Plumbers, Pipefitters, and Painters.
ALL
University of Toronto Facts & Figures 2012 71

GROSS OPERATING FUND FULL-TIME EQUIVALENT STAFF
2012-13 Budget
DIVISION ACADEMIC
NON-
ACADEMIC*
St. George
Applied Science and Engineering 241.88 236.70
Architecture, Landscape, and Design 30.07 19.67
Arts & Science** 901.42 551.37
Colleges*** 23.24 99.85
Dentistry 71.87 172.51
Forestry 12.59 6.10
Information 24.91 30.87
Law 50.56 61.39
Management 136.67 193.30
Medicine 618.78 590.75
Music 50.15 29.83
Nursing 45.50 26.25
OISE/UT 158.96 143.05
Pharmacy 48.10 42.00
Kinesiology & Physical Education 26.72 13.60
Continuing Studies, School of 0.00 92.18
Graduate Studies, School of 5.60 46.00
Social Work 24.41 15.55
Transitional Year Program 6.25 2.50
Total St. George Academic 2,477.68 2,373.47
Libraries and Information Commons 0.00 404.98
Administration 13.00 929.97
Campus and Student Services**** 11.93 260.73
Facilities and Services 0.00 621.03
Total St. George 2,502.61 4,590.18
Mississauga, University of Toronto
UTM Academic 289.79 106.59
UTM Library 0.00 41.05
Administration 1.00 122.78
Campus and Student Services 0.00 53.09
Facilities and Services 0.00 99.17
Total UTM 290.79 422.68
Scarborough, University of Toronto
UTSC Academic 288.77 124.35
UTSC Library 5.50 34.24
Administration 1.00 106.50
Campus and Student Services 0.00 63.67
Facilities and Services 0.00 113.00
Total UTSC 295.27 441.76
Grand Total 3,088.67 5,454.62
* Librarians, Admin and Union staff are included in the non-academic
group.
** Arts & Science includes College Programs related to Arts & Science.
*** Colleges include Innis, New, University, Woodsworth programs and
resources independent of Arts & Science
**** Includes Kinesiology & Physical Ed Co-Curricular
Note: These are budgeted FTEs which include TBA's and include
Recovered and Self-funded FTEs.
University of Toronto Facts & Figures 2012 72

Part HLibrary
Library Collections 74
Number of Loans 75
University of Toronto Facts & Figures 2012 73

LIBRARY COLLECTIONS
2011-2012
There are 44 libraries in the University of Toronto Library System.
CENTRAL LOCAL SCARBOROUGH/ FEDERATED/ DIGITAL
COLLECTIONS LIBRARIES LIBRARIES* MISSISSAUGA AFFILIATED LIBRARY** TOTAL
Books 8,437,511 1,159,710 699,848 1,381,974 1,356,584 13,035,627
Cartographic Materials 262,510 0 39,117 92 301,719
CD-ROM (Bibliog. & Text) 10,576 2,062 310 820 13,768
Computer Data Files 970,280 958 0 3 971,241
Films & Videos 36,371 3,334 1,771 7,190 48,666
Graphic Materials 322,768 365,828 63,374 71,751 823,721
Microforms 5,284,827 129,620 39,214 132,157 5,585,818
Sheet Music 64,984 2,279 126 67,389
Sound Recording 11,868 206,282 4,509 5,766 2,238 228,425
Other Formats 39,048 31,197 530 673 71,448
Total 15,375,759 1,963,975 850,952 1,600,552 21,147,822
Current Serials 16,575 4,156 1,815 3,033 213,385 238,964
Manuscripts (Metres) 29,023 92 0 193 29,307
* Materials on transfer from Central to Local Libraries are shown in the counts for Local Libraries where they are located.
Bound volumes of subscriptions are included in the Book counts.
** Electronic resources (Books & Journals).
University of Toronto Facts & Figures 2012 74

NUMBER OF LOANS
2011-2012
Central Libraries
Robarts Library 970,246
Gerstein Science Information Centre 146,778
OISE/UT Library 112,446
Fisher Library/Archives 17,029
Media Commons 70,808
Branch Libraries 284,529
Sub-Total 1,601,836
Local Libraries* 350,874
UT Mississauga Library 214,597
UT Scarborough Library 77,805
Federated/Affiliated Libraries 363,104
Total 2,608,216
* Local Libraries include some Hospital Consortium Libraries.
University of Toronto Facts & Figures 2012 75

University of Toronto Facts & Figures 2012 76

Part IPhysical
Plant
Usage of Assignable Space 78
Number of Buildings and Square Metres 79
Area of U of T Properties 80
Number of Parking Spaces 80
Number of Public Assembly Facilities 80
Number of University of Toronto Students in
Residence 81
University of Toronto Facts & Figures 2012 77

USAGE OF ASSIGNABLE SPACE
2011-12
ST. GEORGE MISSISSAUGA SCARBOROUGH
CAMPUS CAMPUS CAMPUS
Teaching & Research 54% 38% 43%
Residence 13% 33% 22%
Libraries 11% 6% 5%
Student Services 6% 12% 12%
Administration 4% 4% 7%
Miscellaneous 12% 7% 11%
Notes:
1. Student Services includes: Athletics, Food Services, Bookstore and Merchandising and Health Services.
2. Miscellaneous includes: Plant Maintenance, Assembly & Exhibition Facilities, Common Use and Student Activity
and Other University Facilities.
3. Teaching and Research includes: Classrooms, Teaching and Research Laboratories, Academic Services,
Health Science Clinic Facilities, Central Services and Media Services.
Teaching & Research, 51%
Residences, 16%
Libraries, 10%
Miscellaneous, 11%
Student Services, 8% Administration, 4%
University of Toronto (all Campuses)
University of Toronto Facts & Figures 2012 78

NUMBER OF BUILDINGS AND SQUARE METRES
2011-2012 as of September 2012
NUMBER OF NET ASSIGNABLE NET SQUARE GROSS
BUILDINGS SQUARE METRES METRES SQUARE METRES
University
St. George 121 633,023 1,025,134 1,194,166
Leased St. George 7 5,738 7,860 9,470
Scarborough 34 71,623 112,755 129,817
Mississauga 48 97,410 163,368 185,484
Total University 210 807,794 1,309,117 1,518,937
Federated Colleges and Massey 49 96,971 148,494 185,573
Grand Total 259 904,765 1,457,611 1,704,510
Notes:
1. Net Assignable Square Metres is the sum of all areas on all floors of the building assigned to, or available for assignment to,
an occupant, including every type of space functionality used by an occupant.
2. Net Square Metres is the sum of all areas on all floors of the building, both assigned (see definition above) and
non-assigned (i.e. corridors, stairs, mechanical rooms etc.)
3. Gross Area Square Metres is the sum of all floors areas included within the outside faces of exterior walls, which have
floor surfaces.
University of Toronto Facts & Figures 2012 79

AREA OF U OF T PROPERTIES
2011-12
HECTARES
CAMPUSES
Downtown Campus
St. George 53.6
Federated Colleges and Massey 17.9
Total Downtown Campus 71.5
Scarborough 122.5
Mississauga 89.4
Total Campuses 283.4
OFF CAMPUS
Aerospace 11.9
Joker's Hill 346.0
Total Off Campus 357.9
Grand Total 641.3
Notes:
1. Excludes Huron/Sussex houses.
2. Total Downtown Campus includes St. George, Federated Colleges
and Massey.
NUMBER OF PARKING SPACES
2011-12
NUMBER
OF SPACES
St. George 1,832
Scarborough 2,772
Mississauga 2,361
Total 6,965
NUMBER OF PUBLIC ASSEMBLY FACILITIES
2011-12
NUMBER OF SEATING
FACILITIES CAPACITY
St. George Lecture Theatres / Hall* 47 11,107
St. George Auditorium 4 3,401
Dining Rooms and Cafeterias* 31 3,982
Varsity Arena 1 4,000
* Including Federated Colleges
University of Toronto Facts & Figures 2012 80

NUMBER OF UNIVERSITY OF TORONTO STUDENTS IN RESIDENCE
2012-13
NUMBER OF NUMBER
FIRST-YEAR OF TOTAL
STUDENTS STUDENTS SPACES
University of Toronto Residences
St. George Campus
U of T Operated
Innis College 246 328 329
New College* 662 877 884
University College 501 728 748
Woodsworth College 281 361 370
Ancillary Operated
89 Chestnut 742 1,084 1,091
Graduate House 0 436 436
Family Housing** 6 721 721
Federated Colleges
St. Michael's College (Incl. Loretto
College Residence) 396 649 649
Trinity College 262 446 448
Victoria University 464 799 802
St. George Total 3,560 6,429 6,478
Mississauga Campus
Undergraduate Housing 749 1,188 1,329
Family & Graduate Housing (incl. med.) 30 229 229
Mississauga Total 779 1,417 1,558
Scarborough Campus
Scarborough Total 529 769 769
4,868 8,615 8,805
Independent Residences
Knox College*** 6 102 103
Massey College 0 60 60
Wycliffe College 1 81 82
Total Independent Residences 7 243 245
Grand Total 4,875 8,858 9,050
* New College added approx. 80 beds in 45 Willcocks in 2012
** Family Housing has 712 apartments for 712 families at 30 & 35 Charles St. W.. Increase is
due to 9 units open at Huron-Sussex. The number of actual residents (students, spouses,
and children) fluctuates from one month the next, but generally runs from 2,000 to 2,400.
*** Instead of using the super singles for 1 person in 2008-09, Knox College decided to make
them double rooms due to the demand on residence.
Notes:
1. 'Number of Students' is the number of students registered in a U of T Faculty as of Nov 1,
including UofT - TST students, students serving as dons/resident assistants.
2. 'Number of First Year Students' includes direct-entry undergraduate students only.
3. 'Total Spaces' includes the 'Number of Students' plus post-doctoral students, students not
registered on Nov. 1, non-students, students of other institutions, and vacancies.
and vacancies.
Total University of Toronto Residences
University of Toronto Facts & Figures 2012 81

University of Toronto Facts & Figures 2012 82

Part JComputing and
Communications
Number of UTORmail Accounts at Year End 84
Number of Messages Delivered by UTORmail Post
Office 84
Number of Web Transactions 84
Institutional Internet Services
- Virtual Private Network (VPN) 85
Campus Wireless Network 85
Usage of Electronic Student Services 86
University of Toronto Facts & Figures 2012 83
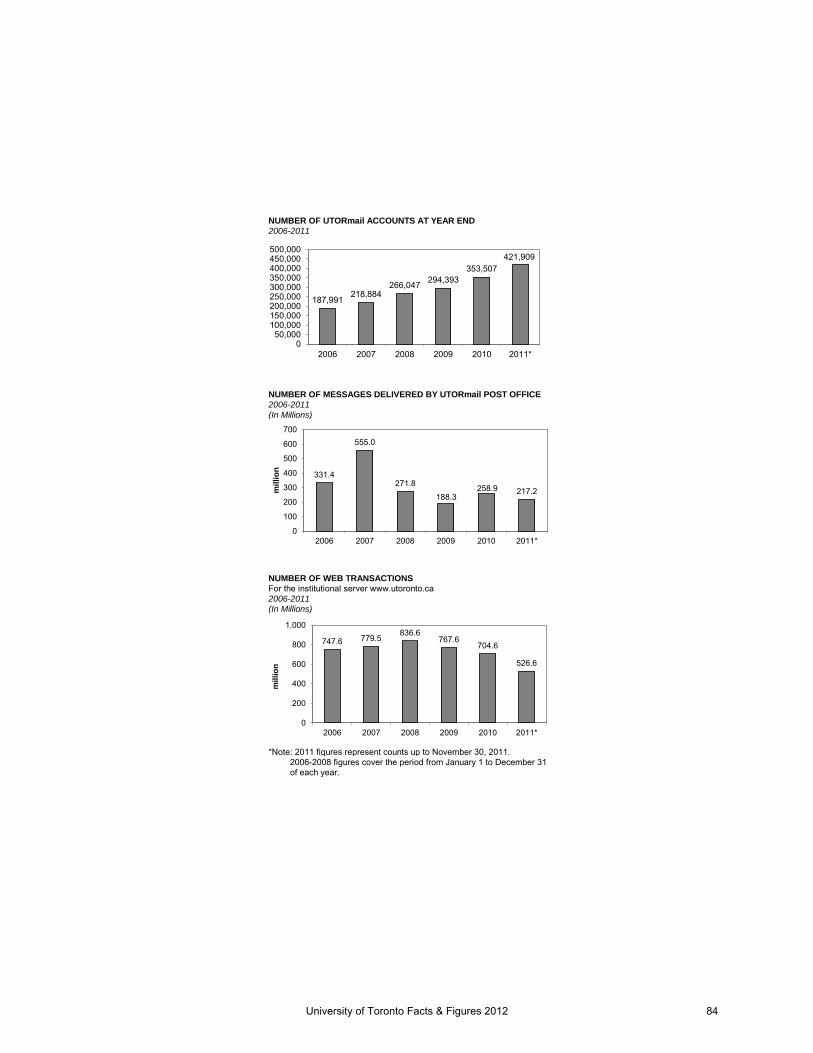
NUMBER OF UTORmail ACCOUNTS AT YEAR END
2006-2011
NUMBER OF MESSAGES DELIVERED BY UTORmail POST OFFICE
2006-2011
(In Millions)
NUMBER OF WEB TRANSACTIONS
For the institutional server www.utoronto.ca
2006-2011
(In Millions)
*Note: 2011 figures represent counts up to November 30, 2011.
2006-2008 figures cover the period from January 1 to December 31
of each year.
187,991 218,884
266,047 294,393
353,507
421,909
050,000
100,000150,000200,000250,000300,000350,000400,000450,000500,000
2006 2007 2008 2009 2010 2011*
331.4
555.0
271.8
188.3 258.9 217.2
0
100
200
300
400
500
600
700
2006 2007 2008 2009 2010 2011*
millio
n
747.6 779.5 836.6
767.6 704.6
526.6
0
200
400
600
800
1,000
2006 2007 2008 2009 2010 2011*
millio
n
University of Toronto Facts & Figures 2012 84

INSTITUTIONAL INTERNET SERVICES
2004-2011
Provides 'direct' access to the UofT network.
Date Number of Users
December 2004 0
December 2005 610
December 2006 1,153
December 2007 1,823
September 2008 2,357
December 2009 3,474
December 2010 4,345
December 2011 5,313
*The VPN Service first became available in January 2005.
CAMPUS WIRELESS NETWORK
2004-2011
Buildings Access Sessions
Date Points per Week
October 2004 24 244 14,000
October 2005 41 320 25,000
October 2006 66 495 42,000
October 2007 96 677 75,000
October 2008 105 768 95,000
October 2009 121 903 127,000
October 2010 125 999 167,000
October 2011* 111 1,021 250,000
* Excludes U of T Mississauga and U of T Scarborough
Virtual Private Network (VPN)*
University of Toronto Facts & Figures 2012 85

USAGE OF ELECTRONIC STUDENT SERVICES
September 1, 2011 to August 31, 2012
ROSI STUDENT
WEB SERVICES
ACTIVITY rosi.utoronto.ca
Accessing the System
Successful attempt to login 9,609,522
Unsuccessful attempt to login 180,492
Access suspended 6,941
Change PIN 52,136
Unsuccessful attempt to change PIN 1,335
Setup completed for PIN reactivation 27,368
Successful attempt to reactivate PIN 27,239
Unsuccessful attempt to reactivate PIN 8,733
Suspend PIN reactivation 5,061
Maintaining Personal Information
Add bank information 6,200
Cancel bank information 277
Add new address 9,207Change address 45,898
Add new contact information 3,167
Change contact information 1,647
Delete contact information 243
Add new telephone number 2,881
Change telephone number 6,074
Change e-mail address 24,798
Choosing/Changing Academic Options
Add Academic Activity 753,824
Drop academic activity 414,454
Modify academic activity 288,623
Add waitlisted academic activity 222,141
Drop waitlisted academic activity 75,594
Modify waitlisted academic activity 8,970
List courses 5,890,868
Accept Subject POSt 12,421
Add new Subject POSt 62,228
Change Subject POSt 10,148
Delete Subject POSt 38,985
Cancel invited registration 751
Cancel registration/Deregister 5,358
Confirm graduation request 9,924
Declaration of Absence 5,583
Viewing Financial Information
Successful tuition deferral 25,876
Failed tuition deferral 40,118
View Financial Account - Invoice 1,103,107
View Financial Account - Detail 362,048
Requesting/Paying for Transcripts
Request transcript, charged to account 12,825
Request transcript, paid electronically 39,248
Request transcript pending payment 43,003
Create electronic transcript invoice 41,054
Pay electronic transcript invoice 36,435
Unsuccessful electronic payment 2,318
Participating in Campus Life
Submit an electronic vote 5,045
University of Toronto Facts & Figures 2012 86


Prepared by the Office of the Assistant Vice-President,
Government, Institutional and Community Relations
University of Toronto
Printed in Canada
by SLG Group Commercial Printing
March 2013