facts and figures 2011 the european chemical industry in …offline) 2011/ff2011_full... · the...
TRANSCRIPT

Facts and Figures 2011The European chemical industry in a worldwide perspective

2Facts and Figures 2011
Table of contentsFacts and Figures 2011
1. Chemicals Industry Profile . . . . . . . . . . . . . . . . . . . . . . . . . . . . . . . . . . 3
World chemicals sales: geographic breakdown . . . . . . . . . . . . . . . . . 3
World chemicals sales by region . . . . . . . . . . . . . . . . . . . . . . . . . . . . . 4
Chemicals sales by country: top 30 . . . . . . . . . . . . . . . . . . . . . . . . . . . 5
EU chemicals industry sales by geographic breakdown . . . . . . . . . . 6
World exports and imports of chemicals by regional shares . . . . . . 7
EU chemicals industry sales by sectoral breakdown . . . . . . . . . . . . . 8
EU chemicals industry sales: structure by destination . . . . . . . . . . . 9
EU chemicals industry sales structure . . . . . . . . . . . . . . . . . . . . . . . . 10
Contribution of the chemicals industry to the EU economy . . . . . . 11
Added value in the EU manufacturing sector (2007) . . . . . . . . . . . 12
2. International Trade . . . . . . . . . . . . . . . . . . . . . . . . . . . . . . . . . . . . . . . . 13
Extra-EU chemicals trade balance . . . . . . . . . . . . . . . . . . . . . . . . . . . 13
Extra-EU chemicals trade by region (exports & imports) . . . . . . . . 14
Extra-EU chemicals trade flows with major geographic blocs in € billion (2010) . . . . . . . . . . . . . . . . . . . . . . . . . . . . . . . . . . . 15
EU chemicals trade surplus: sectoral breakdown . . . . . . . . . . . . . . 16
EU chemicals trade competitive analysis broken down by region . 17
Extra-EU chemicals trade flows detailed analysis by sector . . . . . . 18
Extra-EU chemicals trade flows detailed analysis by country . . . . . 19
3. Growth and Competitiveness . . . . . . . . . . . . . . . . . . . . . . . . . . . . . . . 20
Production, trade and consumption growth . . . . . . . . . . . . . . . . . . 20
Chemicals growth performance against total manufacturing . . . . 21
EU chemicals production growth by sector . . . . . . . . . . . . . . . . . . . 22
International comparison of production growth . . . . . . . . . . . . . . . 23
International comparison of production growth (continued) . . . . 24
EU manufacturing industry: gross operating surplus rate (2007) . 25
4. Employment . . . . . . . . . . . . . . . . . . . . . . . . . . . . . . . . . . . . . . . . . . . . . 26
EU manufacturing industry: breakdown of employment (2007) . . 26
Employment in the chemicals industry: European Union versus United States . . . . . . . . . . . . . . . . . . . . . . . . . . . . . . . . . . . . . . 27
EU manufacturing industry: breakdown of labour cost per employee . . . . . . . . . . . . . . . . . . . . . . . . . . . . . . . . . . . . . . . . . . . . . 28
EU labour cost per employee: chemicals versus manufacturing . . 29
Labour cost per employee in the EU chemicals industry . . . . . . . . 30
Labour productivity in EU chemicals and other manufacturing sectors . . . . . . . . . . . . . . . . . . . . . . . . . . . . . . . . . . . . . 31
EU labour productivity: chemicals versus total manufacturing . . . 32
Labour productivity in the EU chemicals industry . . . . . . . . . . . . . . 33
5. Energy . . . . . . . . . . . . . . . . . . . . . . . . . . . . . . . . . . . . . . . . . . . . . . . . . . 34
Fuel and power consumption in the EU chemicals industry . . . . . 34
Gas and oil consumption in the EU chemicals industry during the past 20 years . . . . . . . . . . . . . . . . . . . . . . . . . . . . . . . . . . . 35
Energy intensity in the EU chemicals industry . . . . . . . . . . . . . . . . . 36
Energy intensity: European Union versus United States . . . . . . . . . 37
6. Investment and R&D . . . . . . . . . . . . . . . . . . . . . . . . . . . . . . . . . . . . . . 38
Investment in the EU manufacturing sector (2007) . . . . . . . . . . . . 38
Capital spending in the Western European chemicals industry . . . 39
International comparison of chemicals sector capital spending . . 40
International comparison of chemicals industry capital spending intensity . . . . . . . . . . . . . . . . . . . . . . . . . . . . . . . . . . . . . . . . 41
International comparison of R&D spending . . . . . . . . . . . . . . . . . . 42
International comparison of R&D spending intensity . . . . . . . . . . . 43
7. Sustainable Development . . . . . . . . . . . . . . . . . . . . . . . . . . . . . . . . . . 44
Total greenhouse gas emissions in the EU chemicals industry . . . 44
Greenhouse gas emissions, energy consumption and production in the EU chemicals industry . . . . . . . . . . . . . . . . . 45
Greenhouse gas emissions per unit of energy consumption and per unit of production in the EU chemicals industry . . . . . . . . 46
Greenhouse gas emissions per production: European Union versus United States . . . . . . . . . . . . . . . . . . . . . . . . . . . . . . . . 47
Safety at work – EU chemicals sector incidence rate of accidents (more than three days lost) . . . . . . . . . . . . . . . . . . . . . . 48
Incidence rate of accidents at work (more than three days lost) . . 49
Safety at work – incidence rate of accidents at work in the EU manufacturing sector (2005) . . . . . . . . . . . . . . . . . . . . . . . 50
ContactsDr . Moncef HadhriChief Economistmha@cefic .be +32 2 676 72 82
James Pieper Media Relations Manager jpi@cefic .be +32 2 676 73 98

3Facts and Figures 2011
Unless specified, chemicals industry excludes pharmaceuticalsUnless specified, EU refers to EU-27
World chemicals sales: geographic breakdown
Asian chemicals production equals that of Europe plus America
• Worldchemicalsturnoverwasvaluedat€2353 billion in 2010 . Data for 2010 confirms that solid recovery of the chemicals industry occurred during the year . Sales in value terms were up in 2010 by 26 .9 per cent compared with 2009, a year when the economic and financial crisis was in full swing . Emerging economies contributed largely to the worldwide recovery of the sector in 2010 .
• The European chemicals industry, includingthe European Union and the Rest of Europe, is still in a strong position, posting sales of €578 billion in 2010, one-fourth of world chemicals sales in value terms . Worldwide competition is getting fiercer, however, witnessed by the European Union losing its top ranking in terms of sales to China for the second consecutive year . Chemicals sales in Asia are more than double that of the European Union . Taken together, Europe, Asia and North American Free Trade Area account for 92 .7 per cent of world chemicals turnover .
1. Chemicals Industry Profile
World chemicals sales: geographic breakdown
World chemicals sales by region
Chemicals sales by country: top 30
EU chemicals industry sales by geographic breakdown
World exports and imports of chemicals by regional shares
EU chemicals industry sales by sectoral breakdown
EU chemicals industry sales: structure by destination
EU chemicals industry sales structure
Contribution of the chemicals industry to the EU economy
Added value in the EU manufacturing sector (2007)
2. International Trade
3. Growth and Competitiveness
4. Employment
5. Energy
6. Investment and R&D
7. Sustainable Development
Chemicals Industry Profile
Source: Cefic Chemdata International * Rest of Europe = Switzerland, Norway and other Central & Eastern Europe
Chem
ical
s sa
les
(€ b
illio
n)
China JapanRest of Asia IndiaEU-27 Rest of Europe*
0
200
400
600
800
1000
1200
Rest of the WorldLatin AmericaNAFTAEuropeAsia
56
363
153
575 87
491455
12845
* Rest of Europe: Switzerland, Norway and other Central & Eastern Europe (excl. the new EU 12 countries)Source: Cefic Chemdata International
World chemicals sales in 2010 are valued at € 2353 billion. The EU accounts for 21% of the total.

4Facts and Figures 2011
Unless specified, chemicals industry excludes pharmaceuticalsUnless specified, EU refers to EU-27
World chemicals sales by regionChemicals Industry Profile
1. Chemicals Industry Profile
World chemicals sales: geographic breakdown
World chemicals sales by region
Chemicals sales by country: top 30
EU chemicals industry sales by geographic breakdown
World exports and imports of chemicals by regional shares
EU chemicals industry sales by sectoral breakdown
EU chemicals industry sales: structure by destination
EU chemicals industry sales structure
Contribution of the chemicals industry to the EU economy
Added value in the EU manufacturing sector (2007)
2. International Trade
3. Growth and Competitiveness
4. Employment
5. Energy
6. Investment and R&D
7. Sustainable Development
Emerging economies outpace industrial countries in chemicals production
• Developments during the previous 10 yearsfrom 2000 to 2010 indicate that the European Union was the clear leader in terms of world chemicals sales, but the region has gradually lost ground to China and Asia (excluding Japan) .
• The European Union contribution to worldchemicals sales declined in 2010 by 8 .3 percentage points compared with 2000 . In fact, the total value of sales in the European Union has been growing continuously, but overall world chemicals sales are growing at an even faster clip . The level of world chemicals sales in value terms increased by 63 .7 per cent in 2010 compared with 2000 .
Source: Cefic Chemdata International *Asia excluding China and Japan
Perc
enta
ge s
hare
World Sales
0
5
10
15
20
25
30
35
Rest of the world
Rest of Europe
Latin America
ChinaRest of Asia*
JapanNAFTAEU-27
* Asia excluding China and JapanSource: Cefic Chemdata International
2000: €1437 billion 2010: €2353 billion
29.228.1
20.919.3
12.0
6.5
14.6
17.8
6.4
24.4
4.7 5.4
2.73.7
2.3 2.0
World Sales

5Facts and Figures 2011
Unless specified, chemicals industry excludes pharmaceuticalsUnless specified, EU refers to EU-27
Chemicals sales by country: top 30Chemicals Industry Profile
1. Chemicals Industry Profile
World chemicals sales: geographic breakdown
World chemicals sales by region
Chemicals sales by country: top 30
EU chemicals industry sales by geographic breakdown
World exports and imports of chemicals by regional shares
EU chemicals industry sales by sectoral breakdown
EU chemicals industry sales: structure by destination
EU chemicals industry sales structure
Contribution of the chemicals industry to the EU economy
Added value in the EU manufacturing sector (2007)
2. International Trade
3. Growth and Competitiveness
4. Employment
5. Energy
6. Investment and R&D
7. Sustainable Development
China – the biggest chemicals producer in 2010
• In 2010, the 30 largest chemical-producingcountries had a combined turnover of €2103 billion .
• Twelveofthetop30majorcountriesareAsian,generating chemicals sales of €1026 billion . This figure represents nearly 49 per cent of the top 30 and 43 .6 per cent of the share of world chemicals sales .
• Eleven of the top 30 major countries areEuropean, generating chemicals sales of €506 billion . This figure represents 24 per cent of the top 30 and 21 .6 per cent of the share of world chemicals sales .
Source: Cefic Chemdata International
Chem
ical
s sa
les
2010
(€ b
illio
n)
0
50
100
150
200
250
300
350
400
450
500
550
600
650
TaiwanItalyIndiaKorea Republic
BrazilFranceGermanyJapanUSChina
Source: Cefic Chemdata International
575.3
152.7
395.2
76.1 75.6
141.6
74.855.9 50.2 49.4

6Facts and Figures 2011
Unless specified, chemicals industry excludes pharmaceuticalsUnless specified, EU refers to EU-27
EU chemicals industry sales by geographic breakdownChemicals Industry Profile
1. Chemicals Industry Profile
World chemicals sales: geographic breakdown
World chemicals sales by region
Chemicals sales by country: top 30
EU chemicals industry sales by geographic breakdown
World exports and imports of chemicals by regional shares
EU chemicals industry sales by sectoral breakdown
EU chemicals industry sales: structure by destination
EU chemicals industry sales structure
Contribution of the chemicals industry to the EU economy
Added value in the EU manufacturing sector (2007)
2. International Trade
3. Growth and Competitiveness
4. Employment
5. Energy
6. Investment and R&D
7. Sustainable Development
Eight countries account for 90 per cent of EU chemicals production
• Germany remains the largest chemicalsproducer in Europe, followed by France, Italy and the Netherlands . Together, these four countries generated in 2010 64 per cent of EU chemicals sales, valued at €315 billion . The share rises to 88 .9 per cent, or €437 billion, when including the United Kingdom, Spain, Belgium and Poland .
• The other 19 EU countries in 2010 generated11 .1 per cent of EU chemicals sales, valued at €54 billion, half of which was attributable to four EU countries – Sweden, Austria, Czech Republic and Finland .
Sources: Eurostat and Cefic Chemdata International
Sales 2010: €491 billion
DE28.8%
FR15.5%
IT10.2%
UK9.1%NL
9.5%
ES 6.8%
BE6.3% PL
2.7%
Others11.1%
HU0.8%
SE1.8%AT
1.5%
FI1.1%
CZ1.2%
DK 0.9%
PT0.8%
Others3.0%
Source: Eurostat and Cefic Chemdata International
Percentage shares
Sales 2010: e491 billion
7Facts and Figures 2011
Unless specified, chemicals industry excludes pharmaceuticalsUnless specified, EU refers to EU-27
World exports and imports of chemicals by regional sharesChemicals Industry Profile
1. Chemicals Industry Profile
World chemicals sales: geographic breakdown
World chemicals sales by region
Chemicals sales by country: top 30
EU chemicals industry sales by geographic breakdown
World exports and imports of chemicals by regional shares
EU chemicals industry sales by sectoral breakdown
EU chemicals industry sales: structure by destination
EU chemicals industry sales structure
Contribution of the chemicals industry to the EU economy
Added value in the EU manufacturing sector (2007)
2. International Trade
3. Growth and Competitiveness
4. Employment
5. Energy
6. Investment and R&D
7. Sustainable Development
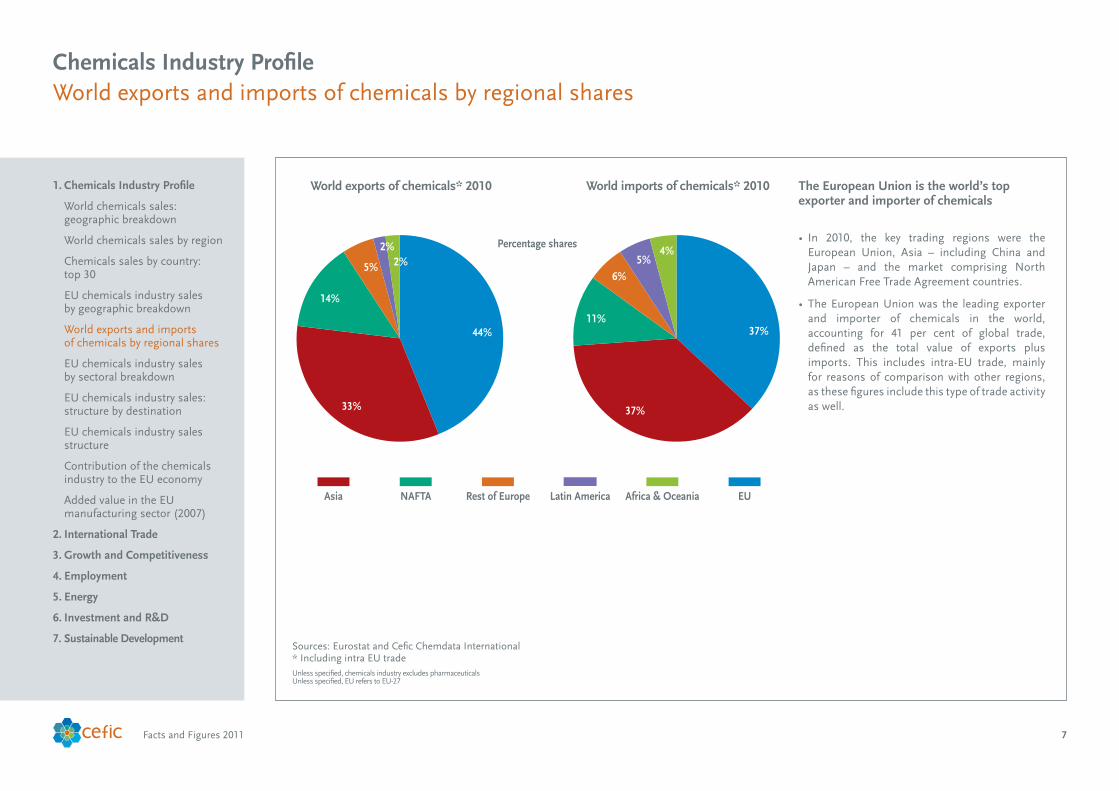
The European Union is the world’s top exporter and importer of chemicals
• In 2010, the key trading regions were theEuropean Union, Asia – including China and Japan – and the market comprising North American Free Trade Agreement countries .
• TheEuropeanUnionwas the leadingexporterand importer of chemicals in the world, accounting for 41 per cent of global trade, defined as the total value of exports plus imports . This includes intra-EU trade, mainly for reasons of comparison with other regions, as these figures include this type of trade activity as well .
Sources: Eurostat and Cefic Chemdata International* Including intra EU trade
World exports of chemicals* 2010
Percentage shares
World imports of chemicals* 2010
5%
2%2%
44%
33%
14%
6%5%
4%
37%
37%
11%
Rest of Europe EUAfrica & OceaniaAsia NAFTA Latin America
Source: Eurostat and Cefic Chemdata International * Including intra EU trade
World exports of chemicals* 2010 World imports of chemicals* 2010

8Facts and Figures 2011
Unless specified, chemicals industry excludes pharmaceuticalsUnless specified, EU refers to EU-27
EU chemicals industry sales by sectoral breakdownChemicals Industry Profile
1. Chemicals Industry Profile
World chemicals sales: geographic breakdown
World chemicals sales by region
Chemicals sales by country: top 30
EU chemicals industry sales by geographic breakdown
World exports and imports of chemicals by regional shares
EU chemicals industry sales by sectoral breakdown
EU chemicals industry sales: structure by destination
EU chemicals industry sales structure
Contribution of the chemicals industry to the EU economy
Added value in the EU manufacturing sector (2007)
2. International Trade
3. Growth and Competitiveness
4. Employment
5. Energy
6. Investment and R&D
7. Sustainable Development
Petrochemicals and polymers account for about half of EU chemicals sales
• Output from the EU chemicals industry coversthree wide ranges of products: base chemicals, speciality chemicals and consumer chemicals .
• Base chemicals cover petrochemicals andderivatives and basic inorganics . They are produced in large volumes, and are sold within the chemicals industry itself or to other industries . In 2009, they represented 59 .7 per cent of total EU chemicals sales, increasing in 2010 to 61 .6 per cent .
• Specialty chemicals cover the auxiliaries forindustry, paints & inks, crop protection, and dyes & pigments . Specialty chemicals are produced in small volumes but nevertheless represented 25 .6 per cent of total EU chemicals sales in 2010 .
• Consumerchemicalsaresoldtofinalconsumers,such as soaps and detergents as well as perfumes and cosmetics . Together, they represented 12 .8 per cent of total EU chemicals sales in 2010 .
• Comparing2009to2010onthecontributionofeachsector to EU chemicals sales, data show that the polymers and petrochemicals sectors increased their contributions in 2010 compared with 2009 . This is due to polymers and petrochemicals being seriously affected by the economic crisis in 2009 and experiencing a strong recovery in 2010 . Consumer chemicals and specialty chemicals were less affected by the crisis, however, and registered a less pronounced recovery .
Source: Cefic Chemdata International
Source: Cefic Chemdata International
2009: €420 billion 2010: €491 billion
Petrochemicals23.5%
Consumer chemicals
13.5%
Basic inorganics
13.7%
Specialties26.8%
Polymers22.5%
Petrochemicals24.0%
Consumer chemicals
12.8%
Basic inorganics
13.6%
Specialties25.6%
Polymers24.0%
2009: E420 billion 2010: E491 billion

9Facts and Figures 2011
Unless specified, chemicals industry excludes pharmaceuticalsUnless specified, EU refers to EU-27
EU chemicals industry sales: structure by destinationChemicals Industry Profile
1. Chemicals Industry Profile
World chemicals sales: geographic breakdown
World chemicals sales by region
Chemicals sales by country: top 30
EU chemicals industry sales by geographic breakdown
World exports and imports of chemicals by regional shares
EU chemicals industry sales by sectoral breakdown
EU chemicals industry sales: structure by destination
EU chemicals industry sales structure
Contribution of the chemicals industry to the EU economy
Added value in the EU manufacturing sector (2007)
2. International Trade
3. Growth and Competitiveness
4. Employment
5. Energy
6. Investment and R&D
7. Sustainable Development
Intra-EU trade increased significantly due to success of EU internal market
• EUchemicalssaleswerevaluedat€491 billion in 2010 . Sales to EU partner countries have more than doubled during the period from 1995 to 2010 (261 .6 versus 97 .5) .
• TheEuropeaninternalmarketduringthat15-yearperiod had a profoundly positive effect on the chemicals industry . Removing both trade and non-trade barriers inside the EU area has been a key driver for growth and competitiveness of the chemicals industry in the European Union .
• Theinternalmarket,todaynumberingmorethan500 million consumers, is a key competitiveness factor . With the accession of new EU member states in 2004 and 2007, the internal market has received an intra-trade boost .
Sources: Eurostat and Cefic Chemdata International
Home country sales Intra-EU export Extra-EU export
€ b
illio
n
0
50
100
150
200
250
300
350
400
450
500
550
201020072004200119981995
54.7
97.5
179.0
70.3
129.8
161.4
100.1
159.3
161.9
104.7
189.3
143.8
125.7
263.4
127.3
141.2
261.6
88.5
Source: Eurostat and Cefic Chemdata International

10Facts and Figures 2011
Unless specified, chemicals industry excludes pharmaceuticalsUnless specified, EU refers to EU-27
EU chemicals industry sales structureChemicals Industry Profile
1. Chemicals Industry Profile
World chemicals sales: geographic breakdown
World chemicals sales by region
Chemicals sales by country: top 30
EU chemicals industry sales by geographic breakdown
World exports and imports of chemicals by regional shares
EU chemicals industry sales by sectoral breakdown
EU chemicals industry sales: structure by destination
EU chemicals industry sales structure
Contribution of the chemicals industry to the EU economy
Added value in the EU manufacturing sector (2007)
2. International Trade
3. Growth and Competitiveness
4. Employment
5. Energy
6. Investment and R&D
7. Sustainable Development
Intra-EU sales, excluding home country sales, account for more than half of total chemicals sales
• EU chemicals sales in 2010 were 48 per centhigher compared to the value in 1995. Overthe period 1995-2010, EU chemicals sales have increased on average by 2 .7 per cent per annum .
• By 2010, intra-EU sales – excluding domesticsales – accounted for more than half of total chemicals sales by the sector in the European Union .
• Whileintra-EUsalesarerising,theimportanceof domestic sales is decreasing, however, only accounting for 18 per cent of total EU sales .
• Twenty-nine per cent of chemicals sales areexported outside of the EU market . European Union neighbour countries, the NAFTA trade bloc, and Asia are the three primary markets for EU chemicals exports .
Source: Cefic Chemdata International
1995: €331 billion 2010: €491 billion
Home country sales
54%Intra-EU
export29%
Extra-EU export17%
Home country
sales 18%
Intra-EU export53%
Extra-EU export29%
Source: Cefic Chemdata International
Percentage shares
1995: E331 billion 2010: E491 billion

11Facts and Figures 2011
Unless specified, chemicals industry excludes pharmaceuticalsUnless specified, EU refers to EU-27
Contribution of the chemicals industry to the EU economyChemicals Industry Profile
1. Chemicals Industry Profile
World chemicals sales: geographic breakdown
World chemicals sales by region
Chemicals sales by country: top 30
EU chemicals industry sales by geographic breakdown
World exports and imports of chemicals by regional shares
EU chemicals industry sales by sectoral breakdown
EU chemicals industry sales: structure by destination
EU chemicals industry sales structure
Contribution of the chemicals industry to the EU economy
Added value in the EU manufacturing sector (2007)
2. International Trade
3. Growth and Competitiveness
4. Employment
5. Energy
6. Investment and R&D
7. Sustainable Development
The chemicals industry directly accounts for 1.1 per cent of total EU gross domestic product, down from 1.5 per cent in 1995
• The chemicals industry’s contribution to EUgross domestic product, or GDP, amounts to 1 .1 per cent . This may seem small at first, but should be reassessed taking into consideration both the shrinking contribution of industry as a whole to GDP in advanced economies along with a rise in the service sector . The manufacturing sector share of GDP in the European Union declined from 23 .7 per cent in 1995 to 18 .7 per cent in 2010 .
• There is a wide contribution of chemicalsproducts that are present in all branches of the economy . For example, the chemicals industry in Germany is the most important supplier of innovative materials for manufacturing . Chemicals represent 10 per cent of the supply of input and intermediary products and they show an above average research & development content .
Sources: Eurostat and Cefic Chemdata International
Percentage of GDP, 2010
Services 20.9%
Public services23.9%
Financial economy28.8%
Industry18.7%
Construction6.0%
Agriculture1.7%
Source: Eurostat and Cefic Chemdata International
Chemicals 1.1%
Rest of manufacturing 14.3%
Rest of industry 3.3%
Percentage of GDP, 2010

12Facts and Figures 2011
Unless specified, chemicals industry excludes pharmaceuticalsUnless specified, EU refers to EU-27
Added value* in the EU manufacturing sector (2007)Chemicals Industry Profile
1. Chemicals Industry Profile
World chemicals sales: geographic breakdown
World chemicals sales by region
Chemicals sales by country: top 30
EU chemicals industry sales by geographic breakdown
World exports and imports of chemicals by regional shares
EU chemicals industry sales by sectoral breakdown
EU chemicals industry sales: structure by destination
EU chemicals industry sales structure
Contribution of the chemicals industry to the EU economy
Added value in the EU manufacturing sector (2007)
2. International Trade
3. Growth and Competitiveness
4. Employment
5. Energy
6. Investment and R&D
7. Sustainable Development
EU chemicals industry – the third largest manufacturing sector in terms of added value*
• Added value at factor costs is defined as thegross income from operating activities after adjusting for operating subsidies and indirect taxes . Value adjustments, such as depreciation, are not subtracted . (Source: EU Commission, SBS database)
• AccordingtoEurostatdata,34.5millionpeoplewere employed in 2 .3 million enterprises in the EU-27 manufacturing sector in 2007 . Together they generated €1813 billion of added value .
• The chart above shows the largest threesubsectors in 2007 in terms of added value, at the NACE division level . The three top subsectors were: machinery and equipment; food and beverages; and chemicals, including pharmaceuticals . Sectors such as tobacco, leather and office machinery & computers, however, contributed to less than one per cent of the EU manufacturing added value in 2007 .
• Thereisgreatdiversitybetweenmanufacturingsubsectors in EU member states . Some manufacturing activities have relatively low labour productivity, personnel costs per employee and investment rates, such as the manufacture of textiles, leather products, wearing apparel, compared with those with considerably higher values for the same indicators, such as chemicals .
Sources: Eurostat (SBS, ebd_all) and Cefic Analysis* Added value at factor cost ** Including pharmaceuticals
Key
sect
ors:
Top
15
Machinery and equipment
Food products and beverages
Chemicals**
Metal products
Motor vehicles & and (semi) trailers
Publishing, printing and recorded media
Basic metals
Electrical machinery
Other non-metallic mineral products
Rubber and plastic products
Optical instruments, watches and clocks
Furniture; manufacturing n.e.c.
Other transport equipment
Radio, TV & communication equipment
Pulp, paper and paper products
%
11.6%
10.7%
0 2 4 6 8 10 12 14
Source: Eurostat (SBS, ebd_all) and Cefic Analysis* Including pharmaceuticals
Percentage of added value in 2007

13Facts and Figures 2011
Unless specified, chemicals industry excludes pharmaceuticalsUnless specified, EU refers to EU-27
Extra-EU chemicals trade balanceInternational Trade
1. Chemicals Industry Profile
2. International Trade
Extra-EU chemicals trade balance
Extra-EU chemicals trade by region (exports & imports)
Extra-EU chemicals trade flows with major geographic blocs in € billion (2010)
EU chemicals trade surplus: sectoral breakdown
EU chemicals trade competitive analysis broken down by region
Extra-EU chemicals trade flows detailed analysis by sector
Extra-EU chemicals trade flows detailed analysis by country
3. Growth and Competitiveness
4. Employment
5. Energy
6. Investment and R&D
7. Sustainable Development
The EU chemicals trade surplus at record level in 2010
• Asahistorically importantplayer intheglobalchemicals market, the EU chemicals industry has been, and continues to be in a position to benefit from trade opportunities .
• In2010, thechemicalssector in theEuropeanUnion generated an extra-EU trade surplus of €47 billion, €4 billion more than in 2009 .
• The EU chemicals industry registered a solidrecovery in 2010 after the economic crisis in 2009 . The EU trade surplus with the rest of the world reached a record level in 2010 and remains a key driver for sector growth and competitiveness .
Sources: Eurostat and Cefic Chemdata International
0
1020
30
405060
70
80
90
100110
120
130
140
150
201020062002199819941990
Extra-EU balance Extra-EU exports Extra-EU imports
Tr
ade
Flow
s (€
bill
ions
)
Source: Eurostat and Cefic Chemdata International
1521 22
41 3947

14Facts and Figures 2011
Unless specified, chemicals industry excludes pharmaceuticalsUnless specified, EU refers to EU-27
Extra-EU chemicals trade by region (exports & imports)International Trade
1. Chemicals Industry Profile
2. International Trade
Extra-EU chemicals trade balance
Extra-EU chemicals trade by region (exports & imports)
Extra-EU chemicals trade flows with major geographic blocs in € billion (2010)
EU chemicals trade surplus: sectoral breakdown
EU chemicals trade competitive analysis broken down by region
Extra-EU chemicals trade flows detailed analysis by sector
Extra-EU chemicals trade flows detailed analysis by country
3. Growth and Competitiveness
4. Employment
5. Energy
6. Investment and R&D
7. Sustainable Development
Half of all extra-EU chemicals trade now occurs with NAFTA and Rest of Europe
• Extra-EU chemicals trade flow, calculatedas total exports plus imports, was mainly attributable in 2010 to “Rest of Europe”, with 26 .2 per cent of trade flow, followed by the North American Free Trade Agreement market (NAFTA), with 24 .9 per cent .
• Asia, excluding Japan and China, accounts for20 .6 per cent of EU trade flows with non-EU countries.Takentogether,the‘RestofEurope’,NAFTA and Asia markets contributed in 2010 to 85 .1 per cent, of total trade flows .
• Comparing2010tofiveyearsprior,NAFTAandJapan registered a decline in their contributions to total trade . The Rest of Europe, China and the Rest of Asia have increased their contributions .
Sources: Eurostat and Cefic Chemdata International* Asia excluding Japan and China
Perc
enta
ge s
hare
0
5
10
15
20
25
30
35
Rest of the World
Latin America
AfricaChinaJapanAsia*Rest of Europe
NAFTA
29.5
24.926.1 26.2
18.820.6
6.45.4 5.2
7.9
4.8 5.44.4
5.7 4.83.9
* Asia excluding Japan and ChinaSource: Eurostat and Cefic Chemdata International
2005: €181.9 billion 2010: €235.9 billion

15Facts and Figures 2011
Unless specified, chemicals industry excludes pharmaceuticalsUnless specified, EU refers to EU-27
Extra-EU chemicals trade flows with major geographic blocs in € billion (2010)International Trade
1. Chemicals Industry Profile
2. International Trade
Extra-EU chemicals trade balance
Extra-EU chemicals trade by region (exports & imports)
Extra-EU chemicals trade flows with major geographic blocs in € billion (2010)
EU chemicals trade surplus: sectoral breakdown
EU chemicals trade competitive analysis broken down by region
Extra-EU chemicals trade flows detailed analysis by sector
Extra-EU chemicals trade flows detailed analysis by country
3. Growth and Competitiveness
4. Employment
5. Energy
6. Investment and R&D
7. Sustainable Development
EU chemicals sector posted in 2010 a significant trade surplus with main competing world markets
• Thethreemajorgeographicblocstradingwiththe European Union in 2010 were: Rest of Europe, North America, and Asia (excluding China and Japan) .
• Apart from China, the European Union hasa surplus with each main trading region – NAFTA, Asia, Japan, Latin America, Africa, Rest of Europe and Africa . The EU chemicals sector broadly retained its market share in terms of global chemicals sales during the last decade .
• The Rest of Europe market played a major trade role in 2010 for the European Union . The EU chemicals sector had a €13 billion net trade surplus in chemicals with non-EU countries .
• The Trade Competitiveness Indicator (TCI) –an indicator that compares the trade balance to the total trade, namely exports plus imports of a region – reveals a deteriorating competi-tiveness, however, of the overall EU chemicals industry since 2003 .
• Tradedatafrom1998to2010showthattheTCIfor the EU chemicals industry went down from 25 per cent in 1988 to only 20 per cent in 2010 . This means that total chemicals imports are growing faster than total chemicals exports .
Source: Cefic Chemdata International
Source: Cefic Chemdata International
EU chemicals trade flows in € billion (2010)
NAFTAAsia
(excl. Japan& China)
23.8
35.0
China
Japan
Rest ofthe World
Latin America& the Caribbean
Africa
Rest of Europe
20.3
28.3
10.0
8.7
6.1
6.7
2.7
6.4
4.0
9.4
3.1
9.5
24.4
37.4
Trade surplus of €47 billion
EU chemicals trade flows in e billion (2010)
16Facts and Figures 2011
Unless specified, chemicals industry excludes pharmaceuticalsUnless specified, EU refers to EU-27
EU chemicals trade surplus: sectoral breakdownInternational Trade
1. Chemicals Industry Profile
2. International Trade
Extra-EU chemicals trade balance
Extra-EU chemicals trade by region (exports & imports)
Extra-EU chemicals trade flows with major geographic blocs in € billion (2010)
EU chemicals trade surplus: sectoral breakdown
EU chemicals trade competitive analysis broken down by region
Extra-EU chemicals trade flows detailed analysis by sector
Extra-EU chemicals trade flows detailed analysis by country
3. Growth and Competitiveness
4. Employment
5. Energy
6. Investment and R&D
7. Sustainable Development
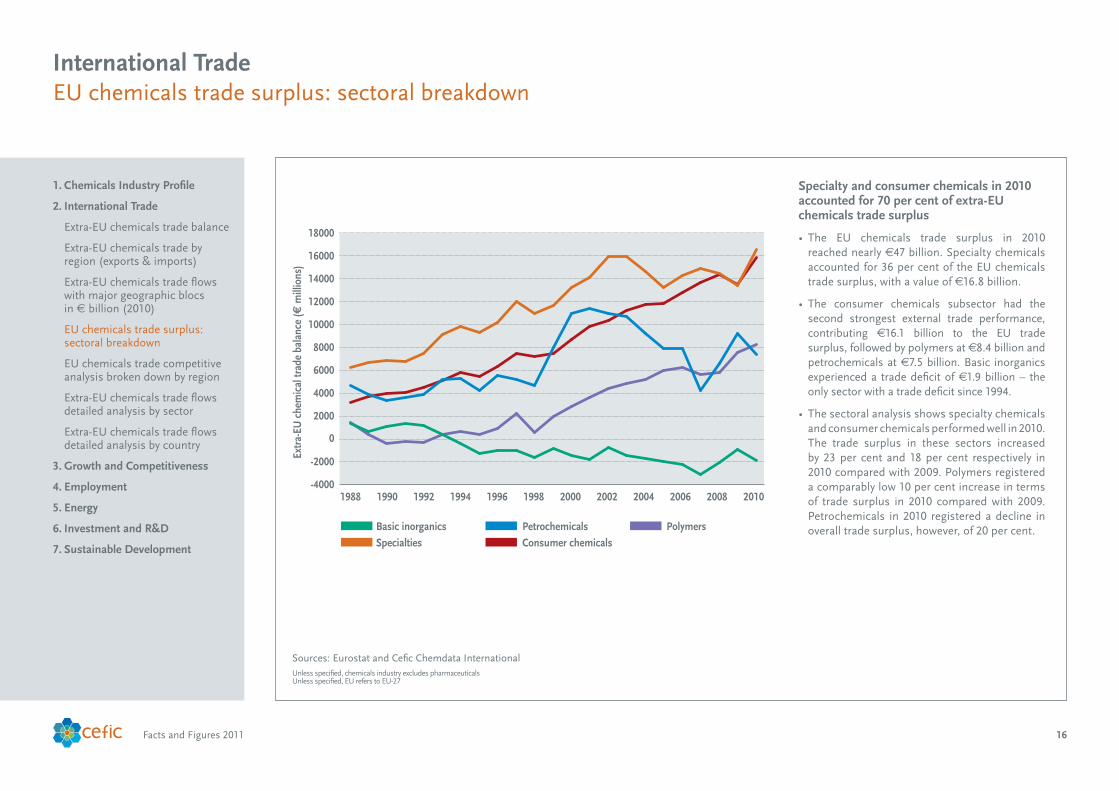
Specialty and consumer chemicals in 2010 accounted for 70 per cent of extra-EU chemicals trade surplus
• The EU chemicals trade surplus in 2010reached nearly €47 billion . Specialty chemicals accounted for 36 per cent of the EU chemicals trade surplus, with a value of €16 .8 billion .
• The consumer chemicals subsector had thesecond strongest external trade performance, contributing €16 .1 billion to the EU trade surplus, followed by polymers at €8 .4 billion and petrochemicals at €7 .5 billion . Basic inorganics experienced a trade deficit of €1 .9 billion – the only sector with a trade deficit since 1994 .
• Thesectoralanalysisshowsspecialtychemicalsand consumer chemicals performed well in 2010 . The trade surplus in these sectors increased by 23 per cent and 18 per cent respectively in 2010 compared with 2009 . Polymers registered a comparably low 10 per cent increase in terms of trade surplus in 2010 compared with 2009 . Petrochemicals in 2010 registered a decline in overall trade surplus, however, of 20 per cent .
Sources: Eurostat and Cefic Chemdata International
-4000
-2000
0
2000
4000
6000
8000
10000
12000
14000
16000
18000
Basic inorganics
1988 1990 1992 1994 1996 1998 2000 2002 2004 2006 2008 2010
Petrochemicals
Specialties Consumer chemicals
Polymers
Extr
a-EU
che
mic
al tr
ade
bala
nce
(€ m
illio
ns)
Source: Eurostat and Cefic Chemdata International

17Facts and Figures 2011
Unless specified, chemicals industry excludes pharmaceuticalsUnless specified, EU refers to EU-27
EU chemicals trade competitive analysis broken down by regionInternational Trade
1. Chemicals Industry Profile
2. International Trade
Extra-EU chemicals trade balance
Extra-EU chemicals trade by region (exports & imports)
Extra-EU chemicals trade flows with major geographic blocs in € billion (2010)
EU chemicals trade surplus: sectoral breakdown
EU chemicals trade competitive analysis broken down by region
Extra-EU chemicals trade flows detailed analysis by sector
Extra-EU chemicals trade flows detailed analysis by country
3. Growth and Competitiveness
4. Employment
5. Energy
6. Investment and R&D
7. Sustainable Development
EU trade position is deteriorating with key countries in Asia for almost all sub-sectors
• A lookat theEUtradebalance inrelationtoanumber of key countries and regions shows that the EU’s position is deteriorating with certainkey countries in Asia for almost all sub-sectors .
• China is the only country with which theEuropean Union currently has a trade deficit for all chemicals sub-sectors except polymers .
• Continued tradedevelopmentwith theMiddleEast indicates that this region increasingly uses its feedstock availability, namely petroleum, to develop an integrated chemicals value chain and to strengthen its position in a wider range of basic chemicals .
• Russiahasupuntilnowonlybeensuccessfulinusing its competitive advantage in raw materials for base chemicals .
Source: Cefic Chemdata International
Source: Cefic Chemdata International (2010 vs. 2009)
Trade analysis 2010 versus 2009
USA Japan Brazil Russia India ChinaSouthKorea
MiddleEast
Rest ofAsia Extra-EU
Basic Inorganics
Petrochemicals
Polymers
Specialty Chemicals
Consumer Chemicals
Chemicals
EU has a trade deficit and its competitive position weakened
EU has a trade deficit but its weak competitive position improved
EU has a trade surplus but its positive competitive position weakened
EU has a trade surplus and its healthy competitive position improved
Trade analysis: 2010 versus 2009

18Facts and Figures 2011
Unless specified, chemicals industry excludes pharmaceuticalsUnless specified, EU refers to EU-27
Extra-EU chemicals trade flows detailed analysis by sector
Trade position of petrochemicals and polymers show signs of erosion
• The trade position of certain important sub-sectors shows signs of serious erosion . In particular, raw material and energy-intensive parts of the chemicals industry find their global competitive position at risk, namely basic organics such as petrochemicals as well as basic inorganics such as fertilizers .
International Trade
1. Chemicals Industry Profile
2. International Trade
Extra-EU chemicals trade balance
Extra-EU chemicals trade by region (exports & imports)
Extra-EU chemicals trade flows with major geographic blocs in € billion (2010)
EU chemicals trade surplus: sectoral breakdown
EU chemicals trade competitive analysis broken down by region
Extra-EU chemicals trade flows detailed analysis by sector
Extra-EU chemicals trade flows detailed analysis by country
3. Growth and Competitiveness
4. Employment
5. Energy
6. Investment and R&D
7. Sustainable Development
Sources: Eurostat and Cefic Chemdata International
15%
10%
5%
0%
-5%
-10%
-15%
TCI 2
010
- TCI
200
9
Source: Eurostat and Cefic Chemdata International
Trade Competitiveness Indicator (TCI, 2010) = (exp - imp) / (exp + imp)
Trade deficitCompetitive position: improved
Trade deficitCompetitive position: worse
Trade surplus Competitive advantage:
improved
Trade surplus Competitive advantage:
reduced
-30% -20% -10% 0% 10% 20% 30% 40% 50% 60%
Basic Inorganics 12.8%
Petrochemicals 36.7%
Polymers 15.4%
Specialty Chemicals 22.5%
Consumer Chemicals 12.6%

19Facts and Figures 2011
Unless specified, chemicals industry excludes pharmaceuticalsUnless specified, EU refers to EU-27
Extra-EU chemicals trade flows detailed analysis by countryInternational Trade
1. Chemicals Industry Profile
2. International Trade
Extra-EU chemicals trade balance
Extra-EU chemicals trade by region (exports & imports)
Extra-EU chemicals trade flows with major geographic blocs in € billion (2010)
EU chemicals trade surplus: sectoral breakdown
EU chemicals trade competitive analysis broken down by region
Extra-EU chemicals trade flows detailed analysis by sector
Extra-EU chemicals trade flows detailed analysis by country
3. Growth and Competitiveness
4. Employment
5. Energy
6. Investment and R&D
7. Sustainable Development
Global trade competitiveness of the EU chemicals industry is at risk
• International trade is vital for growth andemployment of the European chemicals industry . The industry has placed itself at the centre of global trade and thus depends vitally on open markets .
• As the most rapid growth is concentrated inthe emerging economies, favourable access to these markets is highly important .
Sources: Eurostat and Cefic Chemdata International
15%
10%
5%
0%
-5%
-10%
-15%
TCI 2
010
- TCI
200
9
Source: Eurostat and Cefic Chemdata International
Trade Competitiveness Indicator (TCI, 2010) = (exp - imp) / (exp + imp)
Trade deficitCompetitive position: improved
Trade deficitCompetitive position: worse
Trade surplus Competitive advantage:
Improved
Trade surplus Competitive advantage:
reduced
-30% -20% -10% 0% 10% 20% 30% 40% 50% 70%60%
China 7.9%
Japan 5.4%
USA 22.4%
Middle East 6.5%
South Korea 2.2%
Brazil 2.8%
Russia 5.5%
Rest of Asia 9.1%
India 2.8%

20Facts and Figures 2011
Unless specified, chemicals industry excludes pharmaceuticalsUnless specified, EU refers to EU-27
Production, trade and consumption growthGrowth and Competitiveness
1. Chemicals Industry Profile
2. International Trade
3. Growth and Competitiveness
Production, trade and consumption growth
Chemicals growth performance against total manufacturing
EU chemicals production growth by sector
International comparison of production growth
International comparison of production growth (continued)
EU manufacturing industry: gross operating surplus rate (2007)
4. Employment
5. Energy
6. Investment and R&D
7. Sustainable Development
EU trade is a key driver of the EU chemicals industry
• Duringtheperiodfrom2005to2010,chemicalssales and consumption registered small growth . Chemicals consumption increased by 0 .7 per cent, slightly less than the 1 .1 per cent sales increase .
• Import growth during the same five-yearperiod experienced a trend rate of 5 .5 per cent, exceeding slightly the 5 .3 per cent trend rate of export growth .
• In contrast to sales and consumption, tradeactivity grew by significant rates during the five-year period from 2005 to 2010 .
Sources: Eurostat and Cefic Chemdata International* Consumption = total sales - exports + imports
Growth rate 2000-2005 Growth rate 2005-2010
Aver
age
grow
th in
val
ue (%
p.a
.)
0
1
2
3
4
5
6
Consumption*Extra-EU importsExtra-EU exportsSales
* Consumption = total sales - exports + importsSource: Eurostat and Cefic Chemdata International
2.1
1.1
2.8
5.3
3.5
5.5
2.1
0.7

21Facts and Figures 2011
Unless specified, chemicals industry excludes pharmaceuticalsUnless specified, EU refers to EU-27
Chemicals growth performance against total manufacturingGrowth and Competitiveness
1. Chemicals Industry Profile
2. International Trade
3. Growth and Competitiveness
Production, trade and consumption growth
Chemicals growth performance against total manufacturing
EU chemicals production growth by sector
International comparison of production growth
International comparison of production growth (continued)
EU manufacturing industry: gross operating surplus rate (2007)
4. Employment
5. Energy
6. Investment and R&D
7. Sustainable Development
Production growth in the EU chemicals industry slightly higher than manufacturing average
• Inthe10-yearperiodfrom2000to2010,thechemicalsindustry had an average growth rate of 0 .7 per cent, a rate slightly higher than the 0 .2 per cent average growth rate for total manufacturing . These low growth rates were mainly impacted by the dramatic declines in chemicals production levels during the 2009 economic downturn as compared with pre-crisis levels .
• TheEUchemicalsindustrywasprofoundlyaffectedby the spill-over effects of the economic and financial crisis . The magnitude of the economic crisis, which started during the second half of 2008, was much more severe than expected . Many companies were certainly not anticipating such a dramatic downturn . Data covering activity through 2009 indicates that chemicals companies are experiencing strong pressure on margins due in particular to the lack of demand from customers and weak consumer spending .
• Asexpected,bothchemicalsandmanufacturinghavebeen following the recovery trend in 2010 . The EU chemicals sector has enjoyed a strong 2010, posting a 9 .8 per cent growth rate compared with 2009 . The EU manufacturing sector also rebounded, recovering by 7 .3 per cent in 2010 . These figures appear spectacular and give the wrong perception that both sectors are performing well . The reality is that even with strong growth rates, production in 2010 was far below the pre-crisis level and will need an additional two years to come back to the pre-crisis level .
Sources: Eurostat and Cefic Chemdata International
Gro
wth
in v
olum
e (%
p.a
.)
Average growth rate: production (2000-2010)
Chemicals Manufacturing
Average growth rate: production ( 2000-2010)Chemicals 0.7%Manufacturing 0.2%
-16
-14
-12
-10
-8
-6
-4
-2
0
2
4
6
8
10
12
20102009200820072006200520042003200220012000
5.4
0.0
-0.6
0.4
2.71.5
4.94.1
-1.9
-14.8
7.3
3.6
-0.9
2.6
-0.2
3.31.6
3.62.8
-3.2
-11,0
9.8
Source: Eurostat and Cefic Chemdata International
Average growth rate: production (2000-2010)

22Facts and Figures 2011
Unless specified, chemicals industry excludes pharmaceuticalsUnless specified, EU refers to EU-27
EU chemicals production growth by sectorGrowth and Competitiveness
1. Chemicals Industry Profile
2. International Trade
3. Growth and Competitiveness
Production, trade and consumption growth
Chemicals growth performance against total manufacturing
EU chemicals production growth by sector
International comparison of production growth
International comparison of production growth (continued)
EU manufacturing industry: gross operating surplus rate (2007)
4. Employment
5. Energy
6. Investment and R&D
7. Sustainable Development
Polymers and basic inorganics registered the fastest rebounds after steep decline in 2009
• Polymers and basic inorganics registeredthe fastest rebounds in 2010, but in all cases chemicals output remains well below pre-2008 levels . Petrochemicals production increased by 8 .4 per cent in 2010 compared with 2009 .
• Other chemicals sub-sectors less affected bythe crisis – namely consumer and specialty chemicals – have been recovering at a more modest rate . Production rose by 6 .1 per cent in specialty chemicals and 6 .8 per cent for consumer chemicals during 2010 .
• Growth in EU chemicals production in 2010has continued more strongly than expected . However, the overall economic recovery in Europe remains fragile .
• ThedevelopmentoftheEUchemicalsindustrywill also depend on the effectiveness of consolidation measures taken in individual EU countries . The European chemicals industry continues to face relentless global competition . Access to raw materials and energy at globally competitive prices remains a prerequisite for a successful recovery .
Source: Cefic Chemdata International
Prod
uctio
n (v
olum
e): g
row
th ra
te (y
oy)
2008 2009 2010
-20
-15
-10
-5
0
5
10
15
20
Consumer Chemicals
Specialty Chemicals
PetrochemicalsChemicalsBasic Inorganics
Polymers
-4.8-6.2
-3.2-5.1
-1.7-3.4
-16.1 -17.3
-11.0
-6.0 -6.9-9.3
14.612.9
9.88.4
6.8 6.1
Source: Cefic Chemdata International

23Facts and Figures 2011
Unless specified, chemicals industry excludes pharmaceuticalsUnless specified, EU refers to EU-27
Growth and CompetitivenessInternational comparison of production growth
1. Chemicals Industry Profile
2. International Trade
3. Growth and Competitiveness
Production, trade and consumption growth
Chemicals growth performance against total manufacturing
EU chemicals production growth by sector
International comparison of production growth
International comparison of production growth (continued)
EU manufacturing industry: gross operating surplus rate (2007)
4. Employment
5. Energy
6. Investment and R&D
7. Sustainable Development
Emerging economies outpace industrial countries in chemicals production
• During the period from 2005 to 2010, the EUchemicals industry (including pharmaceuticals) showed the second most modest growth rate compared with the biggest regions in the world . The EU chemicals sector grew by 1 .6 per cent, well below the world chemicals industry average growth rate of 4 .1 per cent .
• Duringtheperiodfrom2005-2010,thechemicalsindustry (including pharmaceuticals) in the North American Free Trade Agreement Area (NAFTA) showed a negative growth rate on average . This is due to the spill-over effects of the crisis in the United States in 2008 and 2009 .
• The Asia-Pacific region outpaced growth inEU and US markets, with average growth rates of 10 .8 per cent in chemicals, including pharmaceuticals, during the past five years . Asia is heavily influenced by the extraordinary performance of the Chinese chemicals sector and a booming economic climate in China, especially its industrial sector .
• Emerging economies are outpacing industrialcountries in chemicals production and have been pushing up the average growth rate of world chemicals production during the past ten years .
Sources: ACC and Cefic Chemdata International* Including pharmaceuticals** Asia-Pacific includes Japan, China, India, Korea, Malaysia, Philippines, Singapore, Taiwan, Thailand,
Pakistan, Bangladesh and Australia
Aver
age
grow
th in
vol
ume
(% p
.a.)
World average growth rate: chemicals* production
2000-2005 4.6% 2005-2010 4.1%
-2
0
2
4
6
8
10
12
NAFTAEU27Latin AmericaAsia-Pacific**
9.0
4.7
2.92.5
10.8
2.6
1.6
-1.4
** Asia-Pacific includes Japan, China, India, Korea, Malaysia, Philippinse, Singapore, Taiwan, Thailand, Pakistan, Bangladesh and Australia
* Including pharmaceutical
Source: ACC and Cefic Chemdata International
World average growth rate: chemicals* production

24Facts and Figures 2011
Unless specified, chemicals industry excludes pharmaceuticalsUnless specified, EU refers to EU-27
International comparison of production growth (continued)Growth and Competitiveness
1. Chemicals Industry Profile
2. International Trade
3. Growth and Competitiveness
Production, trade and consumption growth
Chemicals growth performance against total manufacturing
EU chemicals production growth by sector
International comparison of production growth
International comparison of production growth (continued)
EU manufacturing industry: gross operating surplus rate (2007)
4. Employment
5. Energy
6. Investment and R&D
7. Sustainable Development
Emerging economies outpace industrial countries in chemicals production (continued)
• The long-term trend for chemicals production,including pharmaceuticals, shows that apart from the Asia-Pacific region, chemicals production registered a negative growth rate in 2008 and 2009 in all regions .
• Observing thegrowth ratesofworldchemicalsproduction since 1988, data confirms that annual chemicals production has always registered positive growth rates, except in two instances . The first period was 1990, when production declined by 0 .3 per cent compared with 1989 . The second year was 2009 when world chemicals production declined by 4 .4 per cent compared with 2008 – the largest recorded decline in world chemicals production in 23 years .
• Chemicals production recovery occurred in allregions in 2010 . World chemicals production has increased by 9 .9 per cent in 2010 compared to 2009 . The strong recovery was led by the Asia-Pacific region, where production grew in 2010 by 15 .3 per cent .
Sources: ACC and Cefic Chemdata International* Asia includes Japan, China, Korea, Malaysia, Philippines, Singapore, Taiwan, Thailand, Pakistan,
Bangladesh and Australia
80
90
100
110
120
130
140
150
160
170
180
201020092008200720062005
North America Latin America Asia-Pacific* EU-27
Prod
uctio
n in
dex
(200
5=10
0)
Source: ACC and Cefic Chemdata International
* Asia includes Japan, China, Korea, Malaysia, Philipines, Singapore, Taiwan, Thailand, Pakistan, Bangladesh and Australia

25Facts and Figures 2011
Unless specified, chemicals industry excludes pharmaceuticalsUnless specified, EU refers to EU-27
EU manufacturing industry: gross operating surplus rate (2007)Growth and Competitiveness
1. Chemicals Industry Profile
2. International Trade
3. Growth and Competitiveness
Production, trade and consumption growth
Chemicals growth performance against total manufacturing
EU chemicals production growth by sector
International comparison of production growth
International comparison of production growth (continued)
EU manufacturing industry: gross operating surplus rate (2007)
4. Employment
5. Energy
6. Investment and R&D
7. Sustainable Development
EU chemicals industry Gross Operating Surplus (GOS) far higher than overall manufacturing sector average
• TheGrossOperatingSurplus,orGOS,isaproxyof profitability . Data for 2007 confirm that the chemicals industry, including pharmaceuticals, contributed 13 .8 per cent to the EU manufacturing GOSinabsolutefigures.
• The chart above shows that GOS intensity –calculatedastheratioofGOStosales–intheEUchemicals industry, including pharmaceuticals, is the fourth highest among all EU manufacturing sectors . The chemicals sector follows non-metallic mineral products, medical & optical instruments and publishing & printing .
• GOS intensity in the EU chemicals industry,which includes pharmaceuticals, was 1 .34 times the level of the overall EU manufacturing sector average . The coke, refined petroleum products andnuclearfuelsubsectorhadaGOSof3.8percentin2007–theweakestGOSintensityintheEU manufacturing sector .
Sources: Eurostat and Cefic Analysis* Estimated data ** Including pharmaceuticals
Key
sect
ors:
Top
15
Other non-metallic mineral products
Medical, precision and optical instruments*
Publishing and printing
Chemicals**
Fabricated metal products
Wood and wood products
Recycling
Furniture; manufacturing n.e.c.
Basic metals
Machinery and equipment
Rubber and plastic products
Tobacco
Manufacturing
Wearing apparel and dressing
Pulp and paper
% of sales
12.8%
14.5%
14.0%
13.5%
11.7%
11.3%
10.4%
10.2%
10.0%
9.7%
9.7%
9.6%
9.5%
9.3%
9.5%
6 7 8 9 10 11 12 13 14 15 16
Gross operating surplus rate in the EU manufacturing sector (2007)
Source: Eurostat and Cefic Analysis
* Estimated data ** Including pharmaceuticals
Gross operating surplus rate in the EU manufacturing sector (2007)
26Facts and Figures 2011
Unless specified, chemicals industry excludes pharmaceuticalsUnless specified, EU refers to EU-27
EU manufacturing industry: breakdown of employment (2007)Employment
1. Chemicals Industry Profile
2. International Trade
3. Growth and Competitiveness
4. Employment
EU manufacturing industry: breakdown of employment (2007)
Employment in the chemicals industry: European Union versus United States
EU manufacturing industry: breakdown of labour cost per employee
EU labour cost per employee: chemicals versus manufacturing
Labour cost per employee in the EU chemicals industry
Labour productivity in EU chemicals and other manufacturing sectors
EU labour productivity: chemicals versus total manufacturing
Labour productivity in the EU chemicals industry
5. Energy
6. Investment and R&D
7. Sustainable Development
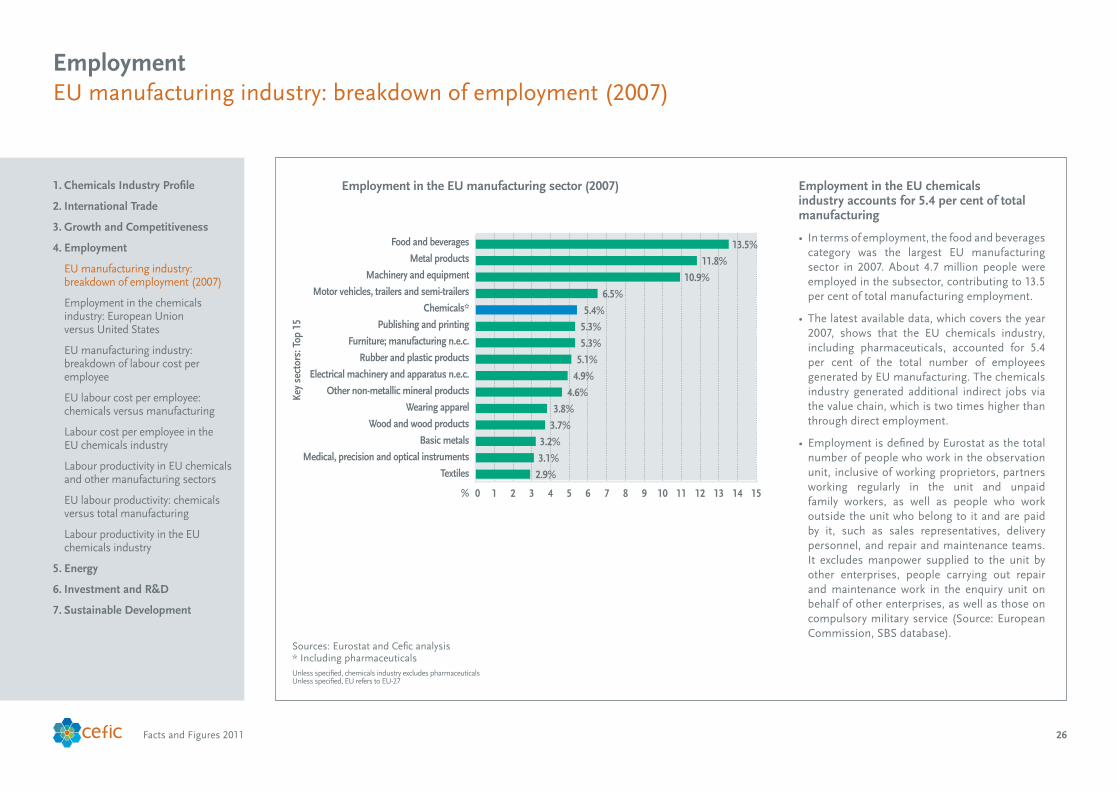
Employment in the EU chemicals industry accounts for 5.4 per cent of total manufacturing
• Intermsofemployment,thefoodandbeveragescategory was the largest EU manufacturing sector in 2007 . About 4 .7 million people were employed in the subsector, contributing to 13 .5 per cent of total manufacturing employment .
• Thelatestavailabledata,whichcoverstheyear2007, shows that the EU chemicals industry, including pharmaceuticals, accounted for 5 .4 per cent of the total number of employees generated by EU manufacturing . The chemicals industry generated additional indirect jobs via the value chain, which is two times higher than through direct employment .
• EmploymentisdefinedbyEurostatasthetotalnumber of people who work in the observation unit, inclusive of working proprietors, partners working regularly in the unit and unpaid family workers, as well as people who work outside the unit who belong to it and are paid by it, such as sales representatives, delivery personnel, and repair and maintenance teams . It excludes manpower supplied to the unit by other enterprises, people carrying out repair and maintenance work in the enquiry unit on behalf of other enterprises, as well as those on compulsory military service (Source: European Commission, SBS database) .
Sources: Eurostat and Cefic analysis* Including pharmaceuticals
Key
sect
ors:
Top
15
Food and beverages
Metal products
Machinery and equipment
Motor vehicles, trailers and semi-trailers
Chemicals*
Publishing and printing
Furniture; manufacturing n.e.c.
Rubber and plastic products
Electrical machinery and apparatus n.e.c.
Other non-metallic mineral products
Wearing apparel
Wood and wood products
Basic metals
Medical, precision and optical instruments
Textiles
%
5.4%
13.5%
0 1 2 3 4 5 6 7 8 9 10 11 12 13 14 15
Employment in the EU manufacturing sector (2007)
Source: Eurostat and Cefic Analysis* Including pharmaceuticals
6.5%
11.8%
10.9%
5.3%
5.3%
5.1%
4.9%
4.6%
3.8%
3.7%
3.1%
2.9%
3.2%
Employment in the EU manufacturing sector (2007)
27Facts and Figures 2011
Unless specified, chemicals industry excludes pharmaceuticalsUnless specified, EU refers to EU-27
Employment in the chemicals industry: European Union versus United StatesEmployment
1. Chemicals Industry Profile
2. International Trade
3. Growth and Competitiveness
4. Employment
EU manufacturing industry: breakdown of employment (2007)
Employment in the chemicals industry: European Union versus United States
EU manufacturing industry: breakdown of labour cost per employee
EU labour cost per employee: chemicals versus manufacturing
Labour cost per employee in the EU chemicals industry
Labour productivity in EU chemicals and other manufacturing sectors
EU labour productivity: chemicals versus total manufacturing
Labour productivity in the EU chemicals industry
5. Energy
6. Investment and R&D
7. Sustainable Development
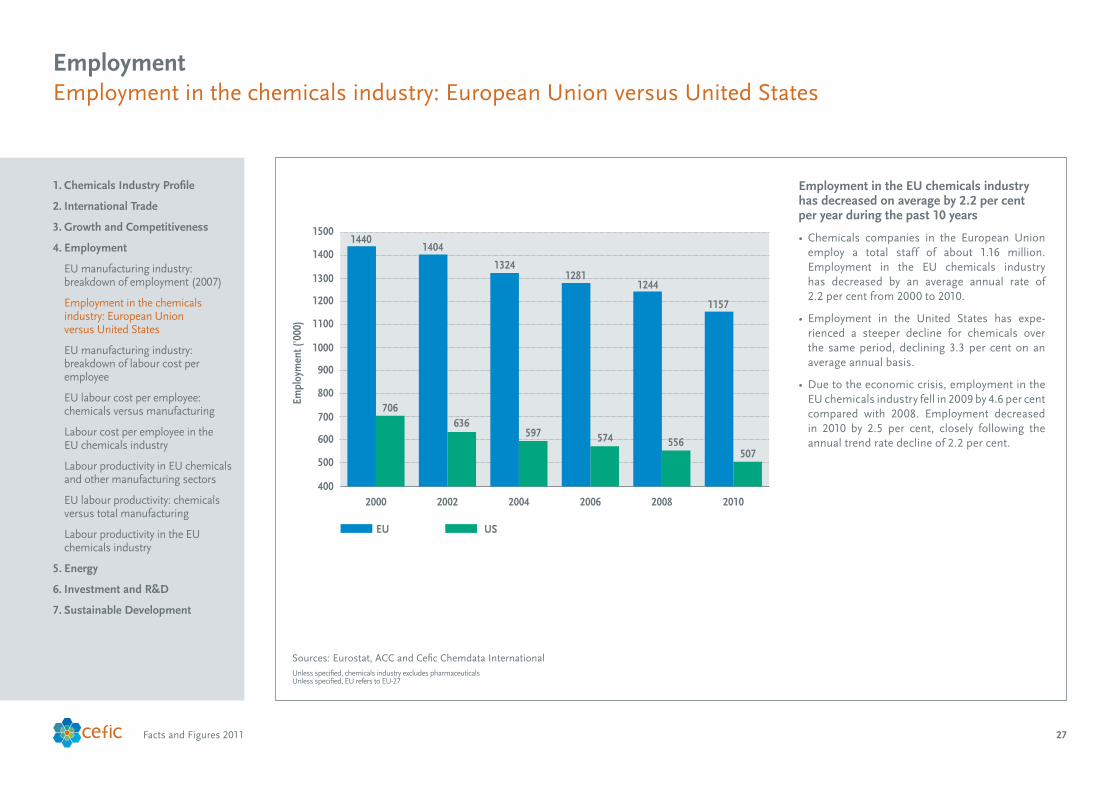
Employment in the EU chemicals industry has decreased on average by 2.2 per cent per year during the past 10 years
• Chemicals companies in the European Unionemploy a total staff of about 1 .16 million . Employment in the EU chemicals industry has decreased by an average annual rate of 2 .2 per cent from 2000 to 2010 .
• Employment in the United States has expe-rienced a steeper decline for chemicals over the same period, declining 3 .3 per cent on an average annual basis .
• Duetotheeconomiccrisis,employmentintheEU chemicals industry fell in 2009 by 4 .6 per cent compared with 2008 . Employment decreased in 2010 by 2 .5 per cent, closely following the annual trend rate decline of 2 .2 per cent .
Sources: Eurostat, ACC and Cefic Chemdata International
Empl
oym
ent (
'000
)
EU US
Source: Eurostat, ACC and Cefic Chemdata International
400
500
600
700
800
900
1000
1100
1200
1300
1400
1500
201020082006200420022000
1440
706
1404
636
1324
597
1281
574
1244
556
1157
507

28Facts and Figures 2011
Unless specified, chemicals industry excludes pharmaceuticalsUnless specified, EU refers to EU-27
EU manufacturing industry*: breakdown of labour cost per employeeEmployment
1. Chemicals Industry Profile
2. International Trade
3. Growth and Competitiveness
4. Employment
EU manufacturing industry: breakdown of employment (2007)
Employment in the chemicals industry: European Union versus United States
EU manufacturing industry: breakdown of labour cost per employee
EU labour cost per employee: chemicals versus manufacturing
Labour cost per employee in the EU chemicals industry
Labour productivity in EU chemicals and other manufacturing sectors
EU labour productivity: chemicals versus total manufacturing
Labour productivity in the EU chemicals industry
5. Energy
6. Investment and R&D
7. Sustainable Development
Chemicals industry – the highest labour cost per employee in the EU manufacturing sector
• The labour force employed in the chemicalsindustry is more qualified, trained and better paid than the average industrial worker . Personnel costs for the EU chemicals industry are 56 per cent higher than the average of other manufacturing sectors .
• The chemicals industry is the leading sector interms of labour cost per employee, including pharmaceuticals, followed by the sector categories automotive and other transparent equipment .
• This cost (salary) factor is a significant tool toattract new and young talents to work for the EU chemicals industry. On the other hand,public perception of the chemicals industry remains relatively negative and requires a strong improvement, especially to attract young talent who will one day enter the workforce .
• Labourcostsaredefinedasthetotalremuneration,in cash or in kind, payable by an employer to an employee – regular and temporary employees as well as home workers – in return for work done by the latter during the reference period . Personnel costs also include taxes and employees’ socialsecurity contributions retained by the unit as wellastheemployer’scompulsoryandvoluntarysocial contributions . Personnel costs are made up of wages and salaries and employers’ socialsecurity costs (Source: European Commission, SBS database) .
Sources: Eurostat and Cefic analysis* Data on coke and refined petroleum products is skipped** Including pharmaceuticals
Key
sect
ors:
Top
15
Chemicals**
Motor vehicles, trailers and semi-trailers
Radio, Tv & comm. Equip.
Other transport equipment
Office machinery and computers
Basic metals
Medical, precision and optical instruments
Machinery and equipment n.e.c.
Pulp and paper
Electrical machinery and apparatus
Publishing and printing
Manufacturing
Other non-metallic mineral products
Rubber and plastic products
Fabricated metal products
% 50 60 70 80 90 100 110
Labour cost per employee in the EU manufacturing* sector (2007)
Source: Eurostat and Cefic Analysis** Including pharmaceuticals* Data on coke and refined petroleum products is skipped
64.3%
100%
80.6%
82.5%
88.4%
85.9%
76.3%
76.0%
74.8%
72.5%
68.7%
68.7%
59.1%
58.0%
59.1%
Labour cost per employee in the EU manufacturing* sector (2007)

29Facts and Figures 2011
Unless specified, chemicals industry excludes pharmaceuticalsUnless specified, EU refers to EU-27
EU labour cost per employee: chemicals versus manufacturingEmployment
1. Chemicals Industry Profile
2. International Trade
3. Growth and Competitiveness
4. Employment
EU manufacturing industry: breakdown of employment (2007)
Employment in the chemicals industry: European Union versus United States
EU manufacturing industry: breakdown of labour cost per employee
EU labour cost per employee: chemicals versus manufacturing
Labour cost per employee in the EU chemicals industry
Labour productivity in EU chemicals and other manufacturing sectors
EU labour productivity: chemicals versus total manufacturing
Labour productivity in the EU chemicals industry
5. Energy
6. Investment and R&D
7. Sustainable Development
Labour cost per employee in the EU chemicals industry increased by 42 per cent during the period 2000 to 2010
• Thechemicalsindustryhasahighlytrainedandwell educated workforce, which redistributes part of its economic profits to employees via high-wage, competitive salaries .
• Payrollaccountsfor12.5percentofchemicalsproduction costs .
• LabourcostperemployeeintheEUchemicalsindustry has increased by an average of 3 .6 per cent per annum from 2000 to 2010 . In the case of EU manufacturing, labour cost per employee grew by three per cent per annum during the same period .
• LabourcostperemployeeintheEUchemicalsindustry was 42 per cent more expensive in 2010 compared with 10 years ago . The EU manufacturing sector labour cost per employee was 34 .9 per cent higher in 2010 compared with 2000 .
Sources: Eurostat and Cefic analysis
95
100
105
110
115
120
125
130
135
140
145
201020082006200420022000
Chemicals Manufacturing
Inde
x (2
000
= 10
0)
Average growth p.a. 2000-2010Chemicals 3.6%Manufacturing 3.0%
Source: Eurostat and Cefic Analysis

30Facts and Figures 2011
Unless specified, chemicals industry excludes pharmaceuticalsUnless specified, EU refers to EU-27
Labour cost per employee in the EU chemicals industryEmployment
1. Chemicals Industry Profile
2. International Trade
3. Growth and Competitiveness
4. Employment
EU manufacturing industry: breakdown of employment (2007)
Employment in the chemicals industry: European Union versus United States
EU manufacturing industry: breakdown of labour cost per employee
EU labour cost per employee: chemicals versus manufacturing
Labour cost per employee in the EU chemicals industry
Labour productivity in EU chemicals and other manufacturing sectors
EU labour productivity: chemicals versus total manufacturing
Labour productivity in the EU chemicals industry
5. Energy
6. Investment and R&D
7. Sustainable Development
Labour cost per employee increased by 3.6 per cent per annum from 2000 to 2010
• LabourcostperemployeeintheEUchemicalsindustry has increased by an average of 1 .3 per cent per annum from 2000 to 2010 . Employment went down by 2 .2 per cent on average during the same period .
• Between2000and2010,labourcostintheEUchemicals industry, including pharmaceuticals, rose by 14 .3 per cent, while total employment fell respectively by 19 .8 per cent from 2000 to 2010 .
Sources: Eurostat and Cefic analysis
70
80
90
100
110
120
130
140
150
20102009200820072006200520042003200220012000
Employment Labour cost per employee Labour cost
Inde
x (2
000
= 10
0)
Average growth p.a. 2000-2010Employment -2.2%Labour cost 1.3%Labour cost per employee 3.6%
Source: Eurostat and Cefic Analysis

31Facts and Figures 2011
Unless specified, chemicals industry excludes pharmaceuticalsUnless specified, EU refers to EU-27
Labour productivity in EU chemicals and other manufacturing sectorsEmployment
1. Chemicals Industry Profile
2. International Trade
3. Growth and Competitiveness
4. Employment
EU manufacturing industry: breakdown of employment (2007)
Employment in the chemicals industry: European Union versus United States
EU manufacturing industry: breakdown of labour cost per employee
EU labour cost per employee: chemicals versus manufacturing
Labour cost per employee in the EU chemicals industry
Labour productivity in EU chemicals and other manufacturing sectors
EU labour productivity: chemicals versus total manufacturing
Labour productivity in the EU chemicals industry
5. Energy
6. Investment and R&D
7. Sustainable Development
Chemicals industry – the leading EU manufacturing sector in terms of value-added per employee
• Chemicalsformtheleadingmanufacturingsectorin terms of value-added per employee in Europe, according to the latest data for the 2007 time period .
• The chemicals industry’s value added peremployee is 98 per cent higher than the combined average of all manufacturing sectors .
Sources: Eurostat and Cefic analysis* Including pharmaceuticals
Key
sect
ors
0 20 40 60 80 100 120
Food productsand beverages
Electrical machineryand apparatus n.e.c.
Manufacturing
Machinery andequipment n.e.c.
Automotive
Basic metals
Chemicals*
2007
* Including pharmaceuticalsSource: Eurostat and Cefic Analysis
100.0
77.0
66.2
53.9
50.4
48.8
41.0
2007

32Facts and Figures 2011
Unless specified, chemicals industry excludes pharmaceuticalsUnless specified, EU refers to EU-27
EU labour productivity: chemicals versus total manufacturingEmployment
1. Chemicals Industry Profile
2. International Trade
3. Growth and Competitiveness
4. Employment
EU manufacturing industry: breakdown of employment (2007)
Employment in the chemicals industry: European Union versus United States
EU manufacturing industry: breakdown of labour cost per employee
EU labour cost per employee: chemicals versus manufacturing
Labour cost per employee in the EU chemicals industry
Labour productivity in EU chemicals and other manufacturing sectors
EU labour productivity: chemicals versus total manufacturing
Labour productivity in the EU chemicals industry
5. Energy
6. Investment and R&D
7. Sustainable Development
Labour productivity in the EU chemicals industry is far higher than manufacturing average
• Due to intensifying global competition, theEU chemicals industry has taken vigorous restructuring and cost-saving steps in order to improve its competitiveness over the last decade .
• As a consequence, labour productivity in thechemicals industry has been growing at an average annual growth from 2000 to 2010 of 2 .9 per cent, faster than the 2 .2 per cent labour productivity rate in the total manufacturing sector for the same 10-year period .
Sources: Eurostat and Cefic analysis
95
100
105
110
115
120
125
130
135
140
201020082006200420022000
Chemicals Manufacturing
Inde
x (2
000
= 10
0)
Average growth p.a. 2000-2010Chemicals 2.9%Manufacturing 2.2%
Source: Eurostat and Cefic Analysis

33Facts and Figures 2011
Unless specified, chemicals industry excludes pharmaceuticalsUnless specified, EU refers to EU-27
1. Chemicals Industry Profile
2. International Trade
3. Growth and Competitiveness
4. Employment
EU manufacturing industry: breakdown of employment (2007)
Employment in the chemicals industry: European Union versus United States
EU manufacturing industry: breakdown of labour cost per employee
EU labour cost per employee: chemicals versus manufacturing
Labour cost per employee in the EU chemicals industry
Labour productivity in EU chemicals and other manufacturing sectors
EU labour productivity: chemicals versus total manufacturing
Labour productivity in the EU chemicals industry
5. Energy
6. Investment and R&D
7. Sustainable Development
EmploymentLabour productivity in the EU chemicals industry
Labour productivity has increased on average by 2.9 per cent per annum from 2000 to 2010
• TheEUchemicalsindustryisaleadingindustrywith a highly skilled and productive workforce, notably due to high investment per employee and highly educated and trained employees .
• Asaconsequence,labourproductivityintheEUchemicals industry rose at an average annual rate of 2 .9 per cent from 2000 to 2010 .
Sources: Eurostat and Cefic Chemdata International
70
80
90
100
110
120
130
140
20102009200820072006200520042003200220012000
Production Employment Labour productivity
Inde
x (2
000
= 10
0)
Average growth p.a. 2000-2010Production 0.7%Employment -2.2%Productivity 2.9%
Source: Eurostat and Cefic Chemdata International

34Facts and Figures 2011
Unless specified, chemicals industry excludes pharmaceuticalsUnless specified, EU refers to EU-27
EnergyFuel and power consumption in the EU chemicals industry
1. Chemicals Industry Profile
2. International Trade
3. Growth and Competitiveness
4. Employment
5. Energy
Fuel and power consumption in the EU chemicals industry
Gas and oil consumption in the EU chemicals industry during the past 20 years
Energy intensity in the EU chemicals industry
Energy intensity: European Union versus United States
6. Investment and R&D
7. Sustainable Development
EU chemicals industry fuel and power consumption has fallen by 27 per cent since 1990
• Thechemicalsindustrytransformsenergyandraw materials into products required by other industrial sectors as well as by final consumers . The cost of these two inputs is a prime factor in competitiveness on world markets .
• In 1990, the European chemicals industry,including pharmaceuticals, used a total of 69.2 million tonnes of oil equivalent (TOE) of fuel and power consumption .
• The EU chemicals industry, includingpharmaceuticals, has constantly reduced its fuel and power consumption significantly during the period 1990 to 2009 . The amount of energy consumed in 2009 was 27 per cent less than the level in 1990, according to the European Commission data .
• Dataon feedstockareno longeravailable,butwe know from historical data that feedstock consistently accounted for 60 per cent of total energy products, taking all sources of energy into account . This means that most of the energy used by the chemicals industry as feedstock is stored in products and can still be reused via recycling .
• Regarding other raw materials, the chemicalsindustry also uses a wide variety of natural and processed starting materials, including metals, minerals and agricultural raw materials such as sugar, starch and fats .
Sources: Eurostat and Cefic Chemdata International
Mill
ions
of t
onne
s of
oil
equi
vale
nt
45
50
55
60
65
70
75
20092008200720062005200420032002200120001999199819971996199519941993199219911990
Source: Eurostat and Cefic Chemdata International
69.2
62.0
59.258.3 58.2
60.359.4
56.455.5
57.4 58.0 57.758.8
56.0 56.4
53.6
55.854.4
50.4
59.0
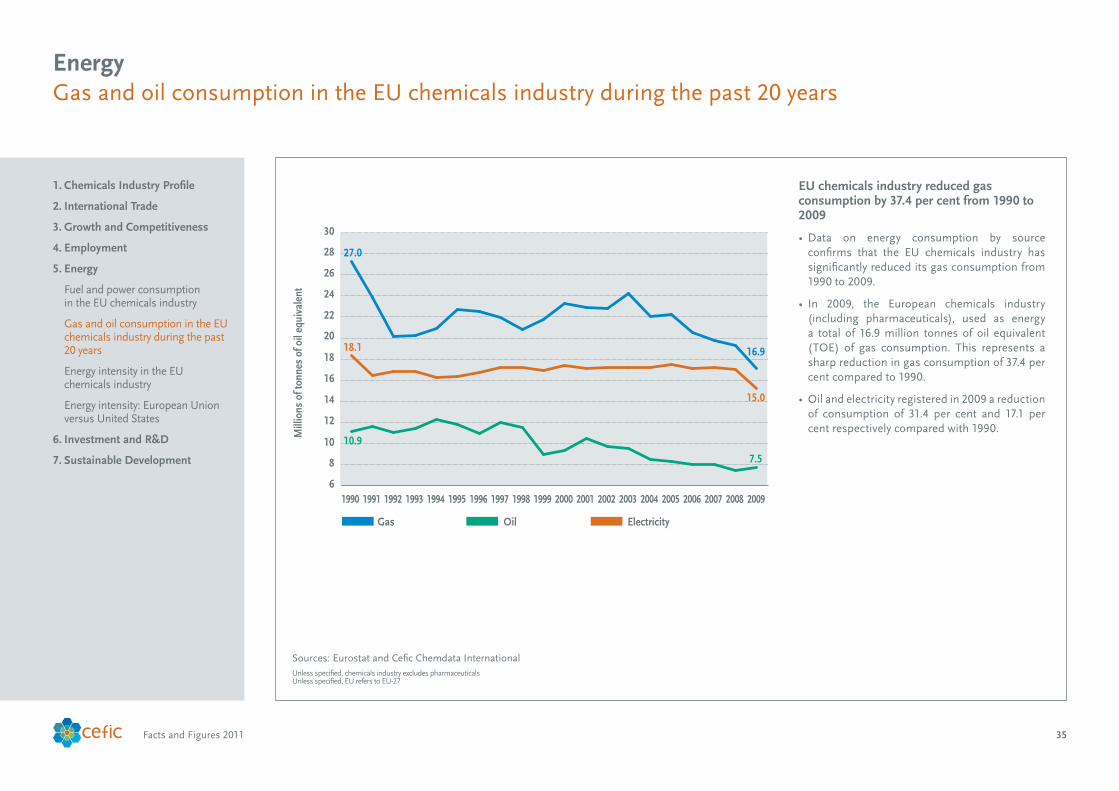
35Facts and Figures 2011
Unless specified, chemicals industry excludes pharmaceuticalsUnless specified, EU refers to EU-27
Gas and oil consumption in the EU chemicals industry during the past 20 yearsEnergy
1. Chemicals Industry Profile
2. International Trade
3. Growth and Competitiveness
4. Employment
5. Energy
Fuel and power consumption in the EU chemicals industry
Gas and oil consumption in the EU chemicals industry during the past 20 years
Energy intensity in the EU chemicals industry
Energy intensity: European Union versus United States
6. Investment and R&D
7. Sustainable Development
EU chemicals industry reduced gas consumption by 37.4 per cent from 1990 to 2009
• Data on energy consumption by sourceconfirms that the EU chemicals industry has significantly reduced its gas consumption from 1990 to 2009 .
• In 2009, the European chemicals industry(including pharmaceuticals), used as energy a total of 16 .9 million tonnes of oil equivalent (TOE) of gas consumption. This represents asharp reduction in gas consumption of 37 .4 per cent compared to 1990 .
• Oilandelectricityregisteredin2009areductionof consumption of 31 .4 per cent and 17 .1 per cent respectively compared with 1990 .
Sources: Eurostat and Cefic Chemdata International
6
8
10
12
14
16
18
20
22
24
26
28
30
20092008200720062005200420032002200120001999199819971996199519941993199219911990
Gas Oil Electricity
Mill
ions
of t
onne
s of
oil
equi
vale
nt
27.0
18.1
10.9
7.5
15.0
16.9
Source: Eurostat and Cefic Chemdata International

36Facts and Figures 2011
Unless specified, chemicals industry excludes pharmaceuticalsUnless specified, EU refers to EU-27
Energy intensity* in the EU chemicals industryEnergy
1. Chemicals Industry Profile
2. International Trade
3. Growth and Competitiveness
4. Employment
5. Energy
Fuel and power consumption in the EU chemicals industry
Gas and oil consumption in the EU chemicals industry during the past 20 years
Energy intensity in the EU chemicals industry
Energy intensity: European Union versus United States
6. Investment and R&D
7. Sustainable Development
The EU chemicals industry has reduced energy intensity by 54 per cent since 1990
• For many years, the EU chemicals industry,including pharmaceuticals, has made strenuous efforts to improve energy efficiency, reducing its fuel and power energy consumption per unit of production .
• In 2009, energy intensity, or the energy consumption per unit of production in the chem-icals industry, including pharmaceuticals, was 54 per cent lower than in 1990 .
• Energy efficiency is subject to decreasing returns: the higher the level of energy efficiency attained, the more difficult it becomes to make further improvements . During the previous 20 years from 1990 to 2009, however, the chemicals industry has succeeded in increasing continuously its output and at the same time keeping its energy input constant, and conse-quently lowered its energy intensity significantly by 4 .1 per cent per year on average .
Sources: Eurostat and Cefic Chemdata International* Energy intensity is measured by energy input per unit of chemicals production (including pharmaceuticals)
40
50
60
70
80
90
100
110
120
130
140
150
160
170
180
200920062002199819941990
Energy consumption Chemicals production Energy intensity*
Ind
ex (1
990
=10
0)
Average growth rate p.a. 1990-2009EU chemicals production 2.5%EU energy consumption -1.7%EU energy intensity* -4.1%
* Energy intensity is measured by energy input per unit of chemicals production (including pharmaceuticals)Source: Eurostat and Cefic Chemdata International
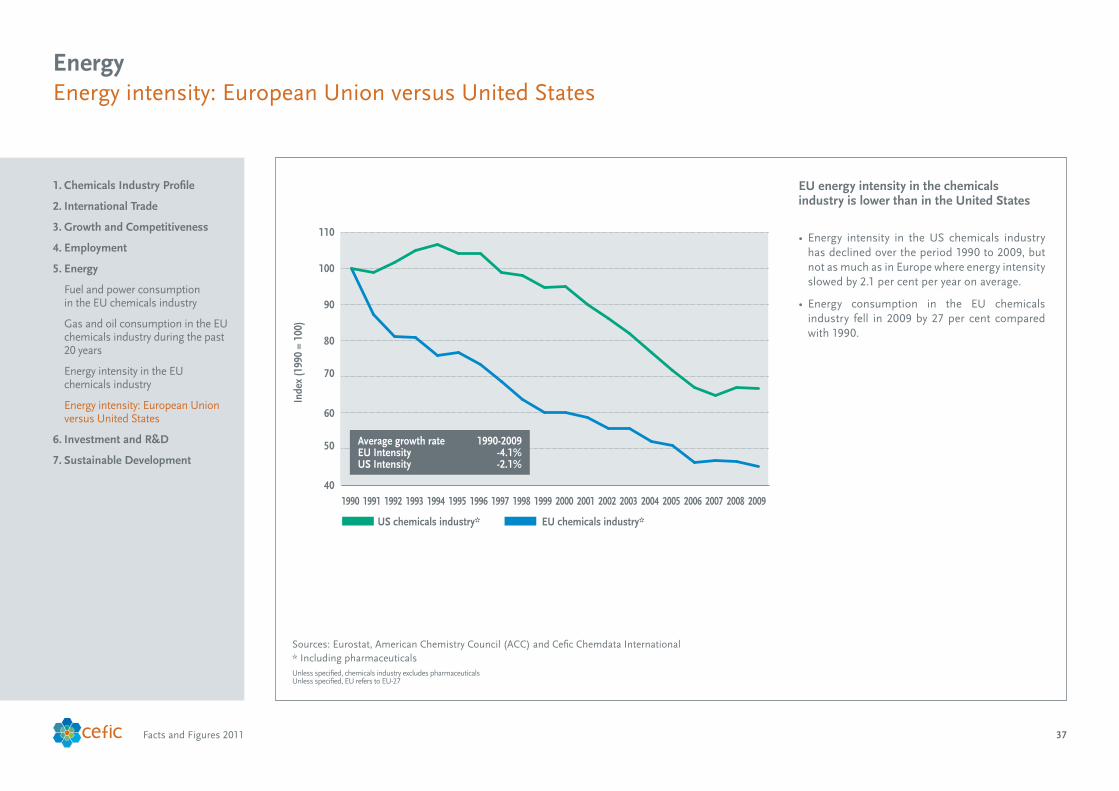
37Facts and Figures 2011
Unless specified, chemicals industry excludes pharmaceuticalsUnless specified, EU refers to EU-27
Energy intensity: European Union versus United StatesEnergy
1. Chemicals Industry Profile
2. International Trade
3. Growth and Competitiveness
4. Employment
5. Energy
Fuel and power consumption in the EU chemicals industry
Gas and oil consumption in the EU chemicals industry during the past 20 years
Energy intensity in the EU chemicals industry
Energy intensity: European Union versus United States
6. Investment and R&D
7. Sustainable Development
EU energy intensity in the chemicals industry is lower than in the United States
• Energy intensity in the US chemicals industryhas declined over the period 1990 to 2009, but not as much as in Europe where energy intensity slowed by 2 .1 per cent per year on average .
• Energy consumption in the EU chemicalsindustry fell in 2009 by 27 per cent compared with 1990 .
Sources: Eurostat, American Chemistry Council (ACC) and Cefic Chemdata International* Including pharmaceuticals
40
50
60
70
80
90
100
110
20092008200720062005200420032002200120001999199819971996199519941993199219911990
US chemicals industry* EU chemicals industry*
Inde
x (1
990
= 10
0)
Average growth rate 1990-2009EU Intensity -4.1%US Intensity -2.1%
Source: Eurostat, American Chemistry Council (ACC) and Cefic Chemdata International * Including pharmaceuticals
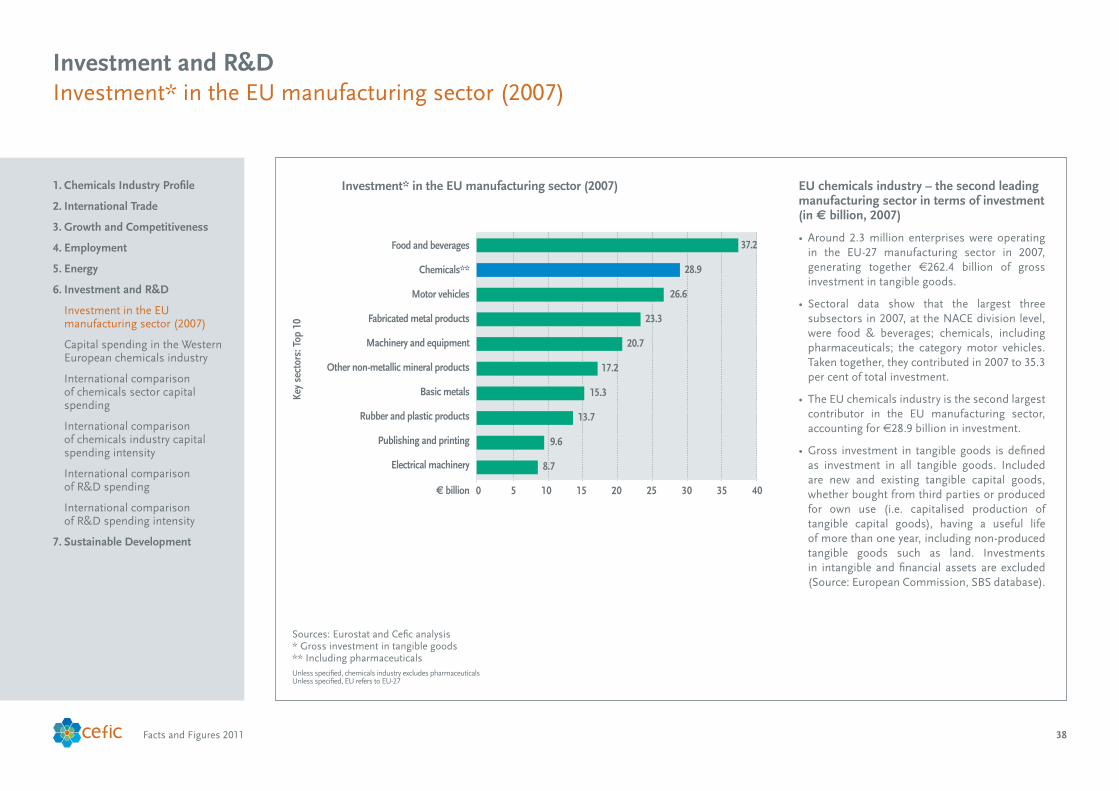
38Facts and Figures 2011
Unless specified, chemicals industry excludes pharmaceuticalsUnless specified, EU refers to EU-27
Investment* in the EU manufacturing sector (2007)Investment and R&D
1. Chemicals Industry Profile
2. International Trade
3. Growth and Competitiveness
4. Employment
5. Energy
6. Investment and R&D
Investment in the EU manufacturing sector (2007)
Capital spending in the Western European chemicals industry
International comparison of chemicals sector capital spending
International comparison of chemicals industry capital spending intensity
International comparison of R&D spending
International comparison of R&D spending intensity
7. Sustainable Development
EU chemicals industry – the second leading manufacturing sector in terms of investment (in € billion, 2007)
• Around 2.3 million enterprises were operatingin the EU-27 manufacturing sector in 2007, generating together €262 .4 billion of gross investment in tangible goods .
• Sectoral data show that the largest threesubsectors in 2007, at the NACE division level, were food & beverages; chemicals, including pharmaceuticals; the category motor vehicles . Taken together, they contributed in 2007 to 35 .3 per cent of total investment .
• TheEUchemicalsindustryisthesecondlargestcontributor in the EU manufacturing sector, accounting for €28 .9 billion in investment .
• Gross investment in tangiblegoods isdefinedas investment in all tangible goods . Included are new and existing tangible capital goods, whether bought from third parties or produced for own use (i .e . capitalised production of tangible capital goods), having a useful life of more than one year, including non-produced tangible goods such as land . Investments in intangible and financial assets are excluded (Source: European Commission, SBS database) .
Sources: Eurostat and Cefic analysis* Gross investment in tangible goods** Including pharmaceuticals
Investment* in the EU manufacturing sector (2007)
* Gross investment in tangible goods** Including pharmaceuticalsSource: Eurostat and Cefic Analysis
Key
sect
ors:
Top
10
Food and beverages
Chemicals**
Motor vehicles
Fabricated metal products
Machinery and equipment
Other non-metallic mineral products
Basic metals
Rubber and plastic products
Publishing and printing
Electrical machinery
€ billion
28.9
37.2
26.6
23.3
20.7
17.2
15.3
13.7
9.6
8.7
0 5 10 15 20 25 30 35 40
Investment* in the EU manufacturing sector (2007)
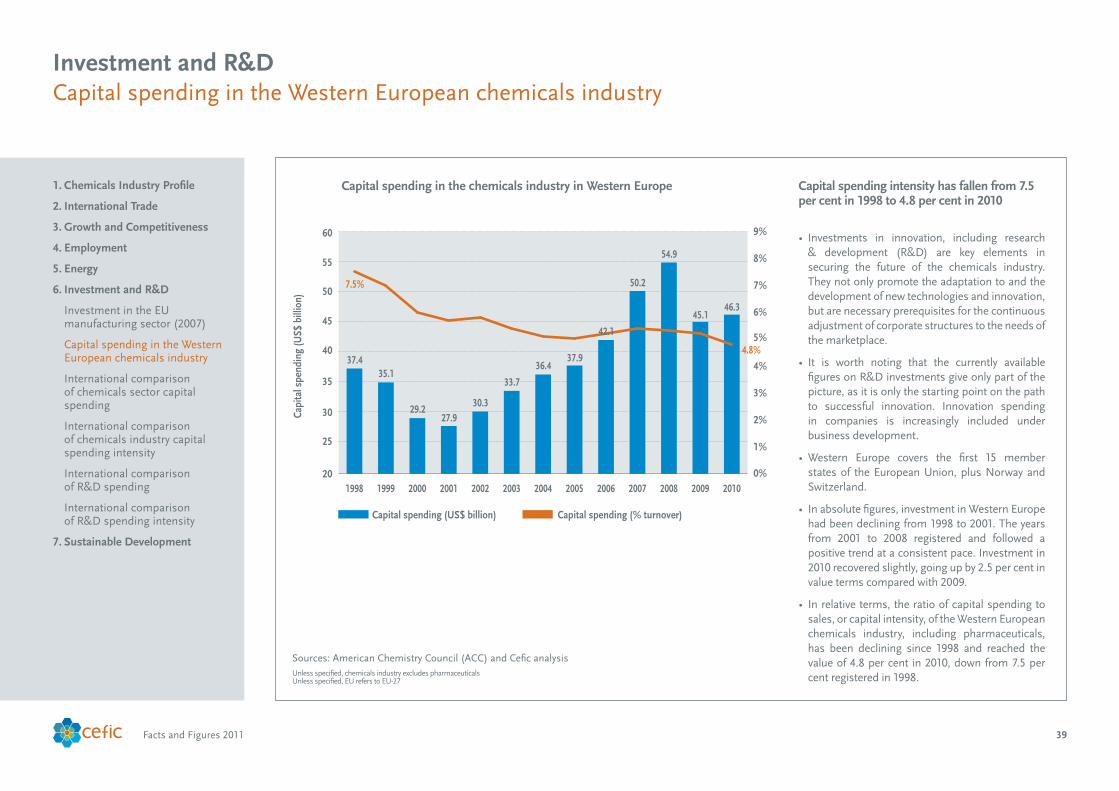
39Facts and Figures 2011
Unless specified, chemicals industry excludes pharmaceuticalsUnless specified, EU refers to EU-27
Capital spending in the Western European chemicals industryInvestment and R&D
1. Chemicals Industry Profile
2. International Trade
3. Growth and Competitiveness
4. Employment
5. Energy
6. Investment and R&D
Investment in the EU manufacturing sector (2007)
Capital spending in the Western European chemicals industry
International comparison of chemicals sector capital spending
International comparison of chemicals industry capital spending intensity
International comparison of R&D spending
International comparison of R&D spending intensity
7. Sustainable Development
Capital spending intensity has fallen from 7.5 per cent in 1998 to 4.8 per cent in 2010
• Investments in innovation, including research& development (R&D) are key elements in securing the future of the chemicals industry . They not only promote the adaptation to and the development of new technologies and innovation, but are necessary prerequisites for the continuous adjustment of corporate structures to the needs of the marketplace .
• It is worth noting that the currently availablefigures on R&D investments give only part of the picture, as it is only the starting point on the path to successful innovation . Innovation spending in companies is increasingly included under business development .
• Western Europe covers the first 15 memberstates of the European Union, plus Norway and Switzerland .
• Inabsolutefigures,investmentinWesternEuropehad been declining from 1998 to 2001 . The years from 2001 to 2008 registered and followed a positive trend at a consistent pace . Investment in 2010 recovered slightly, going up by 2 .5 per cent in value terms compared with 2009 .
• Inrelativeterms,theratioofcapitalspendingtosales, or capital intensity, of the Western European chemicals industry, including pharmaceuticals, has been declining since 1998 and reached the value of 4 .8 per cent in 2010, down from 7 .5 per cent registered in 1998 .
Sources: American Chemistry Council (ACC) and Cefic analysis
Capi
tal s
pend
ing
(US$
bill
ion)
20
25
30
35
40
45
50
55
60
2010200920082007200620052004200320022001200019991998
Source: American Chemistry Council (ACC) and Cefic Analysis
Capital spending in the chemicals industry in Western Europe
0%
1%
2%
3%
4%
5%
6%
7%
8%
9%
Capital spending (US$ billion) Capital spending (% turnover)
37.4
7.5%
35.1
29.227.9
33.7
36.437.9
42.1
50.2
54.9
45.146.3
4.8%
30.3
Capital spending in the chemicals industry in Western Europe

40Facts and Figures 2011
Unless specified, chemicals industry excludes pharmaceuticalsUnless specified, EU refers to EU-27
International comparison of chemicals sector* capital spendingInvestment and R&D
1. Chemicals Industry Profile
2. International Trade
3. Growth and Competitiveness
4. Employment
5. Energy
6. Investment and R&D
Investment in the EU manufacturing sector (2007)
Capital spending in the Western European chemicals industry
International comparison of chemicals sector capital spending
International comparison of chemicals industry capital spending intensity
International comparison of R&D spending
International comparison of R&D spending intensity
7. Sustainable Development
China and the rest of Asia-Pacific attract the bulk of chemicals investment
• Capital spending in the chemicals industryin Western Europe reached a modest level of US$46 .3 billion in 2010 . It represents about 10 per cent of world capital spending in value terms, or US$464 .3 billion .
• Comparing 2010 to 2000, the contribution ofWestern Europe to world chemicals spending in value terms declined dramatically by 12 .2 percentage points, from 22 .2 per cent in 2000 to about 10 per cent in 2010 .
• The totalvalueofcapitalspending inWesternEurope has been growing continuously since 2000, but overall world chemicals capital spending has grown at an even faster clip . In value terms, world chemicals spending increased by 2 .5 times in 2010 compared with 2000 .
• ChinaandtherestoftheAsia-Pacificregionarethe clear leader in terms of capital spending, accounting for 72 .8 per cent of world chemicals capital spending in 2010, up from 38 .6 per cent in 2000 . China and the rest of Asia-Pacific attract the bulk of chemicals investment, considered a key factor for overall competitiveness .
Source: American Chemistry Councel (ACC)* Excluding Japan
Capi
tal s
pend
ing
(US$
bill
ion)
China and rest of Asia Pacific* Japan Central & Eastern Europe
Western Europe North America
Source: American Chemistry Councel (ACC)* Excluding Japan
0
50
100
150
200
250
300
350
400
450
500
201020082006200420022000

41Facts and Figures 2011
Unless specified, chemicals industry excludes pharmaceuticalsUnless specified, EU refers to EU-27
International comparison of chemicals industry* capital spending intensityInvestment and R&D
1. Chemicals Industry Profile
2. International Trade
3. Growth and Competitiveness
4. Employment
5. Energy
6. Investment and R&D
Investment in the EU manufacturing sector (2007)
Capital spending in the Western European chemicals industry
International comparison of chemicals sector capital spending
International comparison of chemicals industry capital spending intensity
International comparison of R&D spending
International comparison of R&D spending intensity
7. Sustainable Development
Capital intensity in China and the rest of Asia-Pacific far higher than in rest of the world
• In absolute figures, capital spending in theworld chemicals industry rose from US$131 .7 billion in 2000 to US$464 .3 billion in 2010 . Capital intensity, or the ratio of capital spending to sales, also registered a significant increase from 7 .6 per cent in 2000 to 11 .3 per cent in 2010 .
• Capital intensity inChinaandtherestofAsia-Pacific contributed greatly to positive changes on a world basis . Capital intensity in China and the rest of Asia-Pacific increased from 18 .1 per cent in 2000 to 23 .4 per cent in 2010 .
• Capital intensity inChinaandtherestofAsia-Pacific is far higher than in the rest of the world . Western Europe and the North America are lagging behind, registering a constant decline during the past 10 years .
Source: American Chemistry Councel (ACC)* Including pharmaceuticals** Excluding Japan
0
5
10
15
20
25
30
20102009200820072006200520042003200220012000
Western Europe China and other Asia Pacific** North America
Capi
tal s
pend
ing
(% o
f sal
es)
18.1%
6.0%
5.6%3.9%
4.8%
23.4%
Capital spending in the chemicals industry* by region
* Including pharmaceuticals** Excluding JapanSource: American Chemistry Council (ACC)
Capital spending in the chemicals industry* by region

42Facts and Figures 2011
Unless specified, chemicals industry excludes pharmaceuticalsUnless specified, EU refers to EU-27
International comparison of R&D spendingInvestment and R&D
1. Chemicals Industry Profile
2. International Trade
3. Growth and Competitiveness
4. Employment
5. Energy
6. Investment and R&D
Investment in the EU manufacturing sector (2007)
Capital spending in the Western European chemicals industry
International comparison of chemicals sector capital spending
International comparison of chemicals industry capital spending intensity
International comparison of R&D spending
International comparison of R&D spending intensity
7. Sustainable Development
R&D spending in the European Union and United States higher than in Japan
• With€8 .1 billion in 2008, R&D spending in the chemicals industry in the European Union was significant and represented about 4 .2 per cent of added value in value terms .
• In absolute figures, R&D spending in thechemicals industry was valued at an average annual level of €7 .8 billion in the European Union during the period from 1998 to 2008 . In the United States, the average value of R&D spending was €8 .8 billion during the same period . The same variable amounted to €6 .7 billion in the Japanese chemicals industry for a comparable 10-year period .
Source: Cefic Chemdata International
US JapanEU
R&D
spe
ndin
g (€
bill
ion)
0
1
2
3
4
5
6
7
8
9
10
11
12
20082007200620052004200320022001200019991998
7.6 7.88.1 7.9 7.7 7.5 7.7 7.5
8.2 8.1 8.1
9.1 9.0
10.910.4
9.6
8.07.5
8.18.5
7.48.0
6.5
7.4
8.8
8.07.4
6.86.2 6.4
6.0
5.15.6
Source: Cefic Chemdata International

43Facts and Figures 2011
Unless specified, chemicals industry excludes pharmaceuticalsUnless specified, EU refers to EU-27
International comparison of R&D spending intensityInvestment and R&D
1. Chemicals Industry Profile
2. International Trade
3. Growth and Competitiveness
4. Employment
5. Energy
6. Investment and R&D
Investment in the EU manufacturing sector (2007)
Capital spending in the Western European chemicals industry
International comparison of chemicals sector capital spending
International comparison of chemicals industry capital spending intensity
International comparison of R&D spending
International comparison of R&D spending intensity
7. Sustainable Development
R&D intensity in the European Union below US and Japanese levels
• Thehighvalue-addedproductsofthechemicalsindustry continuously open up new fields of application, paving the way to progress and innovation in other industries . Typical examples are health, food, consumer goods, aerospace and car manufacturing, telecommunications, electrical engineering and electronics . Wide variations in research and development (R&D) efforts are observed across the chemicals industry . Turning R&D into innovation is becoming increasingly important in relation to the competitiveness of the region .
• Analysing the ratio of R&D spending to salesof the chemicals industry, it can be observed that during the 18-year time period from 1991 to 2008, the R&D intensity level in the European Union has been far below that of Japan and slightly lower than in the United States .
• AnnualEUR&Dintensitywasequaltotwopercent on average during the years 1991 to 2008, while the same ratio was equal to 2 .8 per cent in the United States and to 5 .1 per cent in Japan .
Source: Cefic Chemdata International
1
2
3
4
5
6
200820072006200520042003200220012000199919981997199619951994199319921991
Source: Cefic Chemdata International
EU US Japan
R&D
exp
endi
ture
(% o
f sal
es)
2.8%
5.2%
3.6%
2.1%
4.1%
1.5%

44Facts and Figures 2011
Unless specified, chemicals industry excludes pharmaceuticalsUnless specified, EU refers to EU-27
Total greenhouse gas emissions in the EU chemicals industrySustainable Development
1. Chemicals Industry Profile
2. International Trade
3. Growth and Competitiveness
4. Employment
5. Energy
6. Investment and R&D
7. Sustainable Development
Total greenhouse gas emissions in the EU chemicals industry
Greenhouse gas emissions, energy consumption and production in the EU chemicals industry
Greenhouse gas emissions per unit of energy consumption and per unit of production in the EU chemicals industry
Greenhouse gas emissions per production: European Union versus United States
Safety at work – EU chemicals sector incidence rate of accidents (more than three days lost)
Incidence rate of accidents at work (more than three days lost)
Safety at work – incidence rate of accidents at work in the EU manufacturing sector (2005)
Total greenhouse gas emissions from the EU chemicals industry have fallen by 49 per cent since 1990
• According to the European EnvironmentalAgency (EEA), the European chemicals industry, including pharmaceuticals, emitted in 2009 a totalof147.4milliontonnesofCO
2 equivalent,
down from 286 .8 million tonnes in 1990 .
• Long-term data show that the EU chemicalsindustry, including pharmaceuticals, has sig-nificantly reduced its greenhouse gas (GHG) emissions on a consistent basis from 1990 to 2009 .
• Total greenhouse gas emissions in the EUchemicals industry have fallen by 49 per cent since 1990 . This historic trend clearly represents successful efforts made by the chemicals industry to reduce emissions .
Sources: European Environment Agency (EEA) and Cefic Chemdata International
Mill
ions
of t
onne
s (C
O2 e
quiv
alen
t)
140
160
180
200
220
240
260
280
300
20092008200720062005200420032002200120001999199819971996199519941993199219911990
Source: European Environment Agency (EEA) and Cefic Chemdata International
287278
270262
273
288 287
252
214 212202
187196 197 196
179 178
166
147
283
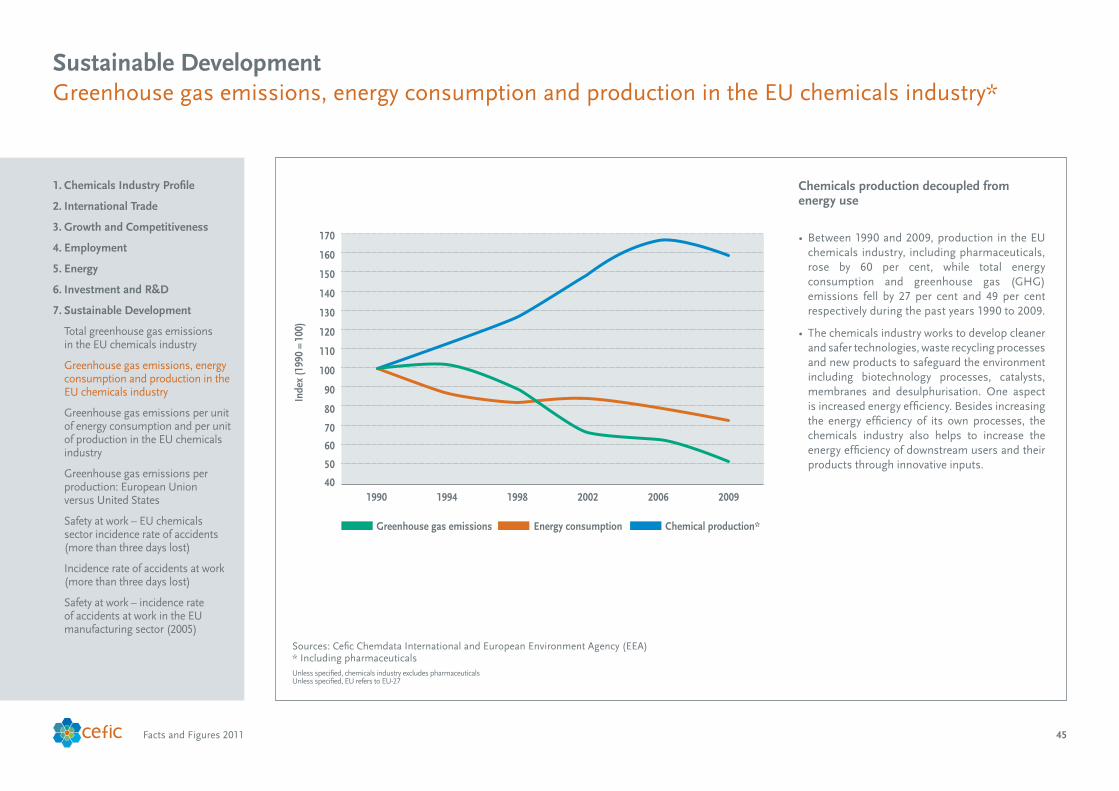
45Facts and Figures 2011
Unless specified, chemicals industry excludes pharmaceuticalsUnless specified, EU refers to EU-27
Greenhouse gas emissions, energy consumption and production in the EU chemicals industry*Sustainable Development
1. Chemicals Industry Profile
2. International Trade
3. Growth and Competitiveness
4. Employment
5. Energy
6. Investment and R&D
7. Sustainable Development
Total greenhouse gas emissions in the EU chemicals industry
Greenhouse gas emissions, energy consumption and production in the EU chemicals industry
Greenhouse gas emissions per unit of energy consumption and per unit of production in the EU chemicals industry
Greenhouse gas emissions per production: European Union versus United States
Safety at work – EU chemicals sector incidence rate of accidents (more than three days lost)
Incidence rate of accidents at work (more than three days lost)
Safety at work – incidence rate of accidents at work in the EU manufacturing sector (2005)
Chemicals production decoupled from energy use
• Between1990and2009,productionintheEUchemicals industry, including pharmaceuticals, rose by 60 per cent, while total energy consumption and greenhouse gas (GHG) emissions fell by 27 per cent and 49 per cent respectively during the past years 1990 to 2009 .
• Thechemicalsindustryworkstodevelopcleanerand safer technologies, waste recycling processes and new products to safeguard the environment including biotechnology processes, catalysts, membranes and desulphurisation. One aspectis increased energy efficiency . Besides increasing the energy efficiency of its own processes, the chemicals industry also helps to increase the energy efficiency of downstream users and their products through innovative inputs .
Sources: Cefic Chemdata International and European Environment Agency (EEA) * Including pharmaceuticals
40
50
60
70
80
90
100
110
120
130
140
150
160
170
200920062002199819941990
Greenhouse gas emissions Energy consumption Chemical production*
Inde
x (1
990
=10
0)
* Including pharmaceuticalsSource: Cefic Chemdata International and European Environment Agency (EEA)

46Facts and Figures 2011
Unless specified, chemicals industry excludes pharmaceuticalsUnless specified, EU refers to EU-27
Greenhouse gas emissions per unit of energy consumption and per unit of production in the EU chemicals industry*
Sustainable Development
1. Chemicals Industry Profile
2. International Trade
3. Growth and Competitiveness
4. Employment
5. Energy
6. Investment and R&D
7. Sustainable Development
Total greenhouse gas emissions in the EU chemicals industry
Greenhouse gas emissions, energy consumption and production in the EU chemicals industry
Greenhouse gas emissions per unit of energy consumption and per unit of production in the EU chemicals industry
Greenhouse gas emissions per production: European Union versus United States
Safety at work – EU chemicals sector incidence rate of accidents (more than three days lost)
Incidence rate of accidents at work (more than three days lost)
Safety at work – incidence rate of accidents at work in the EU manufacturing sector (2005)
Greenhouse gas intensity has fallen by 68 per cent since 1990
• Greenhouse gas (GHG) emissions per unitof energy consumption have been reduced by 29 .4 per cent and GHG emissions per unit of production, or GHG intensity, have fallen by 67 .9 per cent since 1990 . These decreases show the enormous effort by the chemicals industry to minimise the environmental impact of its production .
Sources: Cefic Chemdata International and European Environment Agency (EEA) * Including pharmaceuticals
25
35
45
55
65
75
85
95
105
115
200920062002199819941990
Greenhouse gas emissions per unit of energy consumption
GHG intensity (Greehouse gas emissions per unit of production)
Inde
x (1
990
=10
0)
-29%
-68%
Source: Cefic Chemdata International and European Environment Agency (EEA)

47Facts and Figures 2011
Unless specified, chemicals industry excludes pharmaceuticalsUnless specified, EU refers to EU-27
Greenhouse gas emissions per production*: European Union versus United StatesSustainable Development
1. Chemicals Industry Profile
2. International Trade
3. Growth and Competitiveness
4. Employment
5. Energy
6. Investment and R&D
7. Sustainable Development
Total greenhouse gas emissions in the EU chemicals industry
Greenhouse gas emissions, energy consumption and production in the EU chemicals industry
Greenhouse gas emissions per unit of energy consumption and per unit of production in the EU chemicals industry
Greenhouse gas emissions per production: European Union versus United States
Safety at work – EU chemicals sector incidence rate of accidents (more than three days lost)
Incidence rate of accidents at work (more than three days lost)
Safety at work – incidence rate of accidents at work in the EU manufacturing sector (2005)
Greenhouse gas intensity is higher in the European Union than in the United States
• IncomparisontotheUSchemicalsindustry,theEU chemicals sector has reduced its greenhouse gas (GHG) emission intensity, calculated as emissions per unit of production, by a relatively greater amount and is comparably more GHG emission efficient .
• The US chemicals industry has decreased itsemission intensity by 39 per cent since 1990, whereas the EU chemicals industry has cut its GHG emissions by 67 .9 per cent .
Sources: Eurostat, European Environment Agency (EEA) and Cefic Chemdata International* Including pharmaceuticals
30
40
50
60
70
80
90
100
110
20092008200720062005200420032002200120001999199819971996199519941993199219911990
EU chemicals industry* GHG intensity US chemicals industry* GHG intensity
Inde
x (1
990
= 10
0)
Average growth rate 1990-2009EU greenhouse gas intensity -5.8%US greenhouse gas intensity -2.6%
Source: Eurostat, European Environment Agency (EEA) and Cefic Chemdata International * Including pharmaceuticals

48Facts and Figures 2011
Unless specified, chemicals industry excludes pharmaceuticalsUnless specified, EU refers to EU-27
Safety at work – EU chemicals sector* incidence rate of accidents (more than three days lost)Sustainable Development
1. Chemicals Industry Profile
2. International Trade
3. Growth and Competitiveness
4. Employment
5. Energy
6. Investment and R&D
7. Sustainable Development
Total greenhouse gas emissions in the EU chemicals industry
Greenhouse gas emissions, energy consumption and production in the EU chemicals industry
Greenhouse gas emissions per unit of energy consumption and per unit of production in the EU chemicals industry
Greenhouse gas emissions per production: European Union versus United States
Safety at work – EU chemicals sector incidence rate of accidents (more than three days lost)
Incidence rate of accidents at work (more than three days lost)
Safety at work – incidence rate of accidents at work in the EU manufacturing sector (2005)
Incidence rate dropped by more than one third from 1995 to 2005
• The incidence rate of accidents at work hasfallen in the EU-15 chemicals industry from 2 .43 in 1995 to 1 .53 in 2005 (latest data available) . Safety at work has been considerably improved from 1995 to 2005 .
• The long-term data on safety at work showclearly that the EU-15 chemicals industry, including pharmaceuticals, has constantly reduced the number of accidents at work during the years 1990 to 2009 .
• An accident at work is “a discrete occurrencein the course of work which leads to physical or mental harm” . The data include only accidents involving more than three calendar days of absence from work, also called ‘serious accidents’. The incidence rate of seriousaccidents at work is the number of people involved in accidents at work with more than three days’ absence per 100,000 people inemployment (Source: European Commission) .
• The harmonised data on accidents at workare collected by the EU Commission in the framework of the European Statistics on Accidents at Work, or ESAW, on the basis of a methodology developed in 1990 .
Sources: Eurostat (health_safety_work) database and Cefic analysis* Including pharmaceuticals
Inci
denc
e ra
te o
f acc
iden
ts a
t wor
k pe
r 100
em
ploy
ees
1.00
1.25
1.50
1.75
2.00
2.25
2.50
2.75
20052004200320022001200019991998199719961995
Source: Eurostat (health_safety_work) database and Cefic Analysis* Including pharmaceuticals
EU chemicals*: Incidence rate of accidents at work (more than 3 days lost)
2.43 2.40
2.202.13
1.991.93
1.591.69
1.451.53
2.18

49Facts and Figures 2011
Unless specified, chemicals industry excludes pharmaceuticalsUnless specified, EU refers to EU-27
Incidence rate of accidents at work (more than three days lost)Sustainable Development
1. Chemicals Industry Profile
2. International Trade
3. Growth and Competitiveness
4. Employment
5. Energy
6. Investment and R&D
7. Sustainable Development
Total greenhouse gas emissions in the EU chemicals industry
Greenhouse gas emissions, energy consumption and production in the EU chemicals industry
Greenhouse gas emissions per unit of energy consumption and per unit of production in the EU chemicals industry
Greenhouse gas emissions per production: European Union versus United States
Safety at work – EU chemicals sector incidence rate of accidents (more than three days lost)
Incidence rate of accidents at work (more than three days lost)
Safety at work – incidence rate of accidents at work in the EU manufacturing sector (2005)
Chemicals sector incidence rate of accidents two times lower than manufacturing average
• Between 1995 and 2005, the incidence rateof accidents at work in the EU-15 chemicals industry, including pharmaceuticals, decreased by 37 per cent from 2 .4 in 1995 to 1 .5 in 2005 .
• The EU-15 manufacturing sector performed less well compared to the EU-15 chemicals industry in terms of incidence rate of accidents at work, declining 29 per cent from 5 .0 in 1995 to 3 .5 in 2005 .
Sources: Eurostat (health_safety_work) database and Cefic analysis* Including pharmaceuticals
1.0
1.5
2.0
2.5
3.0
3.5
4.0
4.5
5.0
5.5
20052004200320022001200019991998199719961995
EU-15 manufacturing EU-15 chemicals*
Inci
denc
e ra
te o
f acc
iden
ts a
t wor
k pe
r 100
em
ploy
ee
Average rate 1995-2005Chemicals 2.0Manufacturing 4.2
Source: Eurostat (health_safety_work) database and Cefic Analysis* Including pharmaceuticals
Incidence rate of accidents at work (more than 3 days lost)
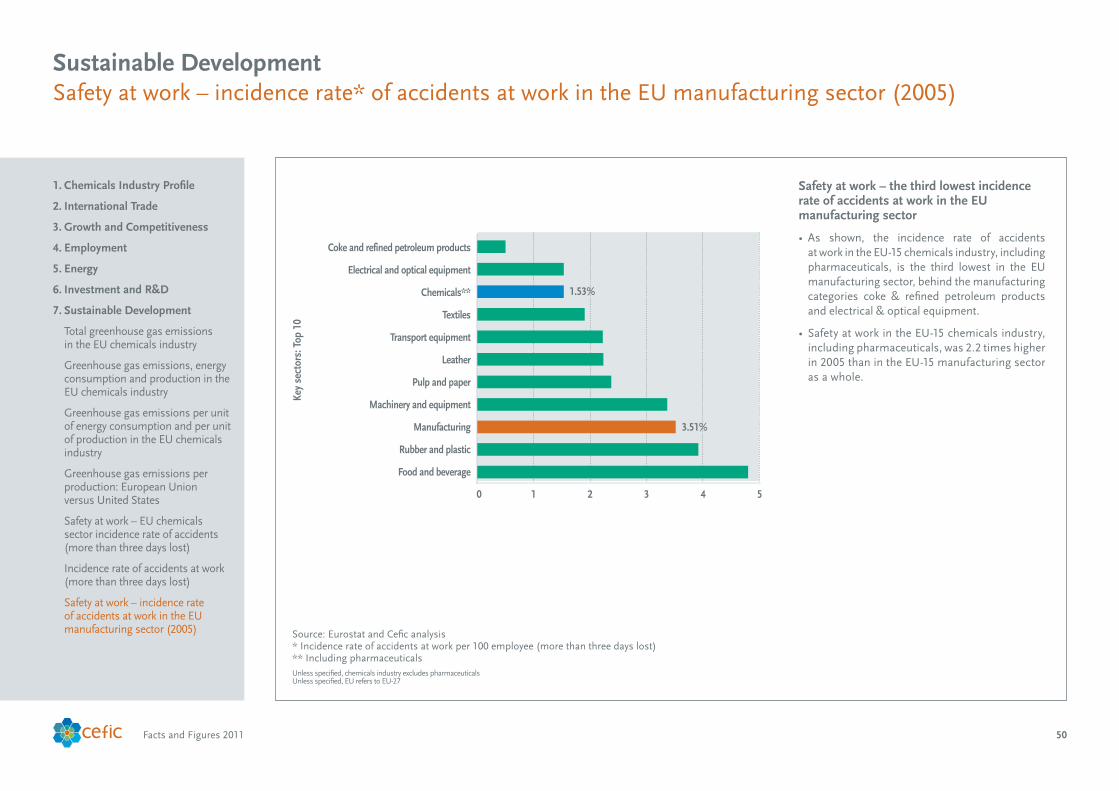
50Facts and Figures 2011
Unless specified, chemicals industry excludes pharmaceuticalsUnless specified, EU refers to EU-27
Safety at work – incidence rate* of accidents at work in the EU manufacturing sector (2005)Sustainable Development
1. Chemicals Industry Profile
2. International Trade
3. Growth and Competitiveness
4. Employment
5. Energy
6. Investment and R&D
7. Sustainable Development
Total greenhouse gas emissions in the EU chemicals industry
Greenhouse gas emissions, energy consumption and production in the EU chemicals industry
Greenhouse gas emissions per unit of energy consumption and per unit of production in the EU chemicals industry
Greenhouse gas emissions per production: European Union versus United States
Safety at work – EU chemicals sector incidence rate of accidents (more than three days lost)
Incidence rate of accidents at work (more than three days lost)
Safety at work – incidence rate of accidents at work in the EU manufacturing sector (2005)
Safety at work – the third lowest incidence rate of accidents at work in the EU manufacturing sector
• As shown, the incidence rate of accidents at work in the EU-15 chemicals industry, including pharmaceuticals, is the third lowest in the EU manufacturing sector, behind the manufacturing categories coke & refined petroleum products and electrical & optical equipment .
• SafetyatworkintheEU-15chemicalsindustry,including pharmaceuticals, was 2 .2 times higher in 2005 than in the EU-15 manufacturing sector as a whole .
Source: Eurostat and Cefic analysis* Incidence rate of accidents at work per 100 employee (more than three days lost)** Including pharmaceuticals
Key
sect
ors:
Top
10
Coke and refined petroleum products
Electrical and optical equipment
Chemicals**
Textiles
Transport equipment
Leather
Pulp and paper
Machinery and equipment
Manufacturing
Rubber and plastic
Food and beverage
0 1 2 3 4 5
Source: Eurostat and Cefic Analysis
* Incidence rate of accidents at work per 100 employee (more than three days lost)** Including pharmaceuticals
3.51%
1.53%

Cefic - The European Chemical Industry Council
Chemistry making a world of difference
© Cefic
Cefic is the Brussels-based organisation representing national chemical federations and chemical companies in Europe . Cefic represents, directly or indirectly, around 29,000 large, medium and small companies in Europe, which employ about 1 .2 million people and account for 21 per cent of world chemicals production .
Cefic aisblAvenue E. Van Nieuwenhuyse 4B - 1160 BrusselsBelgiumTel: +32 2 676 72 11Fax: +32 2 676 73 [email protected] de
sign
: ww
w .la
ndm
arks
.be