factors that drive m-commerce in kenya and south...
TRANSCRIPT

Copyright UCT
Running Head: DRIVERS OF M-COMMERCE IN AFRICA 1
Factors that Drive M-commerce in Kenya and South Africa
A Research Report
Presented to
The Graduate School of Business
University of Cape Town
In partial fulfillment of the requirement for the degree of
Master of Business Administration
By
Kibe Kamau
December 2010
Supervisor: Dr. Steven Michael Burgess

Copyright UCT
DRIVERS OF M-COMMERCE IN AFRICA 2
Acknowledgements
First, I would first like to thank all of the survey participants. Their participation has helped
me learn about the critical concepts required for academic research. In addition, their
opinions have provided the statistics necessary for both this research, as well as future
research in the field of mobile commerce.
I would also like to thank Dr. Steven Michael Burgess for his knowledge, guidance and
inspiration. Without his time, guidance, and expertise, this thesis would not be possible.
I would also like to thank my family for encouragement support and prayer through this
journey. A special vote of thanks goes to my brother, Emmanuel Muhia, for assisting with all
the surveys in Kenya. Without this assistance I would not have been able to gather the
information required.
Finally, I would like to thank Michelle Nderu for her support during the toughest period of
this journey. She provided moral support and encouragement during the longest nights and
toughest exams.
I certify that the thesis is my own work and that all sources referred to are to be found in the
References Section:
Signed:
_______________________________
KIBE KAMAU

Copyright UCT
DRIVERS OF M-COMMERCE IN AFRICA 3
Table of Contents
List of Tables ............................................................................................................................ 5
List of Figures ........................................................................................................................... 5
Abstract ..................................................................................................................................... 6
Development of M-commerce ................................................................................................. 7
Adoption of M-commerce ...................................................................................................... 8
M-commerce in Africa ........................................................................................................... 9
Mobile Development in Kenya and South Africa ................................................................ 12
Kenya ............................................................................................................................... 12
South Africa. .................................................................................................................... 13
The Research Area ................................................................................................................. 14
Research Purpose and Question ........................................................................................... 14
Specific Objectives .............................................................................................................. 15
Research Limitations ........................................................................................................... 15
Research Assumptions ......................................................................................................... 16
Research Ethics .................................................................................................................... 16
Literature Review .................................................................................................................. 17
Defining M-commerce ......................................................................................................... 17
M-commerce Services ......................................................................................................... 20
M-commerce Business Model ............................................................................................. 21
The Technology Behind M-commerce ................................................................................ 22
M-commerce architecture ................................................................................................ 24
M-commerce value chain. ................................................................................................ 27
The Adoption of Innovative High Technology Consumer Products ................................... 28
The Technology Acceptance Model (TAM)........................................................................ 29
Theory of reasoned action (TRA). ................................................................................... 31
Diffusion of Innovations (DOI) ........................................................................................... 33
Mobile Marketing ................................................................................................................ 34
Research Hypotheses ........................................................................................................... 38
Summary of Literature Review ............................................................................................ 41
Research Methodology .......................................................................................................... 42
Research Approach and Strategy ......................................................................................... 42
Research Design................................................................................................................... 43
Data Collection Methods ..................................................................................................... 43
Participants ........................................................................................................................... 44
Research Instrument............................................................................................................. 44
Research Criteria and Validity ............................................................................................. 45
Data Analysis Methods ........................................................................................................ 45
Results ..................................................................................................................................... 46
Sample Characteristics ......................................................................................................... 46
Exposure to M-commerce Services ..................................................................................... 49
Measurement Validation ...................................................................................................... 50
Reliability ......................................................................................................................... 51
Validity: ........................................................................................................................... 52
The Measurement Model ..................................................................................................... 54
Testing the Structural Model ............................................................................................... 55

Copyright UCT
DRIVERS OF M-COMMERCE IN AFRICA 4
Structural Model Results...................................................................................................... 57
Summary of Data Analysis .................................................................................................. 59
Findings and Discussion ........................................................................................................ 59
Summary of the Study ......................................................................................................... 61
Conclusion ........................................................................................................................... 62
Implications for Practice ....................................................................................................... 63
Recommendations for Future Research .............................................................................. 65
Appendices .............................................................................................................................. 66
Appendix 1: Technology Readiness Index of African Countries ........................................ 66
Appendix 2: Model TAM Questionnaire ............................................................................. 67
Bibliography ........................................................................................................................... 72

Copyright UCT
DRIVERS OF M-COMMERCE IN AFRICA 5
List of Tables
Table 1 M-commerce Services ................................................................................................. 21
Table 2 Mobile Technology Generations ................................................................................. 24
Table 3 Customer Interaction Modes ...................................................................................... 27
Table 4 Participants ................................................................................................................. 47
Table 5 Provider Subscription ................................................................................................. 48
Table 6 Mobile Phone Use ....................................................................................................... 49
Table 7 Exposure to m-commerce............................................................................................ 50
Table 8 Composite Reliability .................................................................................................. 51
Table 9 Cronbach's Alpha ....................................................................................................... 52
Table 10 AVE with EU2 & EU3 .............................................................................................. 53
Table 11 AVE without EU2 & EU3 ......................................................................................... 53
Table 12 Measurement Model (Indicators) ............................................................................. 54
Table 13 Measurement Model ................................................................................................. 55
Table 14 Path Coefficients ....................................................................................................... 56
Table 15 Summary of Total Effects .......................................................................................... 58
Table 16 Indirect Effects .......................................................................................................... 58
List of Figures
Figure 1. The m-commerce architecture ................................................................................. 25
Figure 2. The m-commerce value chain .................................................................................. 28
Figure 3. Predicting Consumer Behaviour .............................................................................. 32
Figure 4. Proposed Structural Model....................................................................................... 39
Figure 5: Structural Model ...................................................................................................... 56

Copyright UCT
DRIVERS OF M-COMMERCE IN AFRICA 6
Abstract
M-commerce is the use of mobile phones to conduct commercial transactions. As a business
medium, it continues to grow and provides a unique platform for conducting commercial
transactions in the future. In the last decade, Africa has seen a phenomenal penetration of
mobile phones. With it has come the proliferation of additional services, key of which are m-
commerce related. This research explores how users in Kenya and South Africa are
influenced to adopt m-commerce. A quantitative approach was used to examine attitudes
towards m-commerce using a survey that comprised 234 respondents from Kenya and South
Africa. The Technology Acceptance Model (TAM) was employed to examine factors
affecting consumer attitudes toward this emerging mobile technology and applications.
Empirical data from regression analyses reflect perceived ease of use and perceived
usefulness influence attitude toward using m-commerce. It was also found that trust and
perceived usefulness have a significant effect on adoption behavior. These findings are
important for practitioners who continue to promote m-commerce as a business medium.
Keywords: mobile, m-commerce, mobile commerce, technology acceptance, diffusion of
innovation

Copyright UCT
DRIVERS OF M-COMMERCE IN AFRICA 7
Development of M-commerce
In 1999, Sonera of Finland was the first telecom operator to provide the much needed
wireless technology that enabled customers conduct commerce wirelessly (Raisinghani,
2001). This mode of commerce brought about a new technological buzzword known as
mobile commerce (m-commerce).
The first commercial transaction mediated by a mobile telephone took place in
Helsinki, Finland; whereby Coca-Cola vending machines accepted monetary payments from
cell phones through the use of text messaging technology (Miller, 2009). Since then, mobile
telephones have become widely adopted and technology that enables m-commerce has grown
and improved considerably. Nowadays mobile phones have applications that enable access
to a variety of services, such as text messaging, multimedia services, internet search, gaming,
monetary transactions, and chat services. All these services are offered commercially
through various types of mobile phone applications.
In addition, according to a Gartner (2010) forecast, the rapidly growing worldwide
mobile subscribers will have surpassed 5 billion in 2010, led by growth in China and India.
With improved wireless security, privacy through data encryption and user education, in
addition to wide deployment of 4G systems, it is anticipated that m-commerce will
inescapably, become the most dominant method of conducting business transactions (Grami
& Schell, 2006).
In 2009, there were 81.3 million people worldwide using mobile devices to make
payments to the tune of US$68.7 billion. By the end of 2014, the number of people using
mobile devices to make payments is forecasted to rise to nearly 490 million (8 percent of
mobile subscribers), with a volume of m-payments expected to reach US$633.4 billion. The
Gartner (2010) report, goes ahead to predict that the key drivers for mobile usage are

Copyright UCT
DRIVERS OF M-COMMERCE IN AFRICA 8
expected to be (in order of importance) money transfer, location-based services, mobile
search, mobile browsing, mobile health monitoring, mobile payment, near-field
communication services, mobile advertising, instant messaging and mobile music.
Adoption of M-commerce
M-commerce was expected to grow very fast in the regions of origin namely North
America and Europe, but growth has been slow. Several reasons such as constrained capital,
consumer fears regarding security, and privacy of information and transactions are cited for
the low adoption rates (Magill, 2009). Concerns about m-commerce are widely held because
consumer payment details must be collected and stored, either on the consumer’s phone or on
a database with the retailer, and there have been several instances where consumer
information was stolen by computer hackers. For example, in New Zealand the database at
Hell's Pizza was cracked revealing passwords, emails, home addresses and phone numbers of
around 230,000 customers (Rawood, 2010). In a more serious case, Wyndham Hotels and
Resorts suffered serious data breach when hackers broke into its customer database stealing
customer's credit card information (Hotchkiss, 2010). Such incidents, among others erode
consumer and service provider confidence mainly due to exposure to fraud.
These concerns are reflected in the products people are willing to buy using m-
commerce transactions. For instance, according to a survey conducted by Harris Interactive
for mobile payment technology provider Billing Revolution, the top consumer rated products
that would be bought via mobile devices were pizza, movie and event tickets, hotel rooms,
fast food, music, travel tickets, games, coffee and videos (Business Week, 2009). This list is
expected to grow as the mobile device becomes more ubiquitous.
Concerns about security and privacy however, are not slowing growth everywhere.
M-commerce transactions in Japan annually top US$400 million. Subscribers can buy sodas
from vending machines, purchase food at fast food restaurants, and shop at Internet retailers

Copyright UCT
DRIVERS OF M-COMMERCE IN AFRICA 9
like Amazon.com, buying all their goods through DoCoMo’s mobile billing system. Other
companies, like Visa, also offer m-commerce services (M-Commerce, 2010). South Korea is
another example that has readily adopted m-commerce and is showing rapid growth. As
mobile payment systems develop, carriers collaborate, and security improves, we expect m-
commerce to develop further.
M-commerce in Africa. Africa is one of the regions where m-commerce growth has
been slowest. In addition to security and privacy concerns, adoption is frustrated by
insufficient telecommunication infrastructure development and high prices of
telecommunications services which are amongst the highest in the world. However, African
growth in mobile telephone penetration is also amongst the highest in the world, and this is
expected to facilitate rapid growth of m-commerce, especially where banking infrastructure is
less developed (Twinomugisha, 2009).
Between 2003 and 2008, Africa saw the number of mobile subscriptions surge from
54 million to almost 350 million - an increase of approximately 550%. In 2008, Gabon,
Seychelles, and South Africa boasted almost 100 subscriptions per 100 inhabitants. In North
Africa, the average penetration stood at almost two thirds of the population, and for Africa as
a whole, it was over one third. Only five African countries - Burundi, Djibouti, Eritrea,
Ethiopia, and Somalia still have a mobile penetration of less than ten per 100 inhabitants.
Mobile penetration in Africa is however expected to reach 75% by 2013 (Twinomugisha,
2009).
In African countries where the mobile phone has seen wide penetration, it has been
used to mitigate poor infrastructure and high telecommunication costs. In such countries the
mobile phone presented an opportunity for developing countries to close the digital divide
between Africa and the more developed countries (Waverman, Meschi, & Fuss, 2005).
According to Atkins (2005), the digital divide between rich and poor nations is narrowing

Copyright UCT
DRIVERS OF M-COMMERCE IN AFRICA 10
fast, which according to the World Bank, is based on the premise that people in the
developing world are getting more access to cell phone communications, far faster than they
got access to new technologies in the past (Atkins, 2005). Computers in general, and with it
the internet, are popular technologies which African countries have not been able to benefit
from in the same levels as developed countries.
Interestingly, in Africa, the mobile phone has overtaken the computer as the most
important information and communication technology (ICT) tool. African countries are
pioneering mobile banking and electronic transaction services. For example, in Kenya, South
Africa, the United Republic of Tanzania and Zambia, cell phones provide companies and
individuals the possibility to make person-to-person payments, transfers and pre-paid
purchases without a bank account (Twinomugisha, 2009).
In addition, mobile phone operators continue to make significant investments in
communication infrastructure, particularly in rural areas. These have transformed the African
countries socially and economically since business and social contacts can be established and
maintained more easily through use of the phones (UNCTAD, 2009). For example, France
Telecom has forecast higher growth for Africa and the Middle East than for other developing
regions, partly due to their phone sectors better resistance to the economic downturn. South-
South investment in Africa, already a major source of funding for developing country mobile
networks, is also likely to continue investing (Ewing, 2007). Zain, MTN Group, and
Orascom, are among the top foreign investors in African telecommunication and continue to
further strengthen their positions in the regional wireless market (Mutula, 2007).
These developments have played an important role for all forms of commerce in
many developing countries, especially countries that lack adequate fixed line infrastructure.
In many cases, this success has been registered in the small to medium sectors of commerce.
For example, workers in Uganda send cellular airtime to their families in remote towns, who

Copyright UCT
DRIVERS OF M-COMMERCE IN AFRICA 11
can convert it to cash via village phone operators (Ewing, 2007). Masons working near
Nairobi, report big jumps in income now that builders in need of laborers can reach them by
phone. Poor settlements in Mali, Rwanda, and elsewhere connect to the Web via cell phones,
helping villagers learn better farming methods (Mutula, 2007). In Tanzania, farmers use
mobile phones to communicate with markets and decide when and where to ship their
produce (Dard, 2007).
M-commerce and the internet. M-commerce relies on the internet to deliver
information to mobile phones. This stresses the importance of affordable internet availability
to m-commerce adoption. Internet and computer literacy in Africa are very low compared to
developed countries. For example, African internet penetration (10%) lags far behind more
industrialised regions, such as Europe (58%), North America (77%), and Asia (21%)
(Internet World Stats, 2010). This is due to poor fixed telecommunications infrastructure
technology, and high costs of computers. Broadband use in Africa is highly concentrated,
with five countries accounting for 90% of all broadband subscriptions. These five countries,
namely Algeria, Egypt, Morocco, South Africa, and Tunisia have achieved the greatest
improvements in broadband connectivity since 2003 (UNCTAD, 2009).
Furthermore, there is a huge gap in broadband speed and internet connectivity rates
between different countries. Of the 20 countries with the world´s most expensive access fees,
14 are in sub-Saharan Africa. Even within Africa, the price divide is huge, for example,
monthly access to broadband services cost on average more than $1,300 in Burkina Faso, the
Central African Republic and Swaziland, while subscribers need to pay less than $13 in
Egypt and Tunisia (UNCTAD, 2009).
Critical to improving this situation is the installation fibre-optic cables across the
continent, an area where Africa has been largely excluded in the past. Fortunately, a number
of initiatives are finally coming to fruition, for example, SEACOM, a cable linking the east

Copyright UCT
DRIVERS OF M-COMMERCE IN AFRICA 12
coast of Africa with Europe and India, became operational in July 2009, and the East African
Marine System (TEAMS) cable, linking Kenya to the United Arab Emirates, was completed
in 2009 (Mutula, 2007).
These initiatives will facilitate improved connectivity for Africa to the rest of the
world, increase telecommunication speeds and reduce internet and telecommunication costs.
So far, the few developments that have been completed have started showing signs of what to
expect in the future. In Kenya, South Africa, the United Republic of Tanzania and Zambia,
for example, there has been an increase in cell phone related applications. Cell phones
provide companies and individuals the possibility to make person-to-person payments,
transfers and pre-paid purchases without a bank account (UNCTAD, 2009). Mobile
penetration continues to increase, and along with it mobile based transactions and internet
usage.
Mobile Development in Kenya and South Africa
Kenya. Mobile phone penetration in Kenya reached 51% in the first quarter of 2010,
rising 2.7% to 19.9 million from the previous quarter. This growth can be attributed to
multiple line ownership, and increased number of service providers offering attractive
promotions. Internet users jumped nearly 60% to 6.4 million mainly due to mobile phone
data services through 3G networks. Most of it was activity on social networking sites mainly
by young people (CCK, 2010). According to BMI (2010), mobile phone penetration in
Kenya will exceed the 100% mark by 2013.
There are currently four major companies providing services and support in the
mobile communication as well as internet services. These are Safaricom, Zain, Orange and
YU. Safaricom is the largest mobile provider and boasts 78.3% market share, followed by
Zain (10.6%), Orange (5.6%) and YU (5.4%), (Safaricom, 2010). Safaricom has the widest
coverage and has always offered the cheapest rates and more value added services than all the

Copyright UCT
DRIVERS OF M-COMMERCE IN AFRICA 13
other providers. However since July 2010, Zain has slashed voice tariffs drastically, sparking
a price war with Safaricom. It is such activities that continue to reduce costs of
telecommunications in Africa.
As the competition in this field continues to grow, mobile providers have become
more innovative and started providing other mobile services in addition to voice. In Kenya,
Safaricom and Zain are at the forefront of providing additional value added services (VAS).
Safaricom is ahead of the rest with its most successful M-Pesa (money transfer) service. M-
Pesa has grown phenomenally since 2007, with subscribers increasing from 2 million in 2008
to 10 million in 2010. In order to compete, Zain and YU have recently introduced similar
money transfer services. Recently, Zain has gone a step further by the introducing a
commerce related innovation which provides market information in the form of market prices
of agricultural produce to farmers.
South Africa. South Africa has the most developed mobile market is Africa, and has
been one of the fastest growing markets on the continent in recent years, in terms of net
subscriber additions. The total market has reached 52 million customers, a penetration of
more than 114%, which has been growing at an average of 20% since 2007, (SAinfo, 2009).
This growth however slowed down to 10% per year in 2008 and 2009.
The country has four main cellular network operators, Vodacom, MTN, Cell C and
Virgin mobile. Virgin mobile is a virtual network service provider that operates in
partnership with Cell C. Recently a new operator, 8ta, owned by Telkom South Africa just
entered the market.
Vodacom is the largest mobile provider, controlling 55% of the market share,
followed by MTN (34%), Cell C (9%) and Virgin (2%). Apart from voice services offered by
all mobile providers, Vodacom and MTN also offer mobile banking services. In South
Africa, most users have security concerns and setup issues when doing actual transactions

Copyright UCT
DRIVERS OF M-COMMERCE IN AFRICA 14
over the mobile phone. Many do not go beyond balance inquiries and notification of
transactions (SAinfo, 2009). According to the consumer phase of World Wide Worx's
Mobility 2009 report, backed by First National Bank and BlackBerry-maker Research In
Motion (RIM), only 8% of the banked users in South Africa add beneficiaries via the cell
phone ( (SAinfo, 2009).
Mobile providers in South Africa offer a wide range of services that allow users to
conduct m-commerce transactions. These include purchase of food, clothing, books, tickets
and mobile services. Recently, Vodacom introduced the M-Pesa money transfer service.
These developments show an interesting poise towards further advancement of m-commerce
in Kenya and South Africa.
The Research Area
This research aim of this research is to identify the factors that influence the adoption
of m-commerce in Africa. Until the beginning of this decade, Africa was lagging behind,
when it came to telecommunications and internet use. In the last 5-6 years, investments in
telecommunications have begun changing the landscape and subsequently, Africa has started
taking strides to catch-up with more developed countries. Key in this advancement is the
mobile phone, which has demonstrated impressive penetration in the continent, leapfrogging
the use of computers, and catapulting Africa towards narrowing the digital divide. Interesting
questions arise on what contributes to the adoption of m-commerce that we continue to see in
Africa, especially against a backdrop of traditionally poor telecommunications technology,
low computer literacy and internet use.
Research Purpose and Question
As a first step, an evaluation of the services currently being offered by mobile
providers in Kenya and South Africa was conducted, with keen interest on those that

Copyright UCT
DRIVERS OF M-COMMERCE IN AFRICA 15
facilitate the execution of transactions. The second step entailed an evaluation of user
perceptions in order to understand the acceptance drivers. With this in mind, the research
question to be answered was stated as follows.
―What Factors Contribute to the Adoption of M-commerce in Kenya and South Africa?
The overall objective of this research was to contribute knowledge in regard to user
perceptions that influence the diffusion and adoption of m-commerce in Kenya and South
Africa. This knowledge would contribute to this field in several ways. In practice, the
knowledge of driving factors will enlighten managers when developing high technology
products for use in the African continent. In addition, this study will serve to prove,
disapprove and identify gaps in the existing theory on technology acceptance as applied in the
African context.
Specific Objectives
● To evaluate user perceptions towards m-commerce in Kenya and South Africa.
● To identify the characteristics of products or services that post success when
mediated via m-commerce.
● To evaluate whether computer and internet literacy (i.e. familiarity with
technology) has any impact on the adoption of m-commerce.
● To provide a baseline for further studies on m-commerce in Africa and other
developing countries.
Research Limitations
Due to the limited time available and the number of countries in Africa, it was not
possible to assess the drivers of m-commerce in all African countries. As a result,
this research was focused on the adoption of m-commerce in Kenya and South
Africa.
Copyright UCT
DRIVERS OF M-COMMERCE IN AFRICA 16
In addition, due to geographical differences in the participant locations, surveys
were limited to participants living in urban cities of Nairobi and Cape Town.
Because of this, some bias is expected in the results especially in regard to internet
literacy, because most urban dwellers are expected to have good contact with
computers and the internet.
Since the use of m-commerce is still in development. Insufficient understanding
of m-commerce was expected to lower user intentions to use it.
Due to the shortage of time, the research was conducted at one point in time. As a
result the research does not capture the change of user perceptions with time.
Research Assumptions
The first assumption was that all participants were English literate, providing for
varying levels of understanding. The research also assumed that the participants would
answer the self completion questionnaire honestly. The participants were also assumed to
have at least a basic level exposure to mobile phone usage and own at least one mobile
device.
Research Ethics
● The required ethical clearance was requested and submitted
● The surveys were done anonymously to ensure that the privacy of the individual was
preserved. The information requested by the survey was strictly based on what is
required for the research and all the questions asked were related to the hypotheses.
● The survey was not in any way an invasion of privacy and the participants had the
right to decline.
Copyright UCT
DRIVERS OF M-COMMERCE IN AFRICA 17
In order not to deceive the survey participants, a brief was sent to all participants,
clearly indicating why the research was being performed, and who to contact in case
of the need for clarification.
Literature Review
The literature review encompasses three main areas. The first section explores the
varied definitions of m-commerce that exist and the technology behind m-commerce. The
second section discusses the technology acceptance models. The third section explores the
diffusion of innovations within a society with a key focus on mobile marketing as a
communication channel.
Defining M-commerce
M-commerce is defined in several ways. Most definitions involve a complex set of
products and services facilitated by mobile telecommunications technologies. In addition, a
bewildering array of standard terms, product definitions, pricing and payment schemes add to
this complexity. As a result, the content and nature of the term m-commerce varies across
studies (Okazaki, 2005).
M-commerce has sometimes been defined very broadly. For example, m-commerce
can be defined as ―a set of applications and services that people can access from their Internet
enabled mobile devices.‖ (Sadeh, 2002, p. 22). In the same broad sense, m-commerce has
been defined as the exchange or buying and selling of commodities and services through
wireless handheld devices such as cellular telephones and personal digital assistant (PDAs)
(Abu Bakar & Osman, 2005, p. 34). An even broader perspective extends it to ―mobile
business‖ (m-business), to mean, a business related communication that is conducted among
individuals and companies and that does not necessarily involve any financial transaction
(Moshin, Mudtadir, & Ishaq, 2003). In this sense, m-commerce is seen as a subset of m-
business, where m-business entails both commercial and non-commercial areas. M-business

Copyright UCT
DRIVERS OF M-COMMERCE IN AFRICA 18
is thus seen to have a larger scope since all aspects of m-commerce take place within mobile
business (Tiwari & Buse, 2007).
Other scholars have defined m-commerce much more narrowly. Durlacher, (1999)
defines m-commerce as ―any transaction with a monetary value that is conducted via a
mobile telecommunications network‖. Kao (2009), contends that media used is what defines
m-commerce. In this case, the media has to be wireless, hence restricting m-commerce to the
application of wireless devices and data connection to conduct transactions, which results in
the transfer of value in exchange for information, services, or goods.
Other scholars see m-commerce as a subset of electronic commerce (e-commerce).
When compared to e-commerce, m-commerce highlights the mobility of its transaction
devices, such as PDAs and mobile phone (Kao, 2009). M-commerce has also been seen as an
extension of e-commerce (Moshin, Mudtadir, & Ishaq, 2003). Others argue that the only
difference between m-commerce and e-commerce is the media, wireless devices (Varshney &
Vetter, 2002). Stafford & Gillenson (2003) argue that e-commerce is the buying and selling
of products through computer networks, and is oriented towards supporting and realizing
transactions, while m-commerce only plays the role of delivering information about products
and services. This is exemplified by a typical practice in Japan where phones provide
customers with information about shopping choices, but the actual product orders and
transactions are done via in-store self service computer portals. Leung & Antypas (2001)
argue that m-commerce includes both content delivery and actual transactions done on
mobile devices.
Other scholars argue that, m-commerce is sometimes seen to be more than e-
commerce due to its different interaction style, usage patterns and value chain. This is
because m-commerce is a new and innovative business opportunity with its own unique
characteristics and functions, such as mobility and broad reach ability (Feng, Hoegler, &

Copyright UCT
DRIVERS OF M-COMMERCE IN AFRICA 19
Stucky, 2006). This argument would make m-commerce more than e-commerce, as far as
market reach is concerned. E-commerce is targeted to only those customers who have access
to computers and are internet literate. In contrast, m-commerce services expand the
addressable market size by making the mobile phone the lowest common denominator.
Two primary shortcomings have been identified in these definitions. The first
shortcoming concerns monetary value as a defining element of m-commerce. Including
monetary value as an element of an m-commerce definition ignores the commercial nature of
marketing measures and after-sales services. Consumers often make ―temporal payments‖
for transactions by agreeing to watch commercial messages in exchange for ―free‖ services
(Tiwari & Buse, 2007). Services may also be bundled as part of subscribed products and thus
bear no additional price. In such cases, many consumers may perceive the m-commerce
product to be free of charge.
The second shortcoming, concerns the requirement for m-commerce to be mediated
by wireless telecommunication networks. On this, Tiwari and Buse (2007) argue that this is
misleading because it contends that transactions have to be completed exclusively through
wireless telecommunication networks, hence it limits the scope of m-commerce to only
―immaterial‖ products (e.g. information), thereby ignoring the ―material‖ products like
purchase of clothes where transactions can be completed in other ways (e.g. cash payment).
This thesis pursues the definition which identifies two key characteristics of m-
commerce. First, any business related communication that is initiated and completed with the
help of mobile devices and second, transactions conducted using mobile devices, usually as a
result of business related communication, ultimately resulting in the exchange commodities
and services (Tiwari & Buse, 2007).
This definition was selected because it reflects the nature of m-commerce related
interaction in the African context. In Africa’s small business sector, commerce related

Copyright UCT
DRIVERS OF M-COMMERCE IN AFRICA 20
transactions are initiated with the help of the mobile phone. Monetary transactions may not
always occur through the mobile, for various reasons, but using the mobile phone to mediate
this transaction is enough.
A good example is when small traders in Africa use the mobile phone to gather
market information, and to communicate to their customers. Such exchanges do not always
result in transactions or exchange of goods and services, but, nevertheless, commercial
interaction has taken place. Service providers also send commercial information to
subscribers through mobile devices. For example, marketing offers and after sales service do
not necessarily involve any transactions. Other non commercial information includes free
services, like games, maps and emergency service information which are not commercial in
nature.
It is such exchanges of information that give rise to a large number of transactions
conducted using mobile devices. Because of this, we continue to see an increase in mobile
based services that facilitate the transfer of money, which have led to more transactions being
facilitated via the mobile device. It is for these reasons that we adopt a definition that
incorporates both commercial and non commercial transactions, so long as they are mediated
via the mobile phone. Therefore, for this research, all services that are initiated, terminated
or both on a cellular handheld phone and involve the transfer of a commodity from one
account to another can be termed as mobile commerce services.
M-commerce Services
M-commerce is suited to certain types of purchases based on the simplicity of the
product and the urgency of the demand. Initially limited to the purchase of dematerialized
goods like ring tones and wallpaper, m-commerce now covers a far wider range: online
gaming, coupons and sales offers, loyalty cards, online ticket bookings, leisure services,

Copyright UCT
DRIVERS OF M-COMMERCE IN AFRICA 21
rentals, m-banking, m-shopping, auction sites, access to information and paid services among
many others. The most common m-commerce services are shown in Table 1.
Table 1 M-commerce Services
M-commerce Services
Prepaid transactions Transactions on the go Mobile banking
Voucher-less airtime
distribution
Peer-to-Peer payments Branchless banking
Digital content retailing Retail payments Loan disbursement and repayment
Peer-to-Peer airtime sharing Fund Transfers Banking information - balance
check, statements, etc.
Bill payments Fund transfers
Travel ticketing
Movie/concert ticketing
M-commerce Business Model
There are three types of m-commerce models in use today. The first model is
illustrated when the bank owns the m-commerce service. In this case, the nature of the
service can be envisioned as an extension of the banks internet services to the mobile phone.
Though this model may have evident benefits for the controlling bank and its clients, the
model does not provide for consumers who do not have accounts with the particular bank
(Utiba, 2010).
The second model is when the service is owned by the telecommunications provider.
This model has limitations as far as reach is concerned. Only those consumers who are
subscribers to the network operator have access to the service. The third model is when the
service is owned by a third party, who then provides interfaces for various mobile providers
as well as banks (Dholakia, 2006). In this scenario the consumers are not limited by the
network operator, and also do not need to have a bank account with a conventional banking

Copyright UCT
DRIVERS OF M-COMMERCE IN AFRICA 22
system, since the owner of the m-commerce service creates a fund which acts as an m-
commerce pool from which transactions can be made.
The third party model creates the most value in terms of an all-inclusive commercial
ecosystem. Under such a model the third party can leverage the distribution network of
several network operators thereby creating access points for the larger population.
In Kenya and South Africa, the m-commerce service is predominantly owned by the
network operators, in collaboration with selected banks. This demonstrates that there is room
for m-commerce to evolve further within the African context
The Technology Behind M-commerce
M-commerce is built on mobile phone technology, which earmarked the beginning of
wireless communication. Mobile phones facilitate m-commerce by delivering information
wirelessly (Frolick & Chen, 2004). This technology has developed over the years from slow
and arduous communication services to agile multi platform capabilities. Cellular networks
were originally designed for voice-only communication. To support data based m-commerce
transactions there has been an evolution of these networks from analogue to digital and from
circuit-switched to packet-switched networks (Saidi & Town, 2010).
Unlike fixed-line communication technologies, which have followed gradual
developments, developments in mobile communication technologies have been concurrent
even within the same country (UNCTAD, 2002). Today, a number of these mobile
communication technologies are available and are classified into the so-called first generation
(1G), second generation (2G), third generation (3G) and fourth generation (4G) network
technologies.
1G comprise analogue networks, which use circuit-switched connections for data
transfer and has data transmission rates of up to 2400 bps. These technologies are expensive,
relatively insecure, and limited in bandwidth. 2G are digital communication systems
Copyright UCT
DRIVERS OF M-COMMERCE IN AFRICA 23
supporting both data and voice transmission at transmission rates ranging from 9.6 to 14.4
Kbps. Just like 1G, 2G uses circuit-switched connections but offer increased bandwidth,
increased security and reliable data transfer. 2G network technologies reduce the congestion
problems inherent in 1G technology by having multiple users over a single channel (Boadi &
Shaik, 2006). These technologies offer additional capabilities such as short messaging,
faxing and roaming of mobile end-stations.
With all its advantages, the transmission rate for 2G technologies is still not enough
for the transmission of video and graphic images. Consequently, an intermediate technology,
the so-called second-plus generation (2G+ or 2.5G) has been developed. 2.5G supports
transmission rates of 57.6Kbps or higher and offers parallel voice and data transmission,
including internet access in mobile handsets (UNCTAD, 2002). 2.5G standards in use
include General Packet Radio Service (GPRS), High Speed Circuit Switched Data (HSCSD)
and Enhanced Data rates for GSM Evolution (EDGE). 2G and 2.5G cellular wireless
networks are the most common mobile networks employed by mobile phone operators and
can provide a sufficiently robust platform for m-commerce (Grami & Schell, 2006).
3G networks have much higher network capacity for data and voice transmission.
They provide bandwidths comparable to a wired broadband connection with speeds of up to 2
Mbps. The high transmission rates are suitable for internet access, satellite navigation, video
and audio streaming, video conferencing and access to other multimedia content. Unlike 1G
and 2G technologies, 3G uses packet-switched connections. With some operators just
starting to embrace 3G mobile technologies, 4G networks have already started emerging with
promising possibilities of about 20Mbps bandwidth (though there are possibilities of up to
100Mbps transmission rates) and the ability to roam across different wireless network
standards with one device (Georgiev, 2009).

Copyright UCT
DRIVERS OF M-COMMERCE IN AFRICA 24
Table 2 Mobile Technology Generations
Mobile Technology Generations
Generation Description
1G First generation of wireless - analogue based
2G Second generation - digital. Handles text and basic images
3G Third generation - digital. Supports rich media
4G Fourth generation - digital. More bandwidth, higher security, interactive
sessions
M-commerce delivers information via wireless application protocols (WAP), general
packet radio service (GPRS), and short messaging service (SMS). SMS is the most basic
protocol used, and works by generating sales using push marketing strategy (Rittippant,
Witthayawarakul, Limpiti, & Lertdejdecha, 2009). Wireless push marketing refers to the
business situation in which the vendor initiates the communication and proactively delivers
time sensitive or location-specific promotional messages to consumers.
WAP allows mobile users to exchange data, and access databases instantly over the
Internet. WAP is expensive because all data is transmitted through the telephonic network.
GPRS, in its basic form, can be thought of as wireless broadband. Unlike WAP, GPRS is
cheaper and faster because data is transmitted using the same protocol as the internet (Baldi
& Thaung, 2002).
The most well-known example of this type of service is Japans NTT DoCoMo. This
provider offers many different m-commerce products and services such as hotel reservations,
online auctions, books, airline tickets, and stock quotes. DoCoMo named its service ―i-
mode.‖ i-mode is written in a language known as C-HTML, which is a mobile version of the
language used to write standard internet websites (Krishnamurthy & Rights, 2002).
M-commerce architecture. M-commerce structural architecture consists of three
tiers. Front-end (Client) - this is the piece of application that runs on the mobile device

Copyright UCT
DRIVERS OF M-COMMERCE IN AFRICA 25
(Phones, PDAs, and Communicators), Middle-ware (Server) - this is the software running on
a system that contains the business logic. Back-end (Database) - this is the server that hosts
all the data. In addition, the architecture requires, a connectivity medium, a security authority,
a clearing authority (e.g., a bank), and suppliers of merchandise.
Figure 1. The m-commerce architecture
The front-end or customer interaction layer plays a significant role in determining
how well any mobile technology based innovation is adopted. As shown on table 3, the
mobile channel offers multiple modes of customer interaction. The challenge that most m-
commerce providers encounter is selection of the best technology to use. Interactive Voice
Response (IVR) systems are voice-based applications that rely on aural interactions (Airtel,
2009). They tend to be tedious to use and more so for a service with multiple options and
sub-menus. Short Message Service (SMS), which is a plain text based interface, has the
biggest advantage because of its universal acceptability in terms of user comfort (Georgiev,

Copyright UCT
DRIVERS OF M-COMMERCE IN AFRICA 26
2009). A big drawback however, is the plain text communication lends itself to security
issues. Users also have to learn specific commands to conduct transactions.SIM Tool Kit
(STK) menu is a SIM resident application that provides the user with a menu based service
access. STK uses the SMS channel for communications but provides encryption services that
ensure security. This system is quite costly because the applications have to be embedded
into each SIM card. It is more cost effective to have the applications residing in a central
server, to be accessed by all users.
UnStructured Service Data (USSD) provides the user with a session based interface.
The advantage in using USSD is that the service providers can provide an updated menu
every time the user initiates a request and the communications are also secure as compared to
SMS transactions (Banzal, 2010). However, a session based service often leads to frequent
unfinished transactions especially in places that have weak signal problems.
Java provides subscribers with an applet that resides in the phone memory and uses
SMS or GPRS at the back end to communicate with the service delivery platform. This
provides a highly intuitive interface for the user which can easily be upgraded and
customized (Nysveen, Pedersen, & Thorbjornsen, 2005). The major challenge is the
requirement to have Java compatible, data enabled handsets in a developing economy. This
approach is more suited for mature markets where smart phone penetration is higher as
compared to other regions. Web/GPRS approach enables the user to access a web based
service portal using the mobile phone (J.-H. Wu & Hisa, 2008). The challenge here lies in
network capability and the extent of network usage in a particular market. M-commerce
service providers hence need to go with a combination of channels in order to increase reach
and uptake (Utiba, 2010)

Copyright UCT
DRIVERS OF M-COMMERCE IN AFRICA 27
Table 3 Customer Interaction Modes
Customer Interaction Modes
Mode Description
IVR Voice based
SMS Text based
USSD Session based
STK SIM based
Java Highly intuitive
M-commerce value chain. There are seven links in the m-commerce value chain. At
the bottom, is the infrastructure that provides data communication between mobile users and
application providers. The second link consists of basic enabling services, such as server
hosting, data backup, and systems integration. Transaction support is the third link of the
value chain (Barnett, Hodges, & Wilshire, 2000). Many wireless services will require some
form of payment—usually from the user to the service. Transaction support provides the
mechanisms that assist these transactions, in terms of security, and user billing. The fourth
link is presentation services (Victoria & June, 2002). Providers convert the content of
internet-based applications, which are formatted in a standard known as HTML (HyperText
Markup Language), into a standard such as WML (Wireless Markup Language), an HTML
subset suitable for the small, low resolution screens of wireless devices (J.-H. Wu & Hisa,
2008). Content that isn't already on the Internet can be formatted directly into a wireless
standard. Personalisation support is the fifth link of the chain. One of the main value
propositions of m-commerce is its ability to personalize applications for individual users.
Companies that can provide personalized information will form a valuable link (Mort &
Drennan, 2005). User applications comprise the sixth link of the value chain. Possible
applications range from those currently available on the wired Internet (including banking,
book purchasing, e-mail, news, and travel) to new services designed specifically for mobile

Copyright UCT
DRIVERS OF M-COMMERCE IN AFRICA 28
consumers. For example, information about where to find the nearest shopping mall, hospital
or café.
At the highest point in the chain are the content aggregators: businesses that design
and operate portals that provide information in a category or search facilities to help users
find their way around the internet. This function is particularly important for m-commerce
because mobile telephones have small screens and limited input mechanisms. Users will
want portals that simplify the search, avoid returning too much information, and require
minimum input (Barnett, Hodges, & Wilshire, 2000).
Figure 2. The m-commerce value chain
While cell phone companies continue to upgrade their networks, invent new applications
and provide consumers with content, it is the consumer perceptions and attitude towards m-
commerce that will determine whether this technology will gain traction. This study examines
user perceptions and attitudes towards m-commerce in Kenya and South Africa, with keen
interest on what influences their likeliness to use it.
The Adoption of Innovative High Technology Consumer Products
The research has drawn on the diffusion of innovations literature and multi-attribute
attitude models to evaluate user perceptions and attitude towards m-commerce in Kenya and
South Africa. Consistent with this tradition, the current research relies on the Technology

Copyright UCT
DRIVERS OF M-COMMERCE IN AFRICA 29
Acceptance Model (TAM), which is frequently used to explain the acceptance of new
technologies, and on the Theory of Reasoned Action (TRA), which is perhaps the most
widely employed multi-attribute attitude model.
The Technology Acceptance Model (TAM)
Several theorists have found that, although not every product may share all of the
characteristics, the consumer adoption process for high technology products often exhibits a
set of distinctive characteristics (Parasuraman & Colby, 2001). For any innovation to
succeed it must begin by having an advantage over those that it supersedes. The innovation
should be, consistent with existing values and needs, easy to understand or use, available for
testing, and have results that are easy to see (Rogers, 1995). M-commerce can be seen to
have an advantage over other commerce methods because it allows a wider reach, reduces
transaction costs, and is said to offer competitive pricing. In addition it is ubiquitous, hence
users can access services any time at any place. It is also convenient because the mobile
phone is light and easy to carry. Finally, the ability to personalize services means that end
users can have services tailored to their exact needs. The technology is also easily available
for testing over mobile phones.
However, the technology has some drawbacks which cast doubt on its potential to
succeed especially in regard to ease of use. The challenges include; small screens which still
limit types of file and transferable data, limited number of characters and text that can be
transmitted using sms, less functionality for mobile internet in comparison to computer
internet, a user interface that is often difficult to learn how to use, limited bandwidth, high
costs of establishing mobile and wireless broadband infrastructure, technology constraints of
mobile devices (memory, processing power, display capabilities, input methods), and security
of data moved across some mobile and wireless networks. On this premise, it would appear
that m-commerce does not meet the success criteria for a high technology innovation.

Copyright UCT
DRIVERS OF M-COMMERCE IN AFRICA 30
This theory, however, in arguing that the technology has to be easy to use, does not
address the varying levels of techno-readiness that may be inherent in a particular group of
consumers. This can be measured using the technology readiness index (TRI). Based on TRI
score, consumers can be categorised as explorer, pioneer, skeptic, paranoid, or laggard. Each
category can be further refined to include demographics, psychographics, technology belief
patterns, representative opinion about technology, and technology-based product and service
usage (Parasuraman & Colby, 2001).
As such, consumers in different categories will be expected to embrace technology
differently. In Africa, South Africa ranks first in terms of technology readiness, followed by
Tunisia and other North African countries. Kenya is ranked 10th (Appendix 1). On this basis,
we would expect to see the adoption of m-commerce in African countries follow the same
pattern. That is, m-commerce would achieve higher adoption rates in South Africa, than
other African countries, Kenya included.
Having said that, consumers may be techno-ready and thus find a technology easy to
use, however, whether they actually find the technology useful would need to be determined.
Consumers are not expected to adopt an innovation if they do not find it useful. Whether it
addresses existing values and needs and hence perceived useful, is one of the aspects that this
research investigates. This indicates that the socio-economic situation within different
countries and communities also plays a role in adoption of technology. TAM expounds on
two important perceptions. The first perception is perceived usefulness. People tend to use or
not use an application to the extent they believe it will help them perform their job better.
The second perception is the perceived ease of use. Given that an application is useful, they
may, at the same time, believe that the system is too hard to use and that the performance
benefits of usage are outweighed by the effort of using the application.

Copyright UCT
DRIVERS OF M-COMMERCE IN AFRICA 31
Although difficulty of use can discourage adoption of an otherwise useful system, no
amount of ease of use can compensate for a system that is not useful (Davis, 1989, pp 333).
In Africa, m-commerce has mainly been used for money transfer, and to gather market
information. The fact that the number of consumers using these services continues to
increase would be an indicator that the technology has been found to be useful. Once users
find the technology useful, the behavior demonstrated in actual use of the technology is what
demonstrates the successful adoption of any innovation.
Theory of reasoned action (TRA). According to the theory of reasoned action
(TRA), consumer behavior, such as the adoption of m-commerce, is the product of behavioral
intent. Behavioral intent is caused by consumer attitudes and subjective norms (Fishbein &
Ajzen, 1980). Attitudes have two components: evaluation and strength of belief, while
subjective norms are conceptualized as products of normative beliefs (what we think is
expected of us by others), and motivation to comply (level of importance of doing what
others expect us to). Intention is then described as the best predictor of whether or not a
behavior is performed. Intention is determined by our attitude (personal beliefs about the
behavior) and subjective norms (positive or negative value) associated with the behavior.
Ajzen (1991), however, argues that this behaviour is not entirely voluntary, and thus
extended the TRA to include a measure of perceived behavioural control (PBC). The
rationale behind the addition of PBC was that it would allow prediction of behaviours that
were not under complete volitional control. Thus, while the TRA could adequately predict
behaviours that were relatively straightforward (i.e. under volitional control), under
circumstances where there were constraints on action, the mere formation of an intention was
insufficient to predict behaviour. Figure 3 illustrates the extended TRA.

Copyright UCT
DRIVERS OF M-COMMERCE IN AFRICA 32
Figure 3. Predicting Consumer Behaviour
This theory however, does not address experiential perceptions which are very
influential in drawing consumers to behave in certain ways. The impact of perceived
enjoyment, perceived usefulness, and perceived expressiveness on intention to use the
services is significant (Nysveen, Pedersen, & Thorbjornsen, 2005). Enjoyment is particularly
important as a driver for using experiential services, such as contact and gaming services.
TRA’s elements may also be specific to the culture in which it was derived from, and
probably less relevant in others. For example, TRA fails to address the cost, level of comfort
and trust that a consumer may have with the technology, and the impact of social influence,
which may differ from culture to culture. In similar studies, the constructs social influence
(SI), perceived cost (PC) and trust (T) have proved useful to explain consumer behavior (Wei
& Chong, 2008). It is hence important to apply the constructs within context of a socio-
economic and cultural environment (Wei & Chong, 2008). For example, since m-commerce
was still in its infancy in Malaysia, several modifications had to be adapted to the TAM
theory. Intention to use was chosen instead of actual use, in the same case, attitude as a
construct was removed from the model to make it simpler (Luarn & Lin, 2005).
Another weakness with TRA is that it fails address the antecedents of its main
constructs, perceived use and perceived usefulness. A consumer would first need to get

Copyright UCT
DRIVERS OF M-COMMERCE IN AFRICA 33
exposed to the proposed innovation, before they can evaluate its perceived usefulness, and
usability. There several ways in which a consumer would get exposed to the innovation
before they decide to evaluate it. The most common ones are advertising and social
networks. The diffusion of innovations theory elaborates how innovations diffuse through a
society, from exposure to actual usage.
Diffusion of Innovations (DOI)
A technological innovation diffuses among members of a social system through
particular channels over time. The first stage is knowledge or exposure, next is persuasion
(forming an attitude), then decision (commitment to adoption), implementation (using the
idea) and finally confirmation (reaffirmation to continue using) (Rogers, 1995).
Initial knowledge and exposure to a new innovation is usually by way of public
marketing. Subsequently, knowledge of the innovation disseminates via interpersonal
channels. It is these channels that play a significant of persuasion leading to actual usage
(Backer & Rogers, 1997). Inter personal communication diffuses the innovation through
several roles inherent in a society. Opinion leaders, have relatively frequent informal
influence over the behavior of others, and are usually the first to inform others. Thereafter,
change agents influence innovation decisions by mediating between the change agency and
the relevant social system. Change aides complement the change agents by having more
intensive contact with clients. Although they are not usually competent in the technology,
they play an important role of dissemination because they are considered trustworthy
(Rogers, 1995).
This intrinsic dissemination carries emotional appeal which works well for high
involvement products (e.g. cars, computers) where the purchase decision warrants
investigation and information gathering. Rational appeal by foreign endorsers works for low
involvement products (e.g. gum, milk) (Yeh, County, Lin, County, & Road, 2010). Once a

Copyright UCT
DRIVERS OF M-COMMERCE IN AFRICA 34
social system has been exposed to a new technology, adoption takes shape in several stages;
namely, innovators (venturesome), early adopters (respectable), early majority (deliberate),
late majority (skeptical) and finally laggards (traditional) (Rogers, 1995).
For m-commerce, public marketing has been the most common method of initial
exposure. In addition, marketers have adopted advertising via the mobile device which
facilitates target marketing. This is seen to be more efficient than the traditional blanket mass
media marketing, giving mobile marketing an upper hand (Carroll, Barnes, & Fletcher,
2007). Furthermore, due to its personal nature, the mobile device can overcome the major
challenge of getting the time and attention of consumers (Ververidis & Polyzos, n d).
Mobile Marketing
Mobile marketing is viewed as a third screen marketing channel after television and
the internet. Mobile marketing is the use of the mobile medium as a means of marketing
communications (Leppaniemi, Sinisalo, & Karjakuoto, 2006). Today, advertising is
everywhere and as the more cluttered the advertising space gets, the more difficult it becomes
to get customers attention (Godin, 1999). The most significant difference between m-
commerce advertisements and traditional advertisements is that, while traditional
advertisements promote to people in general, mobile marketing advertisements aims at
specific individuals (Yeh, Y. County, Lin, T.-yuan County, & Road, 2010). Although high
mobile phone penetration rates do not translate to high mobile marketing use`, high potential
for communicating marketing messages through mobile phones does exist.
While this medium is good for marketers, mobile marketing also creates perceived
problems of privacy and security risks for consumers (Nysveen, Pedersen, & Thorbjornsen,
2005). Currently, mobile advertising is largely through the use of SMS and consumers have
a general negative attitude towards SMS advertisements as they are considered irritating
(Tsang, Ho, & Liang, 2004). Unsolicited SMS messages raise privacy concerns related to the

Copyright UCT
DRIVERS OF M-COMMERCE IN AFRICA 35
utilisation of personal and location data that is used to personalise mobile marketing
messages. This is the main reason why consumers may be reluctant to respond to the mobile
marketing communication channel because of the perceived risk regarding safety and privacy
of their personal data. Privacy issues are particularly sensitive with respect to mobile
marketing due to the personal nature of mobile devices (Harvey, Deans, & Gray, 2007)
Perceived risk refers to certain financial, product performance, social, psychological,
physical, or time risks when consumers make transactions via their phones (J. Wu & Wang,
2005). Risk is often viewed as an antecedent of involvement and trust especially when the
price is high and the consumer risks losing money. Because of this risk perception,
consumers are more often motivated to avoid mistakes than to maximize utility in purchasing
(Mitchell, 1999).
It is therefore important to reduce the levels of perceived risk so that consumers can
have more trust. Trust also involves uncertainty and risk with no perfect guarantee that
ensures the trustee (mobile vendor) will live up to the trustors (consumer) expectation. The
trustor needs to have faith in the trustee’s honesty and benevolence, and believe that the
trustee will not betray his/her risk-assuming behavior (Li & Huang, 2009). The key to
forming trust is getting customers to start transacting with the mobile vendor through reward
attraction, or by demonstrating features such as convenience, cost efficiency, and personal
necessity. Once they are convinced to buy, customers must also have positive and direct
experiences with the vendor during their transactions for a trust relationship to form. Such
positive direct experiences are considered the strongest trust builders with the highest
potential for reducing perceived risk (Siau & Shen, 2003).
Karvonen, Cardholm, & Karlsson (1999) created the BATE model, which consists of
four dimensions of trust: business trust, administrative trust, technical trust, and experience-
based trust. Cardholm et al. argued that online shoppers dealing with m-commerce
Copyright UCT
DRIVERS OF M-COMMERCE IN AFRICA 36
transactions assign more weights on business trust and experience-based trust than on
administrative trust and technical trust of the model (Kao, 2009, pp 225).
One area that may help in addressing the issue of privacy and security risk is
obtaining consumers’ permission (Kavassalis et al., 2003). Obtaining permission gives
consumers freedom in adopting mobile marketing services (Harvey, Deans, & Gray, 2007).
Permission based advertising would go a long way into reducing the irritation factor for
consumers, which may in-fact change their attitude towards mobile marketing, thereby
creating more avenues for m-commerce to precipitate (Yeh, Y. County, Lin, T.-yuan County,
& Road, 2010). Other ways of reducing irritation include, incentive based, and location-
based mobile advertising (Haghirian & Madlberger, n d).
There are other possible reasons why mobile marketing may not be successful. Firstly,
small screens may prevent consumers from comprehending vendor promotions (Yeh, Y.
County, Lin, T.-yuan County, & Road, 2010). Secondly, when advertising messages
delivered via m-commerce are limited to text characters, there is greater difficulty in
expressing the core value of a product and thirdly, consumers have already built habitual
interaction with other advertising mediums, due to continuous exposure to large mediums
such as large screens, billboards, and banners.
Despite the perceived drawbacks, mobile marketing is becoming an integral part of
multi-channel commerce. Customers can research a product online, and make a quick double
check via their phone to make sure they're getting the best price (El-gayar, 2007). Multiple
channels should satisfy different customer needs and not simply replicate the catalogue or
website (Mohd & Muhammad, 2009)(e.g. use the mobile for promotions and succinct product
updates and use website to give full visual and demonstration of product).
A good retailer always tries to make it as easy as possible for their customers to make
a purchase or find out more about a product (e.g. provide feedback from other consumers

Copyright UCT
DRIVERS OF M-COMMERCE IN AFRICA 37
who have experienced the product). Suggesting related products according to a customer's
favourite or previous browsing history, and predicting where a customer might want to go
next simplifies transactions and makes potentially complicated mobile retail faster and more
user-friendly (Grami & Schell, 2006).
The consistency and flexibility of m-commerce makes it possible for customers to get
what they want, wherever they are, and not rely on proximity to a real life store or their
computer or internet connection. Customers want familiarity with the store or website they
already know, and the option to customise their purchasing experience. Providing stock
details, reservation ability, SMS reports about the delivery status are ways to give the
customer full control and in turn encouraging them to put their full trust in the retailer.
While is important to encourage clients to utilise all variations of the organisations
presence, businesses should be careful not to alienate some divisions of their customer base
by leading them to believe that online customers are getting a better deal. Not all customers
are tech-savvy, however they're likely to know how to use a mobile phone, or at least
understand a special offer via a simple text message (Gatford, 2010)

Copyright UCT
DRIVERS OF M-COMMERCE IN AFRICA 38
Research Hypotheses
M-commerce continues to take hold in Africa despite a backdrop of poor
telecommunications infrastructure and low computer and internet literacy. M-commerce,
which relies on internet availability, lends itself to the inquiry into what to expect of its
growth and adoption in the future. This research is founded on the technology acceptance
model (TAM), which suggests that ease of use and perceived usefulness are two main factors
that predict user intention to adopt a new information system based technology.
Although TAM has been applied for various computer based technology, little has
been done in the context of m-commerce in Africa. Moon & Kim (2001) argue that factors
affecting the acceptance of a new innovation system are likely to vary with the technology,
target users, and context. With this in mind, traditional TAM variables may not fully reflect
the users’ intention to adopt m-commerce, resulting in the need for additional or mediating
factors that better predict the acceptance of m-commerce (Tang, 2004, p 1662).
Based on the foregoing literature review, it is possible to draw several hypotheses
about the relations of trust, perceived ease of use, perceived usefulness, attitude and intention
to use m-commerce. These systematic relations are depicted above in Figure 4. In this
section, I identify each of these hypothesised links and summarise the theoretical rationale
behind each link.

Copyright UCT
DRIVERS OF M-COMMERCE IN AFRICA 39
Figure 4. Proposed Structural Model
H1. Perceived ease of use (PEOU) has a positive influence intention to use (IU).
H2. Perceived ease of use (PEOU) has a positive influence on perceived usefulness (PU).
H3. Perceived ease of use (PEOU) has a positive influence on attitude (A).
These hypotheses were derived because perceived ease of use (PEOU) determines the
degree to which an individual believes that using m-commerce would be free of physical and
mental effort. Based on this, users are expected to find m-commerce useful. The fact that
using m-commerce is perceived not to be tedious and complex due to physical and
technological constraints; is expected to influence the attitude that consumers have towards
m-commerce in a positive way. If consumers find it useful and easy to use, then it is
expected that they will develop intention to use it.

Copyright UCT
DRIVERS OF M-COMMERCE IN AFRICA 40
H4. Perceived usefulness (PU) has a positive impact on the intention to use m-commerce
(IU).
H5. Perceived usefulness (PU) has a positive influence on attitude (A).
Perceived usefulness (PU) is the extent to which an individual believes that the use of
m-commerce will improve his or her job performance in daily activities, as well as address
other personal or commercial related needs. Based on how useful they perceive it to be, users
are expected to have a positive attitude towards m-commerce as well as demonstrate a higher
likelihood of using it.
H6. Attitude (A) has a positive effect on intention to use (IU) m-commerce.
Attitude (A) is a person’s enduring favorable or unfavorable evaluation, emotional
feelings, and action tendencies toward some object or idea. This construct evaluates the
general approach that users have towards m-commerce. A favorable attitude towards m-
commerce is expected to have a positive influence on the intention to use.
H7. Perceived trust (T) has a positive effect on attitude (A) towards m-commerce.
H8. Perceived trust (T) has a positive influence on ease of use (EOU).
H9. Perceived trust (T) has a positive influence on perceived usefulness (PU).
Trust, is the belief that the services are genuine and authentic and that customers do
not stand to lose anything as a result of engaging in m-commerce. Where technological
products are involved, users are concerned about losing their money through fraudulent
transactions. This is because they cannot check the quality of the product before purchase.
Consumers also feel insecure when they send out financial and personal information via the
internet. Online transactions also include numerously inherent uncertainties, such as pricing
injustices, violations of privacy, transmissions information, unauthorized tracks of inaccurate

Copyright UCT
DRIVERS OF M-COMMERCE IN AFRICA 41
transactions, and unauthorized use of credit cards (Li & Huang, 2010). User trust in m-
commerce is thus an important element that affects consumer behavior through the attitude
formed from the perception that m-commerce is trustworthy. If consumers have faith in m-
commerce then we can expect them to have a favourable attitude towards it. Because of this,
users would be expected to perceive m-commerce useful and easy to use.
Summary of Literature Review
There are many views on what m-commerce entails. This research adopts the broad
definition that encompasses any business related communication conducted over mobile
phones as well as actual transactions involving exchange of goods, services and money.
Several theories can be used to understand the factors that influence the adoption of
technological innovations. TAM contends that adoption behavior is driven by perceived
usefulness and perceived ease of use. TRA argues that adoption behavior is as a result of
intent. Intent is influenced by attitude and subjective norms. All the aforementioned theories
address attitude towards a technological innovation but fail to examine the systems that
contribute towards creating awareness of the innovation. Consumers would need to be aware
of the technology for them to form an attitude towards it.
The diffusion of innovations (DOI) theory addresses the issue of awareness and
dissemination of a technological innovation by discussing the various ways in which an
innovation diffuses through a society. Public advertising and marketing are the most
common mediums used as an initial source, thereafter the innovation diffuses through the
community via various adopter roles and in different stages (explorer, pioneer, skeptic,
paranoid, or laggard).
Mobile marketing is seen as a key medium through which awareness of m-commerce
has been generated, however, this method suffers several setbacks. Firstly, marketing via the
mobile creates problems of perceived privacy and risk. Secondly, SMS advertisements are

Copyright UCT
DRIVERS OF M-COMMERCE IN AFRICA 42
generally perceived as irritating by customers. Lastly, there are technological challenges that
exist and limit delivery of the products core values through this medium.
Businesses can reduce the effects of the drawbacks in several ways. To reduce
irritability, vendors can ask the consumers for permission to send them marketing
information via their mobile phones. To build trust, m-commerce service providers should
encourage customers to use their services often by offering incentives, being efficient, cost
effective and convent. In order to promote use, vendors should also strive to ensure that m-
commerce offerings are consistent and flexible to accommodate customer requirements.
Research Methodology
In this chapter, the methodology used to conduct this research is described. The
question to be answered in this research entails inquiry into the factors that influence the
adoption of m-commerce in Kenya and South Africa. The type of method employed was
based on the form and nature of the research issue.
Research Approach and Strategy
A researcher who wants to investigate a phenomenon finds himself thinking about
issues such as, why it is necessary to study the phenomenon, what kind of knowledge is to be
developed, what the best way to gain knowledge is, and who will benefit from the study
(Harnesk, 2004). Since this research aims to identify the factors that influence the adoption
of m-commerce in Kenya and South Africa, a deductive approach was adopted. This
approach was selected for two reasons. Firstly, it is valuable for using hypothesis to test
theory. Secondly, it takes a standpoint in the general principles in the theory to make more
specific conclusions from empirical data (Leedy & Ormrod, 2009). The approach is
illustrated below.
Theory Hypothesis Data Analysis Finding Hypothesis Confirmation/Rejection Revision of
Theory

Copyright UCT
DRIVERS OF M-COMMERCE IN AFRICA 43
A quantitative research strategy was applied by collecting data from Kenya and South
Africa, as well as secondary data sources. This methodology was selected because
quantitative data is more efficient in testing hypothesis (Bryman & Bell, 2007). Because this
method has been used in similar studies, for example Wei & Chong (2008) used the same
strategy to study the drivers of m-commerce in Malaysia; the results of this research could be
comparable to those obtained from previous research studies.
Research Design
This research is exploratory in nature, primarily aiming to gain an understanding of
the driving factors of m-commerce. The research adopted a cross-sectional approach which
entails the collection of quantifiable data on a number of variables from more than one
participant at single point in time (Leedy & Ormrod, 2009).
The cross-sectional approach was suitable for several reasons. Firstly, because of the
short time available for the research, longitudinal and experimental designs were not possible.
Data was collected from a non defined group of people in a relatively short period of time.
Secondly, this method allows us possibility to compare results with findings from previous
studies on m-commerce based on the same approach. Lastly, although this design cannot rule
out the possibility of rival hypotheses, it is good for exploratory research and the data can be
used by other researchers. One disadvantage of this method however, is that it is difficult to
establish time and order; hence we cannot ascertain causal effect. Also, since the data is
collected at a single time point only, we cannot measure the changes that are occurring over
time. However, the results and data of this research may be used by other researchers in the
future, if an evaluation of changes over time is required.
Data Collection Methods
This research required data from both primary and secondary sources. Primary data
was collected from individuals along defined variables. Secondary data was obtained from a

Copyright UCT
DRIVERS OF M-COMMERCE IN AFRICA 44
variety of other sources like technology reports, government websites, statistical agencies,
mobile phone operator websites and a host of telecommunications companies that play a role
in the development of technology within the African continent. Primary data was collected
via self filled questionnaires distributed at random both on hard copy and electronically.
Participants
Financial constraints precluded administration by a professional marketing research
company. Data were collected using snowball sampling techniques. While steps were taken
to develop random sampling points to begin the sampling and to reach participants without
internet access, the samples should be viewed as convenience samples. Data were collected
in Kenya and South Africa via self-completion questionnaires that were administered over the
internet and on paper. Self response surveys have a likelihood of low responses, thus a total
of 340 questionnaires were distributed, 170 in each country.
Research Instrument
This phase involved the use of a cross-sectional self completion questionnaire to test
the intention to use m-commerce. The questionnaire had 32 questions derived from the
constructs of TAM, TRA and DOI (Francis et al., 2004). This method was selected because
it was cheap as well as able to provide a rapid turnaround of data. Surveys are also
advantageous in their ability to make inferences about consumer behaviour for given
populations based on a sample (Babbie, 1990). A pilot survey was conducted with 20
respondents in order to test suitability of the test instrument. Results of the pilot
demonstrated that the original questionnaire contained ambiguous questions, as well as some
that needed rephrasing in order to accurately reflect the themes being tested. The revised
questionnaire was used in a second pilot done with 10 respondents. The result of this pilot
showed that it was easier to understand and as a result the data captured was more accurate.

Copyright UCT
DRIVERS OF M-COMMERCE IN AFRICA 45
Subsequently this revised instrument was made available both online and in hard copies. See
appendix 2 for the survey instrument used.
Research Criteria and Validity
Validity and reliability reflect the degree to which we may have errors in our
measurements (Leedy & Ormrod, 2009). Reliability of the research was dependent on the
design of the questionnaire. In order to achieve this, effort was put to ensure that the
questions in the questionnaire were straight forward, easy to understand and unambiguous.
The data was standardized in order to minimize the chance of collecting erroneous
information and to ensure homogeneity.
Confirmability is the ability of the researcher to remain objective and not allow
personal preferences to interfere with the findings due to bias (Bryman & Bell, 2007). In
order to achieve confirmability, the research was supervised by an experienced senior
researcher.
Data Analysis Methods
The exploratory and deductive nature of this research lends itself to the quantitative
research process (Bryman & Bell, 2007). The analysis method followed was similar to a
grounded theory where a body of data was coded and distilled into concepts (Bryman & Bell,
2007). In this case, the concepts were derived from the theories of TAM and DOI. Based on
these concepts, hypotheses were created around the relationships between constructs of trust
(T), perceived usefulness (PU), perceived ease of use (PEOU), attitude (A) and intention to
use (IU). The data was then coded in order to facilitate quantitative analysis.
Since this research was based on specific hypothetical constructs, the analysis
contained reliability and validity tests followed by factor analysis in the form of correlation
and regression analysis. Basic aggregation was done using Microsoft Excel. All hypotheses

Copyright UCT
DRIVERS OF M-COMMERCE IN AFRICA 46
were tested simultaneously using latent variable partial least squares analysis, which was
implemented using the SmartPLS statistical package.
Results
This chapter presents the research findings from the study. The first section presents
the descriptive results of the qualitative variables in order to show a demographic profile of
the survey respondents. The section also presents results of respondent preferences for
mobile providers as well as an indication of how they use their mobile phones. The second
section presents an empirical analysis of behavioural attributes captured. The final section
compares the results to the research hypothesis.
Sample Characteristics
A total of 340 self-response questionnaires were distributed. 248 questionnaires were
received back, demonstrating a 73% response rate. Of those received back, 25 were either
incomplete or unusable. The analysis was thus done on 223 completed surveys (n=223).
The demographic profile is presented in Table 4. Of the respondents, 49% were male
while 51% were female. 23% were students, 66% were employed, while 11% ran their own
ventures. The age profile demonstrated that, a majority (46%) of the respondents were
between 18 to 30 years old. 44% were between 31 and 40 years, while only 10% were older
than 40 years.

Copyright UCT
DRIVERS OF M-COMMERCE IN AFRICA 47
Table 4 Participants
Participants
Kenya (n=114)
Number Percentage
Gender Male 52 46%
Female 62 54%
Occupation
Student 32 28%
Employed 65 57%
Self Employed 17 15%
Age
18-25 17 15%
25-30 39 34%
31-40 45 39%
41-50 8 7%
Over 50 5 4%
South Africa (n=109)
Gender Male 58 53%
Female 51 47%
Occupation
Student 19 17%
Employed 82 75%
Self Employed 8 7%
Age
18-25 10 9%
25-30 37 34%
31-40 53 49%
41-50 9 8%
Over 50 0 0%
Total (n=223)
Gender Male 110 49%
Female 113 51%
Occupation
Student 51 23%
Employed 147 66%
Self Employed 25 11%
Age
18-25 27 12%
25-30 76 34%
31-40 98 44%
41-50 17 8%
Over 50 5 2%

Copyright UCT
DRIVERS OF M-COMMERCE IN AFRICA 48
All the respondents in this research owned at least one mobile device. Nowadays, it is
common for consumers to subscribe to more than one mobile service provider. This was
evident in the line subscriptions shown in table 5. Vodacom and Safaricom had the most
subscribers 32% and 45% respectively, followed by MTN (21%) and Zain (22%).
Table 5 Provider Subscription
Provider Subscription
Provider Number Percentage
South Africa
Vodacom 72 32%
MTN 47 21%
Cell C 8 4%
Virgin 2 1%
Kenya
Safaricom 100 45%
Zain 50 22%
Orange 17 8%
How respondents are currently using their mobile devices was a point of keen interest.
The results of the survey (Table 6) demonstrate that only 38% used their phones for business
contact. Other mobile services that were utilized included the internet, which was the most
popular service at 85%. 30% used their phones for mobile banking, while 46% used their
phones to transfer money. Interestingly, only 11% had actually used their phones to purchase
items like food, clothes and movie tickets. 52% had used their phones to purchase mobile
based services like ring tones, music and games. These results demonstrate that at least 40%
of the respondents have used services that fall in the category of m-commerce (banking,
money transfer and purchasing items).

Copyright UCT
DRIVERS OF M-COMMERCE IN AFRICA 49
Table 6 Mobile Phone Use
Mobile Phone Use
Frequency Percent
Communication
Casual 209 94%
Business 94 38%
Other uses
Mobile banking 68 30%
Money transfer 102 46%
Mobile internet 189 85%
Purchase items e.g. food 24 11%
Purchase mobile services 115 52%
Exposure to M-commerce Services
Exposure to m-commerce services through communication ensures that consumers
are aware of the services as well as their capabilities. According to the DOI theory,
communication channels are one of the key elements that influence the adoption of an
innovation. Other elements entail the innovation itself, time and the social system within
which the innovation is made (Rogers, 1995). This survey posed questions about the
communication channels through which the respondents had come to learn about m-
commerce services. The majority, 47%, first heard about m-commerce from public
advertising (TV and radio), while 25% got to know about it from their friends, family and
social networks (Table 7).
DOI contends that mass media channels are more effective in creating knowledge of
innovations, whereas interpersonal channels are more effective in forming and changing
attitudes toward a new idea, and thus in influencing the decision to adopt or reject new
innovative ideas (Rogers, 1995). Most individuals evaluate an innovation, not on the basis of
scientific research by experts, but through the subjective evaluations of near-peers who have
adopted the innovation (Backer & Rogers, 1997). These results demonstrate that while there

Copyright UCT
DRIVERS OF M-COMMERCE IN AFRICA 50
is considerable exposure through media channels in Kenya and South Africa, most
respondents appear not to have been influenced enough to actually adopt the technology.
According to Table 7, while 98% of respondents had heard about m-commerce, only 11%
had purchased items like food, 30% had used m-commerce for banking and 46% mainly from
Kenya, for money transfer (Table 6).
Table 7 Exposure to m-commerce
Exposure to m-commerce
Source Percentage
TV/Radio 47%
Friends/Family 25%
Other 26%
Never 2%
According to TAM, exposure is not enough. Attitude formed by consumers about the
technology plays a significant role in adoption behavior. An empirical analysis was used to
evaluate other perceptual aspects that influence the intention to use m-commerce.
Measurement Validation
An empirical study was conducted in the second part of the analysis. From the
questionnaire, the latent variables analysed were perceived trust (T), perceived usefulness
(PU), perceived ease of use (PEOU), behavioral intention (IU), and consumer attitude (A).
The questionnaire measured the variables on a five-point Likert-style scale, with responses
ranging from 1 = ―strongly disagree,‖ 2 = ―disagree‖, 3 = ―neutral‖, 4 = ―agree‖ and 5 =
―strongly agree‖.
Testing the research model included two stages, estimation of the measurement model
and the structural model. In the estimation of the measurement model, the psychometric
properties of the measures were evaluated in terms of reliability and validity. In the structural
model, path coefficients were examined to determine the precision of the PLS estimates.
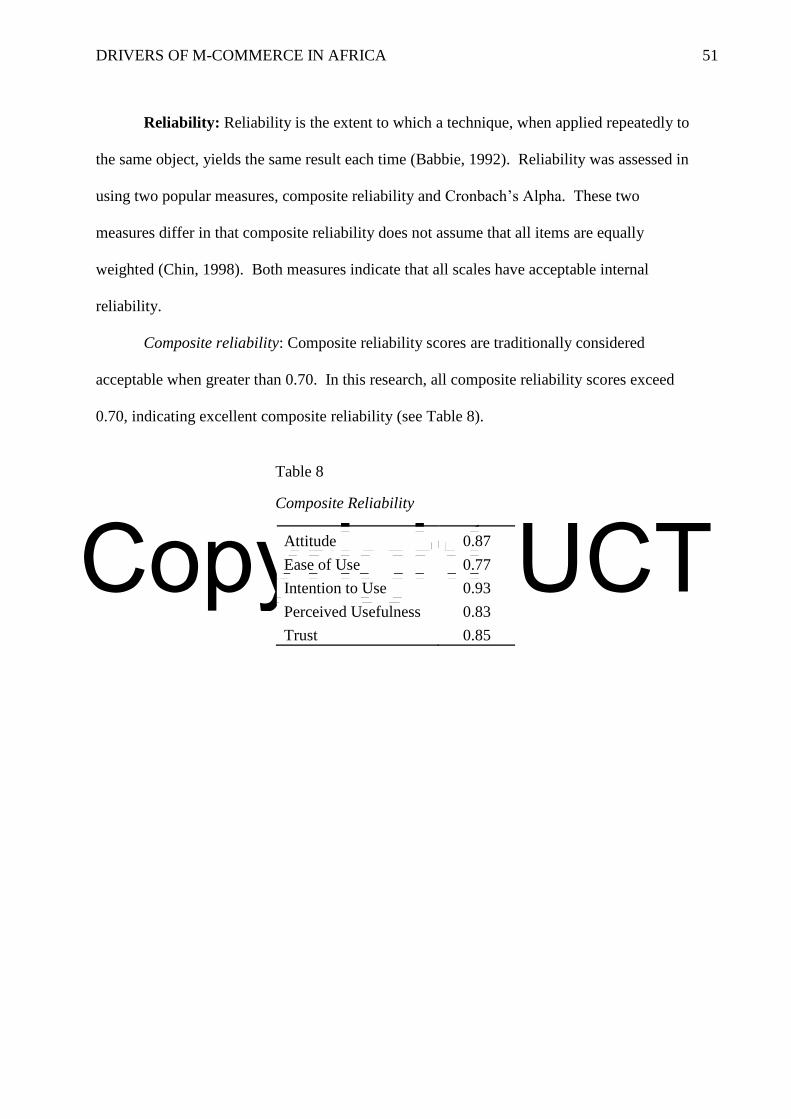
Copyright UCT
DRIVERS OF M-COMMERCE IN AFRICA 51
Reliability: Reliability is the extent to which a technique, when applied repeatedly to
the same object, yields the same result each time (Babbie, 1992). Reliability was assessed in
using two popular measures, composite reliability and Cronbach’s Alpha. These two
measures differ in that composite reliability does not assume that all items are equally
weighted (Chin, 1998). Both measures indicate that all scales have acceptable internal
reliability.
Composite reliability: Composite reliability scores are traditionally considered
acceptable when greater than 0.70. In this research, all composite reliability scores exceed
0.70, indicating excellent composite reliability (see Table 8).
Table 8 Composite Reliability
Composite Reliability
Attitude 0.87
Ease of Use 0.77
Intention to Use 0.93
Perceived Usefulness 0.83
Trust 0.85
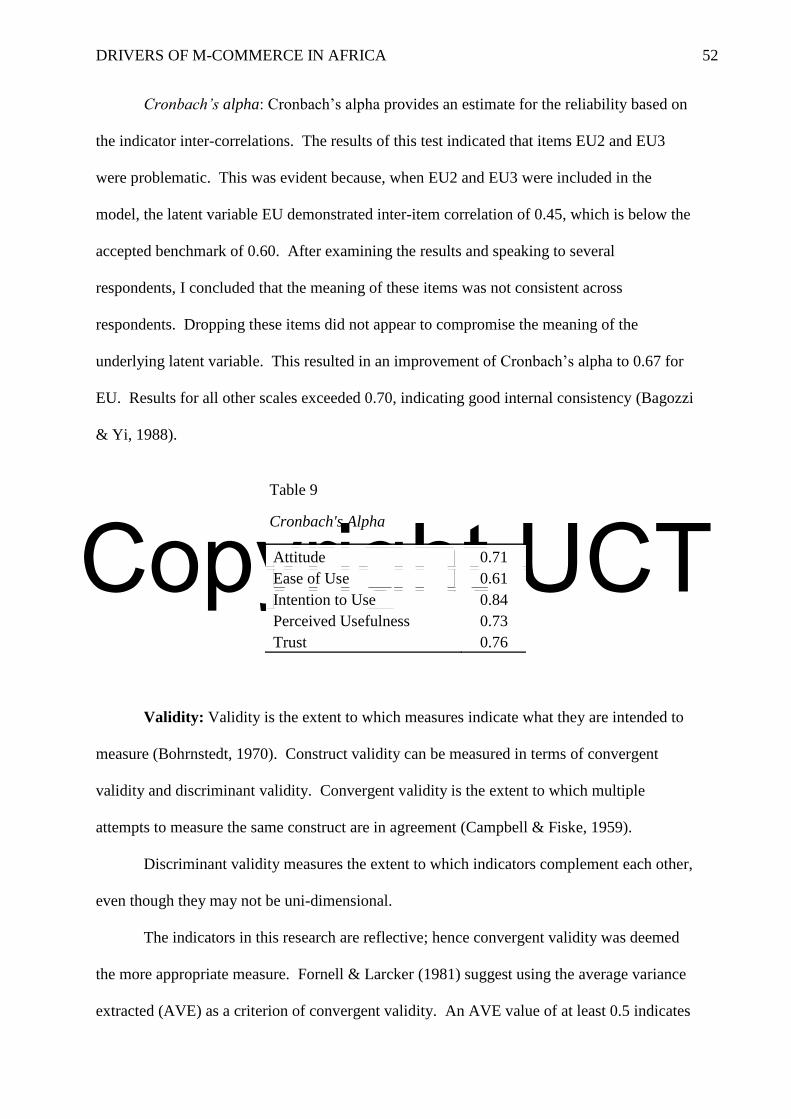
Copyright UCT
DRIVERS OF M-COMMERCE IN AFRICA 52
Cronbach’s alpha: Cronbach’s alpha provides an estimate for the reliability based on
the indicator inter-correlations. The results of this test indicated that items EU2 and EU3
were problematic. This was evident because, when EU2 and EU3 were included in the
model, the latent variable EU demonstrated inter-item correlation of 0.45, which is below the
accepted benchmark of 0.60. After examining the results and speaking to several
respondents, I concluded that the meaning of these items was not consistent across
respondents. Dropping these items did not appear to compromise the meaning of the
underlying latent variable. This resulted in an improvement of Cronbach’s alpha to 0.67 for
EU. Results for all other scales exceeded 0.70, indicating good internal consistency (Bagozzi
& Yi, 1988).
Table 9 Cronbach's Alpha
Cronbach's Alpha
Attitude 0.71
Ease of Use 0.61
Intention to Use 0.84
Perceived Usefulness 0.73
Trust 0.76
Validity: Validity is the extent to which measures indicate what they are intended to
measure (Bohrnstedt, 1970). Construct validity can be measured in terms of convergent
validity and discriminant validity. Convergent validity is the extent to which multiple
attempts to measure the same construct are in agreement (Campbell & Fiske, 1959).
Discriminant validity measures the extent to which indicators complement each other,
even though they may not be uni-dimensional.
The indicators in this research are reflective; hence convergent validity was deemed
the more appropriate measure. Fornell & Larcker (1981) suggest using the average variance
extracted (AVE) as a criterion of convergent validity. An AVE value of at least 0.5 indicates

Copyright UCT
DRIVERS OF M-COMMERCE IN AFRICA 53
sufficient convergent validity, meaning that a latent variable is able to explain more than half
of the variance of its indicators on average. With the indicators EU2 and EU3, the analysis
resulted in an AVE value of 0.36 for the latent variable EU (Table 10). Removal of these
indicators resulted in a value of 0.56, which is considered acceptable. The Indicators EU2
and EU3 were subsequently removed from further analysis. As shown in table 11, all other
variables demonstrated AVE values greater than 0.5. Since our model uses reflective
indicators, all loadings are statistically significant at the .05 level.
Table 10 AVE with EU2 & EU3
AVE with EU2 & EU3
Attitude 0.77
Ease of Use 0.36
Intention to Use 0.86
Perceived Usefulness 0.55
Trust 0.59
Table 11 AVE without EU2 & EU3
AVE without EU2 & EU3
Attitude 0.77
Ease of Use 0.56
Intention to Use 0.86
Perceived Usefulness 0.55
Trust 0.59
The hypothesised relations were assessed simultaneously in a latent variable partial
least squared model. The structural model depicts the relationships among the constructs
which were measured using multiple indicators (see Figure 5). The model was implemented
using smart PLS 2.0 M3, options: Path Weighting, data metric (mean0, var1), maximum
iterations 300. In order to facilitate statistical significance tests of effect size estimates for the

Copyright UCT
DRIVERS OF M-COMMERCE IN AFRICA 54
structural and measurement model, 1500 bootstrap estimates were run (Davison & Hinkley,
2003). For each bootstrap estimate, 200 cases were selected randomly from the total of 234
cases.
The Measurement Model
The results for the measurement model are reported in Table 12. The first column
reports the mean effect size estimate for each scale item to its intended latent variable (i.e.,
the outer loading for that item). All measurement items have a statistically-significant
loading on their latent variable (t > 2.58 indicates p < .01), which is an indication of
convergent validity.
Table 12 Measurement Model (Indicators)
Measurement Model (indicators)
Mean
effect
Standard
deviation
Standard
error t-statistic
AT1_21 <- Attitude 0.90 0.01 0.01 72.08
AT2_27 <- Attitude 0.88 0.02 0.02 42.71
EU1_10 <- Ease of Use 0.71 0.06 0.06 11.76
EU4_24 <- Ease of Use 0.69 0.05 0.05 13.88
EU5_31 <- Ease of Use 0.84 0.03 0.03 31.17
EU6_32 <- Ease of Use 0.60 0.07 0.07 9.20
IU1_18 <- Intention to Use 0.92 0.01 0.01 76.64
IU2_22 <- Intention to Use 0.93 0.01 0.01 92.78
PU1_13 <- Perceived Usefulness 0.76 0.04 0.04 19.49
PU2_14 <- Perceived Usefulness 0.80 0.03 0.03 26.75
PU3_16 <- Perceived Usefulness 0.58 0.07 0.07 8.15
PU4_17 <- Perceived Usefulness 0.78 0.03 0.03 22.79
T1_9 <- Trust 0.78 0.03 0.03 23.22
T2_25 <- Trust 0.69 0.05 0.05 13.38
T3_29 <- Trust 0.80 0.03 0.03 29.35
T4_12 <- Trust 0.81 0.03 0.03 24.53
Note: Reported are partial least squares regression coefficients

Copyright UCT
DRIVERS OF M-COMMERCE IN AFRICA 55
Testing the Structural Model
Since SmartPLS does not calculate any goodness-of-fit values, R2 values were
evaluated to assess the ability of various proposed relationships to predict a significant degree
of explanatory power in each construct, while t-values were assessed to determine the
strength of the various paths.
R2 for intended use (IU) is 0.73, indicating that the total effects of perceived
usefulness (PU), perceived ease of use (EU), attitude (A) and trust (T) explain 73% of the
variance in intention to use (IU). R2 for attitude is 0.61, indicating that perceived usefulness;
trust and perceived ease of use explain approximately 61% of the variance in attitude. These
results indicate that the model explains the variance for the endogenous variables accurately
and is thus effective in explaining the variance of intended use.
Table 13 Measurement Model
Measurement Model
R Square
Attitude 0.61
Ease of Use 0.31
Intention to Use 0.73
Perceived Usefulness 0.43
Trust

Copyright UCT
DRIVERS OF M-COMMERCE IN AFRICA 56
Figure 5: Structural Model
Figure 5 depicts the structural model showing path coefficients and R2 for dependent
variables. The R2 values for each dependent variable indicate that the model explains
variances for attitude (61%) and intention to use (73%).
Table 14 Path Coefficients
Path Coefficients
Sample
Mean
(M)
Standard
Deviation
(STDEV)
Standard
Error
(STERR)
T Statistics
(|O/STERR
|)
Attitude -> Intention to Use 0.45 0.03 0.03 14.56
Ease of Use -> Attitude 0.33 0.03 0.03 11.06
Ease of Use -> Intention to Use 0.07 0.02 0.02 3.08
Ease of Use -> Perceived Usefulness 0.48 0.03 0.03 19.10
Perceived Usefulness -> Attitude 0.36 0.02 0.02 14.60
Perceived Usefulness -> Intention to Use 0.43 0.02 0.02 21.60
Trust -> Attitude 0.23 0.02 0.02 9.54
Trust -> Ease of Use 0.56 0.02 0.02 30.70
Trust -> Perceived Usefulness 0.25 0.02 0.02 11.36

Copyright UCT
DRIVERS OF M-COMMERCE IN AFRICA 57
Structural Model Results
The total and indirect effects are reported in tables 15 and 16 respectively. In
assessing the effects that perceived ease of use has on other factors, the path coefficient for
perceived ease of use to intention to use is .07 (Table 14), which is not statistically significant
at the .05 level. This suggests that perceived ease of use does not have a direct effect on
intended use of m-commerce and hence hypothesis 1 is not supported. Perceived ease of use
was however found to have a positive indirect influence on intention to use through its
positive effect on attitude (Table16).
The path coefficient for perceived ease of use to perceived usefulness is 0.48 which is
significant at the 0.05 level. This supports hypothesis 2 and implies that an increase in
perceived ease of use would influence perceived usefulness in a positive way. Hypothesis 3
states that an increase in perceived ease of use is expected to result in a positive impact on the
attitude towards m-commerce. This is supported by the results, as shown by path coefficient
for perceived ease of use to attitude (0.33), which is significant at the 0.5 level. Perceived
ease of use is also found to have an indirect influence on intention to use through its positive
relationship with perceived usefulness.
Hypothesis 4 is also supported by the results. The path coefficient for perceived
usefulness to intention to use is 0.43, which is significant at the 0.05 level. This is the second
most significant relationship demonstrated by the results. This implies that second to
attitude, perceived usefulness has the most influence on intention to use m-commerce.
Another mediating positive relationship is found between perceived usefulness and intention
to use through the positive influence that perceived usefulness has on attitude. This follows
through to support hypothesis 5 which states that perceived usefulness has a positive
influence on attitude. This is demonstrated by a path the coefficient of 0.36, which is
significant at 0.05.

Copyright UCT
DRIVERS OF M-COMMERCE IN AFRICA 58
Table 15 Summary of Total Effects
Summary of Total Effects
Sample
Mean
(M)
Standard
Deviation
(STDEV)
Standard
Error
(STERR) T Statistics
(|O/STERR|)
Attitude -> Intention to Use 0.44 0.03 0.03 16.53
Ease of Use -> Attitude 0.51 0.02 0.02 21.13
Ease of Use -> Intention to Use 0.50 0.02 0.02 23.59
Ease of Use -> Perceived Usefulness 0.48 0.02 0.02 20.56
Perceived Usefulness -> Attitude 0.36 0.03 0.03 13.98
Perceived Usefulness -> Intention to Use 0.59 0.02 0.02 30.46
Trust -> Attitude 0.60 0.02 0.02 36.78
Trust -> Ease of Use 0.56 0.02 0.02 31.71
Trust -> Intention to Use 0.53 0.02 0.02 34.12
Trust -> Perceived Usefulness 0.52 0.02 0.02 27.47
Note. Reported are the sample means, standard deviations, standard errors and t-statistics
Table 16 Indirect Effects
Indirect Effects
Mediator Attitude Intention to use
Perceived ease of use -> Intention to use Attitude 0.23
Perceived usefulness -> Intention to use Attitude 0.16
Perceived ease of use -> Attitude Usefulness 0.17
Trust -> Intention to use Attitude 0.27
Trust -> Intention to use Usefulness 0.31
Trust -> Intention to use Ease of use 0.28
Trust -> Attitude Ease of use 0.28
Trust -> Attitude Usefulness 0.19
Table 14 shows that the coefficient for attitude to intention to use is 0.45. This is the
most significant effect on intention to use at the 0.05 level. This supports hypothesis 6 and
also appears to be the most significant determinant for intention to use m-commerce. Attitude
also plays an important mediating role for perceived ease of use, trust and perceived
usefulness.

Copyright UCT
DRIVERS OF M-COMMERCE IN AFRICA 59
The results also support hypothesis 7 which suggests that trust has a positive impact
on attitude. This implies that trust has a significant influence on consumer attitude towards
m-commerce. As seen in hypothesis 3, attitude is the most significant determinant for
intention to use. Through its influence on attitude, trust is seen to have an implicit positive
influence on intention to use. Trust was also expected to influence perceived ease of use.
This is supported by the results (coefficient 0.56), which implies that an increase in perceived
trust would influence the perceived ease of use positively. This result supports hypothesis 8.
In addition, through this influence, trust demonstrates a positive effect on the intention to use.
Finally, the coefficient for trust to perceived usefulness is 0.25, which is significant at
the 0.5 level and supports hypothesis 9. In addition, indirectly, trust is also found to have a
positive influence on intention to use through its positive relationship with perceived
usefulness.
Summary of Data Analysis
The previous section presented the results of the data analysis. Descriptive statistics
were provided to illustrate the demographic profile of the respondents. The results of the
estimation of the measurement and structural models were presented. In the estimation of the
measurement model, the psychometric properties of the measures were assessed in terms of
reliability and validity. In the estimation of the structural model, the validity of the research
model was evaluated. The results of hypotheses testing were also presented. The next
section will present a summary of the study, conclusion, implications for practice, as well as
recommendations for future research.
Findings and Discussion
This section discusses the findings in connection with the research question, which
was stated as; what drives M-commerce in Kenya and South Africa? In order to address the

Copyright UCT
DRIVERS OF M-COMMERCE IN AFRICA 60
question, relationships between trust, perceived ease of use, perceived usefulness, attitude
and intention to use were examined.
TAM implies that both perceived usefulness and perceived ease of use are expected to
have significant direct effects on intended use. Consistent with the findings of prior research,
our results demonstrate that the effect of perceived usefulness on intended use is the most
significant. However, perceived ease of use was found not to demonstrate a significant direct
effect on the intention to use m-commerce. An indirect effect was however traced through
the positive influence that perceived ease of use has on attitude.
Although ease of use helps to engender a positive attitude, users are more likely to
adopt m-commerce if they perceive it to be useful, irrespective of the ease of use. These
results suggest that the user’s positive beliefs about usefulness influence their acceptance of a
technological innovation system. These results support the assertion that ease of use cannot
compensate for a system that lacks functionality (Davis, Bagozzi, & Warshaw, 1989). This is
also confirmed by previous studies which have shown that usefulness has a stronger effect on
user acceptance of an information system than ease of use (Agarwal & Karahanna, 1992).
The second set of relationships that were examined were those between perceived
trust, perceived usefulness, perceived ease of use and attitude towards m-commerce.
Together, trust, ease of use and perceived usefulness explained 61% of the variance in
attitude
Among these antecedents, trust has positive influence on all of them, with the
strongest one shown towards perceived ease of use. This suggests that when users perceive
m-commerce as trustworthy, they are also likely to perceive it as easy to use. This perception
in turn influences the attitude towards m-commerce. Trust and perceived ease of use together
have a positive influence on the perception that m-commerce is useful, explaining 43% of the
variance in perceived usefulness. According to the results, perceived ease of use has a

Copyright UCT
DRIVERS OF M-COMMERCE IN AFRICA 61
significant effect on perceived usefulness which according to TAM, demonstrates that users
are likely to accept m-commerce, if they find that it can help improve performance by
reducing effort needed to do the same task.
Trust appears to be a very important factor that influences ease of use, usefulness and
most importantly attitude. Attitude has been found to have the most significant influence on
intention to use. It is crucial that practitioners take time to build trust of m-commerce in
users. Trust not only takes time to engender, but is also fragile and easily destroyed, hence
the process of continuous trust development deserves special attention. Many successful
methods adopted by e-commerce companies to overcome trust barriers are also applicable to
mobile commerce. For example, Amazon provides an unconditional guarantee of security
and is willing to cover any losses due to credit card fraud. Travelocity posts a detailed
explanation of its privacy policies on its Web site. eBay provides a forum for buyers and
sellers to rate each other after transactions. This has to be continuously developed (Siau &
Shen, 2003).
Summary of the Study
The purpose of this study was to determine the factors that influence the use of m-
commerce in Kenya and South Africa. Current trends indicate that mobile usage has grown
phenomenally in the African continent. With it has come a myriad of value added services,
some of which encompass aspects of mobile commerce. Plagued by expensive and
inadequate telecommunications infrastructure, the African continent has been slow to adopt
highly technical products and services. However, m-commerce has shown interesting trends
in terms of continuous adoption in the African continent. Thus, this study aimed to provide a
better understanding of the determinants of user acceptance of m-commerce. How user
perceptions relate to intention to use m-commerce was examined.

Copyright UCT
DRIVERS OF M-COMMERCE IN AFRICA 62
TAM, one of the most prominent models, provided the theoretical perspective for this
study and was used to explain the effects of user perceptions and attitudes on their system
usage behavior. TAM has received extensive theoretical and empirical support by a number
of studies. The study adds to the realm and will provide practitioners with insights into the
strategies for facilitating user acceptance and intention to use m-commerce services.
This study employed a cross-sectional field study using a self completion
questionnaire method which was disseminated both as hard copies and via the web. Random
respondents from Kenya and South Africa were targeted. The instrument used to measure the
constructs was developed by adopting existing scales from previous studies and constructing
new scales where necessary. A pilot test was conducted to verify that the instrument was
able to collect the intended information effectively. Subsequently, several changes were
made to make it more effective and easier to understand.
A final sample of 234 responses was analysed. The measurement model was tested to
assess reliability and validity of the scales. The structural model was tested to examine the
relationships between the constructs in the research model using PLS software. The
responses from this study were examined at the p<.05 level of significance. Overall, the
research model was found effective in explaining 73% of the variance in intended use and
61% of the variance in attitude towards m-commerce.
Conclusion
The study examined the effects of user perceptions on m-commerce on their intention
to use it. TAM provides a theoretical framework to explain user acceptance of an information
system based on user perceptions. The results in this study demonstrate that user perceptions
of usefulness, trust and ease of use are fundamental determinants of user acceptance of an
information system. The following conclusions are thereby drawn.

Copyright UCT
DRIVERS OF M-COMMERCE IN AFRICA 63
1. According to the research model developed in this research, trust, perceived usefulness,
perceived ease of use and attitude explain 73% of the variance that is seen in user
intention to use m-commerce. Influencing consumer attitude will have the most
significant direct effect towards intention to use. Attitude also acts as a mediating
factor for trust, perceived usefulness and perceived ease of use.
2. Both perceived ease of use and perceived usefulness have positive effect on intended
use of m-commerce. However, perceived usefulness has a stronger direct effect on
user acceptance than ease of use. In fact, perceived ease of use only demonstrates an
indirect effect to intention to use, through attitude. The finding here is that user
acceptance of m-commerce depends primarily on how useful the users perceive it to
be, irrespective of how easy to use it is.
3. Perceived trust has a significant influence on perceived usefulness, perceived ease of
use and attitude. These results imply that if users perceive m-commerce as
trustworthy then they are likely to have a positive attitude towards it. Trust is thus
seen as a very significant factor that influences attitude. Attitude has been shown to
have the most significant effect on intention to use.
This conclusion may be useful for management to focus on the key drivers for m-commerce
as a medium for business.
Implications for Practice
The findings from this study have meaningful managerial implications and raise
challenging questions for future research. The model provides a useful framework for
managers who need to understand the drivers of m-commerce. The results illustrate the
importance of increasing perceived usefulness in order to encourage adoption. Also
important to note is the fact that adoption attitude and behavior are largely influenced by the

Copyright UCT
DRIVERS OF M-COMMERCE IN AFRICA 64
endorsement of family and friends. Marketing practitioners need to take these factors into
consideration when promoting m-commerce.
The results indicate that trust and privacy issues are important concerns for
consumers. M-commerce providers should be patient with potential customers and provide
as much information as possible in order to build trust. They should also demonstrate the
willingness to take responsibility for any losses incurred by customers while conducting m-
commerce transactions.
To reduce irritability, mobile marketing practitioners need to obtain permission from
customers before they send m-commerce related material via mobile phones.
The ease of using m-commerce plays an indirect role in the adoption of this
innovation. Practitioners should strive to ensure that m-commerce can be conducted with
standard phones using the same key strokes, menus and terminology used in the day to day
operation of a mobile phone.
By doing all the above, practitioners are likely to encourage a positive attitude
towards m-commerce. Attitude has been shown to have the most significant impact on
intention to use.

Copyright UCT
DRIVERS OF M-COMMERCE IN AFRICA 65
Recommendations for Future Research
The results demonstrate that ease of use does not have a significant direct effect on
intention to use m-commerce. However, ease of use has a significant effect on
attitude. Additional research is needed to determine other factors that mediate the
relationship between ease of use and intention to use.
The results indicated that perceived usefulness has significant effect on intended use.
Ease of use was reported to have significant influence on perceived usefulness.
Further research can be pursued to investigate the factors that determine ease of use.
Perceived Trust was found to have significant effect on attitude. Further research can
be pursued to identify the antecedents of trust.

Copyright UCT
DRIVERS OF M-COMMERCE IN AFRICA 66
Appendices
Appendix 1: Technology Readiness Index of African Countries
Country Technology Readiness
Africa Rank Technology Readiness World
Rank
South Africa 1 42
Tunisia 2 52
Mauritius 3 55
Morocco 4 78
Senegal 5 81
Egypt 6 84
Namibia 7 85
Botswana 8 89
Gambia 9 91
Kenya 10 93
Nigeria 11 94
Libya 12 98
Cote d’Ivoire 13 99
Mauritania 14 102
Mali 15 105
Zambia 16 106
Cameroon 17 110
Madagascar 18 111
Benin 19 113
Algeria 20 114
Ghana 21 115
Mozambique 22 116
Tanzania 23 117
Burkina Faso 24 120
Uganda 25 121
Lesotho 26 125
Malawi 27 127
Zimbabwe 28 129
Burundi 29 131
Ethiopia 30 132
Chad 31 134

Copyright UCT
DRIVERS OF M-COMMERCE IN AFRICA 67
Appendix 2: Model TAM Questionnaire
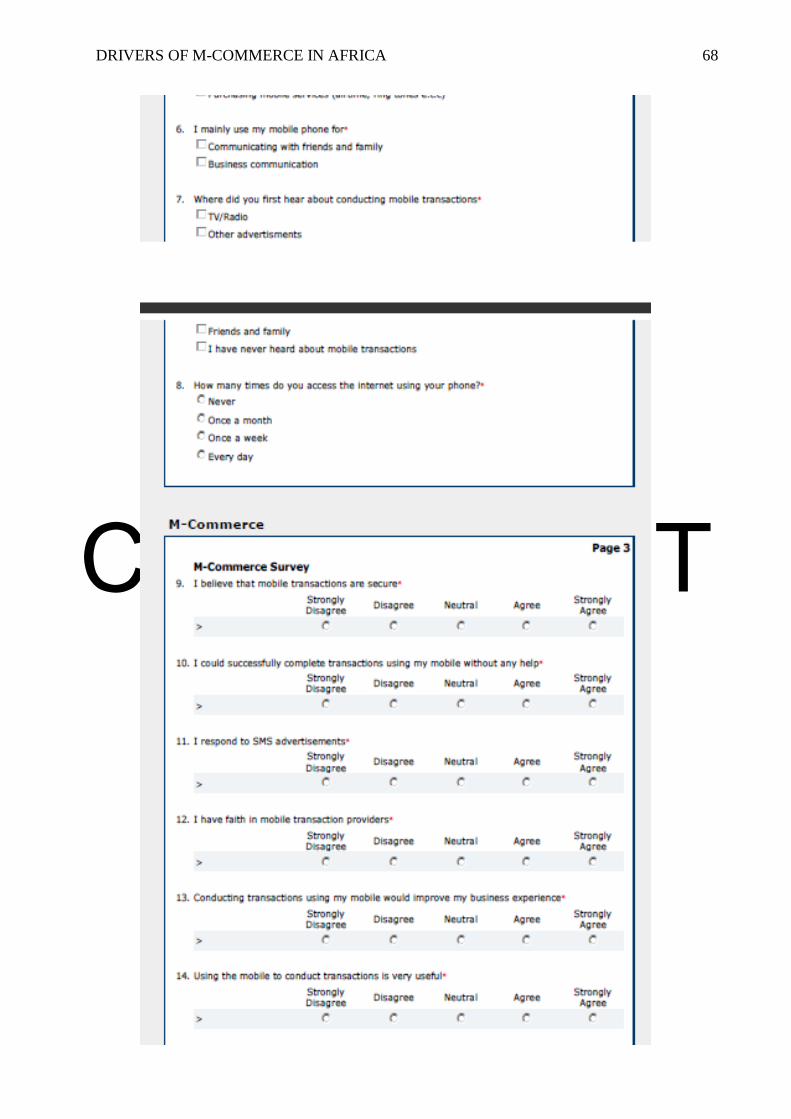
Copyright UCT
DRIVERS OF M-COMMERCE IN AFRICA 68

Copyright UCT
DRIVERS OF M-COMMERCE IN AFRICA 69

Copyright UCT
DRIVERS OF M-COMMERCE IN AFRICA 70

Copyright UCT
DRIVERS OF M-COMMERCE IN AFRICA 71

Copyright UCT
DRIVERS OF M-COMMERCE IN AFRICA 72
Bibliography
ABI Research. (2010, February 16). Retrieved August 5, 2010, from Shopping by Mobile
Will Grow to $119 Billion in 2015: http://www.abiresearch.com/press/1605
Abu Bakar, F., & Osman. (2005). Towards the future of mobile commerce (m-commerce) in
Malaysia. IADIS International Conference. Algrave, Portugal.
Agarwal, R., & Karahanna, E. (1992, April). Perceived usefulness, ease of use and usage of
information technology: A replication. MIS Quarterly , pp. 227-247.
Airtel, B. (2009, August 26). m-commerce on voice. Retrieved November 02, 2010, from
Teck In: http://teck.in/mchek-on-airtel-airtels-m-commerce-on-voice.html
Ajzen, I. (1991). The theory of planned behavior. Organizational Behavior and Human
Decision Processes , 179–211.
Ankeny, J. (2008, January 14). Forecast: Mobile Marketing Growth. Retrieved July 16, 2010,
from http://www.fiercemobilecontent.com:
http://www.fiercemobilecontent.com/story/forecast-mobile-marketing-growth-24b-
2013/2008-01-14
Atkins, T. (2005, February 26). 'Digital Divide' Narrowing Fast, World Bank Says. Retrieved
June 16, 2010, from Technology For Humanity:
http://www.technologyforhumanity.org/articles/dividecloses.html
Babbie, E. (1990). Survey Research Methods (2nd
ed). Belmont,CA: Wadsworth.
Babbie, E. (1992). The practice of social research (6th ed.). Belmont, CA: Wadsworth.
Babbie, E. (1991). Social worlds, individual differences, and implementation: predicting
attitudes toward a medical information system. Information Management , 119-136.
Backer, T. E., & Rogers, E. M. (1997). Diffusion of innovations theory and work-site AIDS
programs. Journal of health communication, 3(1), 17-28. Retrieved from
http://www.pubmedcentral.nih.gov/articlerender.fcgi?artid=2679503&tool=pmcentrez&
rendertype=abstract.
Bagozzi, R. P., & Yi, Y. (1988). On the evaluation of structural evaluation models. Journal of
the Academy of Marketing Science , 74-94.
Baldi, S., & Thaung, H. P.-P. (2002). The Entertaining Way to M-Commerce: Japan’s
Approach to the Mobile Internet - A Model for Europe?. Electronic Markets, 12(1), 6-
13. doi: 10.1080/101967802753433218.
Banzal, S. (2010). Table of contents. Journal of deaf studies and deaf education, 15(4), NP.
doi: 10.1093/deafed/enq042.

Copyright UCT
DRIVERS OF M-COMMERCE IN AFRICA 73
Barnett, N., Hodges, S., & Wilshire, M. J. (2000). m-commerce: An Operator’s Manual.
McKinsey Quarterly, (3), 163-173.
BMI. (2010, July 30). Kenya Business Forecast Report. Retrieved September 13, 2010, from
Business Monitor International:
http://store.businessmonitor.com/bf/kenya_business_forecast_report/
Boadi, R. A., & Shaik, A. G. (2006). MASTER’S THESIS M-commerce Breakthrough.
Systems Science.
Bohrnstedt, G. W. (1970). Reliability and Valitidity in attitude measurement. Chicago: Rand
McNally.
Bryman, A., & Bell, E. (2007). Business Research Methods. Oxford: Oxford University
Press.
Business Week. (2009, October 15). Retrieved August 12, 2010, from M-Commerce's Big
Moment:
http://www.businessweek.com/technology/content/oct2009/tc20091011_278825.htm
Campbell, D. T., & Fiske, D. F. (1959, 56). Convergent and discriminant validation by the
multitrait multimethod matrix. Psychological Bulletin , pp. 81-105.
Carroll, A., Barnes, S. J., & Fletcher, K. (2007). Consumer perceptions and attitudes towards
SMS advertising : recent evidence from New Zealand. International Journal, 26(1), 79-
98.
CCK. (2010, March 16). Sector Statistical Reports. Retrieved September 13, 2010, from
Communications Commission of Kenya: http://www.cck.go.ke/resc/statcs.html
Chin, W. (1998). The partial least squares approach to structural equation modeling. In G.
A. Marcoulides (Ed.), Modern methods for business research. Mawah, NJ: Lawrence
Erlbaum.
Dard, R. (2007). Mobile Technology Helps African Exporters. International Trade Forum ,
32.
Davis, F. D. (1989). Perceived Usefulness, Perceived Ease of Use, and User Acceptance of
Information Technology. MIS Quarterly, 13(3), 319. doi: 10.2307/249008.
Davis, F. D., Bagozzi, R. P., & Warshaw, P. R. (1989). User acceptance of computer
technology: A comparison of two theoretical models. Managment Science , 982-1003.
Davison, A. C., & Hinkley, D. V. (2003). Bootstrap methodsandtheirapplication (2nd ed.).
New York: CambridgeUniversityPress.
Dholakia, R. R. (2006). M-commerce: global experiences and perspectives. Heryshey: Idea
Group Inc (IGI).

Copyright UCT
DRIVERS OF M-COMMERCE IN AFRICA 74
Durlacher. (1999). Mobile Commerce Report. Retrieved 06 12, 2010, from Durlacher
Research: www.durlacher.com
El-gayar, O. (2007). Examining Students ’ Acceptance Of Tablet Pc Using TAM.
Information Systems, VIII(1).
Ewing, J. (2007). Afric Upwardly Mobile. Business Week , 66.
Feng, H., Hoegler, T., & Stucky, W. (2006). Exploring the critical success factors for mobile
commerce . International Conference on Mobile Business (ICMB’06). Copenhagen,
Denmark.
Fishbein, M., & Ajzen, I. (1980). Massachusetts and Illinois: Prentice-Hall, Inc.
Fishbein, M., & Ajzen, I. (1975). Belief, Attitude, Intention and Behavior: An Introduction
to Theory and Research. Reading, MA: Addison-Wesley.
Fornell, C., & Larcker, D. F. (1981). pp. 39-50.
Fornell, C., & Lercker, D. F. (1981). Structural Equation Models with Unobservable
Variables and Measurement Error -Algebra and Statistics. Journal of Marketing
Research , 382-388.
Francis, A. J. J., Eccles, M. P., Johnston, M., Walker, A., Grimshaw, J., Foy, R., et al. (2004).
CONSTRUCTING QUESTIONNAIRES BASED ON THE THEORY OF PLANNED
BEHAVIOUR A MANUAL for HEALTH SERVICES RESEARCHERS. Direct,
(May).
Frolick, M., & Chen, L.-D. (2004). Assessing M-Commerce Opportunities. Information
Systems Management, 21(2), 53-61. doi: 10.1201/1078/44118.21.2.20040301/80422.8.
Gartner. (2010, April). Retrieved July 15, 2010, from Gartner Outlines 10 Mobile
Technologies to Watch in 2010 and 2011:
http://www.gartner.com/it/page.jsp?id=1328113
Gatford, J. M. (2010, July 23). M-commerce - Welcome to the Future. Retrieved August 15,
2010, from Ezine Articles: http://ezinearticles.com/?M-Commerce---Welcome-to-the-
Future&id=4694273
Georgiev, G. (2009). Driving Adoption of M-Commerce with Innovative Solutions.
Networks, 1-13.
Grami, A., & Schell, B. H. (2006). Future Trends in Mobile Commerce : Service Offerings ,
Technological Advances and Security Challenges, 1-14.
Godin, S. (1999). Permission Marketing: turning strangers into friends, and friends into
customers. . New York: Simon & Schuster.

Copyright UCT
DRIVERS OF M-COMMERCE IN AFRICA 75
Haghirian, P., & Madlberger, M. (n.d.). CONSUMER ATTITUDE TOWARD
ADVERTISING VIA MOBILE DEVICES – AN EMPIRICAL INVESTIGATION.
Business.
Harnesk, D. (2004). A framework for Strategic Alignment of Business and Information
Technology in Small and Medium sized Firms. Licentiate thesis, Luleå University of
Technology; Department of Business Administration and Social Science.
Harvey, G., Deans, K. R., & Gray, B. J. (2007). Third Screen Communication and the
Adoption of Mobile Marketing : A Malaysia Perspective. Journal of Marketing, 36-47.
Hotchkiss, K. (2010, March 2nd). 4Hoteliers. Retrieved November 15, 2010, from
4Hoteliers: http://www.4hoteliers.com/4hots_nshw.php?mwi=7037
Internet World Stats. (2010, June 30). Retrieved July 13, 2010, from Internet World Stats:
http://www.internetworldstats.com/stats.htm
Kao, D. T. (2009). The impact of transaction trust on consumers’ intentions to adopt m-
commerce: a cross-cultural investigation. Cyberpsychology & behavior : the impact of
the Internet, multimedia and virtual reality on behavior and society, 12(2), 225-9. doi:
10.1089/cpb.2008.0212.
Karvonen, K., Cardholm, L., & Karlsson, S. (1999). Cultures of Trust : A Cross-Cultural
Study on the Formation of Trust in an Electronic Environment. Technology.
Kavassalis, P., Spyropoulou, N., Drossos, D., Mitrokostas, E., Gikas, G., & Hatzistamatiou,
A. (2003). Mobile Permission Marketing : Framing the Market Inquiry. International
Journal of Electronic Commerce, 8(1), 55-79.
Krishnamurthy, S., & Rights, A. (2002). Case # 7 1 NTT DoCoMo’s I-Mode Phone: A Case
Study 2, 1-41.
Leedy, P. D., & Ormrod, J. E. (2009). Practical Research:Planning and Design. New
Jersey: Pearson Education.
Leppaniemi, M., Sinisalo, J., & Karjakuoto, H. (2006). A review of mobile marketing
research. Journal of Mobile Marketing , 2-12.
Leung, K., & Antypas, J. (2001). Improving Returns on M-commerce Investments. Journal
of Business Strategy , 12-16.
Li, Y.-hui, & Huang, J.-wen. (2009). Applying Theory of Perceived Risk and Technology
Acceptance Model in the Online Shopping Channel. Engineering and Technology, 919-
925.
Li, Y.-hui, & Huang, J.-wen. (2010). Applying Theory of Perceived Risk and Technology
Acceptance Model in the Online Shopping Channel. Journal of Business, 132-138.
Luarn, P., & Lin, H. H. (2005, June). Toward an understanding of the behavioral intention to
use mobile banking. Computer in Human Behaviour , pp. 873-891.

Copyright UCT
DRIVERS OF M-COMMERCE IN AFRICA 76
Magill, K. (2009). THE MOBILE CHANNEL IS FINALLY GETTING SOME UPWARD
MOMENTUM. October, 30-33.
M-Commerce. (2010, May). Retrieved August 12, 2010, from Fierce Wireless:
http://www.fiercewireless.com/topics/mcommerce.asp
Miller, S. (2009, October 23). Definition of Mobile Commerce. Retrieved July 15, 2010,
from How to just about everything: http://www.ehow.com/facts_6069559_definition-
mobile-commerce.html
Mitchell, V.-W. (1999). Consumer perceived risk: conceptualisations and models. European
Journal of Marketing, 33(1/2), 163-195. doi: 10.1108/03090569910249229.
Mohd, Y. Y., & Muhammad, Z. (2009). Individual Differences , Perceived Ease of Use , and
Perceived Usefulness in the E-Library Usage. Knowledge Creation Diffusion Utilization,
2(1), 2-9.
Moon, J. W., & Kim, Y. G. (2001). Extending the TAM for a world-wide-web context.
Information & Management , 217-230.
Mort, G. S., & Drennan, J. (2005). Marketing m-services: Establishing a usage benefit
typology related to mobile user characteristics. Journal of Database Marketing &
Customer Strategy Management, 12(4), 327-341. doi: 10.1057/palgrave.dbm.3240269.
Moshin, M., Mudtadir, R., & Ishaq, A. (2003). Mobile commerce – the emerging frontier:
exploring the prospects, application and barriers to adoption in Pakistan. Islamabad.
Mutula, S. M. (2007). Digital Divide and Economic Development:Case Study of Sub
Saharan Africa. Emerald Insight , 481.
Nysveen, H., Pedersen, P., & Thorbjonsen, H. (2005). Intentions to Use Mobile Services:
Antecedents and Cross- Service Comparison. Journal of the Academy of Marketing
Science , 330-346.
Okazaki, S. (2005). NEW PERSPECTIVES ON M-COMMERCE RESEARCH. Current,
160-164.
Parasuraman, A., & Colby, C. L. (2001). Techno-ready Marketing. Innovation.
Portio Research. (2010, March). Retrieved August 5, 2010, from Mobile Payments 2010-
2014: http://www.portioresearch.com/Mob_payments10-14.html
Raisinghani, M. S. (2001). WAP: Transactional Technology for M-Commerce. Information
Systems Management , 8–16.
Rawood, D. (2010, July 26). Web Threats. Retrieved November 15, 2010, from Secure
Business Intelligence: http://www.scmagazineuk.com/database-hacked-at-new-zealand-
pizza-chain-to-reveal-personal-details-of-230000-customers/article/175358/

Copyright UCT
DRIVERS OF M-COMMERCE IN AFRICA 77
Rittippant, N., Witthayawarakul, J., Limpiti, P., & Lertdejdecha, N. (2009). Consumers ’
Perception of the Effectiveness of Short Message Service ( SMS ) and Multimedia
Message Service ( MMS ) as Marketing Tools. Media, 815-821.
Rogers, E. M. (1995). Diffusion of Innovations. New York: Free Press.
Sadeh, N. (2002). M-Commerce: Technologies, Services, and Business Models. New York:
Wiley Computer Publishing.
Safaricom. (2010, May 26). Safaricom Annual Report 2010. Retrieved August 16, 2010,
from Safaricom Reports & Presentations: http://www.safaricom.co.ke/index.php?id=335
Saidi, E., & Town, O. (2010). Journal of Internet Banking and Commerce. Journal of Internet
Banking and Commerce, 15(1), 1-13.
SAinfo. (2009, September 17). Mobile Banking on the Increase. Retrieved October 5, 2010,
from South Africa Info: http://www.southafrica.info/business/trends/newbusiness/cell-
171109.htm
SAInfo. (2009, November 17). South Africa's telecommunications. Retrieved September 25,
2010, from South Africa Info:
http://www.southafrica.info/business/economy/infrastructure/telecoms.htm
Science, I. M. (2001). Invited chapter under review for inclusion in the forthcoming book.
Provider.
Schutt, R. K. (1999). Investigating the social world: The process and practice of research
(2nd ed.). Thousand Oaks,CA: Pine Forge.
Siau, K., & Shen, Z. (2003). Building customer trust in mobile commerce. Communications
of the ACM, 46(4), 91-94. doi: 10.1145/641205.641211.
Stafford, T. F., & Gillenson, M. L. (2003). Mobile commerce. Communications of the ACM,
46(12), 33. doi: 10.1145/953460.953483.
Tang, T.-i. (2004). Toward An Understanding of the Behavioral Intention to Use Mobile
Banking Services. differences.
Tiwari, R., & Buse, S. (2007). The Mobile Commerce Prospects: A Strategic Analysis of
Opportunities in Banking Sector. Hamburg: Hamburg University Press.
Tsang, M. M., Ho, S.-chun, & Liang, T.-peng. (2004). Consumer Attitudes Toward Mobile
Advertising : An Empirical Study. Spring, 8(3), 65-78.
Twinomugisha, A. (2009, 06 16). m-commerce and impact on Africa. Retrieved 05 12, 2010,
from Africa Business Source:
http://www.africabusinesssource.com/articles/innovation/m-commerce-and-impact-on-
africa/
UNCTAD. (2002). E-COMMERCE AND DEVELOPMENT REPORT 2002. Development.
Copyright UCT
DRIVERS OF M-COMMERCE IN AFRICA 78
UNCTAD. (2009, 6 13). Retrieved 06 02, 2010, from Mobile penetration in Africa:
http://www.unctad.org/Templates/webflyer.asp?docid=12273&intItemID=1528&lang=1
Utiba. (2010, June). m-commerce tutorial. Retrieved October 15, 2010, from Utiba Mobility:
http://www.utiba.com/m-commerce-tutorial.html
Varshney, U., & Vetter, R. (2002). Mobile commerce: framework, applications and
networking support. Mobil Mobile Networks and Applications , 185-98.
Ververidis, C., & Polyzos, G. C. (n.d.). MOBILE MARKETING USING A LOCATION
BASED SERVICE. Communication.
Victoria, C. A., & June, J. (2002). WHAT IS IT ? WHAT WILL IT MEAN FOR
CONSUMERS ?, (June).
Waverman, L., Meschi, M., & Fuss, M. (2005). The Impact of Telecoms on Economic
Growth in Developing Countries, (1980), 1-23.
Wei, T. T., & Chong, A. Y.-loong. (2008). What drives Malaysian m-commerce adoption ?
An empirical analysis. Industrial Management & Data Systems, 370-388. doi:
10.1108/02635570910939399.
Wisegeek. (2009, 01 16). Retrieved 04 16, 2010, from www.wisegeek.com
Wu, J., & Wang, S. (2005). What drives mobile commerce?An empirical evaluation of the
revised technology acceptance model. Information & Management, 42(5), 719-729. doi:
10.1016/j.im.2004.07.001.
Wu, J.-H., & Hisa, T.-L. (2008). Developing E-Business Dynamic Capabilities: An Analysis
of E-Commerce Innovation from I-, M-, to U-Commerce. Journal of Organizational
Computing and Electronic Commerce, 18(2), 95-111. doi:
10.1080/10919390701807525.
Yeh, J.-tsann, County, Y., Lin, C.-ling, County, T.-yuan, & Road, C. P. (2010). Measuring
the effectiveness of advertiseMents sent via Mobile phone : iMplications of the appeal ,
endorser , and involveMent Model and purchasing behavior. Journal of Database
Marketing, 38(200), 249-256. doi: 10.2224/sbp.2010.38.2.249.