factors influencing the distribution of chl-a along ... f. shaari.pdf · from the department of...
TRANSCRIPT
Sains Malaysiana 46(8)(2017): 1191–1200 http://dx.doi.org/10.17576/jsm-2017-4608-04
Factors Influencing the Distribution of Chl-a along Coastal Waters of East Peninsular Malaysia
(Faktor Mempengaruhi Taburan Chl-a di Pesisir Pantai Timur Semenanjung Malaysia)
F. SHAARI & M.A. MUSTAPHA*
ABSTRACT
Determination of chlorophyll-a (Chl-a) distribution in the coastal waters is important to understand the coastal environmental conditions. This study was conducted to understand the spatial and temporal distribution of Chl-a along coastal waters of east Peninsular Malaysia and factors influencing its variability using Chl-a data derived from Aqua MODIS satellite (1 km spatial resolution) from January 2006 to December 2012. Chl-a variability was described using empirical orthogonal function (EOF) analysis. In-situ data (temperature, salinity, density and nitrate) and rainfall data from the Department of Meteorology were analyzed using spatial interpolation to determine factors influencing the distribution of Chl-a. The seasonal progressions of Chl-a showed high value during northeast monsoon along the coast. This variability was described by four modes of the EOF analysis. The first mode (72.08% of total variance) indicated seasonal cycle with high variability along the coast. Second mode (17.03% of variance) explained the northeast monsoon with high variability from river mouth to the south. Third mode (2.39% of variance) indicated variability during southwest monsoon along the coast and much higher to the south. Mode 4 (1.93% of variance) explained the inter-monsoon period observed along the northern and southern coastline. Concentration and distribution of Chl-a were related to availability of nutrient influenced by rainfall. The thermohaline front was also observed to play an important role in accumulation of phytoplankton biomass during northeast and southwest monsoon.
Keywords: Chl-a; Coastal waters; empirical orthogonal function (EOF); nitrate
ABSTRAK
Penentuan taburan klorofil-a (Chl-a) di pesisir pantai adalah penting bagi memahami keadaan persekitaran pesisir pantai. Penyelidikan ini telah dijalankan untuk memahami taburan reruang dan masa Chl-a di pesisiran pantai timur Semenanjung Malaysia dan faktor yang mempengaruhi variasi taburan mengunakan data Chl-a daripada satelit Aqua MODIS (1 km resolusi reruang) dari Januari 2006 hingga Disember 2012. Variasi Chl-a diterangkan dengan menggunakan analisis fungsi ortogon empirik (EOF). Data in-situ (suhu, saliniti, ketumpatan dan nitrat) serta data hujan daripada Jabatan Meteorologi dianalisis dengan menggunakan interpolasi reruang bagi menentukan faktor yang mempengaruhi taburan Chl-a. Taburan musiman Chl-a menunjukkan kepekatan tertinggi semasa monsun timur laut dan tersebar di sepanjang pesisir pantai. Variasi ini diterangkan melalui empat mod analisis EOF. Mod pertama (72.08% daripada jumlah varians) menerangkan kitaran bermusim dengan variasi yang tinggi sepanjang pesisir pantai. Mod kedua (17.03% daripada jumlah varians) menerangkan keadaan monsun timur laut dengan variasi yang tinggi di muara sungai ke arah selatan. Mod ketiga (2.39% varians) menunjukkan keadaan monsun barat daya di sepanjang pesisir pantai dan lebih tinggi di bahagian selatan. Mod keempat (1.93% variasi) pula menerangkan keadaan peralihan iaitu di sepanjang bahagian utara dan selatan pesisir pantai. Kepekatan dan taburan klorofil-a di bahagian selatan pesisir pantai didapati berhubungan dengan ketersediaan nutrien yang dipengaruhi oleh curahan hujan. Struktur termohalin didapati memainkan peranan yang penting terhadap pengumpulan biojisim fitoplankton semasa monsun timur laut dan barat daya.
Kata kunci: Chl-a; fungsi ortogon empirik (EOF); nitrat; pesisir pantai
INTRODUCTION
Coastal water sustains important natural resources for human activities. As the interface between terrestrial environments and the open ocean, coastal waters are easily influenced by terrestrial activities and ocean processes. Human activities are continuously changing resulting in various kind of impact on the aquatic ecosystem. These impacts have the potential to significantly affect the coastal zone ecosystem (Yasser 2003). Terrestrial input
effects coastal water through river discharge high in nutrient content resulting in high phytoplankton biomass (Dai et al. 2008; Nazmi et al. 2013. Since phytoplankton composition plays an important role in the rate of primary production and various trophic interactions, quantification of phytoplankton biomass is important in understanding the structure and dynamics of marine ecosystems (Robin et al. 2010). Phytoplankton production is also usually dependent upon the physical processes occurring in the marine
1192
ecosystem (Wahbah & Zughul 2001). Understanding the distribution of phytoplankton availability enables explaining the coastal environmental conditions (Nazmi et al. 2013). Phytoplankton is the primary producers of the ocean, thus determination of their spatial distributions are fundamental biological importance (Hodges & Rudnick 2006). Phytoplankton plays a role in the global carbon cycle. High phytoplankton abundance and productivity will lead to enhanced concentration of green pigments in the water column (Tang et al. 2003). The chlorophyll-a (Chl-a) pigment concentration can also be used as an indicator of phytoplankton biomass (Shen et al. 2008). The coastal areas are very sensitive to the strength and the variability of meteorological forcing which may result in major biological transformation. Climate change may impact the near shore marine ecosystem through several physical processes. Temporal variability of phytoplankton biomass is also dependent on physical processes occurring on wide spatial and temporal scales (Wahbah & Zughul 2001). Seasonal variability change in monsoon patterns which is highly influenced by climate also contributes to variability of Chl-a. Understanding temporal pattern of Chl-a is also important because the occurrence of many factor changes at terrestrial and mechanism controlling will affect the marine ecosystem especially in the enhancement of productivity in the coastal region. Phytoplankton production in coastal areas is usually dependent upon the supplies of nutrient from river discharge, estuarine area, coastal pollution and also from the atmosphere (Huang et al. 2009). Rainfall and
subsequent terrestrial runoff also supplies nutrients to the coastal area. High rainfall will increase freshwater runoff resulting in substantial amounts of organic and inorganic matter being washed out to the sea. The organic matter could form a source of carbon for the microbial communities in this system. The high irradiance after heavy rainfall can provide optimal conditions for the growth of the phytoplankton (Ahmad & Toshihiro 1986). High rainfall decreases salinity and under normal condition, low salinity with high temperature results in low surface water density which influences water column condition. These physical changes of the water column influences phytoplankton biomass (Hong et al. 2002). Understanding variations of Chl-a distribution along coastal waters is important because of the significant implications on the productivity of the coastal water which influences coastal resources (Nazmi et al. 2013). Thus, the purpose of this study was to determine the inter-annual and seasonal variation of Chl-a distribution and factors affecting Chl-a variation and distribution along coastal waters of east Peninsular Malaysia.
MATERIALS AND METHODS
STUDY AREA
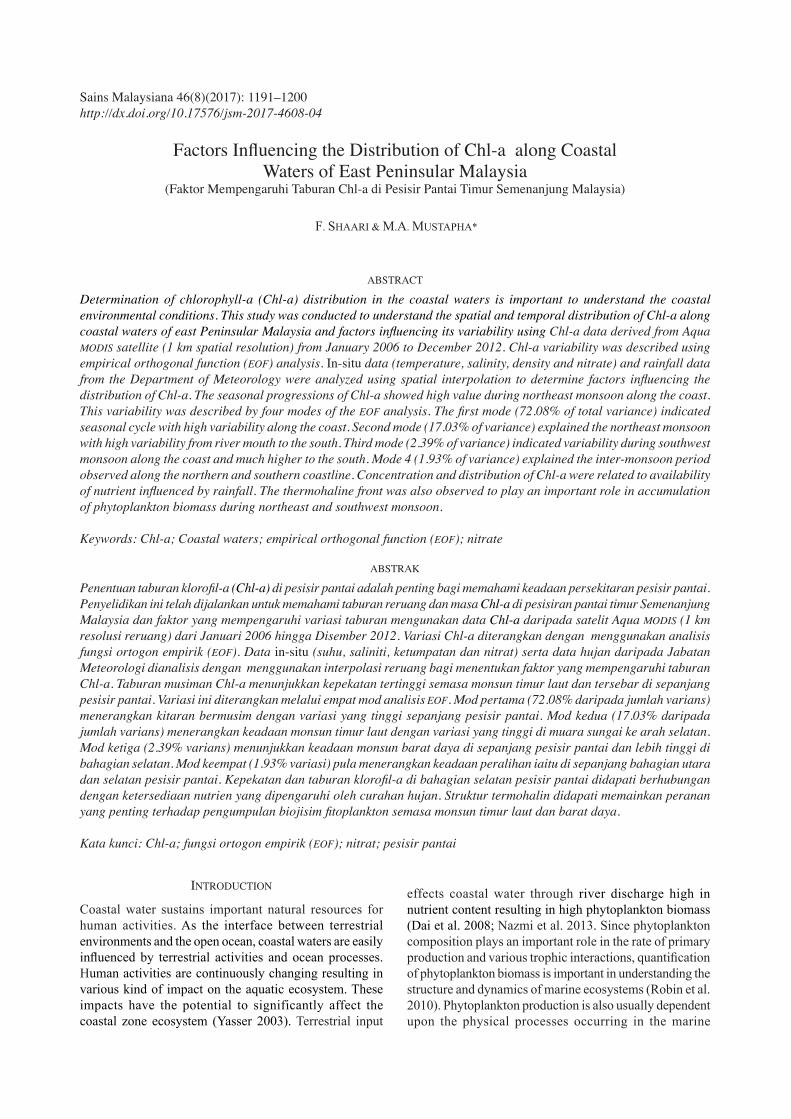
The study area of this research is located at the coastal waters of east Peninsular Malaysia in the South China Sea (SCS) region (2”34’ - 4”44’ N, 102”44’ - 104”58’ E) (Figure 1). There are several river systems and aquaculture farm along the coast. This area is influenced by the northeast,
FIGURE 1. Map showing a) location of the study area along the coastal water of east Peninsular Malaysia in the South China Sea region with several river systems and b) location of the 36 sampling stations
along the coastal area and aquaculture farm near the coast
1193
southwest and inter monsoon monsoonal climate. The SCS circulation in this area is strongly driven by the monsoon winds which influences spatial and temporal distribution of Chl-a.
SATELLITE DATA
Chl-a data were derived from Aqua MODIS satellite images downloaded from the NASAs GSFCs distribute active achieve center (DAAC). Intersection region of Level 1 products between 0.0°- 10.0°N and 100.0°- 120.0°E were downloaded from January 2006 to December 2012. The data were processed using SeaWIFS Data Analysis System (SeaDAS) software. Generated level 3 data at 1 km2 spatial resolution were subset from the images to geographic extents of 2.8°N-3.6°N and 103.0°E-104.5°E. Daily data and monthly composites were produced using ERDAS Imagine (Version 9.1) software and analysis maps were created using ArcGIS.
RAINFALL DATA
Eight years (2006-2013) of daily total rainfall data were obtained from the Malaysia Meteorology Department. Monthly rainfall data was obtained from averaging the total daily rainfall data. The monthly rainfall data were then plotted to represent the condition of total rainfall at the study area.
SAMPLING DATA
Water samples were collected at 36 sampling stations along the coast on 30th March 2013 and 14th September 2013 representing the northeast and southwest monsoon, respectively. The samples were collected at 5 m depth interval of 0, 5 and 10 m. Temperature, salinity and density were recorded using multi parameter YSI Pro. Water samples were filtered through GF/F filter paper (0.45 μm, Whatman) and placed in polythene bottles. Nitrate concentration was measured using flow nutrient auto-analyzer. Chl-a concentration was analyzed using fluometric method by Lorenzen (1966). Water samples were filtered through 0.45 μm Whatman Glass fiber filter at pressure less than 13 cm Hg. Samples (250 mL) were then extracted using 90% acetone. Concentration was measured using the equation below (Lorenzen 1966):
chl a
(1)
where Fo is fluorescence before acidification; Fa is fluorescence after acidification; Fo/Fa max is maximum acid factor which can be expected in the absence of phaeophytin and Kx is calibration constant for a specific sensitivity scale. Vertical profile of Chl-a, salinity, temperature, density and nitrate at 0, 5 and 10 m depth interval were derived
using data that were gridded to a set of common depth using ocean data view (ODV) from north to south of the study area. Interpolation by ODV uses piecewise linear least squares on a predefined set of standard depths when observed depth for adjacent stations did not match.
EMPIRICAL ORTHOGONAL FUNCTION ANALYSIS
Empirical orthogonal function (EOF) analysis is mapping of the multi-dimensional data sets into a series of orthonormal functions and is useful in compressing the spatial and temporal variability of large data sets down to the most energetic and coherent statistical modes. EOF was first applied by Lorenzen (1966) to develop the technique for statistical weather prediction. This approach is useful for analyzing ocean color images, which have long time series and significant spatial variability (Baldacci et al. 2001). EOF analysis was applied to the monthly average Chl-a images. The dataset were extracted into a series of orthogonal functions that explained the spatial and temporal variability of the region (Baldacci et al. 2001). EOF analysis was performed after subtracting the temporal mean of each pixel over the entire time series. The resulted data set with a few spatial modes and a total variance explained the variability in a series of time. Monthly composite Chl-a images were standardized by ignoring the monthly mean from the time-series and decomposed using the method of Polovina and Howell (2005):
F(x, t) = (2)
where ai(t) is the principal component time-series or the expansion coefficients of the spatial components ci(x). The temporal and spatial components are calculated from the eigenvectors and eigen functions of the covariance matrix R, where R=F’·F. This analysis results in N statistical modes, each with a vector of expansion coefficients related to the original data time-series by ai=Fci and a corresponding spatial component map ci.
RESULTS AND DISCUSION
The spatial pattern of Chl-a was observed using reflectance data of the satellite image. In this study, in situ Chl-a data indicated high correlation with satellite Chl-a at r = 0.89. Observation of satellite data indicated differences in optical patterns of reflectance in the study area. Monthly time series map of Chl-a climatology image from 2006-2012 indicated the seasonal changes of Chl-a distribution pattern in the study area (Figure 2). High reflectance of Chl-a value was observed at the coastal area and gradually decreased offshore. Highest Chl-a concentration was observed during northeast monsoon in December and January at values ranging from 4.32 to 4.15 mg/m3. Meanwhile, in February to April, the value of Chl-a decreased to average value of 2.45 mg/m3 significantly. During the southwest monsoon concentration

1194
of Chl-a remained constant from May to September with the lowest value in July and August (1.01 and 1.23 mg/m3, respectively). During September to October, the concentration of Chl-a increased to average value of 3.25 mg/m3 before the onset of the northeast monsoon. The presented seasonal pattern of Chl-a distribution in the study area has been reported to be influenced by river discharge and coastal physical processes (Nazmi et al. 2013). Variability of spatial distribution of Chl-a observed was evidently explained by the EOF analysis (Figure 3). The variability was explained with total variance of 93.43% in the first four modes. The first EOF mode with 72.08% of the total variance explained high variability in the coastal region (Figure 3(a)). Variability of Chl-a was much higher near the coastal area towards offshore region. High variability was also observed near river mouths to the southwest direction. The time series associated with the first mode indicated strong positive signals in November
2009 followed by December 2006, January 2008, January 2007, January 2010 and January 2012. Meanwhile low positive signals was detected in September 2008, August 2007, June 2006, June 2012, September 2009, early October 2010 and May 2011. This mode explained seasonal cycle with strong positive signal that explained the northeast monsoon and low positive signal that explained the southwest monsoon. The second EOF mode showed variability with 17.03% of variance (Figure 3(b)). The signal was highly detected from river mouths to the south. The temporal amplitude was observed with strong positive signal in December 2008 followed by December 2011, November 2012, December 2006, November 2007 and January 2010. This mode indicated variability during northeast monsoon. The third EOF mode indicated about 2.39% from the total variance (Figure 3(c)). The signal explained spatial pattern of Chl-a distributed along the coastline and much
FIGURE 2. The climatology (7 years) inter-annual cycle of Chl-a distribution of Aqua MODIS composite images with wind speed and its direction. Seasonal progression can be seen over the timescale showed by high concentration of Chl-a
distribution near the coast during November-January. Meanwhile decreased value of Chl-a was observed in February to April and remained constant until September

1195
higher to the south. Strong negative signal occurred in May 2006, September 2007 June 2009, June 2008, June 2010, May 2011 and August 2012. This mode explained variability during the southwest monsoon. Modes 2 and 3 was observed to indicate change in temporal amplitude pattern after year 2010 to 2012. This was related to the different data processing approach of the Level 1 satellite data. However it indicated similar signal pattern observed as the previous years. Meanwhile, mode 4 of the EOF analysis explained 1.93% of total variance (Figure 3(d)). The spatial pattern showed strong positive signal off river mouths and negative signal along the northern and southern coastline. High positive peak was observed in September 2007, September 2008 and October 2010 and strong negative signal was
detected during April 2006, March 2007 and March 2008. Positive peak explained variability during the southwest to northeast monsoon and negative peak explained variability during northeast to southwest monsoon. Variability of Chl-a was observed to be influenced by the northeast and southwest monsoons. Based on Wang et al. (2009), variability of Chl-a in this area was influenced by episodic wind conditions that brings circulation of low and high SST to this region which can be observed in Figure 2. Solar radiation creates favorable water temperatures for phytoplankton (An & Du 2000) and availability of nutrients along the coast discharged from rivers highly influenced the growth of phytoplankton (Suchint & Puntip 2000). This was also indicated by previous studies that seasonal differences in Chl-a concentration and productivity at the
FIGURE 3. EOF analysis showing inter-annual variability of Chl-a of east Peninsular Malaysia. Each mode consist of a spatial pattern (left) and time-series (right). (A) First mode represented 72.08% of variance indicating seasonal cycle, (b) second mode
with 17.03% of variance explained the northeast monsoon, (c) third mode with 2.39% variance explained the southwest monsoon and (d) fourth mode 1.93% of variance indicated the inter-monsoon period
(a)
(b)
(c)
(d)
1196
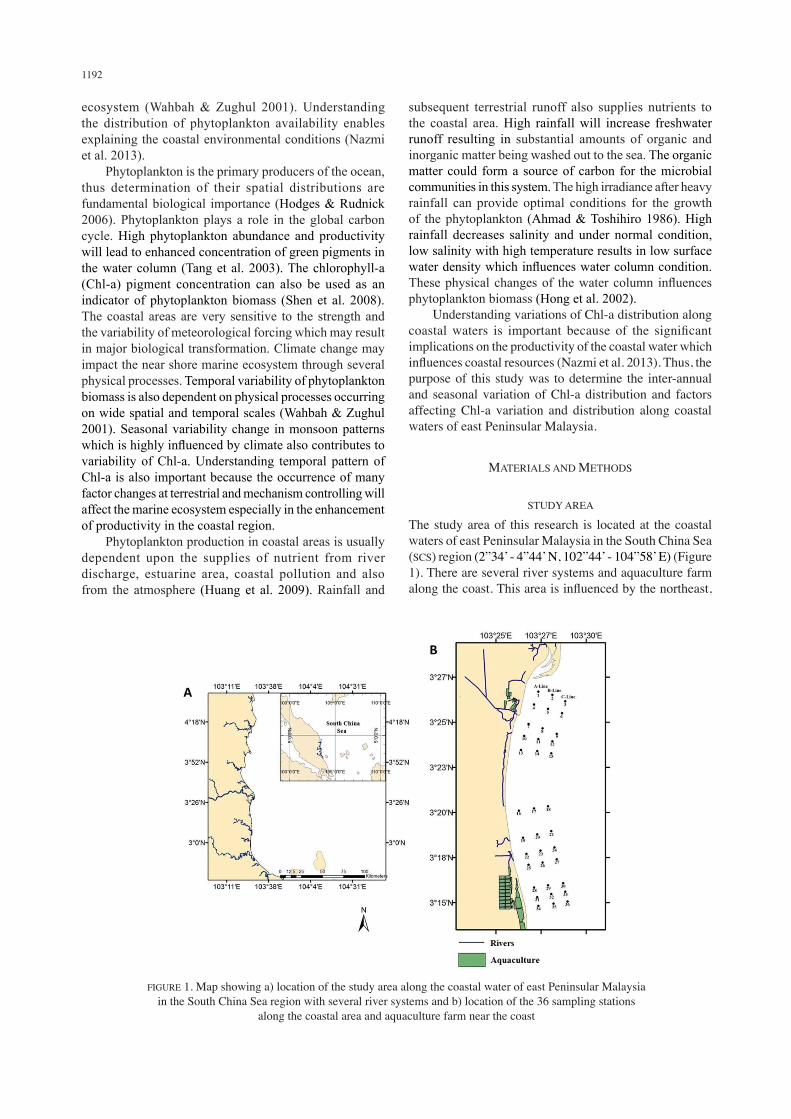
SCS region were higher during northeast monsoon than southwest monsoon influenced by high river discharge. Distribution pattern of Chl-a was also observed higher near the coast towards the south at river mouths. River mouths are greatly associated with plume loaded with high composition of suspended particular matter (Sierra et al. 2002). This water discharge is also well known as a major source of nutrients in coastal areas (Tesi et al. 2007). Concentration and distribution of Chl-a were also observed higher along the coast and gradually decreases offshore. This was evident in Figure 4 that showed Chl-a concentration from sampling data collected near coast towards offshore (A-C line). Areas near coast (A-line) showed higher concentration of Chl-a than areas towards offshore (B-line and C-line). Areas near coast (A-line) indicated highest Chl-a during northeast monsoon at concentration of 4.05 to 5.5 mg/m3 and 3.5 to 4.3 mg/m3
during southwest monsoon. Meanwhile, areas along B-line indicated Chl-a at concentration of 3.7 to 4.7 mg/m3 during northeast monsoon and 2.5 to 3.4 mg/m3 during southwest monsoon. As for areas further away from the coast (C-line), Chl-a during northeast monsoon and southwest monsoon ranged from 2.4 to 4.2 mg/m3 and 1.6 to 2.5 mg/m3,
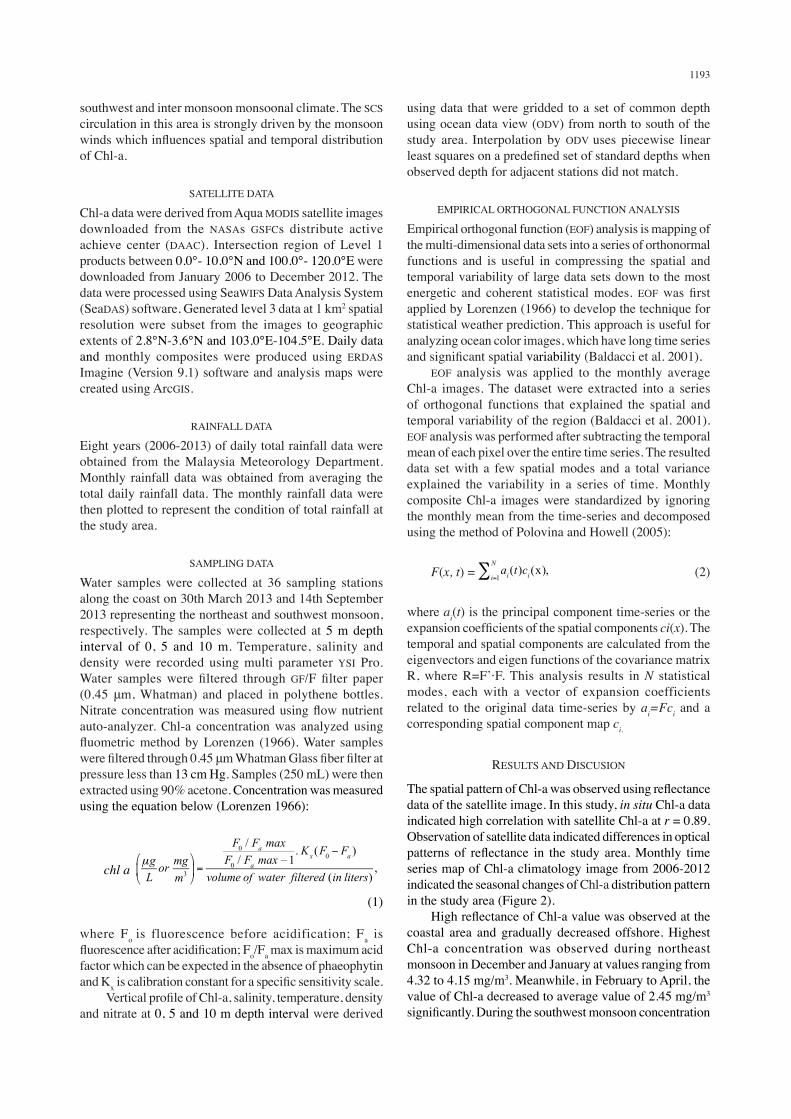
respectively. This variability caused by inputs of particles and sediment can be related to the influence from various sources of terrestrial input especially from river outflow. High river outflow influenced by monsoonal pattern give impact on high suspended particle and sediment especially near the coast. The suspended sediment supply during northeast monsoon was reported to be higher than the southwest monsoon due to high total rainfall (Abd Rahman et al. 2012). Phytoplankton Chl-a abundance in SCS is mostly affected by monsoonal pattern (Peňaflor et al. 2007). During northeast monsoon (November until March), higher Chl-a concentration detected was evidently influenced from high river outflow. While, lower Chl-a concentration detected during May to September during southwest monsoon was due to lower river discharge which resulted in lower Chl-a concentration (Nazmi et al. 2013). Rainfall and subsequent terrestrial runoff also supplies nutrient to the coastal area. The fluctuation of rainfall at the study area was observed to show similar pattern with spatial and temporal variation of Chl-a. During the northeast monsoon total rainfall was higher in comparison to southwest monsoon (Figure 5). Higher
FIGURE 5. Monthly total rainfall during 2006-2013 indicated higher rainfall during November-March (northeast monsoon) and lower rainfall during May-September (southwest monsoon)
FIGURE 4. Seven years’ time series of Chl-a concentration along A-Line (near coast), B-Line and C-Line (away from coastal area)

1197
total rainfall occurred during December (5560 mm) and lower total rainfall during June (1250 mm). During the northeast monsoon total rainfall was recorded at 1800 to 6000 mm. Meanwhile during the southwest monsoon 1100 to 1700 mm total rainfall was observed. Higher total rainfall during northeast monsoon give impact to high river outflow towards coastal region and higher sedimentation that brings higher nutrient to coastal region impacting increase in chlorophyll-a concentration. Higher value of total rainfall resulted in higher river outflow to the coastal region. This contributed to higher sedimentation loads and nutrients to the coastal region which resulted in higher Chl-a concentration. High irradiance after heavy rainfall can provide optimal meteorological conditions and influences physical stability of the water column which contributed to enhancement of phytoplankton biomass (Hong et al. 2002). During northeast monsoon and southwest monsoon, it can be observed as represented by sampling data of 30th March 2013 (Figure 6(a)) and 14th September 2013 (Figure 6(b)). Higher Chl-a concentration was detected at rivers and areas with location of aquaculture sites Meanwhile, lower Chl-a concentration was detected at areas with lesser influence from terrestrial environment. Chl-a concentration was detected higher during northeast monsoon at 1.3 to 3.9 mg/m3 at coastal areas near aquaculture sites at the south
(A-line). Areas with rivers and smaller aquaculture sites at the northern part indicated Chl-a concentration at 2.5 to 3.3 mg/m3. Areas with less influence from terrestrial had values of 1.0 to 1.6 mg/m3. As for locations along B-line, larger aquaculture areas at the south had Chl-a concentration at 2.8 to 3.1 mg/m3. Meanwhile, location with rivers and aquaculture sites at the north showed values at 1.5 to 2.5 mg/m3 and location with less influence from terrestrial indicated values at 1.05 mg/m3. Further away from the coast (C-line), all location indicated values at about 1.0 to 1.5 mg/m3. Meanwhile, during the southwest monsoon represented by sampling data of 14th September 2013, areas near coast (A-line) at location of larger aquaculture sites at the south, Chl-a concentration showed values at 3.02 mg/m3, B-line at 1.2 to 2.7 mg/m3 and areas further from coast (C-line) at 1.0 to 1.4 mg/m3. Location near rivers and smaller aquaculture sites at the north indicated values of 1.5 to 3.4 mg/m3 (A-line), B-line at 1.2 to 2.1 mg/m3 and further from the coast( C-line) at values of 0.9 to 1.2 mg/m3. As for areas with less influence from terrestrial indicated values at 1.8 mg/m3 (A-line), 1.4 to 1.6 mg/m3 (B-line) and 1.3 to 1.5 mg/m3 (C-line). During the northeast monsoon, lower SST at about 29.3°C to 29.9°C was detected at the north and south of
FIGURE 6. a) Chl-a concentration during northeast monsoon represented by 30th March 2013 and b) during southwest monsoon represented by 14th September 2013 along A-line
(near coast), B-line and C-line (away from coast)
(a)
(b)
1198
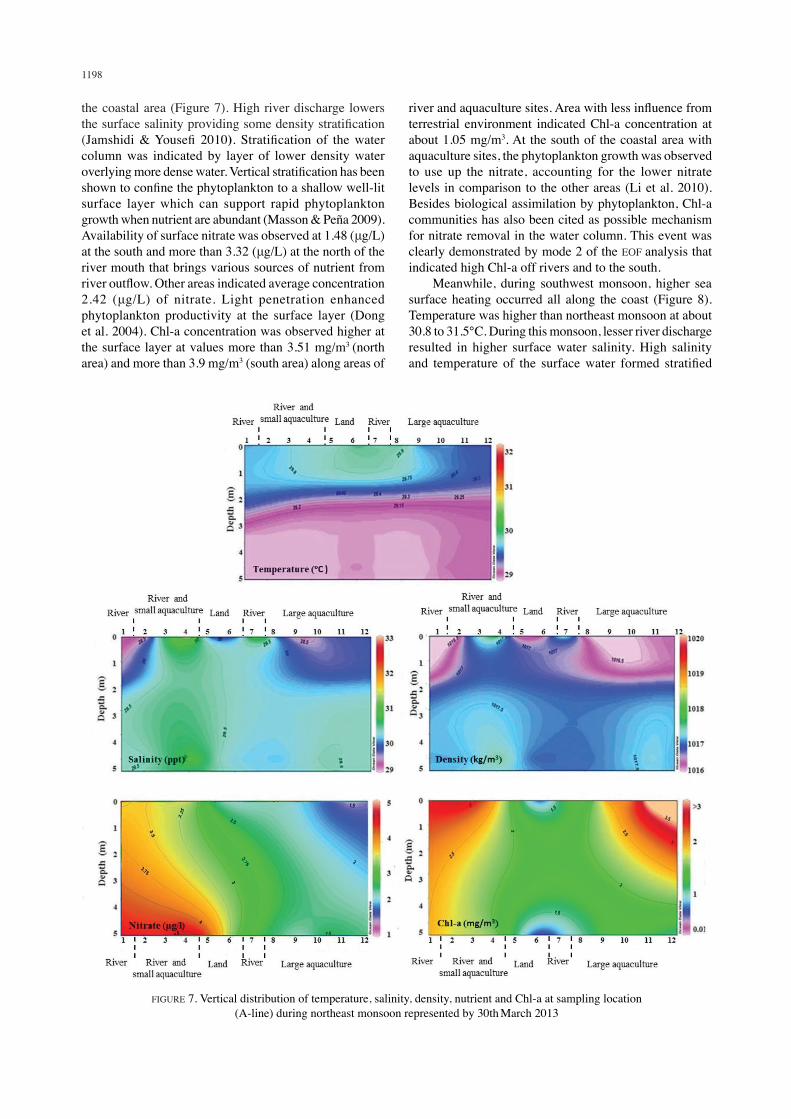
the coastal area (Figure 7). High river discharge lowers the surface salinity providing some density stratification (Jamshidi & Yousefi 2010). Stratification of the water column was indicated by layer of lower density water overlying more dense water. Vertical stratification has been shown to confine the phytoplankton to a shallow well-lit surface layer which can support rapid phytoplankton growth when nutrient are abundant (Masson & Peña 2009). Availability of surface nitrate was observed at 1.48 (μg/L) at the south and more than 3.32 (μg/L) at the north of the river mouth that brings various sources of nutrient from river outflow. Other areas indicated average concentration 2.42 (μg/L) of nitrate. Light penetration enhanced phytoplankton productivity at the surface layer (Dong et al. 2004). Chl-a concentration was observed higher at the surface layer at values more than 3.51 mg/m3 (north area) and more than 3.9 mg/m3 (south area) along areas of
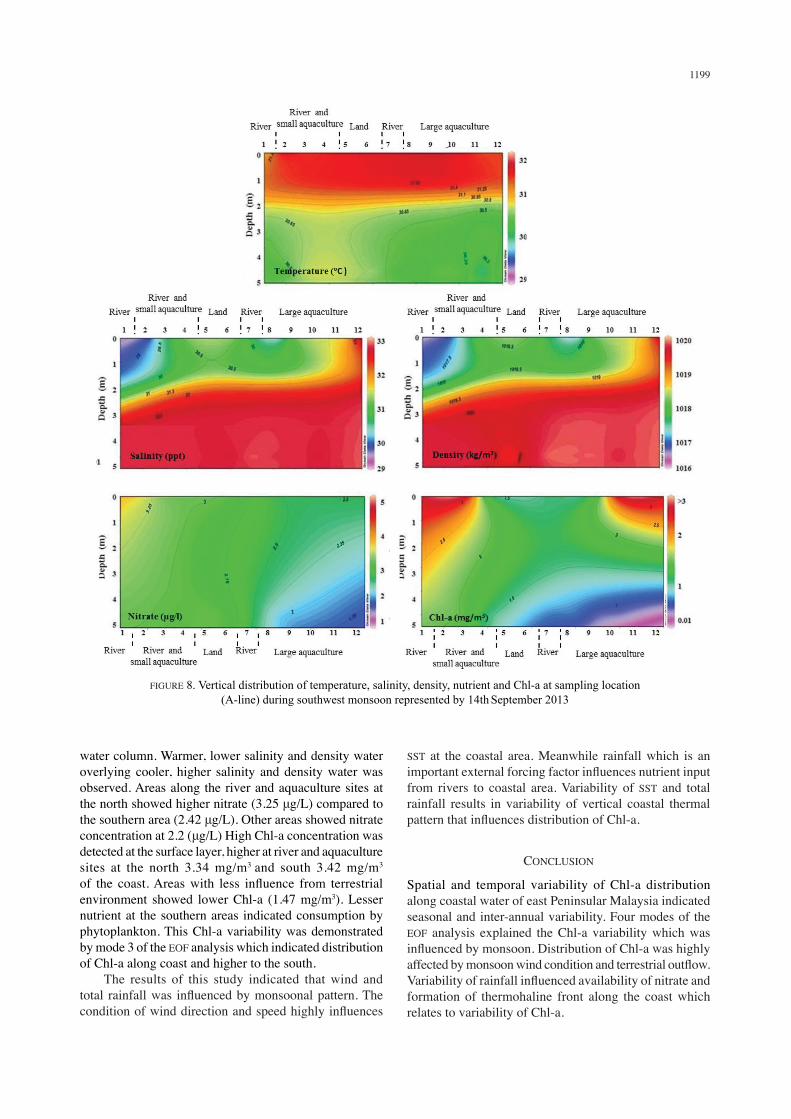
river and aquaculture sites. Area with less influence from terrestrial environment indicated Chl-a concentration at about 1.05 mg/m3. At the south of the coastal area with aquaculture sites, the phytoplankton growth was observed to use up the nitrate, accounting for the lower nitrate levels in comparison to the other areas (Li et al. 2010). Besides biological assimilation by phytoplankton, Chl-a communities has also been cited as possible mechanism for nitrate removal in the water column. This event was clearly demonstrated by mode 2 of the EOF analysis that indicated high Chl-a off rivers and to the south. Meanwhile, during southwest monsoon, higher sea surface heating occurred all along the coast (Figure 8). Temperature was higher than northeast monsoon at about 30.8 to 31.5°C. During this monsoon, lesser river discharge resulted in higher surface water salinity. High salinity and temperature of the surface water formed stratified
FIGURE 7. Vertical distribution of temperature, salinity, density, nutrient and Chl-a at sampling location (A-line) during northeast monsoon represented by 30th March 2013
1199
water column. Warmer, lower salinity and density water overlying cooler, higher salinity and density water was observed. Areas along the river and aquaculture sites at the north showed higher nitrate (3.25 μg/L) compared to the southern area (2.42 μg/L). Other areas showed nitrate concentration at 2.2 (μg/L) High Chl-a concentration was detected at the surface layer, higher at river and aquaculture sites at the north 3.34 mg/m3 and south 3.42 mg/m3 of the coast. Areas with less influence from terrestrial environment showed lower Chl-a (1.47 mg/m3). Lesser nutrient at the southern areas indicated consumption by phytoplankton. This Chl-a variability was demonstrated by mode 3 of the EOF analysis which indicated distribution of Chl-a along coast and higher to the south. The results of this study indicated that wind and total rainfall was influenced by monsoonal pattern. The condition of wind direction and speed highly influences
SST at the coastal area. Meanwhile rainfall which is an important external forcing factor influences nutrient input from rivers to coastal area. Variability of SST and total rainfall results in variability of vertical coastal thermal pattern that influences distribution of Chl-a.
CONCLUSION
Spatial and temporal variability of Chl-a distribution along coastal water of east Peninsular Malaysia indicated seasonal and inter-annual variability. Four modes of the EOF analysis explained the Chl-a variability which was influenced by monsoon. Distribution of Chl-a was highly affected by monsoon wind condition and terrestrial outflow. Variability of rainfall influenced availability of nitrate and formation of thermohaline front along the coast which relates to variability of Chl-a.
FIGURE 8. Vertical distribution of temperature, salinity, density, nutrient and Chl-a at sampling location (A-line) during southwest monsoon represented by 14th September 2013
1200
ACKNOWLEDGEMENTS
The authors would like to thank the NASA Goddard Space Flight Center for the MODIS-Aqua Level 1A data used in this study. This work has been supported by the Ministry of Higher Education Fundamental Research Grant Scheme (FRGS/1/2012/STWN)S/UKM/02/3). We would also like to thank the Oceanography and Environment Institute (INOS) of Universiti Malaysia Terengganu (UMT) for the analysis of nutrient data.
REFERENCES
Abd Rahman, M., Fadhli, A., Mustafa, M., Mohd, R. & Khiruddin, A. 2012. Sediment variation along the east coast of Peninsular Malaysia. Ecological Questions 16: 99-107.
Ahmad, Raihan B. Sheikh & Toshihiro, I. 1986. Chlorophyll-a content off the Terengganu Coast. In Ekspedisi Matahari’ 85: A Study on the Offshore Waters of the Malaysian EEZ, edited by Mohsin, A.K.M., Mohamed, M.I. & Ambak, M.A. Universiti Pertanian Malaysia. Occasional Publication 3: 117-120.
An, N.T. & Du, H.T. 2000. Studies on phytoplankton pigments: Chlorophyll, total carotenoids and degradation products in Vietnamese waters. Proceeding of the SEAFDEC Seminar on Fishery Resources in the South China Sea Area IV: Vietnamese Water Thailand. Southeast Asian Fisheries Development Center. pp: 1-18.
Huang, B., Wu, F., Yang, Z., Fu, J. & Kikuchi, K. 2009. Multi-scale climate variability of the South China Sea monsoon: A review. Dynamics of Atmospheres and Oceans 47: 15-37.
Baldaci, A., Corsini, G., Grasso, R., Manzella, G., Allen, J.T., Cipollini, P., Guymer, T.H. & Snaith, H.M. 2001. A study of the Alboran Sea mesoscale system by menas of empirical orthogonal function decomposition of satellite data. Journal of Marine Systems 29: 293-311.
Hodges, B.A. & Rudnick, D.L. 2006. Horizontal variability in chlorophyll fluorescence and potential temperature. Deep-Sea Research 53: 1460-1482.
Dai, M., Zhai, W., Cai, W., Callahan, J., Huang, B., Shang, S., Huang, T., Li, X., Lu, Z., Chen, W. & Chen, Z. 2008 Effects of an estuarine plume-associated bloom on the carbonate system in the lower reaches of the Pearl River estuary and the coastal zone of the northern South China Sea. Continental Shelf Research 28: 1416-1423.
Dong, L., Su, J., Wong, L.A., Cao, Z. & Chen, J. 2004. Seasonal variation and dynamics of the Pearl River plume. Continental Shelf Research 24: 1761-1777.
Hong, S.S., Bang, S.W., Kim, Y.O. & Han, M.S. 2002. Effects of rainfall on the hydrological conditions and phytoplankton community structure in the riverine zone of the Pal’tang reservoir, Korea. J. Freshwater Ecol. 17: 507-520.
Huang, X.P., Huang, L.M. & Yue, W.Z. 2006. The characteristics of nutrients and eutrophication in the Pearl River Estuary, South China Sea. Marine Pollutant Bulletin 47: 30-36.
Jamshidi, S. & Yousefi, M. 2010. Concentration of Chlorophyll-a in coastal waters of Rudsar. Research Journal of Environmental Science 4: 383-391.
Li, W.K.W., Lewis, M.R. & Harrison, W.G. 2010. Multiscalarity of the nutrient-chlorophyll relationship in coastal phytoplankton. Estuaries and Coasts 33: 440-447.
Lorenzen, C.J. 1966. A method for the continuous measurement of in vivo chlorophyll concentration. Deep-Sea Res. 13: 223-227.
Masson, D. & Peña, A. 2009. Chlorophyll distribution in a temperate estuary: The Strait of Georgia and Juan de Fuca Strait. Estuarine, Coastal and Shelf Science 82: 19-28.
Nazmi, S.M., Mustapha, A.M. & Lihan, T. 2013. Satellite derived measurements of coastal water chlorophyll-a variability. World Applied Sciences Journal 21: 879-887.
Peńaflor, E.L., Villanoy, C.L., Liu, C.T. & David, L.T. 2007. Detecting of monsoonal phytoplankton blooms in Luzon Straits with MODIS data. Remote Sensing of Environment 109: 443-450.
Polovina, J.J. & Howell, E.A. 2005. Ecosystem indicators derived from satellite remotely sensed oceanographic data for the north pacific. ICES Journal of Marine Science 62: 319-327.
Robin, R.S., Vishnu, V., Pradipta, K., Muduli, R., Rajkumar, J.S.I. & Palanisami, S. 2010. Vertical distribution of biological characteristics and phytoplankton community structure in the shelf waters off southwest coast of India. International Journal of Current Research 8: 016-034.
Shen, S., Leptoukh, G.G., Acker, J.G., Yu, Z. & Kempler, S.J. 2008. Seasonal variations of chlorophyll - a concentration in the northern South China Sea. Geoscience and Remote Sensing Letters 5: 315-319.
Sierra, J.P., Sànchez, A.A., Del, J.R., González, J.F., Movellán, E., Mösso, C., Martínez, R., Rodilla, M., Falco, S. & Romero, I. 2002. Spatial distribution of nutriens in the Ebro estuary and plume. Continental Shelf Research 22: 361-378.
Suchint, D. & Puntip, W. 2000. Sub-thermoline chlorophyll maximum in the South China Sea. Proceeding of the SEAFDEC seminar on fishery resources in the South China Sea Area IV: Vietnamese water Thailand. Southeast Asian Fisheries Development Center. pp: 1-17.
Tang, D.L., Kawamura, H., Lee, M.A. & Dien, T.V. 2003. Seasonal and spatial distribution of chlorophyll-a concentrations and water conditions in the Gulf of Tonkin, South China Sea. Remote Sensing of Environment 8: 475-483.
Tesi, T., Miserocchi, S., Goni, M.A., Langone, L., Boldrin, A. & Turchetto, M. 2007. Organic matter origin and distribution in suspended particulate materials and surficial sediments from the western Adriatic Sea (Italy). Estuarine, Coastal and Shelf Science 73(3-4): 431-446.
Wahbah, M.I. & Zughul, M.B. 2001. Temporal distribution of chlorophyll-a, suspended matter, and the vertical flux of particles in Aqaba (Jordan). Hydrobiologia 459: 147-156.
Yasser, A.K.A. 2003. Use of phytoplankton abundance and species diversity for monitoring coastal water quality. MSc. Thesis. Universiti Sains Malaysia (Unpublished).
School of Environmental and Natural Resource SciencesFaculty of Science and Technology Universiti Kebangsaan Malaysia 43600 UKM Bangi, Selangor Darul EhsanMalaysia
*Corresponding author; email: [email protected]
Received: 14 June 2016Accepted: 8 February 2017