factors influencing female labor force participation in ... · factors influencing female labor...
TRANSCRIPT
The African Statistical Journal, Volume 11, November 2010 85
4. Factors Influencing Female Labor Force Participation in South Africa in 2008
Yakubu A. Yakubu1
AbstractFemale labor force participation (FLFP) is the prime indication of the extent to which females participate in the economic activities of society. There has been an upsurge of interest among researchers and development specialists alike in this subject, due to its importance in measuring progress being made toward gender equality across various economic settings. Despite the advances in female educational attainment and the expansion of the market economy, however, female labor force participation rates are still low in comparison to the rates of their male counterparts. Nonetheless, South Africa’s FLFP has increased over the past two decades. This paper, which seeks to investigate dynamics in the South African labor force, uses the Human Capital Theory (HCT), which postulates that the education of women is positively related to the likelihood of their labor force participation. Data for the study were extracted from the 2008 Quarterly Labor Force Survey of Statistics South Africa. Logistic regression modeling was used to estimate the influence of education on labor force participation, while controlling for other demographic and economic factors. The results show that there is an association between the level of education status and FLFP. Findings from this analysis are expected to contribute to the knowledge about FLFP trends in South Africa and should aid in the planning of interventions to improve the status of women, toward achievement of Millennium Development Goal 3 (Promote Gender Equality and Empower Women).
Key words: Labor market, Human Capital Theory, Quarterly Labor Force Survey, logistic regression modeling, socio-demography
RésuméLa présence féminine dans la population active est le premier indicateur de la participation des femmes aux activités économiques de la société. On note chez les chercheurs et les spécialistes du développement un regain d’intérêt sur ce sujet, en raison de son importance pour l’évaluation des progrès en matière d’égalité des genres dans divers contextes économiques. Malgré les progrès en matière de scolarisation des femmes et l’essor de l’économie de marché, les taux d’activité féminins demeurent faibles par rapport aux taux masculins. Néanmoins, en Afrique du Sud la présence des femmes dans la main d’œuvre s’est accrue au cours des 20 dernières années. Cette étude sur la dynamique de la main d’œuvre sud-africaine s’appuie sur la théorie du capital humain, qui considère que l’édu-cation des femmes est positivement liée à la probabilité de leur présence dans la population active. Les données utilisées pour l’étude sont tirées d’un numéro de
1 Yakubu A. Yakubu is a Young Statistician-Demographer at Statistics South Africa. Email: [email protected] / [email protected].
Journal statistique africain, numéro 11, novembre 201086
Yakubu A. Yakubu
2008 de la revue Quarterly Labor Force Survey of Statistics South Africa. Le modèle de régression logistique a été utilisé pour évaluer l’influence de l’éducation sur la présence dans la population active en surveillant étroitement les facteurs démographiques et économiques. Les résultats montrent qu’il existe un lien entre le niveau d’éducation et le taux d’activité des femmes. Les conclusions de cette recherche devraient enrichir les connaissances sur les tendances du taux d’activité féminin en Afrique du Sud et contribuer à la planification des interventions visant à améliorer le statut des femmes, pour la réalisation du troisième OMD (promotion de l’égalité des genres et autonomisation des femmes).
Mots clés : marché du travail, théorie du capital humain, Quarterly Labor Force Survey, modèle de régression logistique, socio-démographie
1. INTRODUCTION
South Africa’s female labor force participation (FLFP) has increased substan-tially over the past two decades (Ntuli, 2004). Female labor force participa-tion is a primary indication of the extent to which females participate in the economic activities of any country. FLFP rates have gained interest among researchers and development specialists worldwide due to their significant contribution in measuring the progress being made toward gender equality (Amoateng et al., 2003). The literature suggests that there have been increases in women’s contribution to modern sector activities (Amsden, 1980). Less developed countries are also experiencing increased trends in FLFP (ILO, 2005), and statistical analyses from South Africa in particular have shown a consistency with this trend (Ntuli, 2004).
Nonetheless, despite the advances in female educational attainment and the expansion of the market economy, FLFP rates are still low in comparison to the rates of their male counterparts (Ntuli, 2004; Serumaga-Zake and Kotze, 2004). For instance, as recently as 2004, the labor force participa-tion rate in South Africa was 62% for males, compared to 46% for females.
This study employs the Human Capital Theory (HCT), which postulates that the education of women is positively related to labor force participa-tion. The theory helps us to investigate quarterly or short-term dynamics in the labor force. This approach is an advancement of knowledge gained from previous studies such as Serumaga-Zake and Kotze (2004) and Ntuli (2004), both of which investigated the annual dynamics in FLFP. Inves-tigating quarterly dynamics in FLFP is prudent, as the market economy
The African Statistical Journal, Volume 11, November 2010 87
4. Factors Influencing Female Labor Force Participation in South Africa in 2008
is very dynamic and small changes can have huge impacts on labor force participation.
This study investigates the differentials in FLFP in all nine provinces of South Africa. The objectives of this study are to determine the participa-tion rate of females in the labor market, taking into account the impact of quarterly or short-term labor market dynamics on labor force participation. It also seeks to investigate the factors influencing FLFP in the country. Data for the study were extracted from the 2008 Quarterly Labor Force Survey (QLFS) conducted by Statistics South Africa. Logistic regression modeling was employed with the dependent variable, FLFP status, as a binary out-come. Other variables controlled in the analysis are sex, population group, age group, marital status, education status, and province.
2. RESEARCH SETTING
South Africa is the most dominant economy in the Southern Africa Develop-ment Community (SADC), constituting about 20% of the population and contributing about 70% to Sub-Saharan Africa’s Gross Domestic Product (GDP) (World Bank, 2006). SADC is a 14-member regional community, and South Africa’s average per capita income is much higher than the average per capita income in most Sub-Saharan African countries (Solomon, 2003).
Under the apartheid system, black women were subjected to intense dis-crimination, and their full integration into the labor market was hampered (Ntuli, 2004). With the demise of the apartheid system in 1994, the con-stitutional government brought in fundamental constitutional changes to increase women’s access to the labor market. Laws were also introduced to usher in greater equity to the treatment of women in the labor market (Bhorat et al., 2001) such as the Employment Equity Act of 1998 and the Skills Development Act of 1998.
The Skills Development Act of 1998 is intended to provide the framework for institutions to devise and implement national, sectoral, and workplace strategies for the development and improvement of skills in the entire South African workforce by providing “learnerships” for the young and unemployed (Malala, 2000). The Employment Equity Act was introduced to achieve equity in the workplace. These policies helped to drive the process of better integration of females in the labor market of post-apartheid South Africa (Posel and Casale, 2003).
Journal statistique africain, numéro 11, novembre 201088
Yakubu A. Yakubu
3. HUMAN CAPITAL THEORY
The human capital stock concept according to Pierce-Brown (1998) has been extensively used by labor economists since the 1960s. The individual’s capital stock has an “innate ability,” and can be extended to (i) prior par-ticipation in the labor force by education, (ii) during employment through on-the-job training, and (iii) experience. The theory postulates that those women with middle-school education or higher are more economically active than those without formal education (Nam, 1991). Furthermore an individual’s lifetime earnings usually show a one-off return for formal education, and subsequent salary increases to reflect the individual’s years of experience and job training on a specific area.
According to Pierce-Brown (1998), the first distinctive approach from economics to analysis of the male–female wage gap is based on HCT. The theory lays emphasis on the voluntary choices in the lifetime of partici-pants in the workforce as determinants of differences in occupation and remuneration. An early proponent of the HCT, Becker (1975) presented an explanation that over their working life, women are on average less pro-ductive compared to men because they tend to take an employment break for maternity leave and childcare. Furthermore, women bear the prime responsibility of the unremunerated domestic chores. Thus, the HCT em-phasizes the importance of education and training in the development of human capital. Governments’ poverty eradication strategies are consistent with HCT, and according to Serumaga-Zake and Kotze (2004), in order to tackle the problem of poverty, the SA government has adopted an economic development strategy focusing on developing human resources, as reflected in the national budget of 2005 and in subsequent budgets.
4. PROBLEM STATEMENT
Female labor force participation is a prime indicator of the extent of fe-males’ participation in the labor market. Interest in FLFP worldwide has been demonstrated in a series of historical studies in both the developed and developing nations (Bowen and Finegan, 1969; Boserup, 1970; Smith 1980). According to Ntuli (2004), the early literature on FLFP suggested that the bulk of women’s activities take place in the home or in the informal sector as nonmarket activities.
In less developed nations, an increasing trend of FLFP has also been docu-mented (ILO, 2005), and in South Africa in particular, a number of studies
The African Statistical Journal, Volume 11, November 2010 89
4. Factors Influencing Female Labor Force Participation in South Africa in 2008
have shown consistency with this trend (Ntuli, 2004). However, FLFP rates are still low in comparison with their male counterparts. For example, in South Korea in 1991 labor force participation was 59.4% for males and 44.2% for females. According to Moghadam (1998), the increase in FLFP over time results from advances made in females’ educational attainment and the expansion of the market economy.
Despite the vast literature on FLFP rates, many studies mainly concen-trated on analysis of short periods of usually one year. Other studies (e.g. Serumaga-Zake and Kotze, 2004; Bhorat and Leibbrandt, 2001) employed the usual one-year period and looked at only a small segment of the female population, namely married women. A few studies have looked at longer periods, such as the study of determinants of FLFP in South Korea (Nam, 1991), which used a ten-year period. Similar attempts have been made in South Africa to investigate and provide answers to FLFP, such as the study by Ntuli (2004). All these studies attempt to provide answers on factors explaining FLFP in a country, but these findings are generally inconclusive if shorter periods (quarterly dynamics) are not investigated, as a way of in-forming policymakers. Governments in South Africa and elsewhere could find the analysis of the impact of quarterly or shorter-term dynamics on FLFP to be more useful.
Investigating quarterly information on the labor market underscores the uniqueness of our research and significantly sets this apart from earlier studies. The two central questions of this study then are:
• WhatistheeffectofeducationonFLFP?• AretheresignificantdifferentialsinFLFPratesbetweenthequarters
of2008?
5. METHODS
5.1 Data source
The data for this study were extracted from the 2008 Quarterly Labor Force Survey (QLFS) of South Africa (Statistics South Africa, 2008). The Master Sample has been developed by Statistics South Africa (Stats SA) as a general-purpose household survey frame that can be used by all other house-hold surveys, irrespective of the sample size requirement of the survey. The sample size for the QLFS is roughly 30,000 dwellings. The sample is based on information collected during the 2001 Population Census conducted
Journal statistique africain, numéro 11, novembre 201090
Yakubu A. Yakubu
by Stats SA. In preparation for Census 2001, the country was divided into 80,787 enumeration areas (EAs). Some of these EAs are small in terms of the number of households that were enumerated in them at the time of Census 2001. Stats SA’s household-based surveys use a Master Sample of Primary Sampling Units (PSUs), which comprises EAs that are drawn from across the country. For the purposes of the Master Sample, the EAs that contained fewer than 25 households were excluded from the sampling frame, and those that contained between 25 and 99 households were combined with other EAs of the same geographic type to form Primary Sampling Units (PSUs). The number of EAs per PSU ranges from one to four. On the other hand, very large EAs represent two or more PSUs.
The sample is designed to be representative at provincial level and within provinces at the metro/non-metro level. Within the metros, the sample is further distributed by geographical type. The four geographical types are: urban formal, urban informal, farms, and tribal. Tribal areas lie outside the city/town boundaries and include commercial farm areas that are governed by tribal authority (chief, headman, etc). This implies that, for example, within a metropolitan area, the sample is designed to be representative at the different geographical types that may exist within that metro.
The current sample size for the Master Sample is 3,080 PSUs. It is equally divided into four subgroups or panels called rotation groups. The rotation groups are designed in such a way that each of these groups has the same distribution pattern as in the whole sample. They are numbered from 1 to 4, and these numbers also correspond to the quarters of the year in which the sample will be rotated for the particular group.
The sample for the redesigned Labor Force Survey is based on a stratified two-stage design with probability proportional to size (PPS) sampling of PSUs in the first stage, and sampling of dwelling units (DUs) with systematic sampling in the second stage. The data obtained from household question-naires relating to 2008 QLFS of South Africa was recoded and analyzed, using the Statistical Package for Social Sciences (SPSS).
5.2 Variables
Major labor market categoriesThis variable indicates the employment status of all persons in the household aged 15 years and older (population of working age). An unemployed person is defined under international guidelines as “a person within the economi-cally active population who: did not work during the seven days prior to census
The African Statistical Journal, Volume 11, November 2010 91
4. Factors Influencing Female Labor Force Participation in South Africa in 2008
night, and would have liked to work, and was available to start work within a week before the interview and had taken active steps to look for work or to start some form of business in the four weeks prior to the interview” (Stats SA, 2001). The variable was grouped into four categories in the QLFS 2008 as follows: (1) Employed, (2) Unemployed, (3) Not economically active, and (4) discouraged job seekers. The variable Female Labor Force Participation status (FLFP status) was regrouped in SPSS with categories 1 and 2 = 1 and categories 3 and 4 = 0 and recoded as Yes and No – i.e., participate and not participate respectively.
For the distributions by demographic characteristics, the mean of each category within variables was computed to obtain the mean as the annual rate. This study also compared Quarter 1 (Q1) to Quarter 4 (Q4) of the Labor Force Survey to take into account quarterly dynamics in the labor market and their impact on FLFP.
6. RESULTS
Table 1 shows the results of the analysis of the racial composition of the population of working age (15–64 years). The results show that the female population of working age was predominantly Black/African females, com-prising nearly 80% in all Quarters 1–4. There was only a slight decrease in the composition of Black females in the labor force during Q3 and Q4. Colored, White, and Indian/Asian groups came next in terms of proportion in the labor force at 11%, 7%, and 2% respectively across all quarters. This composition also reflects the population structure of South Africa according to the 2001 Census. However, while for Africans and Coloreds there was an increase in representation in the labor force between 2001 and 2008, the proportions for Indians and Whites declined. The decline is more pro-nounced for Whites, representing a reduction of about 3 percentage points between 2001 and 2008.
Journal statistique africain, numéro 11, novembre 201092
Yakubu A. Yakubu
Table 1: Distribution of the female population aged 15–64 by ethnic group (%)
Population group
Q1 Q2 Q3 Q4 2008 Census 2001
African/Black 79.9 79.5 79.1 79.2 79.4 77.6
Colored 11.0 11.1 11.0 10.8 11.0 9.2
Indian/Asian 2.3 2.4 2.4 2.7 2.5 2.8
White 6.8 6.9 7.4 7.3 7.1 10.4
Total 100 100 100 100 100 100
Population group 32,077 31,693 31,399 31,299 31,617 14,784,218
Sources: QLFS 2008 and Census 2001, Statistics South Africa.
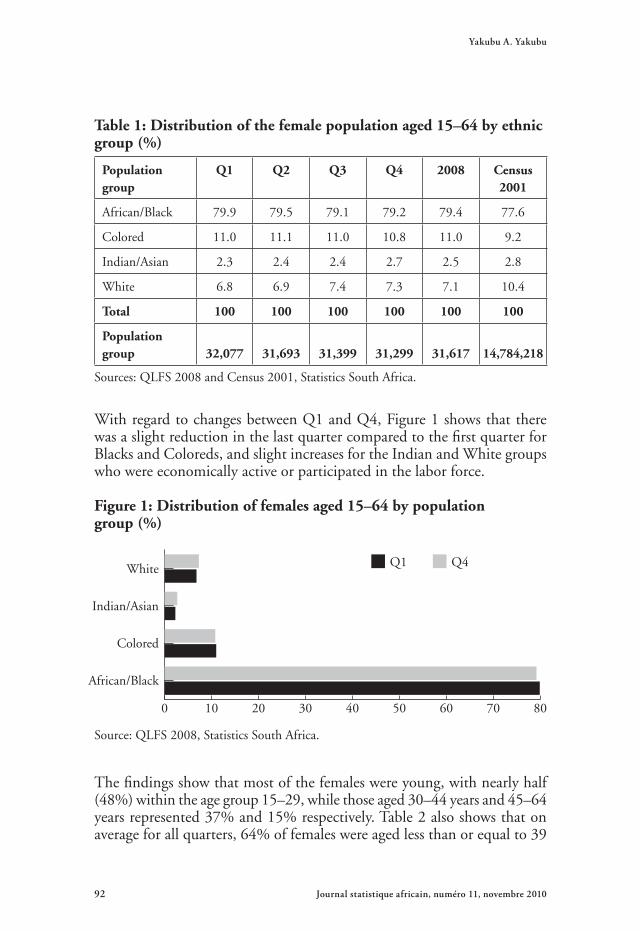
With regard to changes between Q1 and Q4, Figure 1 shows that there was a slight reduction in the last quarter compared to the first quarter for Blacks and Coloreds, and slight increases for the Indian and White groups who were economically active or participated in the labor force.
Figure 1: Distribution of females aged 15–64 by population group (%)
0
White
Indian/Asian
Colored
African/Black
Q1
10 20 30 40 50 60 70 80
Q4
Source: QLFS 2008, Statistics South Africa.
The findings show that most of the females were young, with nearly half (48%) within the age group 15–29, while those aged 30–44 years and 45–64 years represented 37% and 15% respectively. Table 2 also shows that on average for all quarters, 64% of females were aged less than or equal to 39
The African Statistical Journal, Volume 11, November 2010 93
4. Factors Influencing Female Labor Force Participation in South Africa in 2008
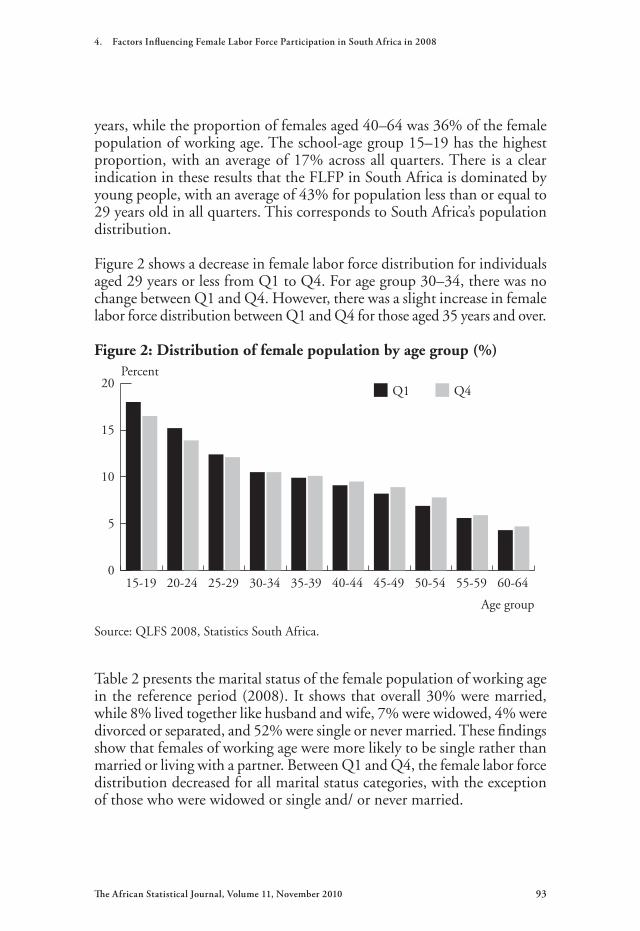
years, while the proportion of females aged 40–64 was 36% of the female population of working age. The school-age group 15–19 has the highest proportion, with an average of 17% across all quarters. There is a clear indication in these results that the FLFP in South Africa is dominated by young people, with an average of 43% for population less than or equal to 29 years old in all quarters. This corresponds to South Africa’s population distribution.
Figure 2 shows a decrease in female labor force distribution for individuals aged 29 years or less from Q1 to Q4. For age group 30–34, there was no change between Q1 and Q4. However, there was a slight increase in female labor force distribution between Q1 and Q4 for those aged 35 years and over.
Figure 2: Distribution of female population by age group (%)
15-19
Q1
Percent
20-24 25-29 30-34 35-39 40-44 45-49 50-54 55-59 60-64
Q4
0
5
10
15
20
Age group
Source: QLFS 2008, Statistics South Africa.
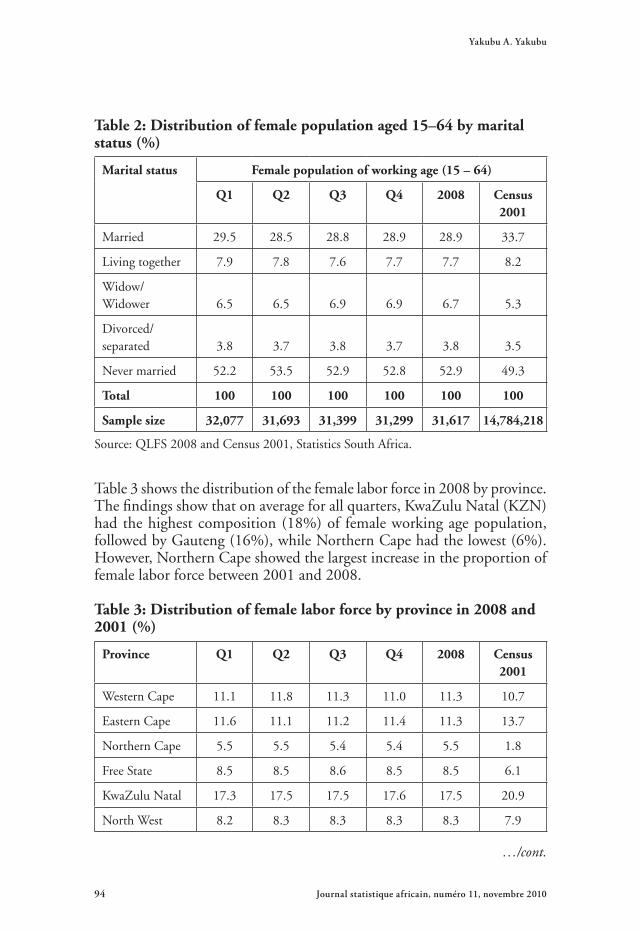
Table 2 presents the marital status of the female population of working age in the reference period (2008). It shows that overall 30% were married, while 8% lived together like husband and wife, 7% were widowed, 4% were divorced or separated, and 52% were single or never married. These findings show that females of working age were more likely to be single rather than married or living with a partner. Between Q1 and Q4, the female labor force distribution decreased for all marital status categories, with the exception of those who were widowed or single and/ or never married.
Journal statistique africain, numéro 11, novembre 201094
Yakubu A. Yakubu
Table 2: Distribution of female population aged 15–64 by marital status (%)
Marital status Female population of working age (15 – 64)
Q1 Q2 Q3 Q4 2008 Census 2001
Married 29.5 28.5 28.8 28.9 28.9 33.7
Living together 7.9 7.8 7.6 7.7 7.7 8.2
Widow/ Widower 6.5 6.5 6.9 6.9 6.7 5.3
Divorced/ separated 3.8 3.7 3.8 3.7 3.8 3.5
Never married 52.2 53.5 52.9 52.8 52.9 49.3
Total 100 100 100 100 100 100
Sample size 32,077 31,693 31,399 31,299 31,617 14,784,218
Source: QLFS 2008 and Census 2001, Statistics South Africa.
Table 3 shows the distribution of the female labor force in 2008 by province. The findings show that on average for all quarters, KwaZulu Natal (KZN) had the highest composition (18%) of female working age population, followed by Gauteng (16%), while Northern Cape had the lowest (6%). However, Northern Cape showed the largest increase in the proportion of female labor force between 2001 and 2008.
Table 3: Distribution of female labor force by province in 2008 and 2001 (%)
Province Q1 Q2 Q3 Q4 2008 Census 2001
Western Cape 11.1 11.8 11.3 11.0 11.3 10.7
Eastern Cape 11.6 11.1 11.2 11.4 11.3 13.7
Northern Cape 5.5 5.5 5.4 5.4 5.5 1.8
Free State 8.5 8.5 8.6 8.5 8.5 6.1
KwaZulu Natal 17.3 17.5 17.5 17.6 17.5 20.9
North West 8.2 8.3 8.3 8.3 8.3 7.9
…/cont.
The African Statistical Journal, Volume 11, November 2010 95
4. Factors Influencing Female Labor Force Participation in South Africa in 2008
Table 3 (cont.)
Province Q1 Q2 Q3 Q4 2008 Census 2001
Gauteng 16.3 16.0 16.5 16.7 16.4 21.2
Mpumalanga 9.7 9.6 9.4 9.4 9.5 6.7
Limpopo 11.9 11.8 11.7 11.6 11.8 11.0
Total 100 100 100 100 100 100
Sample size 32,077 31,693 31,399 3,1299 31,617 14,784,218
Sources: QLFS 2008 and Census 2001, Statistics South Africa.
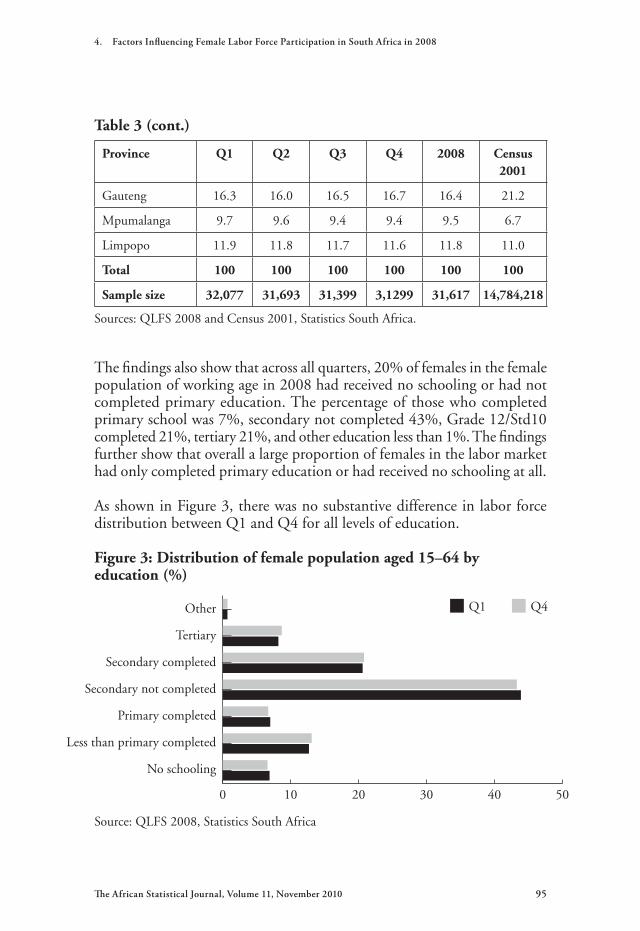
The findings also show that across all quarters, 20% of females in the female population of working age in 2008 had received no schooling or had not completed primary education. The percentage of those who completed primary school was 7%, secondary not completed 43%, Grade 12/Std10 completed 21%, tertiary 21%, and other education less than 1%. The findings further show that overall a large proportion of females in the labor market had only completed primary education or had received no schooling at all.
As shown in Figure 3, there was no substantive difference in labor force distribution between Q1 and Q4 for all levels of education.
Figure 3: Distribution of female population aged 15–64 by education (%)
Q1 Q4
0 10 20 30 40 50
Other
Tertiary
Secondary completed
Secondary not completed
Primary completed
Less than primary completed
No schooling
Source: QLFS 2008, Statistics South Africa
Journal statistique africain, numéro 11, novembre 201096
Yakubu A. Yakubu
7. LABOR MARKET INDICATORS
In this section, we look at the labor market status, comparing the findings of QLFS 2008 with Census 2001, and provide the major labor market indicators.
The population of working age who were employed slightly increased between Q1 and Q4 from 35.8% to 36.6%. The proportion of those who were unemployed or not actively seeking employment decreased over the same period. On average, 37% of the economically active population were employed in 2008, while 12.5% were unemployed and 4.3% were not actively seeking jobs. Another 46% were not economically active.
The major labor market indicators are calculated using the following FLFP rate relationships;
• FLFP rate = Female (empld+unempld) * 100/female (15-64).
• Absorptnrate=Employed*100/Total females (15-64)
• Unemploymentrate=unemployment*100/unemployed+employed
FLFP rate remained stable at 49%, except in Q2 which reported 51%. The FLFP rate for 2008 was 49%. The absorption rate remained stable at 37% in 2008, except in Q2, which reported 39%. The female unemployment rate was highest in Q1 at 27%, but this decreased quarter on quarter with a minimum figure registered in Q2 at 24%; it averaged 25% for 2008 with average sample size of 31,617.
In the labor market, the absorption rate was higher than the unemployment rate in all quarters. Overall, there was a stable FLFP rate in all quarters except for a slight increase in Q1.
7.1 Logistic regression analysis
Table 4 presents the logistic regression results (odds ratios) between the dependent variable “FLFP” (participate and not participate), and explana-tory variables (education status, marital status, population group, age group, and province). In Model 1, the effect of education on FLFP is estimated. Taking “no schooling” as a reference, the results show that overall, having some schooling increases the odds of females participating in the labor
The African Statistical Journal, Volume 11, November 2010 97
4. Factors Influencing Female Labor Force Participation in South Africa in 2008
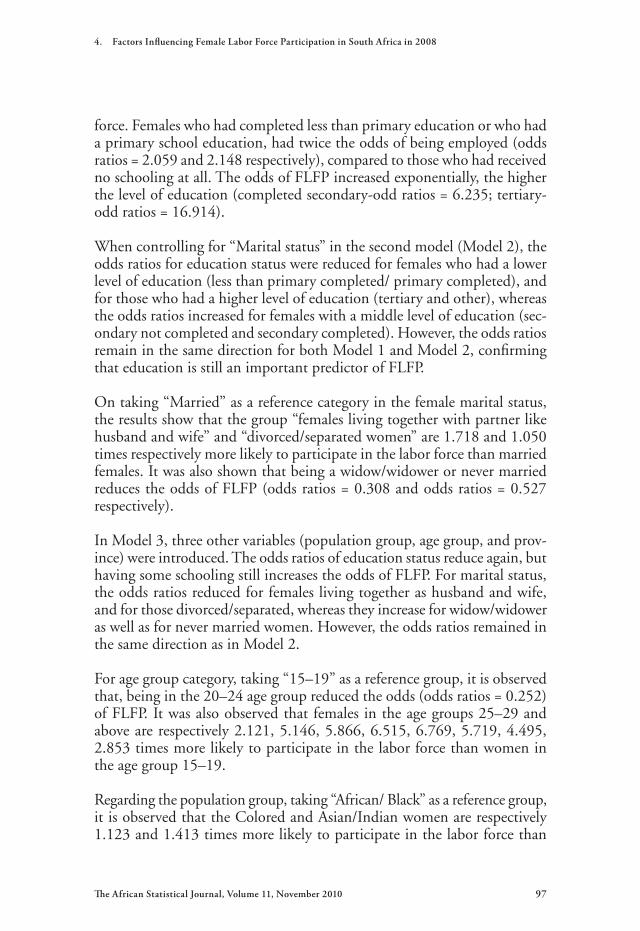
force. Females who had completed less than primary education or who had a primary school education, had twice the odds of being employed (odds ratios = 2.059 and 2.148 respectively), compared to those who had received no schooling at all. The odds of FLFP increased exponentially, the higher the level of education (completed secondary-odd ratios = 6.235; tertiary-odd ratios = 16.914).
When controlling for “Marital status” in the second model (Model 2), the odds ratios for education status were reduced for females who had a lower level of education (less than primary completed/ primary completed), and for those who had a higher level of education (tertiary and other), whereas the odds ratios increased for females with a middle level of education (sec-ondary not completed and secondary completed). However, the odds ratios remain in the same direction for both Model 1 and Model 2, confirming that education is still an important predictor of FLFP.
On taking “Married” as a reference category in the female marital status, the results show that the group “females living together with partner like husband and wife” and “divorced/separated women” are 1.718 and 1.050 times respectively more likely to participate in the labor force than married females. It was also shown that being a widow/widower or never married reduces the odds of FLFP (odds ratios = 0.308 and odds ratios = 0.527 respectively).
In Model 3, three other variables (population group, age group, and prov-ince) were introduced. The odds ratios of education status reduce again, but having some schooling still increases the odds of FLFP. For marital status, the odds ratios reduced for females living together as husband and wife, and for those divorced/separated, whereas they increase for widow/widower as well as for never married women. However, the odds ratios remained in the same direction as in Model 2.
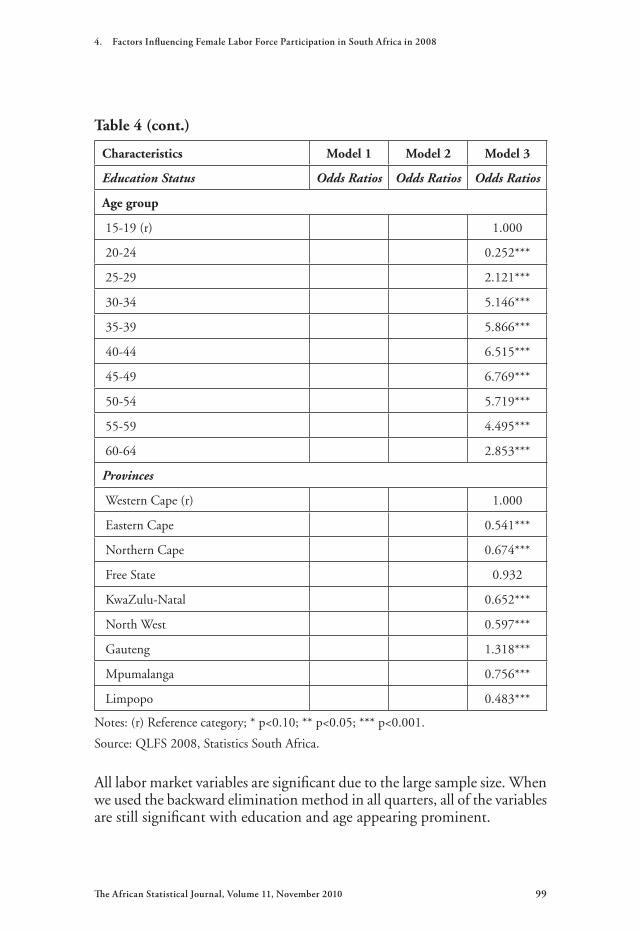
For age group category, taking “15–19” as a reference group, it is observed that, being in the 20–24 age group reduced the odds (odds ratios = 0.252) of FLFP. It was also observed that females in the age groups 25–29 and above are respectively 2.121, 5.146, 5.866, 6.515, 6.769, 5.719, 4.495, 2.853 times more likely to participate in the labor force than women in the age group 15–19.
Regarding the population group, taking “African/ Black” as a reference group, it is observed that the Colored and Asian/Indian women are respectively 1.123 and 1.413 times more likely to participate in the labor force than
Journal statistique africain, numéro 11, novembre 201098
Yakubu A. Yakubu
African/Black women, whereas being White reduces the odds (odds ratios = 0.895) of FLFP compared to African/Black women.
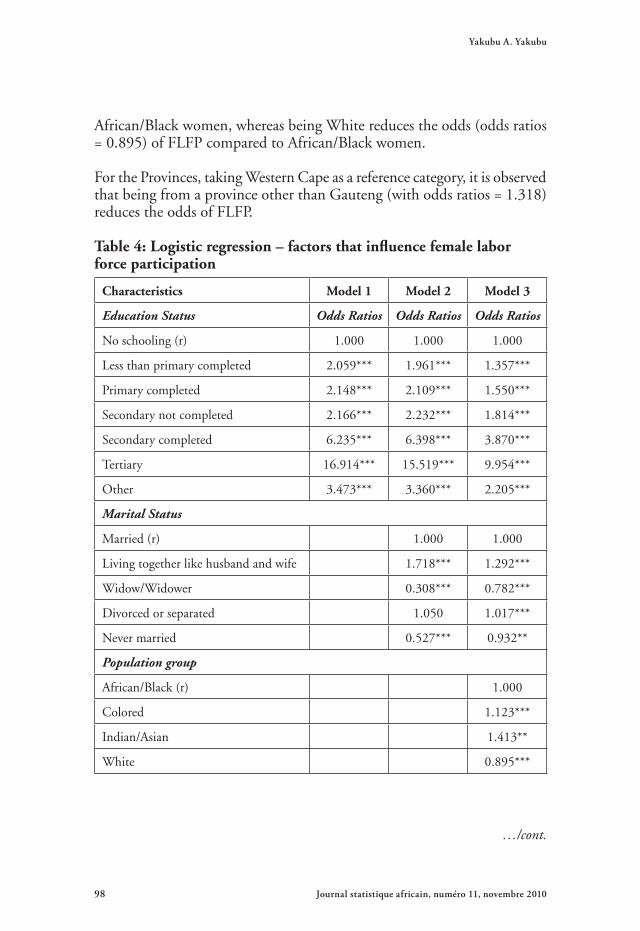
For the Provinces, taking Western Cape as a reference category, it is observed that being from a province other than Gauteng (with odds ratios = 1.318) reduces the odds of FLFP.
Table 4: Logistic regression – factors that influence female labor force participation
Characteristics Model 1 Model 2 Model 3
Education Status Odds Ratios Odds Ratios Odds Ratios
No schooling (r) 1.000 1.000 1.000
Less than primary completed 2.059*** 1.961*** 1.357***
Primary completed 2.148*** 2.109*** 1.550***
Secondary not completed 2.166*** 2.232*** 1.814***
Secondary completed 6.235*** 6.398*** 3.870***
Tertiary 16.914*** 15.519*** 9.954***
Other 3.473*** 3.360*** 2.205***
Marital Status
Married (r) 1.000 1.000
Living together like husband and wife 1.718*** 1.292***
Widow/Widower 0.308*** 0.782***
Divorced or separated 1.050 1.017***
Never married 0.527*** 0.932**
Population group
African/Black (r) 1.000
Colored 1.123***
Indian/Asian 1.413**
White 0.895***
…/cont.
The African Statistical Journal, Volume 11, November 2010 99
4. Factors Influencing Female Labor Force Participation in South Africa in 2008
Characteristics Model 1 Model 2 Model 3
Education Status Odds Ratios Odds Ratios Odds Ratios
Age group
15-19 (r) 1.000
20-24 0.252***
25-29 2.121***
30-34 5.146***
35-39 5.866***
40-44 6.515***
45-49 6.769***
50-54 5.719***
55-59 4.495***
60-64 2.853***
Provinces
Western Cape (r) 1.000
Eastern Cape 0.541***
Northern Cape 0.674***
Free State 0.932
KwaZulu-Natal 0.652***
North West 0.597***
Gauteng 1.318***
Mpumalanga 0.756***
Limpopo 0.483***
Notes: (r) Reference category; * p<0.10; ** p<0.05; *** p<0.001.
Source: QLFS 2008, Statistics South Africa.
All labor market variables are significant due to the large sample size. When we used the backward elimination method in all quarters, all of the variables are still significant with education and age appearing prominent.
Table 4 (cont.)
Journal statistique africain, numéro 11, novembre 2010100
Yakubu A. Yakubu
7.2 Limitations of the study
The main limitation of this study is that we were unable to measure the relationship between fertility, having young children, income and female labor force participation. It is typically found that the labor force participa-tion of women is negatively affected by the presence of young children or the likelihood of bearing children. Women with children as young as 6 or under are often hindered in their ability to participate fully in the formal employment, as they must spend time on child-bearing/childcare. However, other studies have also found the contrary with respect to Sub-Saharan Af-rica, where the region tends to have very high rates of FLFP, albeit largely in the informal sector or other nonregular or atypical work, and yet fertility rates have remained high. Similarly, income/wage levels also affect labor force participation. As reinforced by Fosu (1999), a woman’s decision to participate in the labor force is mainly related to her market wage expecta-tion and shadow price of time.
8. CONCLUSIONS AND RECOMMENDATIONS
The main objectives of this study were to highlight the demographic deter-minants or factors influencing FLFP status and, in particular, to investigate the relationship between FLFP and education, using descriptive statistics and binary logistics regression.
The female labor force is consistent with the population distribution of the Republic of South Africa for all the demographic variables investigated in the study (age, population group, educational status, marital status, and province of residence). However, it is a little different for the White racial group.
Despite the increased rate of unemployment in 2008, the female unemploy-ment rate decreased from 26.8% in Q1 to 25% in Q4. The labor market absorbed 37% of the female labor in Q4 compared to 36% in Q1, with overall 49% FLFP rate in the reference period. This revealed that just under half of female population of working age participate in the labor market.
The findings of this study are consistent with other surveys showing that there were more Black/African females in South Africa’s labor market than all other racial groups. This is followed by Colored women, then Indian/Asian women, and White respectively. This composition of the labor market reflects the population distribution of South Africa.
The African Statistical Journal, Volume 11, November 2010 101
4. Factors Influencing Female Labor Force Participation in South Africa in 2008
Females in the South African labor market tended to be young (between 15 and 29 years old), and single/never married. This is consistent with what has been described as the “demographically dense period of life” by Rindfuss (1991) and Amoateng et al., (2003). This is a period when multiple roles and events such as marriage, fertility, leaving school, unemployment, migration, and mortality occur. In the South African 2008 labor market, 48% of the FLFP was within the age group 15–29 years. Over 30% of females in the labor market were married.
In general, FLFP is shown to increase with the level of education. Among the females in the study, 20% were without educational skills, 7% had primary level education, over 43% of the female had some secondary edu-cation but did not complete, and 21% each of grade 12/std 10 and tertiary education. This result is significant because it highlights the challenges of labor market entry for females who do not have educational skills. This is consistent with previous findings that have shown unemployment rates generally to be higher among females than males as their job opportunities were limited compared to their male counterparts (Adison, 1993). As the demand for unskilled labor continues to decline in South Africa, FLFP will likely remain low for some time, as many women lack the basic education to be competitive in the labor market. The findings are consistent with the Human Capital Theory, in that there is a strong correlation between the level of education and FLFP. The better educated that women are, the more likely they are to participate in the labor market.
The analysis also revealed that in South Africa, females who participate in the labor force are more likely to be single/never married, as this group makes up about 53% of the female labor force. However, participation rates between subsets of this category showed the proportions to be: divorced, with the highest participation rate (68%), followed by those living together (57%), married (45%), widowed (45%), and never married/singles (45%).
The spatial distribution of FLFP across the nine provinces of South Africa was highest in KwaZulu Natal, although Gauteng had the largest female labor market, followed by Eastern Cape and Western Cape. The lowest participation rate was reported in Limpopo Province.
RecommendationsIn the light of the findings, we recommend that more effort, in addition to the existing constitutional provisions, be made to absorb females in the South African labor market. The education of women should also be en-
Journal statistique africain, numéro 11, novembre 2010102
Yakubu A. Yakubu
hanced, since it was found that education and training are strongly linked with FLFP as a focal point of the Human Capital Theory.
REFERENCES
Adison, T. (1993). “Employment and Earnings”. In: L. Demery, M. Fer-roni, C. Grootaert, and J. Wong-Valle (eds), Understanding the Social Effect of Policy Reform. Washington, DC: World Bank.
Amoateng, Y., Lucas, D., and Kalule-Sabiti, I. (2003). “South Africa’s Human Capital in the 1990s.” Paper presented at the African Studies Association and the Pacific 2003 Conference on “Africa on the Global Stage.”
Amsden, A. H. (1980). The Economics of Women and Work. Harmondsworth, UK: Penguin.
Becker, G. (1975). Human Capital: A Theoretical and Empirical Analysis with Special Reference to Education. New York: National Bureau of Economic Research (NBER).
Bhorat, H. and Leibbrandt, M. (2001). “Modeling Vulnerability and Low Earnings in the South Africa Labour Market.” In: H. Bloat, M. Leibbrandt, S. Van der Berg, and I. Woolard (eds), Fighting Poverty: Labour Markets and Inequality in South Africa. Cape Town: UCT Press.
Bhorat, M., Leibbrandt, M., Maziya, M., Van der Berg, S.M and Woolard, I. (eds) (2001). Fighting Poverty: Labour Markets and Inequality in South Africa. Cape Town: University of Cape Town Press.
Boserup, E. (1970). Woman’s Role in Economic Development. New York: St. Martin’s/ London: Earthscan Publications.
Bowen, W. and Aldrich Finegan, T. (1969). The Economics of Labor Force Participation. Princeton, NJ: Princeton University Press.
Fosu, A. K. (1999). “Cost of Living and Labour Force Participation: Mar-ried Women in Urban Labour Markets.” Journal of Labor Research, Vol. 20, No. 2, pp. 219–32.
The African Statistical Journal, Volume 11, November 2010 103
4. Factors Influencing Female Labor Force Participation in South Africa in 2008
ILO (2005). Employment Strategy Papers. Geneva: International Labour Organization. Available online at: http://www.ilo.org/public/english/em-ployment/strat/download/esp2005-11
Joll, C., McKenna, C., McKenna, R., and Shorey, J. (1983). Developments in Labour Market Analysis. London and Boston: George Allen & Unwin.
Maglad, N. A. (1998). “Female Labour Supply in Sudan.” AERC Special Paper No. 30. Nairobi: African Economic Research Consortium.
Malala, J. (2000). “Education.” In: C. Nxumalo (ed.), Portfolio of South Africa. Craigavon, Gauteng: Forecast Publications, pp. 74–77.
Mincer, J. (1962). “Labor Force Participation of Married Women: a Study of Labour Supply.” In: H. G. Lewis (ed.), Aspects of Labor Economics, pp. 63-101. Princeton, NJ: Princeton University Press.
Mlatsheni, C. and Leibrandt, M. (2001). “The Role of Education and Fertility in the Participation and Employment of African Women in South Africa.” University of Cape Town, Development Policy Regional Unit, Working Paper 01/54. Available online at: http://www.commerce.uct.ac.za/Research_Units/dpru/WorkingPapers/PDF_Files/wp54.pdf
Moghadam, V. M. (1998). Women, Work, and Economic Reform in the Middle East and North Africa. Boulder, Col. and London: Lynne Rienner Publishers.
Nam, S. (1991). “Determinants of Female Labour Force Participation: A Study of Seoul, South Korea, 1970–1980.” Sociological Forum, Vol. 6, No. 4, pp. 641–59.
Ntuli, M. (2004). “Determinants of South African Women’s Labour Force Participation, 1995–2004.” Discussion Paper No. 3119. Cape Town: Uni-versity of Cape Town Press and IZA.
Pierce-Brown, R. (1998). “An Application of Human Capital Theory to Salary Differentials in the Accounting Profession.” Women in Management Review, Vol.13, No. 5, pp. 192–200.
Posel, D. and Casale, D. (2003). “What Has Been Happening to Internal LabourMigrationinSouthAfrica,1993-1999?”South African Journal of Economics, Vol. 71, No. 3, pp. 455–479.
Journal statistique africain, numéro 11, novembre 2010104
Yakubu A. Yakubu
Psacharopoulos, G. and Tzannatos, Z. (1992). “Latin American Women’s Earnings and Participation in the Labor Force.” Policy Research Working Paper 856. Washington, DC: World Bank.
Rindfuss, R. (1991). “The Young Adult Years: Diversity, Structural Change, and Fertility.” Demography, Vol. 28, No. 4, pp. 493–511.
Sackey, H. A. (2005). “Female Labour Force Participation in Ghana: the Effects of Education.” AERC Research Paper, No. 150. Nairobi: African Economic Research Consortium.
Schafgan, M. A. (2000). “Gender Wage Differences in Malaysia: Parametric and Semi Parametric Estimation.” Journal of Development Economic, Vol. 62, pp. 351–78.
Serumaga-Zake, P-A. E. and Kotze, D. (2004). “Determinants of Labour Force Participation for Married Women in South Africa.” Journal for Studies in Economics and Econometrics, Vol. 28, No. 3, pp. 99–111.
Smith, J. P. (1980). Female Labour Supply: Theory and Estimation. Princeton, NJ: Princeton University Press.
Solomon, H. (2003). Turning Back the Tide: Illegal Immigration into South Africa. Pretoria: University of South Africa Press.
Statistics South Africa (2001). Census in Brief: Introduction. Available online at: statssa.gov.za/census01/census96/HTML/CIB/introduction.htm
Statistics South Africa (2008). Quarterly Labour Force Survey. See Stats SA website: http://www.statssa.gov.za/qlfs/index.asp
UNDP. Millennium Development Goals website:http://www.undp.org/mdg/basics.shtml
World Bank (1995). Toward Gender Equality: The Role of Public Policy. Washington, DC: World Bank.
World Bank (2001). Engendering Development through Equality in Rights, Resources and Voices. World Bank policy research report, Washington D.C.: Oxford University Press.
World Bank (2006). World Development Report 2006: Equity and Develop-ment. Available online via the World Bank website: www.worldbank.org