factors influencing adoption and use of precision
TRANSCRIPT

FACTORS INFLUENCING ADOPTION AND
USE OF PRECISION AGRICULTURE
Except where reference is made to the work of others, the work described in this dissertation is my own or was done in collaboration with my
advisory committee. This dissertation does not include proprietary or classified information.
____________________________________________ Anne Mims Adrian
Certificate of Approval: ____________________________ ____________________________ Thomas E. Marshall R. Kelly Rainer, Jr., Chair Associate Professor George Phillips Privett Professor Management Management ____________________________ ____________________________ Mark M. Clark Stephen L. McFarland Visiting Assistant Professor Dean Management Graduate School
FACTORS INFLUENCING ADOPTION AND
USE OF PRECISION AGRICULTURE
Anne Mims Adrian
A Dissertation
Submitted to
the Graduate Faculty of
Auburn University
in Partial Fulfillment of the
Requirement for the
Degree of
Doctor of Philosophy
Auburn, Alabama August 7, 2006

iii
FACTORS INFLUENCING ADOPTION AND
USE OF PRECISION AGRICULTURE
Anne Mims Adrian
Permission is granted to Auburn University to make copies of this dissertation at its discretion, upon request of individuals or institutions at their expense.
The author reserves all publication rights.
______________________ Signature of Author
______________________ Date of Graduation
iv
DISSERTATION ABSTRACT
FACTORS INFLUENCING ADOPTION AND
USE OF PRECISION AGRICULTURE
Anne Mims Adrian
Doctor of Philosophy, August 7, 2006 (M.S., Auburn University, 1987) (B.S, Auburn University, 1985)
181 Typed Pages
Directed by R. Kelly Rainer
While the potential for creating efficiencies are possible with precision
agricultural tools, the various combinations of tools, the steep learning curve of these
technologies, and the initial investment of each of the tools complicate farmers’
decisions to adopt these technologies. The purpose of this study is to create a model
that describes, explains, and predicts precision agriculture adoption. The research
takes a multi-disciplinary approach to studying precision agriculture adoption.
The proposed model is based on the Transtheoretical Model’s stage of change
and the decision making construct, decisional balance. Additionally, the constructs of
v
precision agriculture self-efficacy, perceived ease of use, and perceived compatibility
are integrated in the adoption decision model. A survey instrument was created to
measure stage of change, decisional balance, precision agriculture self-efficacy,
perceived ease of use, and perceived compatibility. 261 surveys were used in this
study to empirically test the adoption-decision model. The results indicated that
decisional balance, which is the weighing of importance of the advantages and
disadvantages of using precision agriculture did, in fact, predict the stage of change.
Additionally, perceived ease of use influenced the decisional balance. Perceived
compatibility affected both decisional balance and the stage of change. The study did
not find support that precision agriculture self-efficacy directly influenced the stage of
change, but precision agriculture self-efficacy did indirectly affect stage of change
through decisional balance and perceived ease of use. Farm size also influenced the
stage of change, while off-farm employment and educational level did not affect the
stage of change.
vi
ACKNOWLEDGEMENTS
Sincerest appreciation goes to my committee, Drs. Kelly Rainer, Mark Clark,
and Tom Marshall who have provided me encouragement, guidance, and support. I
value the knowledge that they contribute to the Information Systems field. Also, I
want to thank Dr. Junior Feild and Ms. Claire Field who offered the most genuine
form of friendship during my doctoral program. I especially want to express my
appreciation to the Computer Technology Unit. These colleagues are friends who
never complained about picking up the slack when I was away from the office.
I also want to thank the Auburn University Precision Agriculture Team,
particularly the agricultural Extension agents who have helped me understand
precision agriculture technologies and who have given me access to the clientele who
are the end-users of this technologies. Specifically, Ms. Shannon Norwood, Mr. Chris
Dillard, and Dr. John Fulton went beyond their professional duties to help me with this
research. I also appreciate the Department of Agronomy and Soils and the Alabama
Cooperative Extension System which provided grant funds to support this research.
Finally and most importantly, I want to thank my family. My husband, John,
and our three children, Kelly, David, and Haley, helped me stay “grounded”. They
were a steady source of love and support. I am also grateful for my parents, siblings,
and step-children who were always very encouraging during this process.
vii
Style manual used: Publication Manual of the American Psychological
Association, Fifth Edition
Computer software used: Microsoft Word 2003, End Note 8.0, Microsoft Excel
2003, SPSS 12.0.2, and AMOS 5.0
viii
TABLE OF CONTENTS
LIST OF TABLES ........................................................................................................ xii
LIST Of FIGURES....................................................................................................... xiv
CHAPTER 1 INTRODUCTION..................................................................................... 1
Precision Agriculture Technologies .................................................................... 2
Yield Monitors......................................................................................... 3
Targeted Soil Sampling ........................................................................... 4
Remote Sensing ....................................................................................... 4
Variable Rate Applicators ....................................................................... 5
Equipment Guidance Systems................................................................. 5
Precision Agriculture Research ........................................................................... 6
An Interdisciplinary Approach to Studying the Precision Agriculture
Adoption Decision Process .......................................................................... 8
Summary............................................................................................................ 10
CHAPTER 2 LITERATURE REVIEW........................................................................ 12
Development of a Precision Agricultural Stage of Change Model ................... 14
Stage of Change: The Transtheoretical Model .................................................. 16
Precontemplation................................................................................... 19
Contemplation ....................................................................................... 20
Preparation............................................................................................. 21
ix
Action .................................................................................................... 23
Maintenance .......................................................................................... 23
Decisional Balance ............................................................................................ 24
Pros ........................................................................................................ 26
Cons....................................................................................................... 34
Decisional Balance, Stage of Change, and Intention to Use Precision
Agriculture ................................................................................................. 35
Factors that Influence Decisional Balance and Stage of Change ...................... 36
Perceived Compatibility of Precision Agriculture with Existing
Farming Operations and Practices.................................................. 37
Perceived Ease of Use ........................................................................... 38
Precision Agriculture Self-efficacy ....................................................... 40
Communications Behaviors................................................................... 43
Socioeconomic Characteristics.............................................................. 45
Summary............................................................................................................ 47
CHAPTER 3 METHODOLOGY.................................................................................. 51
Research Protocol.............................................................................................. 51
Measure and Instrument Development.............................................................. 52
Participants’ Use of Precision Agriculture Tools .................................. 53
Target Behavior ..................................................................................... 53
Staging Algorithm ................................................................................. 55
Decisional Balance ................................................................................ 61
Perceived Ease of Use ....................................................................................... 67
x
Perceived Compatibility of Precision Agriculture with Existing
Operations and Practices ............................................................................ 68
Precision Agriculture Self-efficacy ................................................................... 69
Communications Behaviors............................................................................... 70
Farm Size, Educational Level, and Off-Farm Employment.............................. 71
Knowledge of Precision Agriculture ................................................................. 72
Participants ........................................................................................................ 72
Survey Procedure............................................................................................... 73
Sampling Methods............................................................................................. 73
Plan of Analysis................................................................................................. 74
Missing Data.......................................................................................... 74
Descriptive Statistics ............................................................................. 74
Confirmatory Factor Analysis ............................................................... 75
Decisional Balance and Stage Correlations........................................... 78
Structural Equation Modeling ............................................................... 78
Summary............................................................................................................ 79
CHAPTER 4 RESULTS................................................................................................ 80
Descriptive Statistics ......................................................................................... 80
Acres Managed...................................................................................... 81
Value of Sales........................................................................................ 83
Farm Status and Educational Level....................................................... 84
Knowledge, and Use of Precision Agriculture Tools ............................ 85
Communications Behaviors................................................................... 88
Confirmatory Factor Analysis ........................................................................... 91
Stage of Change..................................................................................... 92
xi
Decisional Balance ................................................................................ 99
Stages and Decisional Balance Correlations ....................................... 108
Precision Agriculture Self-Efficacy .................................................... 110
Perceived Compatibility with Existing Operations and Practices....... 114
Perceived Ease of Use ......................................................................... 118
Path Analysis Using Structural Equation Modeling........................................ 124
Goodness of Fit.................................................................................... 124
Path Analyses and Hypotheses Testing Using Structural
Equation Modeling....................................................................... 128
Summary.......................................................................................................... 134
CHAPTER 5 DISCUSSION ....................................................................................... 135
Review of Results............................................................................................ 136
Implications ..................................................................................................... 137
Limitations....................................................................................................... 139
Future Research ............................................................................................... 141
Summary.......................................................................................................... 144
REFERENCES............................................................................................................ 145
APPENDICES............................................................................................................. 160
Appendix A Cover Letter for the Survey Instrument ...................................... 161
Appendix B Survey Instrument ....................................................................... 163
xii
LIST OF TABLES
Table 1 Summary of Hypotheses .................................................................................49
Table 2 Precision Agriculture Tools Used ...................................................................54
Table 3 Producers’ Stages of Adoption for Precision Agriculture...............................55
Table 4 Items for Staging Algorithm............................................................................58
Table 5 Pros of Using Precision Agriculture................................................................63
Table 6 Cons of Using Precision Agriculture...............................................................65
Table 7 Ease of Use Items ............................................................................................67
Table 8 Perceived Compatibility Items ........................................................................68
Table 9 Precision Agriculture Self-efficacy Items. ......................................................69
Table 10 Sources of Information for Agricultural Production, Practices, and
Management...................................................................................................71
Table 11 Number of Acres Managed ...........................................................................82
Table 12 Farm Size Using Value of Sale Responses ...................................................83
Table 13 Farm Status and Educational Level...............................................................85
Table 14 Intention and Use of Precision Agriculture Tools.........................................87
Table 15 Mean, Standard Deviation, and Frequency of Using Sources for
Agricultural Production, Practices, and Management....................................89
Table 16 Mean, Standard Deviation, and Frequency of Importance of Sources
for Agricultural Production, Practices, and Management..............................90
xiii
Table 17 Mean Standard Deviation, Standardized Regression Weights, and
Internal Consistency Estimates for Stage of Change Construct.....................93
Table 18 Goodness of Fit Measures for the Stage of Change Construct......................97
Table 19 Goodness of Fit Measures for the Decisional Balance Construct ...............104
Table 20 Mean, Standard Deviation, Standardized Regression Weights and
Critical Ratio for Pros and Cons Subscales of Decisional
Balance Construct ........................................................................................106
Table 21 Means, Standard Deviation, and Correlations between Pros,
Cons, Decisional Balance and Stage of Change ..........................................109
Table 22 Goodness of Fit Measures for the Precision Agriculture Self-Efficacy
Construct ......................................................................................................113
Table 23 Means, Standard Deviation, Standardized Regression Weights and
Critical Ratio for Precision Agriculture Self-Efficacy Construct ................114
Table 24 Goodness of Fit Measures for the Perceived Compatibility with
Existing Operations and Practices Construct ...............................................117
Table 25 Means, Standard Deviation, Factor Loadings, and Critical Ratio for
Perceived Compatibility with Existing Operations and
Practices Construct.......................................................................................118
Table 26 Goodness of Fit Measures for the Perceived Compatibility with
Existing Operations and Practices Construct ...............................................122
Table 27 Means, Standard Deviation, Factor Loadings, and Critical Ratio for
Perceived Ease of Use Construct .................................................................123
Table 28 Goodness of Fit Measures ...........................................................................127
Table 29 Variance Explained in Endogenous Variables ............................................128
Table 30 Hypotheses and Path Results.......................................................................130
xiv
LIST OF FIGURES
Figure 1. Stage of change and processes of change .....................................................18
Figure 2. Structural model for stage of change in adoption of precision
agriculture ......................................................................................................50
Figure 3. Confirmatory factor analysis model for the stage of change construct.........98
Figure 4. Confirmatory factor analysis for decisional balance...................................102
Figure 5. Modified confirmatory factor analysis model for decisional balance.........103
Figure 6. Confirmatory factor analysis model for precision agriculture
self-efficacy..................................................................................................112
Figure 7. Modified confirmatory factor analysis model for precision agriculture
self-efficacy..................................................................................................112
Figure 8. Confirmatory factor analysis model for perceived compatibility ...............116
Figure 9. Modified confirmatory factor analysis model for perceived
compatibility ................................................................................................116
Figure 10. Confirmatory factor analysis model for perceived ease of use .................121
Figure 11. Modified confirmatory factor analysis model for perceived
ease of use ....................................................................................................121
Figure 12. Hypothesized model with indicator variables...........................................126
Figure 13. Structural equation model standardized regression weights
and variance .................................................................................................132
Figure 14. Stage of change continuum .......................................................................138
1
CHAPTER 1
INTRODUCTION
With advancements in Geographic Information System (GIS) and Global
Positioning System (GPS) technologies, farmers now have the ability to make crop
production and management decisions based on the variability of the soil properties
within fields. The term “precision agriculture” describes the integration of GIS and
GPS tools to provide an extensive amount of detailed information on crop growth,
crop health, crop yield, water absorption, nutrient levels, topography, and soil
variability. This information provides mechanisms to manage areas within fields
differently, according to the soil and crop characteristics. Some farmers and
researchers assert that precision agriculture technologies assist farmers in managing
their farms more effectively. Specific objectives of precision agriculture are to
increase profitability, increase production, reduce variable costs, reduce erosion,
reduce the environmental impact of chemicals, track and monitor the use of chemicals,
and manage large farms (Atherton, Morgan, Shearer, Stombaugh, & Ward, 1999;
Olson, 1998).
Crop production is largely dependent on the characteristics of the soil in which
they are grown. Farmers, since the advent of the tractor in the 1920s, have managed
farms with a whole-field approach. Traditional farming (or the whole-field approach)
requires farmers to apply inputs at the same rate across fields, regardless of the
2
inherent variation in the soil and landscape. For example, farmers apply the same
amount of fertilizer throughout the fields, regardless that some of the areas need more,
or less, fertilizer. Precision agriculture tools offer various functions. Some are
information gathering tools, such as yield monitors, targeted soil sampling, and remote
sensing tools. Other tools are variable rate technologies that vary the rate of fertilizer,
seeds, and pesticides. Additionally, guidance systems, such as light bars and auto steer
equipment, help the operator guide the equipment.
Since the incorporation of precision agriculture tools began in the mid-1980s,
initial adoption has been slow (Swinton & Lowenberg-DeBoer, 1998). Adoption of
precision agriculture is progressing, though. A 2003 farm survey indicated that 32
percent of Ohio farmers has adopted at least one precision agriculture tool (Batte,
2005). While there seems to be a plethora of agronomic and economic research related
to precision agriculture, the social sciences have been slow in analyzing the adoption
and use of precision agriculture (Lowenberg-DeBoer, 1996). Little is known about
why farmers decide to (or not to) adopt these technologies. The purpose of this study
is to create a model that describes, explains, and predicts farmers how make decisions
whether or not to adopt precision agriculture technologies.
Precision Agriculture Technologies
Precision agriculture tools are used to monitor crop yields, to apply inputs at a
variable, rather than at a constant rate, and to guide equipment. These tools are used to
determine soil electrical conductivity, manage soil on a site-specific basis, and to
monitor crop growth and health from satellite or aerial images. All of these tools use
3
GIS to acquire, process, analyze, and transform the data that farmers can use to better
manage production and increase profitability. GPS units are used to guide equipment
during chemical and irrigation applications and during harvest (Adrian, Dillard, &
Mask, 2004).
Precision agriculture technologies are used for different purposes, and in
various combinations, to fit the needs of individual producers. The information
gathering tools, such as yield monitors, targeted soil sampling, and remote sensing,
provide information about the fields as they vary in soil chemistry, moisture, fertility,
topography, and productivity (yields). This information is entered into GISs that map
these varying characteristics. The farmer uses GISs to create management zones which
identify subsets of the fields that hold different soil properties and production
potential. Farmers enter the appropriate rates of the inputs (i.e., fertilizer) for each
management zone into the GIS. The management zone mapping from the GIS is then
incorporated into variable rate applicators so the inputs are applied appropriately as
the equipment passes through the fields.
Yield Monitors
One information gathering tool is the yield monitor. Yield monitors are devices
installed on crop harvesting equipment, such as combines or cotton pickers. Yield
monitors collect information about the yield of the crop as the equipment travels
through the fields. Yield monitors are the most widely adopted precision agriculture
tool (Precision Ag, 2005; Swinton, Marsh, & Ahmad, 1997). Yield monitors use GPS,
GIS, computer, and sensor technologies to accurately measure the amount of crop
4
harvested and moisture content of the crop at a specific location and time. Data
gathered from yield monitors are transformed and transferred into the GISs so farmers
can create detailed harvest reports, determine trends from harvest to harvest, compare
the production capabilities of different varieties and crop inputs, and create
management zones.
Targeted Soil Sampling
The soil type and its physical and chemical characteristics must be in proper
balance to maximize production potential. Targeted soil sampling is a method to
determine the chemical characteristics of the soil (i.e., acidity levels and nitrogen
levels). Targeted soil sampling consists of two primary methods, grid and zone
sampling. In each method, GIS software is used with the GPS to create a boundary of
a field and divide the areas within the boundary into individual segments of grids or
zones. Grids are normally square in shape and range in size from one-half to two and
one-half acres in size. Zones are generally not uniform in shape, or size, and are often
based on Natural Resource Conservation Service (NRCS) soil maps, areas of similar
yield production, or any variable used for delineation. GISs provide the capability to
collect and view soil sampling data. By using targeted soil sampling, farmers collect
site-specific information that is used to make decisions on how to vary inputs in the
management zones.
Remote Sensing
Remote sensing, another information gathering tool, provides aerial and
satellite images of the crop during its growing season. Remotely sensed data
5
transferred to a GIS reveals information about soil characteristics, such as moisture
content and general crop health. Remotely sensed data gives farmers near real-time
information regarding their crop which allows them to make corrective management
decisions by rectifying deficiencies before the crop is ready for harvest. This remotely
sensed data, entered in a GIS, is used to make decisions on varying the rates of inputs
in the management zones. This information is then transferred to variable rate
applicators which apply the inputs as specific in the GIS.
Variable Rate Applicators
Variable rate applicators allow farmers to vary inputs, such as fertilizers,
pesticides, seed varieties, and seeding rates throughout fields based on data retrieved
from the information gathering tools. The input rates for management zones are
entered into the GIS. This information is then transferred to the GPS-controlled
variable applicator which is attached to the equipment. The purpose of varying input
rates is to increase yields or reduce costs, depending on the managers’ goal for the
management zones.
Equipment Guidance Systems
Equipment operators have traditionally relied on visual cues, such as points on
the horizon, marking systems consisting of foam emitters, tire tracks, or by counting
number of rows to begin the next application pass. These methods lack the accuracy
needed to avoid skips and overlaps. Additionally, they do not work at night.
Equipment guidance systems, placed on agricultural machinery, are used to assist in
steering the equipment in a more concise pattern by integrating GIS, GPS, on-board
6
computing, and directional indicator devices to keep the machinery traveling in the
most efficient manner across a field (Adrian et al., 2004).
Auto steer equipment and light bars are two of the most widely used guidance
tools. The lightbar uses a directional indicator device that provides navigational
information to the operator. The auto-steer systems, similar to lightbar systems,
actually steer the machinery, instead of the equipment operator. Auto-steer systems
use a real-time kinematic form of GPS that incorporates a base station located on the
farm that sends GPS data to the antenna located on the equipment. These guidance
systems reduce redundancy, reduce labor costs, and expand hours of operation (Adrian
et al., 2004).
While some researchers have found that precision agriculture tools are adopted
sequentially (Isik, Khanna, & Winter-Nelson, 2000), others have found that the full
potential of the individual components will not be realized unless the components are
used as a set. For instance, the information captured with the yield monitor must be
referenced and stored in a GIS. Next, maps are created and analyzed. Then, a variable
rate applicator is used to vary chemicals throughout the fields (Batte, Pohlman,
Forster, & Sohngen, 2003) according to the potential production of the grid or
management zones.
Precision Agriculture Research
The rapid growth of precision agriculture has sparked research in many areas
to include agronomic evaluation of these technologies, development of appropriate
uses of the technologies, demographic patterns of use of these technologies, and
7
economic and environmental benefits of the technologies. The demographic research
has focused on farm size (Khanna, 2001), farming experience, education (Hudson &
Hite, 2003), access to information (Daberkow & McBride, 2003), location of the farm,
and physical attributes of the farm, such as variability of soil types and crops grown.
Most economic research in precision agriculture has focused on the profitability of
specific tools in specific commodities (Swinton & Lowenberg-DeBoer, 1998).
Very little attention has been given to the perceptions and attitudinal reasons
for farmers to adopt these technologies (Adesina & Baidu-Forson, 1995; Cochrane,
1993). Evaluating the perceptions and attitudes of farmers can lead to understanding
why farmers adopt technologies beyond the economic benefit, and what industry and
researchers may focus on to affect adoption of these technologies. Furthermore, the
omission of producers’ attitudes toward the technologies studied may lead to biased
results (Adesina & Zinnah, 1993).
A few studies have examined producers’ attitudes toward precision agriculture
(Adrian, Norwood, & Mask, 2005; Napier, Robinson, & Tucker, 2000; Swinton et al.,
1997). Swinton et al (1997) used focus groups to identify several barriers to adopting
precision agriculture. Two of these barriers were concerns over the initial cost of the
technologies and keeping up with technologies that are rapidly changing. Napier et al.
(2000) investigated producers’ perceptions of the importance of conservation practices
and having environmental information for management purposes and their intentions
for using precision agriculture. They also investigated the farmers’ perceptions of their
ability in using precision agriculture. Napier et al. (2000) found that farmers who

8
perceived that they would receive returns on conservation investments and that
conservation information was important in farm management decision-making were
more likely to adopt precision agriculture. The farmers’ perceptions of their ability to
use precision agriculture were not a significant factor in the intention to adopt
precision agriculture.
Conversely, Adrian et al. (2005) found that farmers’ confidence in using
precision agriculture affected the intention to adopt of precision agriculture
technologies. They also found that the farmers’ perceptions of net benefit affected the
intention to use precision agriculture technologies. The perceptions of ease of use were
not a significant factor affecting the intention to adopt precision agriculture.
An Interdisciplinary Approach to Studying the Precision Agriculture Adoption
Decision Process
Precision agriculture technologies are used to manage specific areas of fields
and to achieve long-term goals of sustainability by providing historical information on
the soil and crop variations throughout farmers’ fields. Precision agriculture also
provides accurate recordkeeping for government regulations. Some researchers see
precision agriculture as part of the larger context of Information Systems (IS) in
agriculture (Sonka & Coaldrake, 1996). Just as IS is not a homogenous product
(Markus & Robey, 1988), neither is precision agriculture. Rather, precision agriculture
is the use of the various combinations of tools used for strategic, tactical, and
operational improvement of agriculture production (Bouma, Stoorvogel, van Alphen,
& Booltink, 1999; National Research Council, 1997).
9
While the potential of creating efficiencies exists with precision agricultural
tools, these tools are fundamentally changing the way farmers make production
decisions (Sonka, 1998). Precision agriculture is an integration of GIS and GPS tools
that can be used in a variety of combinations that fit the goals and operations of the
farm manager. The steep learning curve of these technologies and the initial
investment of each of the tools complicate farmers’ adoption decisions. Part of the
difficulty of researching these factors is that precision agriculture is not one particular
tool, such as the motorized tractor, or a particular practice, such as no till farming.
Farmers must decide which tools and software will provide efficiencies for their
situations.
The IS field offers many methodologies for investigating technology diffusion,
the intention to adopt information technologies, and attitudes and perceptions toward
these technologies. Many of these methodologies borrow from the psychology,
sociology, and organizational change theories. The IS field has established several
streams of research that could be used in studying precision agriculture adoption,
assimilation, and use.
One theory borrowed from psychology is the Theory of Reason Action (TRA)
which defines attitudes toward a technology as the individual’s beliefs about the
consequences of adopting and using the technology and the assessment of these
consequences (Fishbein & Ajzen, 1975). Attitudes toward a technology, particularly
individuals’ perceptions of their own capabilities and beliefs they can learn to use
technology (Compeau & Higgins, 1995; Necessary & Parish, 1996; Rainer & Miller,
10
1996), affect whether individuals will adopt the technology (Chau, 2001; Davis, 1989;
Milbrath & Kinzie, 2000). Further, attitudes of confidence in producers’ abilities, have
not been studied in the adoption and use of precision agriculture technology.
From sociology, Diffusion of Innovation (DoI) (Rogers, 1983) indicates that
perceptions of relative advantage, complexity, and compatibility with values and
operations will affect adoption of technology. Additionally, exposure to technology
and interpersonal communication also affect the intention to adopt technologies
(Rogers, 1983).
Additionally, psychology offers other methods of explaining and predicting
behavioral change and technology adoption. The Transtheoretical Model (TTM),
developed in the 1980s (Prochaska & Norcross, 2001; Prochaska, Velicer,
DiClemente, & Fava, 1988) predicts and explains behavioral change based on stages
that one moves through as one is considering a change, then prepares for the change,
makes the change, and maintains the changed behavior. The TTM incorporates how
individuals value the advantages and disadvantages of behavioral change. Although
the TTM has not been used in IS research, the model could be useful in analyzing the
behavior change associated with adoption of technologies. The TTM is used as the
basis of this study, along with TRA and DoI.
Summary
Adoption of technology is not easily predicted solely on its potential
economical benefits. Other factors affect farmers’ decisions to adopt new technology
(Cochrane, 1993; Vanclay, 1992). Utilizing the IS field is a logical choice in
11
researching precision agriculture adoption because precision agriculture technologies
are IS, mostly geographical in context, that are used to make management decisions
and operate more efficiently (Bouma et al., 1999; National Research Council, 1997).
Additionally, other disciplines offer methodologies for studying the precision
agriculture adoption-decision process. The IS field has borrowed from psychology and
sociology disciplines in creating models that explain the use of information
technologies.
Although the TTM has never been used in the IS field, it offers a process that
could be useful in explaining the precision agriculture adoption decision. This study
develops a model using the TTM and the stage of change as its focal point. Other
theories from organizational change, sociology, and psychology are also used in
developing this model to explain the precision agriculture adoption-decision process.
12
CHAPTER 2
LITERATURE REVIEW
Theories from sociology, business, and psychology offer models from which a
theoretical framework can be built to explain the cognitive and affective processes of
change that producers go through when making the decision to adopt new
technologies, such as precision agriculture. Although researchers have used cognitive
and affective attributes to study adoption of technology in organizations, these
attributes have seldom been studied in the agricultural industry.
Three theories are particularly applicable in understanding the decision process
for adopting and implementing precision agriculture technologies. These are the
Information-Decision Process Model (IDPM), the Creating Readiness of Change
Model (CRCM), and the TTM. Using the IDPM, Rogers (1995) explained how
innovations diffuse throughout social systems. This model describes information-
seeking and information-processing activities as part of the decision-making process.
As individuals learn more about an innovation, the uncertainty about an innovation
decreases. Armenakis, Harris, and Feild (1993) developed the CRCM to explain how
communicating the advantages of change, confidence, and support in organizations
can influence the readiness of organizational members to embrace change. The TTM
(Prochaska & Norcross, 2001; Prochaska et al., 1988), developed by psychologists,
explains how to facilitate behavioral change across a wide range of health behaviors
13
by stage-matching interventions. They have more recently applied their stage of
change framework to organizational changes (Cunningham et al., 2002; Levesque,
Prochaska, & Prochaska, 1999, 2001; Prochaska, Levesque, Prochaska, Dewart, &
Wing, 2001; Prochaska, Prochaska, & Levesque, 2001).
These models offer guidance for understanding individuals’ attitudes
explaining the intention, adoption, and acceptance of new technologies. While each
model has its advantages and has been applied in different environments, adapting
each model to the adoption process of precision agriculture has certain challenges. No
one model is satisfactory in explaining the stages of adoption of precision agricultural
technologies. Therefore, this study develops an integrated model, including applicable
portions of the three models, to describe, explain, and predict the stage of change
associated with the precision agriculture adoption-decision process.
Additionally, the IS research field offers methodologies useful in determining
the adoption of information technologies. Because precision agriculture technologies
are IS, mostly geographical in context, that are used to make better management
decisions and operate more efficiently (National Research Council, 1997; Swinton &
Lowenberg-DeBoer, 1998), borrowing from the IS field is a logical choice in
researching precision agriculture adoption.
Davis (1989) developed the Technology Acceptance Model (TAM) which
examined perceived usefulness and perceived ease of use as predictors for software
application use. It has been used extensively and expanded for the past decade. Moore
and Benbasat (1991) enhanced the model to include three other characteristics of
14
technology defined by Rogers (1995) as important indicators of innovation
acceptance. Moore and Benbasat (1991) included compatibility, demonstratability, and
trialability, as well as relative advantage and complexity in their model.
The purpose of this study is to create a model that describes, explains, and
predicts the stage of change associated with the precision agriculture adoption-
decision process. The TTM model is the basis for modeling the stage of change
associated with the adoption of precision agriculture by incorporating appropriate
theories from IDPM, CRCM, and IS research.
Development of a Precision Agricultural Stage of Change Model
The stages described in the TTM and in the IDPM offer different approaches,
but they are similar. The central organization of TTM is based on the five stages of
change (Prochaska et al., 2001) that people go through when becoming aware of the
possibility of the change, the decision to adopt, the implementation of the change, and
the maintenance of the change. Prochaska and his colleagues posited that individuals
go through ten processes of change during the five stages of change. The TTM has
been used extensively in behavioral research for more than twenty years and has more
recently been used in organizational change research (Cunningham et al., 2002;
Levesque et al., 1999, 2001; Prochaska et al., 2001; Prochaska et al., 2001). Rogers’
IDP model was used in the 1950s and 1960s in agriculture (Beal, Rogers, & Bohlen,
1957; Beal & Rogers, 1960), in medicine (Coleman, Katz, & Menzel, 1966), and in
education (Lamar, 1966). These studies found evidence that stages exist.
15
Understanding the factors that affect the stage of change is important to
advance and enhance the adoption process. In studying the precision agriculture
adoption-decision process, a researcher may ask: What factors influence the stage of
change of adoption? The CRCM posits that before individuals are willing to change,
they must see that there is value in changing, understand that the change is
appropriate, and have the ability to change (Armenakis & Harris, 2002; Armenakis,
Harris, & Feild, 1993, 1999).
Other factors can affect individuals’ acceptance of new technologies. In the
IDPM, Rogers (1995) explained that the socioeconomic characteristics of knowledge,
personality, innovativeness, communications behaviors, prior experience, and social
norms can affect the decision-making process. While the CRCM recognized that
potential adopters’ characteristics are important in addressing the readiness for change,
the model does not specifically identify what characteristics are important.
Prochaska and his colleagues identified five stages of change in the TTM
(Adesina & Baidu-Forson, 1995; McConnaughy, Prochaksa, & Velicer, 1983;
Prochaksa, DiClemente, & Norcross, 1992) as precontemplation, contemplation,
preparation, action, and maintenance. Each stage is represented by a time period,
implying that the change will occur over time. This study uses the TTM as the basis of
stage of change in the adoption of the precision agriculture process. The next section
of this chapter describes the stage of change as potential adopters of precision
agriculture make their decisions to adopt these technologies. The second section of
this chapter describes the decisional balance and processes of change as the decision to
16
adopt precision agriculture evolves. Lastly, the chapter identifies the characteristics
that would influence the decision to adopt precision agriculture technologies.
Stage of Change: The Transtheoretical Model
The TTM integrates four theoretical constructs: stage of change, decisional
balance (Janis & Mann, 1977), self-efficacy, and processes of change to explain
behaviors associated with the decision to change behaviors. The central organization
of the TTM is based on the five stages of change (Prochaska et al., 2001):
precontemplation, contemplation, preparation, action, and maintenance. Individuals
modify their behavior as they move through these five stages. Rogers’ (1995) also
described a five-stage model that he called the Innovation-Decision Process (IDPM).
The model describes the cognitive activities and decisions that, over time, decrease
uncertainty about an innovation. He identified the five stages as: knowledge,
persuasion, decision, implementation, and confirmation. In Diffusion of Innovations,
Rogers (1995) recognized the TTM and compared the five IDPM stages to the five
TTM stages (pg 190).
The precision agriculture stage of change model is built around the TTM. A
practical advantage of the TTM is that it offers a method to match interventions with
the stage of change the individual is in, thus improving the effectiveness of the change
efforts. Change agents use the model to access the potential adopter’s stage, and then
adjust and match the activities—identified as the processes of change—and
communications that would help the potential adopter progress through change. The
advantage, from a research viewpoint, is that the TTM provides methods for
17
identifying the stage of change and the development of the decisional balance
(Armitage, Sheeran, Conner, & Arden, 2004). Thus, the model presented in this
research is built around the TTM and is complimented by applicable portions of the
IDPM and the CRCM.
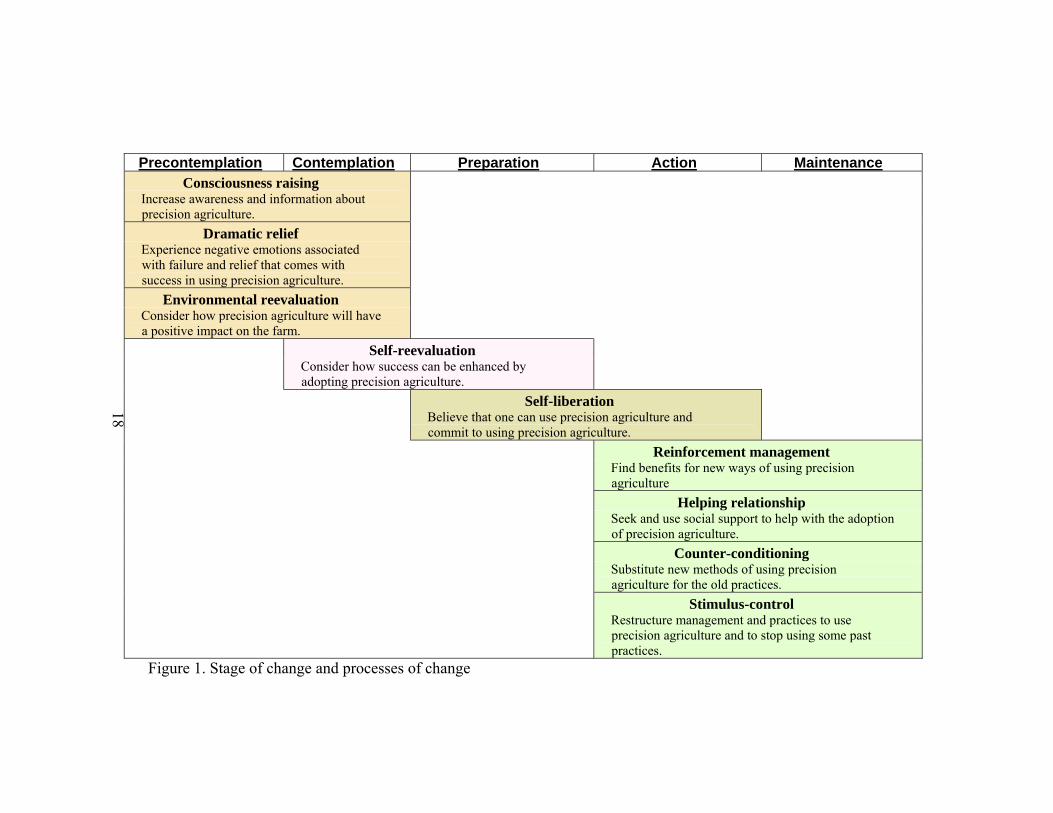
The TTM is based on changes that progress, over time, through a series of
stages. These covert and overt activities facilitate the movement from one stage to the
next stage. These processes, shown in Figure 1, are described as they would apply to
the stage of change of using precision adoption to capture crop and field information
for improved crop production and management strategies. Change agents would use
these processes of change as strategies to help potential adopters progress from one
stage to the next. The ten cognitive and behavioral strategies used are consciousness
raising, dramatic relief, environmental reevaluation, self-liberation, reinforcement
management, helping relationship, counter-conditioning, and stimulus-control. Some
strategies are used more in some stages than others. For instance, reinforcement
management is used more to progress from the action stage to the maintenance stage
than in the earlier stages. The processes are mentioned as part of this literature review
because of the theoretical importance in the TTM. Figure 1 shows where each process
(or activity) is used in relation to the appropriate stage. This study did not measure the
processes of change.
The original research (McConnaughy, DiClemente, Prochaksa, & Velicer,
1989; McConnaughy et al., 1983) identified four stages— precontemplation,
contemplation, action, and maintenance. However, subsequent studies
18
Precontemplation Contemplation Preparation Action Maintenance Consciousness raising
Increase awareness and information about precision agriculture.
Dramatic relief Experience negative emotions associated with failure and relief that comes with success in using precision agriculture.
Environmental reevaluation Consider how precision agriculture will have a positive impact on the farm.
Self-reevaluation Consider how success can be enhanced by
adopting precision agriculture.
Self-liberation Believe that one can use precision agriculture and
commit to using precision agriculture.
Reinforcement management Find benefits for new ways of using precision
agriculture Helping relationship Seek and use social support to help with the adoption
of precision agriculture. Counter-conditioning Substitute new methods of using precision
agriculture for the old practices. Stimulus-control Restructure management and practices to use
precision agriculture and to stop using some past practices.
Figure 1. Stage of change and processes of change
19
(DiClemente et al., 1991; Prochaksa et al., 1992) revealed five stages—
precontemplation, contemplation, preparation, action, and maintenance. The
researchers used a different statistical method and found a stage between
contemplation and action that was not recognized in the initial studies. The new stage
was named preparation, representing actions that prepare individuals for a behavioral
change (Prochaksa et al., 1992). Additionally, Reed (1994) divided that
precontemplation stage into two subcategories for non-believers and believers.
Precontemplation
Precontemplation is the initial stage when individuals may not know that the
technology exists or may know only a little about it. Individuals in this stage are
making no efforts to change. Prior to becoming aware of an innovation, individuals
may not see a need for a change (Armenakis et al., 1993; Prochaska et al., 2001;
Rogers, 1995) or realize that the technology is appropriate for their operations
(Armenakis et al., 1993). Individuals in the precontemplation stage tend to avoid
changing their thinking and behavior. Agricultural producers may not see that
precision agriculture is a possibility or may not be aware of these technologies or how
they can work within their farm operations. The knowledge seeking activities are
mainly cognitive and the forming of an attitude about the technology begins in the
next stage (Rogers, 1995). In this study, individuals in the precontemplation stage
have no intention of adopting the technology.
20
Contemplation
In the contemplation stage, potential adopters have knowledge of the
possibility of a change, and are pondering and considering the change. During this
stage, individuals develop an interest in the technology, seek more information, and
consider its merits. In this stage, individuals form attitudes about the technology.
Rogers (1995) described the second stage as mainly affective as individuals develop
attitudes about a technology. In this stage, individuals are motivated to seek
innovation-evaluation information. They may obtain information from scientific
evaluations and from peers. They may observe the technology being used by fellow
farmers or demonstrated by researchers or vendors. They may seek opportunities to try
the technology.
In the contemplation stage, individuals are seriously thinking about changing,
and they use consciousness-raising processes to gather further information. Producers
ponder and consider the technology for their operations, accept information that
precision agriculture is a viable technology, and form positive or negative attitudes
about it. To progress from precontemplation to contemplation, individuals use
consciousness to increase awareness and information about the technology and its
benefits. As individuals’ awareness of the technology increases, they become
knowledgeable of the technology’s benefits and its use (Levesque et al., 2001; Rogers,
1995). They also use dramatic relief which is a process where the individuals
experience negative emotions associated with failure to change or doubting that they
have the skills to use the technology. Relief comes with success in using the
21
technology. Producers may question the technologies’ success and their ability to use
precision agriculture in their farm operations. But, it is through this questioning that
they may realize that the technology can have positive benefits (Levesque et al., 2001)
on their farm operations and that they have the skills for effective adoption of these
tools (Rogers, 1995).
Individuals also use environmental reevaluation to progress from
precontemplation to contemplation. This process allows individuals to consider how
the technologies will benefit them, how the tools will positively impact them, or how
these technologies will fit within their environment (Levesque et al., 2001). The
second stage is influenced by how aggressively individuals seek information, what
information they receive, and how they interpret the information (Rogers, 1995).
For this study, individuals are considering using precision agriculture, but have
not yet planned to adopt these technologies. The producer may have even tried a
precision agriculture tool or seen a precision agricultural tool(s) demonstrated, but has
not yet decided to use precision agriculture.
Preparation
The preparation stage is when individuals intend to make a change and have
made small behavioral adjustments toward making the change. As individuals prepare
for a change in behavior or for the adoption of a new technology, they may engage in
activities that lead to choices to adopt or reject the innovation. During this stage,
individuals are interested in minimizing the risk of adoption of the innovation. One
way to minimize risk is to try the innovation without fully adopting it. Farmers may
22
try one or two tools before they are fully convinced that they want to invest in
precision agriculture for long term use. The trial could be vicarious when individuals
see others using these technologies. Some innovations do not allow for trials and the
decision stage may not include a trial step. Change agents use demonstrations to
influence the decision of adopting an innovation (Rogers, 1995).
To progress from contemplation to preparation, individuals use self-evaluation.
They consider the benefits of the technology and how their environment can be
improved by the technology. They consider if the technology is compatible (Rogers,
1995) with their farm management and practices, will meet the needs and goals of
their operations, and is an appropriate technology (Armenakis et al., 1993). During
this stage, producers consider how the precision agriculture technologies can enhance
farm operations. Self-evaluation bridges the gap between the consideration of the tools
and adopting them (Levesque et al., 1999). Once in the preparation stage, producers
intend to adopt precision technology and begin to engage in learning more about
options and ways to use the tools. They often adopt them sequentially (Isik et al.,
2000; Khanna, 2001).
In the preparation stage, producers believe that they will adopt precision
agriculture in the foreseeable future. In this study, the time period associated with the
intention to use precision agriculture technologies is defined as planning to adopt
precision agriculture within one year.
23
Action
The action stage is when individuals are using precision agriculture on a
regular basis (Rogers, 1995). To progress from preparation to action, individuals use
self-liberation, becoming committed to using the technologies and believing that they
have the capability to learn how to use the tool. Agricultural producers look for ways
to utilize the tools and find even more value in using them. Additionally, producers
seek help from others and tell others about using these technologies. Farmers talk to
other farmers during community activities and often share their successes and/or
difficulties using the tools. Some farmers utilize Cooperative Extension agents and
consultants for assistance. In this study, the action stage is defined as having used
precision agriculture for one to two years.
Maintenance
In the maintenance stage, individuals are adopting and implementing the
change to the point that the change is sustained (Greenstein, Franklin, & McGuffin,
1999). In this stage, individuals seek reinforcement of the innovation-decision that
they have already made, but they may reverse previous decisions if they receive
conflicting messages about the innovation. They seek to avoid or reduce dissonance, if
it occurs, by seeking information that would support their decision. Producers
recognize the benefits of using the innovation, integrate the technology into farming
operations, and promote its benefits to others (Rogers, 1995). To progress from action
to maintenance, individuals use reinforcement management—finding intrinsic and
extrinsic rewards for making a change—and counter-conditioning—substituting new
24
behaviors and cognitions for the old ways of working. They also use helping
relationships—seeking and using social support to help with the change—and stimulus
control—restructuring the environment to make and support the change (Levesque et
al., 2001). In this study, the maintenance stage, also labeled as the target behavior, is
defined as using precision agriculture for more than two years.
Behavioral researchers describe the progression from one stage to another as
cyclical in that individuals may regress to the previous stage(s) (Prochaksa et al.,
1992). For instance, someone who is trying to make a health behavioral change by
exercising more may move to the action stage and then stop exercising. This
individual can freely move from the action stage to the contemplation or preparation
stage and back to the action stage. While behavioral researchers have recognized the
cyclical behavior of individuals, stage of change research still depends on the linear
measurement of the stages.
Decisional Balance
Janis and Mann (1977) proposed that the Decisional Balance Sheet of
Incentives represents both cognitive and motivational aspects of decision making.
They identified four main categories in the decision making process: (a) gains and
losses for self; (b) gains and losses for others; (c) self-approval or self-disapproval;
and (d) approval or disapproval from significant others. The first two categories
represent the significant utilitarian considerations during the decision-making process.
The second two categories involve social or non-utilitarian aspects, such as self-
esteem, social approval, internalized moral standards, and ego ideals. Because
25
precision agriculture promises to improve decision-making that ultimately provides
financial benefit, this research uses only the utilitarian consideration as the measure of
decisional balance.
The TTM suggests that decisional balance is a predictor of transitions between
stages. Decisional balance is defined as the weighing of pros and cons associated with
performing a particular task (Armitage et al., 2004; DiClemente et al., 1991; Velicer,
Norman, Fava, & Prochaska, 1999). The pros, representing the advantages of
changing behavior, increase and the cons, representing the disadvantages of changing
behavior, decrease as an individual progresses through the stages (Rosen, 2000). For
example, Prochaska (1994) found that to progress from precontemplation to action
involves a one standard deviation increase in the pros of making the behavior change
and a one-half standard deviation decrease in the cons of making the change. In an
agricultural production situation, farmers must see that adopting a new technology
provides advantages beyond the costs of investments, time, learning, effort, and risk in
adopting it.
Weighing the benefits and disadvantages of making a change predicts the
behavior of an individual. Individuals’ attitudes, particularly perceptions of the
benefits and disadvantages of using a technology, make up the decisional balance. The
benefits are the perceptions of value gained from using the technology. The
disadvantages are the perceptions of costs to the individual. The costs are not only
economic, but are considerations in terms of time, effort, and risk. The weight of the
salience of the benefits and disadvantages of using the technologies adjusts during the
26
stage of change. In the earlier stages of change, the disadvantages outweigh the
benefits of using the technology. In the later stages, the benefits outweigh the
disadvantages. The pros and cons intersect in the middle stages (Prochaska, 1994).
The prediction of the stage is based on the difference between the standardized scores
of the pros and cons constructs (Janis & Mann, 1977; Velicer et al., 1999) which are
independent factors, representing the perceptions of benefits and disadvantages of
making a behavioral change. Individuals can rank both pros and cons high, both pros
and cons low, or one high and one low (Velicer et al., 1999).
Pros
The IDPM and the CRCM both emphasize the importance of individuals’
perception of the value of the change (Armenakis et al., 1993; Rogers, 1995). The pros
construct of the TTM indicates how individuals weigh the importance of the
advantage of making a behavioral change. A high pro score in the TTM means that an
individual perceives the advantages of making behavioral change as highly important.
A person with less salient views of the advantages of making a behavioral change will
have a lower pro score.
In the TTM, the perceived benefits (or the pros) of adopting a change increase
for each progression to a new stage (Prochaska, 1994). The advantages of precision
agriculture can be grouped into three categories: economic benefit, use of information
for management strategies, and environmental information.
27
Economic Benefit
Economic benefit seems to be the deciding factor for sustained use of precision
agricultural technologies (Batte & Arnholt, 2003; Cochrane, 1993; Rogers, 1995).
Thus, the perceptions of economic value and operational benefits are important to
explain the adoption of these technologies. Some economic benefits of precision
agriculture include reduced variable costs, increased yields and increased profits
(Intarapapong, Hite, & Hudson, 2003; Sawyer, 1994; Wolf & Buttel, 1996). Increasing
inputs in more productive areas of managed areas could possibly increase yields.
Applying fewer inputs in areas of the field which have lower yield potential reduces
variable costs (Intarapapong, et al., 2002). Both increasing productivity and reducing
costs should lead to increased profits.
However, analyzing the economic benefits and the costs associated with
precision agriculture is difficult and is complicated by other factors (Lowenberg-
DeBoer, 1999). Modeling the economic effects of an agricultural production system is
complex, difficult, and confounded by the vagaries of economic and environmental
factors, such as pests, diseases, and weather. Assessing and determining the most
appropriate combinations of inputs and practices to maximize farming profit is a
persistent problem that agricultural economists, researchers, and farmers continue to
research and debate.
The difficulty in measuring the economic impact of precision agriculture
technology is that agricultural production success is dependent on good management
on the one hand, and uncontrollable conditions on the other, including weather, pests,
28
government programs, and economic climate. Good management and good decision-
making skills, nor unpredictable conditions, can be easily quantified. Furthermore,
detailed financial data for the entire farm is not always available to researchers.
Therefore, studying the “whole” effect of precision agriculture is problematic.
Some researchers have evaluated the profitability of specific tools on specific
crops (Swinton & Lowenberg-DeBoer, 1998; Wolf & Buttel, 1996). These studies
indicated mixed results for the use of precision agriculture on profitability (Howard,
1996; Lowenberg-DeBoer, 1996; Sawyer, 1994). When researchers studied the
economic impact on specific crops, precision agriculture was found to be profitable on
the high value crops, such as sugar beets and potatoes. Precision agriculture
technologies used on some small grain crops, like wheat, were not always found to be
profitable (Swinton & Lowenberg-DeBoer, 1998).
Precision agriculture technology is still new, changing rapidly, and adjusting to
meet the needs of agricultural producers and agribusiness. Similarly, information
technology use and development exploded in the 1980s. Prior to 1987, information
technology spending did not always demonstrate economic benefits; researchers called
this the “productivity paradox.” The National Research Council report (National
Research Council, 1997) compared the difficulty of demonstrating economic benefits
of precision agriculture to the difficulty of showing economic benefits of information
technologies in the 1980s.
Brynjolfsson and Hitt (1996) found that information technology investments
were economically beneficial to the firms. They indicated that earlier studies did not
29
show positive correlations between economic measurements and information
technology spending because these earlier studies did not have adequate data and had
measurement errors. Brynjolfsson and Hitt (1996) matched five years of survey and
financial data and used econometrics and production functions as their method of
analyses. They concluded that short-term economic effects may not be evident
because organizations sometimes must change business processes and capitalize on
learning how to use technology effectively.
Some researchers have reasoned that inconsistent results correlating firm
performance and information technology adoption occur because this relationship is
much more complex than a simple correlation (Chen & Zhu, 2004). The relationship
between information technologies and business performance is affected by the
business processes and the management of these technologies and how the use of
technologies is aligned with business goals and strategies (Bergeron, Raymond, &
Rivard, 2001; Chan, Huff, Barclay, & Copeland, 1997; Chen & Zhu, 2004).
Researching and modeling the effects of precision agriculture are equally
difficult and complex. Some researchers believe that the mixed results in the economic
research is a matter of focusing on a single aspect of farm production, rather than
incorporating the effect of decision-making on the whole farm (Lowenberg-DeBoer,
1999; National Research Council, 1997; Swinton & Lowenberg-DeBoer, 1998).
Because precision agriculture is a holistic management strategy, the effects on the
entire farm should be evaluated (National Research Council, 1997). Traditional cost-
benefit analysis does not capture the impact of an investment because the benefits are
30
improved managerial decision making, not just improvement in production
efficiencies (Swinton & Lowenberg-DeBoer, 1998).
Management Strategy
In addition to creating efficiencies, precision agriculture also allows for a
holistic management of farm production that is not available in traditional farming
(Olson, 1998; Lowenberg-DeBoer, 1996). Precision agriculture, as a management
strategy, provides for detailed information on a large scale, potentially fundamentally
changing the way farmers make production decisions (Sonka, 1998). The National
Research Council (1997) report also reported that the value of a vast amount of
detailed historical information available through the use of precision agriculture
technologies will change farmers’ operations, practices, marketing approaches, and
management practices. The working definition of precision agriculture, published by
the National Research Council (1997) defined precision agriculture as “a management
strategy that uses information technology to bring data from multiple sources to bear
on decisions associated with crop production”. This increased, detailed historical
information will be more commonly employed and relied upon for future needs and
uses.
Hudson and Hite (2001) found that the second most important motivating
factor in precision agriculture adoption is having better information for decision-
making. This information provides for management strategies that were not previously
possible (Bouma et al., 1999; Lowenberg-DeBoer, 1996; Olson, 1998; Sonka, 1998).
The impact of precision agriculture on farm financial performance largely lies in the
31
acquisition of data and information to make more informed decisions on fertilization,
crop protection, drainage, variety selection, and other inputs (Batte et al., 2003). As a
result, precision agriculture, as a systems approach (Atherton et al., 1999; Davis,
Cassady, & Massey; Larkin et al., 2005; Wolf & Buttel, 1996), is a management
strategy affecting the entire farm.
Precision agriculture data can be shared with all the participants involved in
the processing, marketing, distributing, and consuming of these agricultural products
(Wolf & Buttel, 1996). The information pertaining to fungicides, herbicides,
pesticides, varieties, and production practices can be tracked during cultivation,
harvesting, transportation, processing, distribution, and purchasing. Precision
agriculture provides mechanisms to track special characteristics about the crop from
time of planting and throughout the growing season. This information includes any
application of chemicals, seed variety, and cultivation practices and can be used to
differentiate the agricultural product to the consumer who is willing to pay for a
specialized commodity (Batte, 2000; Wolf & Buttel, 1996).
Researchers have also suggested that the vast amount of historical site
information may provide opportunities for farm growth, gains in market share, greater
negotiation power with landlords, and cheaper on-farm experimentation (Olson, 1998;
Swinton & Lowenberg-DeBoer, 1998; Wiebold, Sudduth, Davis, Shannon, &
Kitchen). Olson (1998) describes the potential of precision agriculture as being able to
“…analyze information and make decisions at a small scale … allowing a manager to
analyze information and make decisions at a large scale. Better managers will be able
32
to lower costs and improve efficiencies on larger operations…” which will lead them
to gain market share. He expects the farms to grow as the results of increased
efficiencies and market share.
Some precision agricultural tools, like the guidance systems, allow for longer
operating hours, providing opportunities to produce and manage more farm land.
Because farmers can keep detailed historical data on the treatment of farmland, they
may have greater negotiation power with landlords as the practices and applications of
chemicals will be known and shared (Wolf & Buttel, 1996). Additionally, some
farmers have used precision agriculture tools to create their own experiments with
chemicals and seed varieties (Napier et al., 2000) to determine which inputs work best
on their farms.
Environment Information
Because chemical applications can be targeted, one possible benefit of
precision agriculture is minimizing the effects on the environment (Khanna, Isik, &
Winter-Nelson, 2000; Napier et al., 2000; Swinton & Lowenberg-DeBoer, 1998).
Applying chemicals (i.e., fertilizer, fungicides, pesticides) in areas that need these
inputs could possibly reduce the amount of chemicals applied and reduce negative
impacts on the environment. Researchers have investigated the relationship between
precision agriculture and the perception of importance of environmental benefits
(Hudson & Hite, 2003; Larkin et al., 2005; Napier et al., 2000; Rejesus & Hornbaker,
1999). These studies found that producers valued the use of precision agriculture to
reduce the effects on the environment. However, the value of reducing environmental
33
impact was not the top priority for farmers. Nevertheless, reducing environmental
degradation was important to them.
Additionally, environmental monitoring is important (Batte & Arnholt, 2003;
Hudson & Hite, 2001, 2003; Napier et al., 2000), particularly as the environmental
regulations become more stringent. The Food Quality Protection Act, passed August,
1996, states that with reasonable certainty, no harm must come from the application of
pesticides on food. The elevated public concern about the environment increases
farmers’ needs to track and monitor chemical inputs during farm production.
Precision agriculture tools give farmers the ability to closely track and monitor
inputs that have an effect on the environment. Improved record-keeping leads to more
accurate, streamlined accounting of the use of chemicals. GIS, serving as an
accounting tool, is detailed, accurate, and searchable. GIS provides farmers a
mechanism to analyze large amounts of data for year-to-year changes in
environmental compliance and gives farmers the ability to show when, where, and
exactly how much chemical was applied during crop production. Thus, farmers can
more effectively keep records for environmental compliance.
By having more information gained from the use of precision agriculture,
farmers have opportunities to make better decisions which should, in turn, lead to
improved profits. The potential benefits used in this study include economic benefit,
environmental information, and information use for management strategies (Godwin,
Richards, Wood, Welsh, & Knight, 2003; Hudson & Hite, 2001; Napier et al., 2000;
Olson, 1998; Rejesus & Hornbaker, 1999).
34
Cons
The various combinations of precision agriculture tools, the steep learning
curve of these technologies, and the initial investment of each of the tools complicate
farmers’ decisions. Kitchen et al. (2002) identified several barriers to adopting
precision agriculture. They listed obstacles to adopting precision agriculture as
equipment costs, time, equipment incompatibility, technology obsolescence, needed
skills, farm structure (rent vs. owned land), training and support availability, and lack
of confidence in using the technology. They also indicated that they had concerns over
data quality control, lack of information on purchasing new equipment and software,
the need for improved data storage devices, development of remote sensing
equipment, standardization of equipment and data formatting, and lack of
understanding of agronomic relationships between yield and soil. This study narrows
the disadvantages of using precision agriculture to economic costs and risks, skills,
time, technological changes and upgrades, and support.
Swinton, Marsh, and Ahmad (1997) identified through focus groups that
farmers felt that they were overwhelmed with the initial costs of precision agriculture
technologies, particularly technologies that change rapidly. To adopt and use these
technologies, not only do agricultural producers have to make large financial
investments, but also have to invest time and effort in learning new skills. Farmers
must learn to use GIS software, integrate GPS tools into existing farming implements,
and understand data associated with mapping, soil quality, topography, yield variance,
and crop health. Farmers must dedicate time to adjust the technologies to fit
35
equipment and troubleshoot the technologies, as needed. This time commitment
creates indirect costs of delays and missing production work. Other concerns
identified were unexpected costs in upgrades of equipment and software and the
incompatibility of equipment and software (Swinton et al., 1997).
Precision agriculture requires large investments in capital, time, and learning.
While there is an expectation of cost effectiveness and profitability, quantifying these
assets is not easily done (Swinton et al., 1997). Additionally, there is uncertainty about
the cost of precision agriculture technology upgrades. This research uses investments
in capital, time, and learning and hardware and software incompatibility as
disadvantages of precision agriculture. The theoretical underpinnings of the TTM
suggest that the perceived disadvantages (or cons) decrease in each progression to a
new stage (Marshall & Biddle, 2001; Reed, 1994).
Decisional Balance, Stage of Change, and Intention to Use Precision Agriculture
The theory of planned behavior (Fishbein & Ajzen, 1975) indicates that
attitudes predict intentions, and intentions predict behavior. Stage of change is
composed of attitudes and beliefs toward making a behavioral change. The stage of
change is an indication of intention to behavioral change. The TTM is used to identify
individuals’ stage of change by using processes of change which are influenced by the
decisional balance.
Decisional balance, defined as the decision making process (Janis & Mann,
1977), consists of the individuals’ perceptions of the benefits and disadvantages of
using the technology. In the earlier stages of change, the disadvantages outweigh the
36
benefits of using the technology. In the later stages, the benefits outweigh the
disadvantages. It is in the middle stages where the benefits and disadvantages
intersect. Because the decisional balance is made up of perceptions and attitudes, the
decisional balance will predict the stage of change, a continuous measure.
Additionally, the pros will be positively correlated with stage of change and the cons
will be negatively correlated with the stage of change.
H1a: Decisional balance predicts stage of change.
H1b: Pros are positively correlated with stage of change.
H1c: Cons are negatively correlated with stage of change.
Factors that Influence Decisional Balance and Stage of Change
Using some aspects of the Diffusion of Innovation (Rogers, 1983) theory,
Vanclay (1992), a rural sociologist, identified ten barriers to farmers’ adopting new
technologies: complexity, divisibility, congruence, economic, risk and uncertainty,
conflicting information, implementation economic costs, implementation intellectual
costs, loss of flexibility, and physical and social infrastructure. Even though economic
benefit seems to be the deciding factor for sustained use of precision agricultural
technologies, other reasons, such as attitudes toward the technologies, may affect
adoption (Cochrane, 1993). The decisional balance is influenced by the individuals’
perceptions of the technology. These perceptions include the perceived value of the
technology (Armenakis et al., 1993), its relative advantage over the current practice
(Rogers, 1995), its appropriateness for the operation (Armenakis et al., 1993), its
compatibility within the operation, and the perception of complexity of the technology
37
(Rogers, 1995). During the first stage, individuals become aware of the technology
and in the second stage, individuals psychologically develop perceptions about the
technology.
Perceived Compatibility of Precision Agriculture with Existing Farming Operations
and Practices
Attitudes toward compatibility and appropriateness of an innovation with
existing operations and its ability to meet the needs and goals of potential adopters are
also important during the decision process (Armenakis & Harris, 2002; Rogers, 1995).
While an innovation may have value and offer new options, it must also be appropriate
for the individuals who are considering it as a change (Armenakis & Harris, 2002;
Armenakis et al., 1993). Compatibility is a belief that the technology is compatible
with existing practices, values, and beliefs (Coch & French, 1948; Rogers, 1995).
Researchers in the IS field have found that ISs compatible with the operations and
management of organizations affected the adoption of ISs (Moore & Benbasat, 1991).
The more the technology is perceived to be compatible with current farm and
management practices, the higher the likelihood that a farmer will adopt the
technology.
H2a: The perceived compatibility of precision agriculture with
existing farming operations and practices positively influences
stage of change.
Precision agriculture allows for detailed information about farming operations,
field characteristics, and yield information which has not been available in traditional
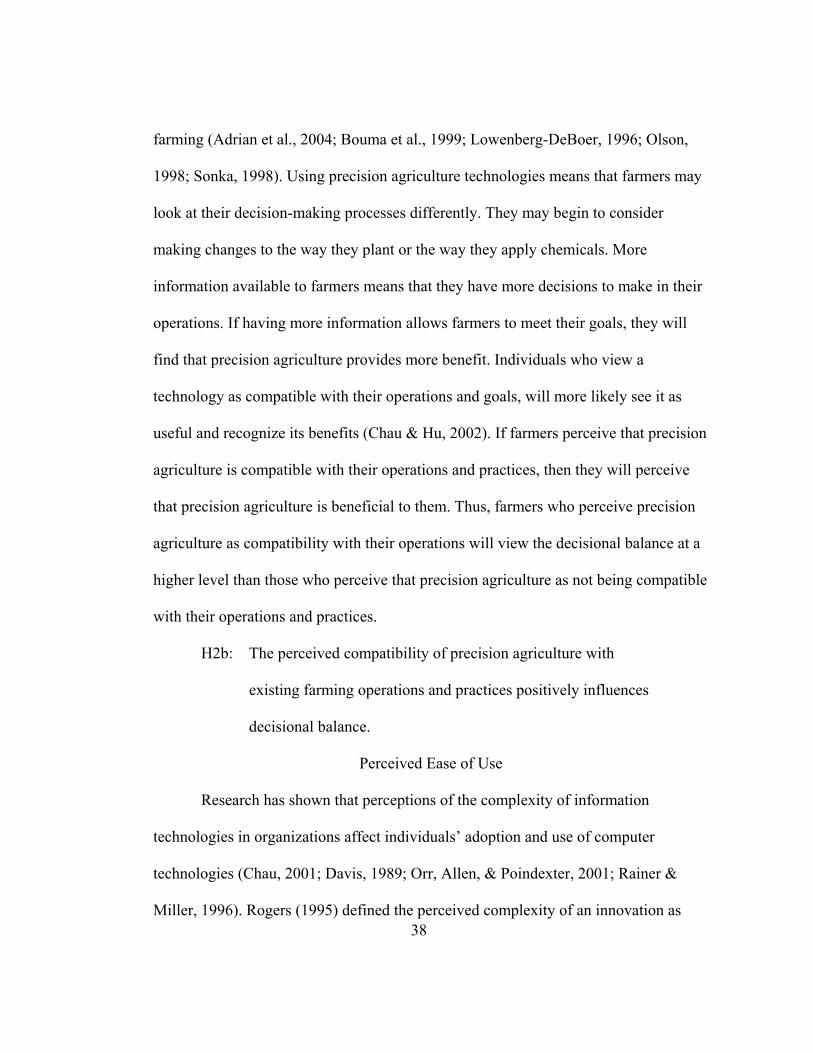
38
farming (Adrian et al., 2004; Bouma et al., 1999; Lowenberg-DeBoer, 1996; Olson,
1998; Sonka, 1998). Using precision agriculture technologies means that farmers may
look at their decision-making processes differently. They may begin to consider
making changes to the way they plant or the way they apply chemicals. More
information available to farmers means that they have more decisions to make in their
operations. If having more information allows farmers to meet their goals, they will
find that precision agriculture provides more benefit. Individuals who view a
technology as compatible with their operations and goals, will more likely see it as
useful and recognize its benefits (Chau & Hu, 2002). If farmers perceive that precision
agriculture is compatible with their operations and practices, then they will perceive
that precision agriculture is beneficial to them. Thus, farmers who perceive precision
agriculture as compatibility with their operations will view the decisional balance at a
higher level than those who perceive that precision agriculture as not being compatible
with their operations and practices.
H2b: The perceived compatibility of precision agriculture with
existing farming operations and practices positively influences
decisional balance.
Perceived Ease of Use
Research has shown that perceptions of the complexity of information
technologies in organizations affect individuals’ adoption and use of computer
technologies (Chau, 2001; Davis, 1989; Orr, Allen, & Poindexter, 2001; Rainer &
Miller, 1996). Rogers (1995) defined the perceived complexity of an innovation as
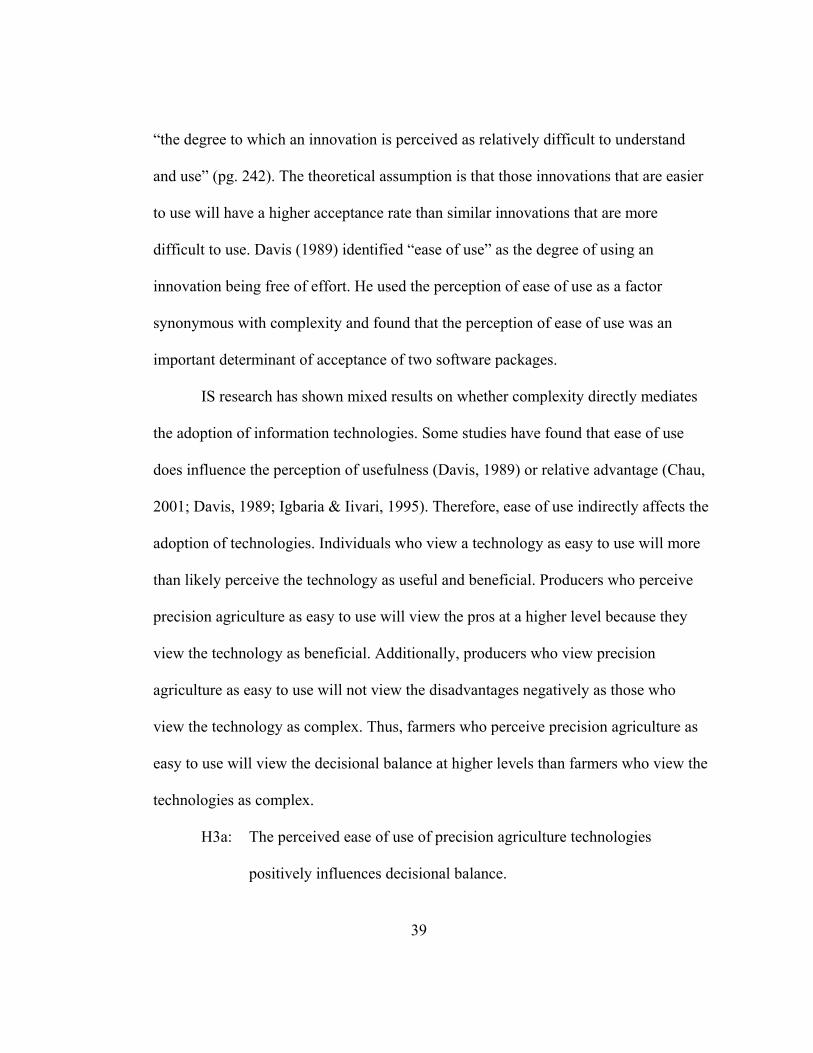
39
“the degree to which an innovation is perceived as relatively difficult to understand
and use” (pg. 242). The theoretical assumption is that those innovations that are easier
to use will have a higher acceptance rate than similar innovations that are more
difficult to use. Davis (1989) identified “ease of use” as the degree of using an
innovation being free of effort. He used the perception of ease of use as a factor
synonymous with complexity and found that the perception of ease of use was an
important determinant of acceptance of two software packages.
IS research has shown mixed results on whether complexity directly mediates
the adoption of information technologies. Some studies have found that ease of use
does influence the perception of usefulness (Davis, 1989) or relative advantage (Chau,
2001; Davis, 1989; Igbaria & Iivari, 1995). Therefore, ease of use indirectly affects the
adoption of technologies. Individuals who view a technology as easy to use will more
than likely perceive the technology as useful and beneficial. Producers who perceive
precision agriculture as easy to use will view the pros at a higher level because they
view the technology as beneficial. Additionally, producers who view precision
agriculture as easy to use will not view the disadvantages negatively as those who
view the technology as complex. Thus, farmers who perceive precision agriculture as
easy to use will view the decisional balance at higher levels than farmers who view the
technologies as complex.
H3a: The perceived ease of use of precision agriculture technologies
positively influences decisional balance.
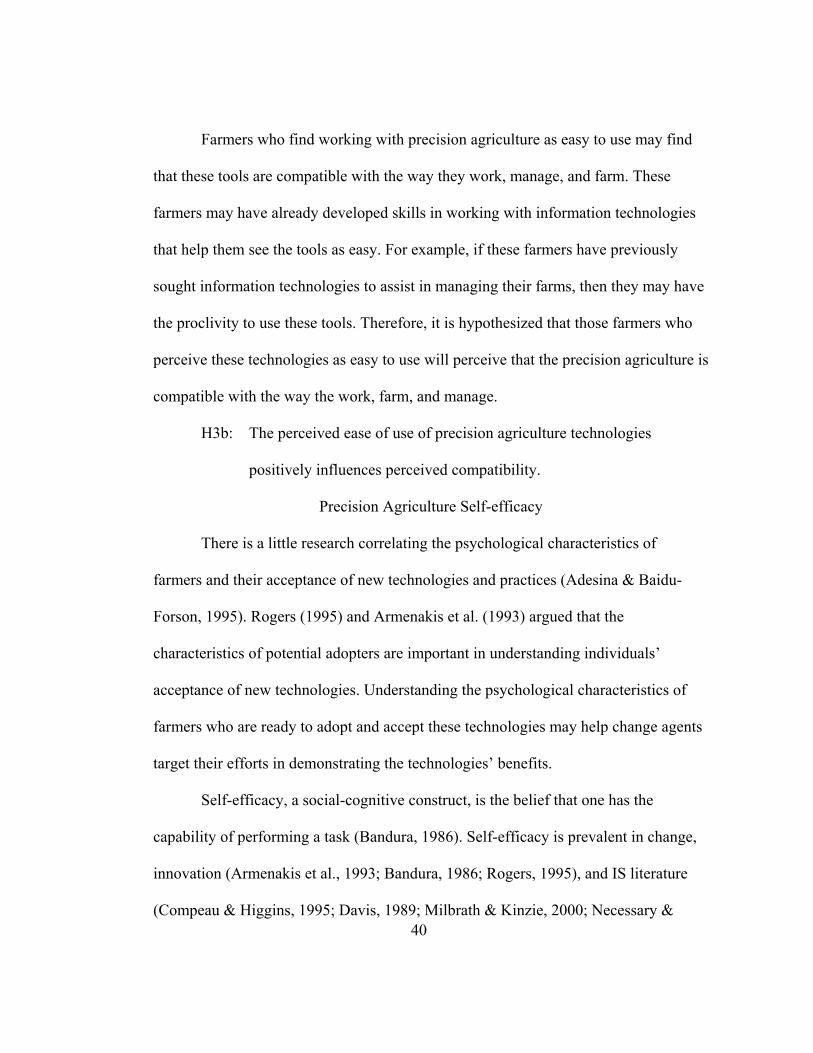
40
Farmers who find working with precision agriculture as easy to use may find
that these tools are compatible with the way they work, manage, and farm. These
farmers may have already developed skills in working with information technologies
that help them see the tools as easy. For example, if these farmers have previously
sought information technologies to assist in managing their farms, then they may have
the proclivity to use these tools. Therefore, it is hypothesized that those farmers who
perceive these technologies as easy to use will perceive that the precision agriculture is
compatible with the way the work, farm, and manage.
H3b: The perceived ease of use of precision agriculture technologies
positively influences perceived compatibility.
Precision Agriculture Self-efficacy
There is a little research correlating the psychological characteristics of
farmers and their acceptance of new technologies and practices (Adesina & Baidu-
Forson, 1995). Rogers (1995) and Armenakis et al. (1993) argued that the
characteristics of potential adopters are important in understanding individuals’
acceptance of new technologies. Understanding the psychological characteristics of
farmers who are ready to adopt and accept these technologies may help change agents
target their efforts in demonstrating the technologies’ benefits.
Self-efficacy, a social-cognitive construct, is the belief that one has the
capability of performing a task (Bandura, 1986). Self-efficacy is prevalent in change,
innovation (Armenakis et al., 1993; Bandura, 1986; Rogers, 1995), and IS literature
(Compeau & Higgins, 1995; Davis, 1989; Milbrath & Kinzie, 2000; Necessary &

41
Parish, 1996; Rainer & Miller, 1996). The attitude of having the ability to learn and
use technology influences the perception of usefulness since the expectations of the
technology are derived from how well one can use the technology and is motivated to
use the technology (Compeau & Higgins, 1995; Igbaria & Iivari, 1995). IS research
has shown that computer self-efficacy affects computer usage, perceived ease of use,
and perceived usefulness (Chau, 2001; Compeau & Higgins, 1995; Davis, 1989;
Igbaria & Iivari, 1995). Farmers’ self-efficacy has not been studied in the adoption and
use of precision agriculture technology.
The TTM, the IDPM, and the CRCM posit that self-efficacy positively
influences acceptance of change (Armenakis et al., 1993; Armitage et al., 2004;
DiClemente, Prochaska, & Gibertini, 1985; Rogers, 1995). IS research shows that
attitudes toward IS, particularly individuals’ perceptions of capabilities and beliefs that
they can learn to use the technology (Compeau & Higgins, 1995; Necessary & Parish,
1996; Rainer & Miller, 1996), affect whether they will adopt the technology (Adesina
& Baidu-Forson, 1995; Davis, 1989; Milbrath & Kinzie, 2000). Armitage et al. (2004)
found that self-efficacy predicts the intention and acceptance of behavioral change.
Additionally, self-efficacy mediates the stage of change (DiClemente et al., 1985;
Marshall & Biddle, 2001). If producers are confident that they can use and learn
precision agriculture technologies, they will more likely adopt them. As individuals
become more knowledgeable about the technology, they will become more confident
in their ability to use the technology, and they will move through the stages of change
(DiClemente et al., 1985).
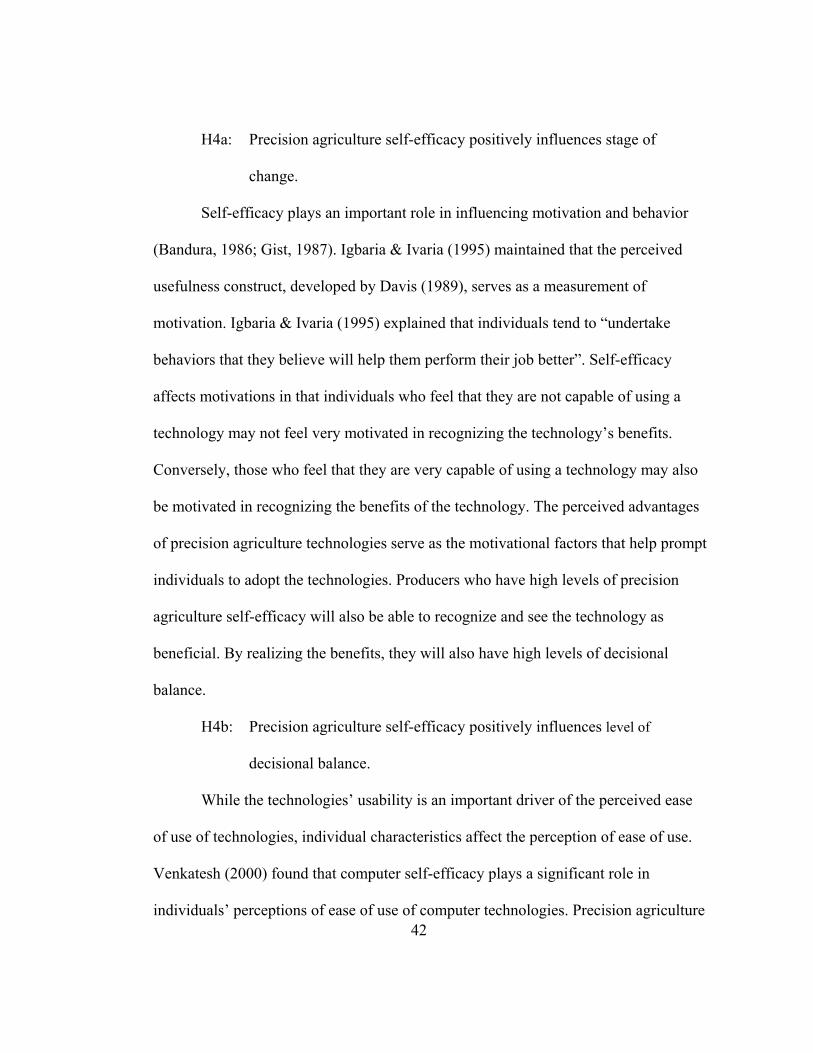
42
H4a: Precision agriculture self-efficacy positively influences stage of
change.
Self-efficacy plays an important role in influencing motivation and behavior
(Bandura, 1986; Gist, 1987). Igbaria & Ivaria (1995) maintained that the perceived
usefulness construct, developed by Davis (1989), serves as a measurement of
motivation. Igbaria & Ivaria (1995) explained that individuals tend to “undertake
behaviors that they believe will help them perform their job better”. Self-efficacy
affects motivations in that individuals who feel that they are not capable of using a
technology may not feel very motivated in recognizing the technology’s benefits.
Conversely, those who feel that they are very capable of using a technology may also
be motivated in recognizing the benefits of the technology. The perceived advantages
of precision agriculture technologies serve as the motivational factors that help prompt
individuals to adopt the technologies. Producers who have high levels of precision
agriculture self-efficacy will also be able to recognize and see the technology as
beneficial. By realizing the benefits, they will also have high levels of decisional
balance.
H4b: Precision agriculture self-efficacy positively influences level of
decisional balance.
While the technologies’ usability is an important driver of the perceived ease
of use of technologies, individual characteristics affect the perception of ease of use.
Venkatesh (2000) found that computer self-efficacy plays a significant role in
individuals’ perceptions of ease of use of computer technologies. Precision agriculture
43
technology requires a set of skills that are somewhat different than the skills used in
traditional farming. The GIS tools can be complicated, particularly in integrating the
data and developing management zones. One study found that confidence in using
precision agriculture tools affected the intention to use precision agriculture (Adrian et
al., 2005). Even though producers may believe that precision agriculture technologies
are beneficial, they may feel that they do not have the ability to use the technology.
Conversely, those who have higher levels of precision agriculture self-efficacy will
more likely find precision agriculture technologies as easy to use. Therefore, it is
hypothesized that the higher levels of precision agriculture self-efficacy will positively
influence perceived ease of use.
H4c: Precision agriculture self-efficacy positively influences
perceived ease of use.
Communications Behaviors
Rogers (1995) indicated that communication behaviors were related to
innovativeness. Early adopters have more change agent contact, have greater exposure
to mass media, have greater exposure to interpersonal communication channels, seek
information about innovations more aggressively, and have greater knowledge of
innovations. However, the first stage of the TTM is when the individual has no
intention of adopting a new technology. Therefore, individuals’ characteristics, such as
their communications behavior, influence the adopters’ readiness to change and these
characteristics can also affect their processes of change.
44
Rogers (1995) also suggested that while mass media can be effective in the
diffusion of simple innovations, interpersonal communications may play a greater role
in the adoption of complex technologies. He notes that having contact with change
agents will influence the knowledge about new technologies and are important in
diffusing the adoption of complex technologies. Daberkow and McBride (2003) found
that having access to information and contact with change agents, such as Cooperative
Extension agents and university faculty, influences the adoption of precision
agricultural technologies
Rogers (1995) also indicated that early adopters of innovations are more
venturesome and will seek out information for new ideas. He postulates that early
adopters have greater abilities to deal with abstraction, risks, and uncertainty. Those
who have more information may feel they are more confident in using new
technologies. Individuals’ confidence in their ability to perform tasks is influenced by
second-hand information (Ajzen & Madden, 1986).
Those who seek more information through various communication methods
may have greater self-efficacy than those who do not seek additional information.
Communications behaviors will influence precision agriculture self-efficacy. Finding
information on the Internet provides producers with vast amount of information, not
always available through local sources. Those who seek more information through
various communication channels, such as the Internet, mass media, and change agents,
will have greater precision agriculture self-efficacy than those who do not seek
additional information.
45
H5a: Communications behaviors positively influence precision
agriculture self-efficacy.
Some individuals seek out more information and resources by using various
communication channels than others. Those who have the tendency to seek
information through various means, such as the Internet and local change agents, may
also find the vast amount of information available through precision agriculture
technologies to be useful and compatible with the way they manage and operate their
farms. Those who have the propensity to seek information through various
communication channels may find that precision agriculture technologies are
compatible with the way they manage the farm.
H5b: Communications behaviors positively influence perceived
compatibility.
Socioeconomic Characteristics
Rogers (1995) indicated that socioeconomic factors were related to
innovativeness. For instance, more innovative individuals tend to have more formal
education, have higher social status, have a greater degree of upward social mobility,
and have larger units (i.e., larger farms and larger companies) than later adopters.
Therefore, individuals’ characteristics influence the readiness of adopters to change
and these characteristics can also affect their processes of change. The precision
agriculture adoption literature shows that some demographic factors, such as age,
farming experience, off-farm employment, education level, farm size, and crops
grown, affect the adoption of precision agriculture (Daberkow & McBride, 2003).
46
Farm Size
Managers of larger farms tend to be more innovative and inclined to adopt
technology broadly (Batte, 2005; Rogers, 1995). Precision agriculture requires a large
investment in capital, time, and learning. The fixed transactional and informational
investments associated with precision agriculture technologies may prevent smaller
farms from being able to invest in these technologies. Napier et al. (2000) found that
farms with higher levels of gross profit were more likely to adopt precision
agriculture. Larger farms are more likely able to invest large amounts of capital, time
and learning new technologies than smaller farms (Batte, 2005; Batte, 2000;
Lowenberg-DeBoer, 1996; Napier et al., 2000; Rogers, 1995), thus, farm size will
affect stage of change.
H6: Farm size positively influences stage of change.
Education Level
Early adopters of technology tend to have higher education levels than later
adopters (Batte, 2005; Hudson & Hite, 2003; Rogers, 1995). However, some research
shows mixed results of the correlation between technology adoption and levels of
education (Hoag, Ascough II, & Frasier, 1999; Hoag, Ascough II, & Frasier, 2000;
Napier et al., 2000). It is hypothesized that education level will positively influence
the stage of change of adoption of precision agriculture.
H7: Education level positively influences stage of change.
47
Off-farm Employment
Researchers have found that off-farm employment correlates with the adoption
of computer and Internet use (Batte, 2005; Smith, Morrison, Goe, & Kenny, 2004).
The premise is that off–farm employment provides exposure to computer and Internet
technologies and possibly provides skills to use the technologies. Therefore, the
increased awareness and skills transfer to using computer and Internet technologies for
the farm. Off-farm employment will affect stage of change.
H8: Off-farm employment positively influences stage of change.
Summary
The decision to adopt precision agriculture technologies is not easy and is
often complicated by the lack of direct evidence of economic benefit. Adoption of
precision agriculture depends not only on economic reasons, but also on perceptions
about the technology. These attitudes have been given little attention in precision
agriculture. Understanding the adoption-decision process can help researchers develop
technologies that meet the needs of the producers. These tools require technical skills
and managerial skills that are somewhat different from the skills that are common in a
traditional farming operation. This proposed comprehensive process model explains
and predicts the stages of adoption of precision agriculture that are determined by the
individuals’ perceptions of the technology and their confidence in being able to use the
technology. This study focuses on perceptions of precision agriculture’s benefits and
disadvantages, complexity, compatibility, self-efficacy, and communication behaviors.
These attitudinal constructs offer a basis to develop hypotheses to test the adoption
48
process. A summary of the hypotheses is shown in Table 1. These hypotheses are also
presented graphically in Figure 2.
The model concentrates on the stage of change as described in the TTM. From
a practical standpoint, the determination of stage of change can be useful to change
agents so they can adjust their messages and their activities for invoking change.
These activities and communications can be used to move potential adopters to the
next stage. Perceived ease of use, perceived compatibility, communications behaviors,
and precision agriculture self-efficacy influence the decisional balance of using
precision agriculture. Decisional balance is the predictor of stage of change of
precision agriculture adoption, and stage of change is a predictor of use of precision
agriculture.
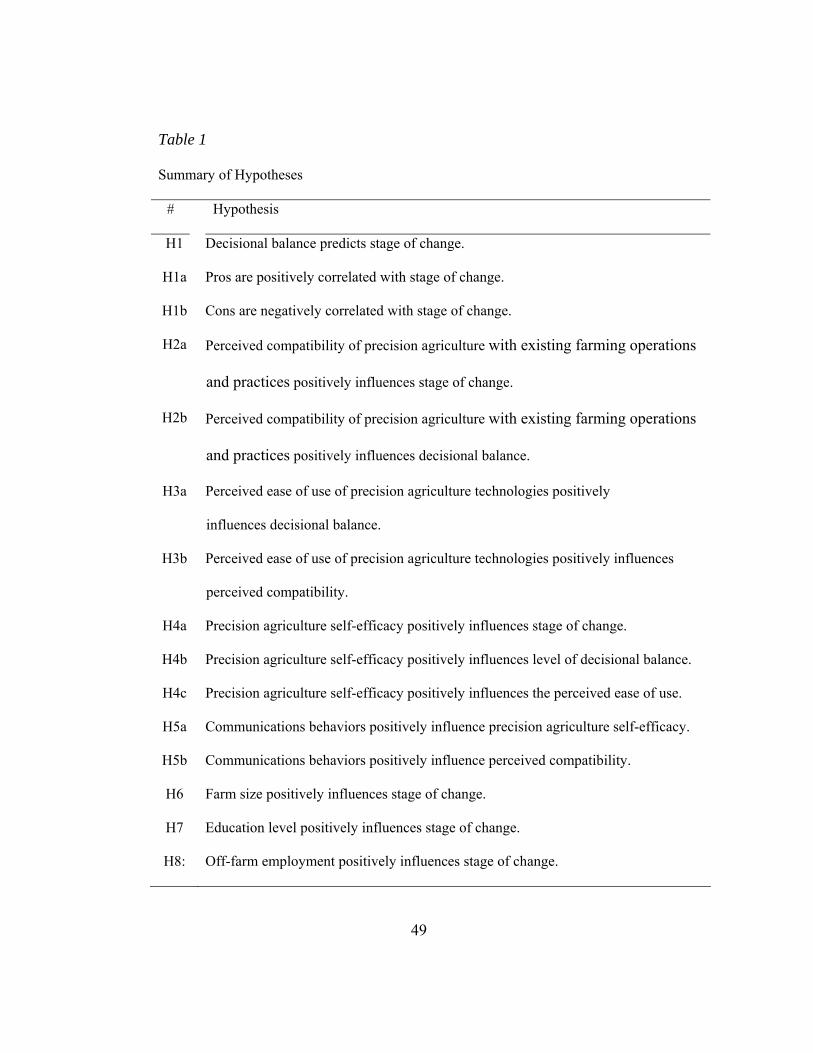
49
Table 1
Summary of Hypotheses
# Hypothesis
H1 Decisional balance predicts stage of change.
H1a Pros are positively correlated with stage of change.
H1b Cons are negatively correlated with stage of change.
H2a Perceived compatibility of precision agriculture with existing farming operations
and practices positively influences stage of change.
H2b Perceived compatibility of precision agriculture with existing farming operations
and practices positively influences decisional balance.
H3a Perceived ease of use of precision agriculture technologies positively
influences decisional balance.
H3b Perceived ease of use of precision agriculture technologies positively influences
perceived compatibility.
H4a Precision agriculture self-efficacy positively influences stage of change.
H4b Precision agriculture self-efficacy positively influences level of decisional balance.
H4c Precision agriculture self-efficacy positively influences the perceived ease of use.
H5a Communications behaviors positively influence precision agriculture self-efficacy.
H5b Communications behaviors positively influence perceived compatibility.
H6 Farm size positively influences stage of change.
H7 Education level positively influences stage of change.
H8: Off-farm employment positively influences stage of change.
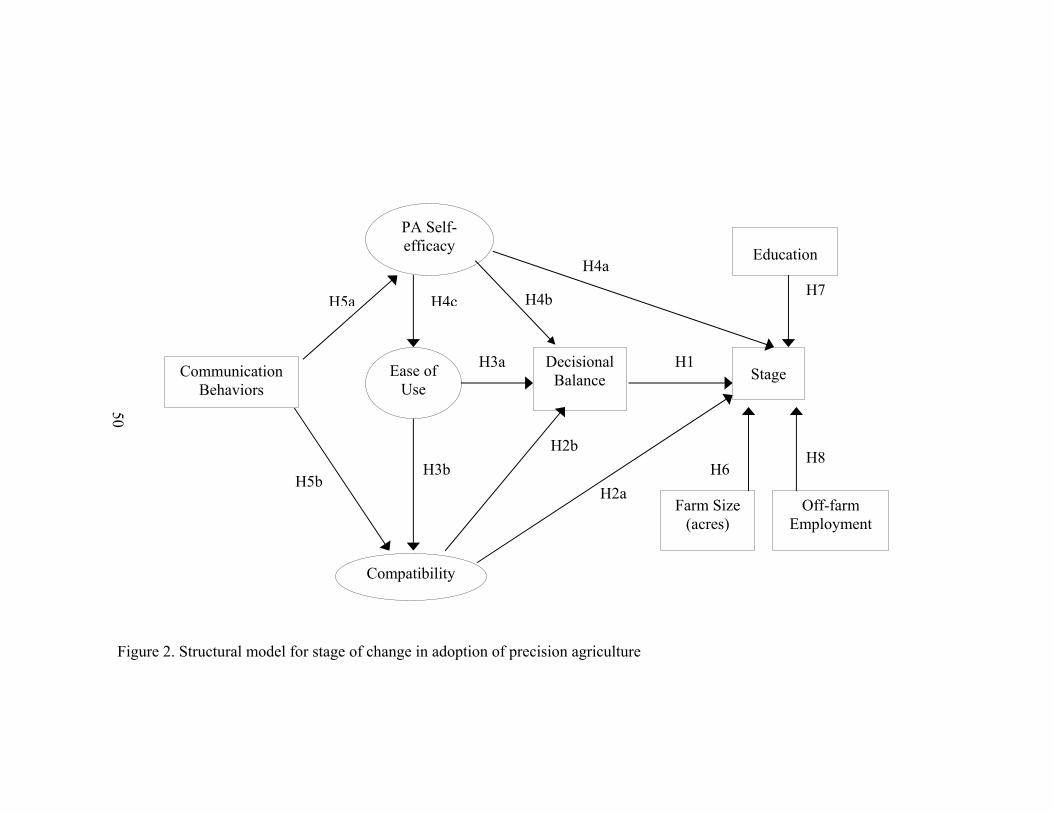
50
Figure 2. Structural model for stage of change in adoption of precision agriculture
H1
H2b
H3a
H2a
H4a
H3b
H4cH5a
H5b
H7
H8 H6
PA Self-efficacy
Ease of Use
Compatibility
Communication Behaviors
Decisional Balance
Stage
Off-farm Employment
Farm Size (acres)
Education
H4b
51
CHAPTER 3
METHODOLOGY
The literature review chapter proposed a model for analyzing the stage of
change associated with the adoption of precision agriculture using the TTM. A survey
was developed to include questions pertaining to the use of precision agriculture
technologies, scales for the pros and cons constructs, perceived ease of use, perceived
compatibility, precision agriculture self-efficacy, communications behaviors, farm
size, off-farm employment, and education level of the farmers. This survey instrument
was used to collect data and empirically test the relationships of the structural model
for stage of change in precision agriculture adoption shown Figure 2. The items in the
questionnaire operationalized the constructs in the research model (Figure 2) with
changes in wording appropriate for precision agriculture. Survey data were collected
from agricultural producers in Alabama. Each step of the development and
implementation of the survey instrument is described in this chapter.
Research Protocol
Approval for this survey instrument was granted by the Institutional Review
Board of Research Involving Human Subjects at Auburn University Protocol. A cover
letter describing the research and explaining the rights of the survey participants was
52
included with the survey instrument. The cover letter is included in Appendix A. The
data set provided to the researcher was anonymous.
Measure and Instrument Development
A four-page survey instrument was designed with most of these variables
measured as multi-item scales. The questionnaire was reviewed by a group of
agricultural researchers, Cooperative Extension specialists, and Extension field agents.
Suggestions for changing the wording of particular items were made and
implemented.
The questionnaire was also reviewed by the statisticians in the United States
Department of Agriculture-National Agricultural Statistics Service (USDA-NASS)
Alabama Statistics Office. The statisticians provided suggestions to the wording of
some of the socio-economic questions. Their suggestions came from their experience
in collecting survey data from this particular population. The survey was mailed to the
participants and self-administered. The survey instrument is shown in Appendix B.
The decisional balance construct was developed from the advantages and
disadvantages of using precision agriculture for managing agronomic and crop
conditions. The scales for the pros and cons represented both cognitive and
motivational factors derived from precision agriculture use research. The pros
consisted of economic benefit, environment information, and information for use of
management strategies. The cons consisted of investments, time, learning, effort, and
risk. The scales for self-efficacy were taken from Hill, Smith, and Mann (1987). The
scale for perceived ease of use was taken from the TAM (Davis, 1989) and adjusted
53
for precision agriculture. The scale for compatibility was derived from the
compatibility scale used in the Moore and Benbasat (1991) study.
Participants’ Use of Precision Agriculture Tools
Analyzing the use of different precision agriculture tools to understand
adoption patterns is difficult. It is important, though, to determine which tools are
being adopted. In the questionnaire, the participants were asked about intention and
use of each individual tool. Use of precision agriculture tools was defined by the
intention and use of each specific tool. Intention was determined by whether the tools
will be used within the next two years. Usage of precision agriculture tools for
managing agronomic and crop conditions was determined by whether the tools have
been used within the last year or longer.
Target Behavior
The first step in applying the TTM to behavioral change is to identify and
clearly define the target behavior in the model. Because stage of change
methodologies have not been used in researching the adoption of precision agriculture,
ensuring that an appropriate definition of precision agriculture use and the target
behavior defined in the stage of change model is essential. The target behavior is the
behavior one would want to obtain in the maintenance stage. The target behavior for
this study is to use of precision agriculture technologies for at least two years.
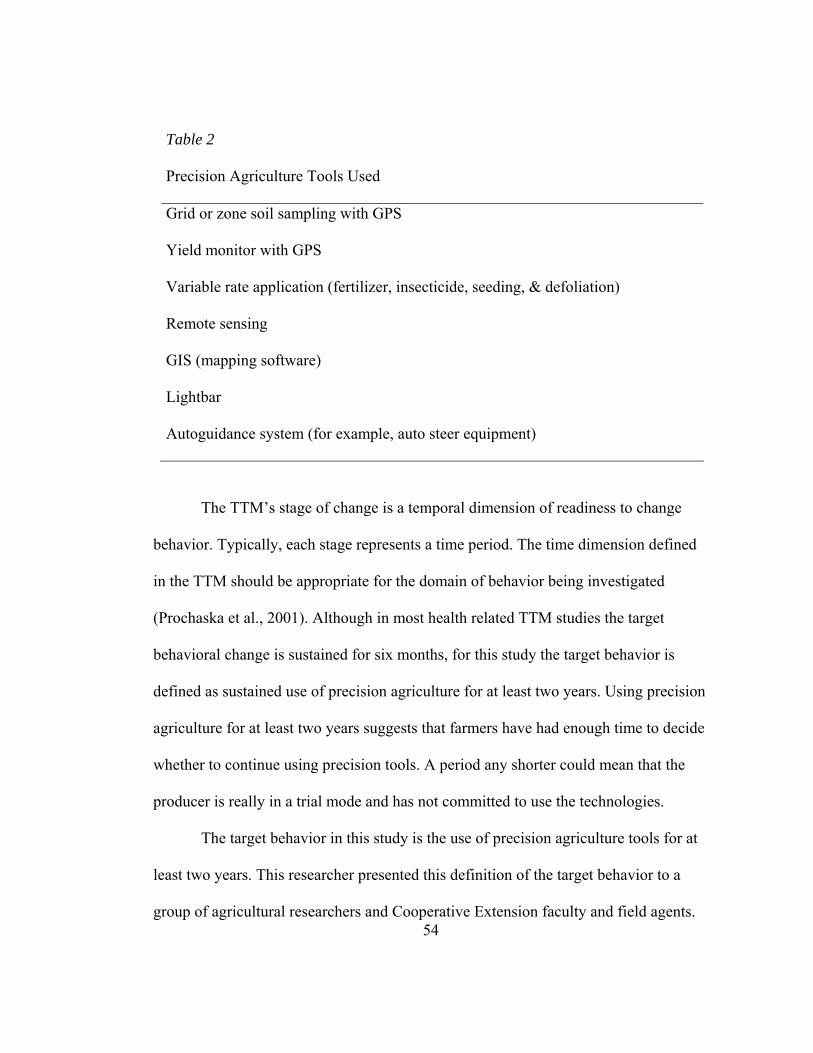
54
Table 2
Precision Agriculture Tools Used
Grid or zone soil sampling with GPS
Yield monitor with GPS
Variable rate application (fertilizer, insecticide, seeding, & defoliation)
Remote sensing
GIS (mapping software)
Lightbar
Autoguidance system (for example, auto steer equipment)
The TTM’s stage of change is a temporal dimension of readiness to change
behavior. Typically, each stage represents a time period. The time dimension defined
in the TTM should be appropriate for the domain of behavior being investigated
(Prochaska et al., 2001). Although in most health related TTM studies the target
behavioral change is sustained for six months, for this study the target behavior is
defined as sustained use of precision agriculture for at least two years. Using precision
agriculture for at least two years suggests that farmers have had enough time to decide
whether to continue using precision tools. A period any shorter could mean that the
producer is really in a trial mode and has not committed to use the technologies.
The target behavior in this study is the use of precision agriculture tools for at
least two years. This researcher presented this definition of the target behavior to a
group of agricultural researchers and Cooperative Extension faculty and field agents.
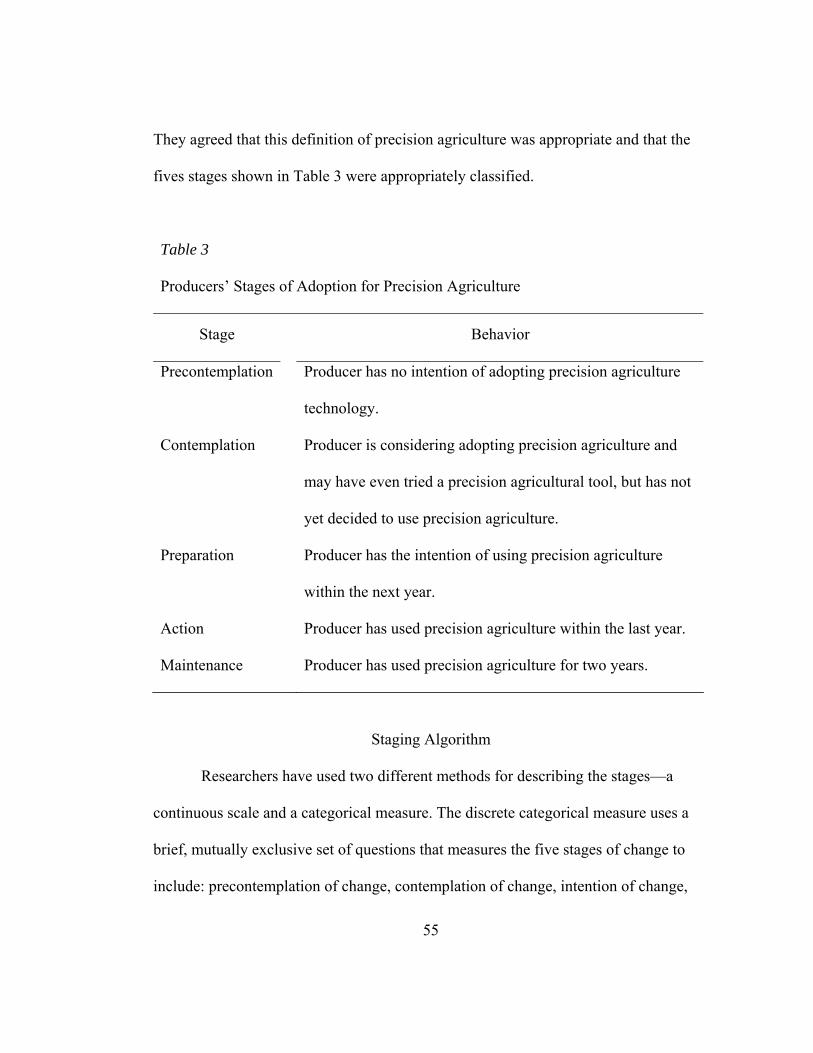
55
They agreed that this definition of precision agriculture was appropriate and that the
fives stages shown in Table 3 were appropriately classified.
Table 3
Producers’ Stages of Adoption for Precision Agriculture
Stage Behavior
Precontemplation Producer has no intention of adopting precision agriculture
technology.
Contemplation Producer is considering adopting precision agriculture and
may have even tried a precision agricultural tool, but has not
yet decided to use precision agriculture.
Preparation Producer has the intention of using precision agriculture
within the next year.
Action Producer has used precision agriculture within the last year.
Maintenance Producer has used precision agriculture for two years.
Staging Algorithm
Researchers have used two different methods for describing the stages—a
continuous scale and a categorical measure. The discrete categorical measure uses a
brief, mutually exclusive set of questions that measures the five stages of change to
include: precontemplation of change, contemplation of change, intention of change,
56
action, and maintenance of the behavior. The discrete categorical approach is used to
compare individuals and variables in sequential stages and usually measure with one
statement for each stage. An example of a statement indicating the maintenance stage
is: “I have been using precision agriculture for two or more years.”
The other method is a continuous scale which also uses separate scales for the
five stages. The continuous scale uses more survey items than the discrete categorical
scales. The staging algorithm produces a stage score which is an assessment of
readiness to change behavior. This algorithm is anchored by the theory of reasoned
action (Fishbein & Ajzen, 1975) and theory of planned behavior (Ajzen & Madden,
1986). Along the continuum, the movement from stage-to-stage is perceived to be a
linear progression (Prochaksa et al., 1992) and is often used to predict intention and
behavior (Marcus, Selby, Niaura, & Rossi, 1992; McConnaughy et al., 1983;
Prochaksa et al., 1992). Researchers have found that other factors will influence the
stage of change, such as self-efficacy (DiClemente et al., 1985; Marcus et al., 1992;
Weinstein, Rothman, & Sutton, 1998).
Typically, each stage represents a time period. The TTM has been used mostly
in health behavior change where a six month period is used. For this research,
identifying a time period that indicates a commitment in both time and economic
investments and that reflects the use in such a way that the producer can evaluate his
commitment a period of two years is appropriate. A period any shorter could mean
that the producer is really in a trial mode and has not committed to use the
technologies.
57
The items used in the staging algorithm were based on the University of Rhode
Island (URICA) 24-item form. The items were adjusted slightly to be appropriate for
stages associated with the adoption of precision agriculture. These items were
presented to a group of agricultural researchers, Cooperative Extension specialists, and
Extension field agents who agreed that two years was appropriate time to define the
maintenance stage and that the survey items correctly represented the stages. One item
was split to include two separate items that represent an assessment of time and skills
(see items 63 and 64 in Table 4.). Table 4 shows the survey items and the stage each
represents.

58
Table 4
Items for Staging Algorithm
Survey
Item Items Stage
53 As far as I’m concerned, I do not need to use
precision agriculture.
Precontemplation
(non-believing )
54 I have been using precision agriculture for a long time
and I plan to continue.
Maintenance
55 I don’t use precision agriculture right now and I don’t
care to.
Precontemplation
(non- believing)
56 I am finally using precision agriculture. Action
57 I have been successful at using precision agriculture
and I plan to continue.
Maintenance
58 I am satisfied with not using precision agriculture. Precontemplation
(non- believing)
59 I have been thinking that I might want to start using
precision agriculture.
Contemplation
60 I have started using precision agriculture within the last
two years.
Action
61 I could use precision agriculture, but I don’t plan to. Precontemplation
(non- believing)
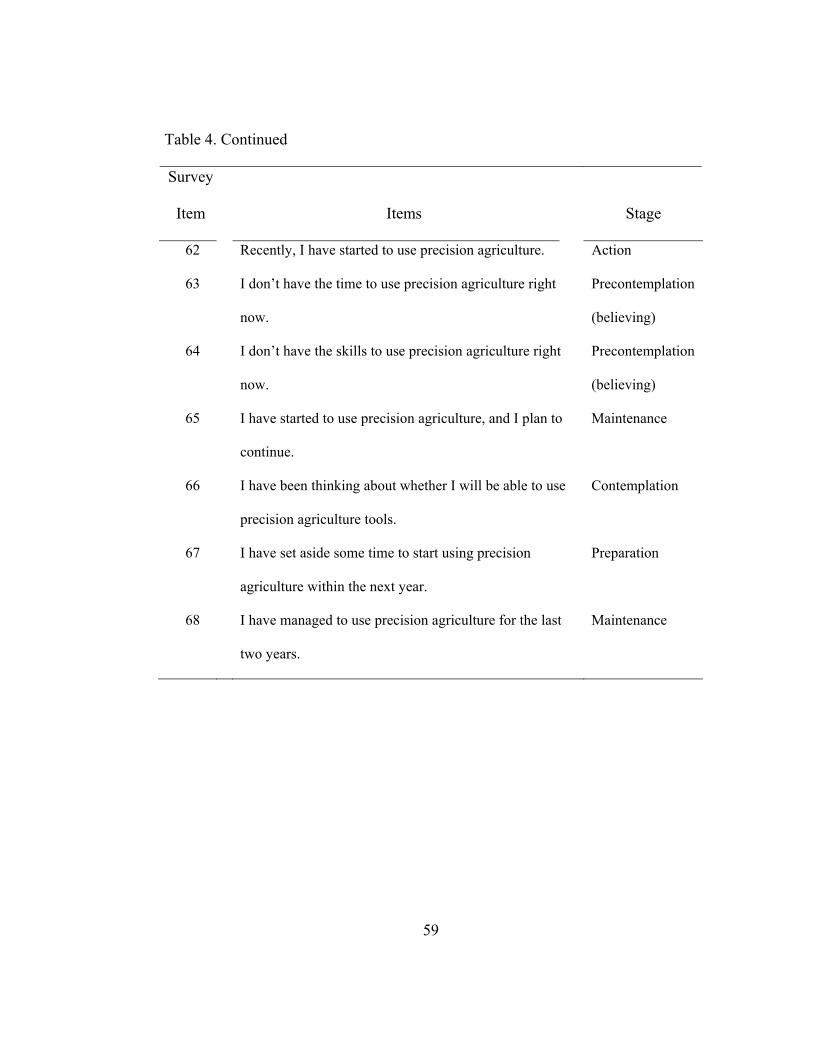
59
Table 4. Continued
Survey
Item Items Stage
62 Recently, I have started to use precision agriculture. Action
63 I don’t have the time to use precision agriculture right
now.
Precontemplation
(believing)
64 I don’t have the skills to use precision agriculture right
now.
Precontemplation
(believing)
65 I have started to use precision agriculture, and I plan to
continue.
Maintenance
66 I have been thinking about whether I will be able to use
precision agriculture tools.
Contemplation
67 I have set aside some time to start using precision
agriculture within the next year.
Preparation
68 I have managed to use precision agriculture for the last
two years.
Maintenance
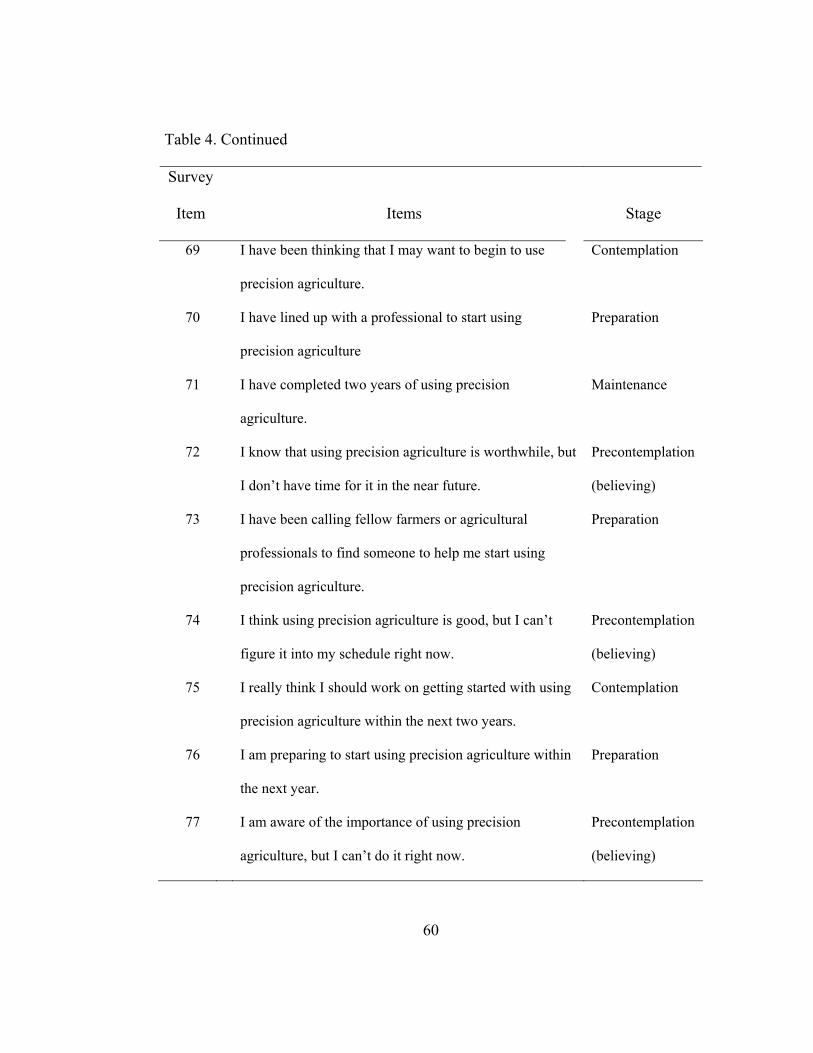
60
Table 4. Continued
Survey
Item Items Stage
69 I have been thinking that I may want to begin to use
precision agriculture.
Contemplation
70 I have lined up with a professional to start using
precision agriculture
Preparation
71 I have completed two years of using precision
agriculture.
Maintenance
72 I know that using precision agriculture is worthwhile, but
I don’t have time for it in the near future.
Precontemplation
(believing)
73 I have been calling fellow farmers or agricultural
professionals to find someone to help me start using
precision agriculture.
Preparation
74 I think using precision agriculture is good, but I can’t
figure it into my schedule right now.
Precontemplation
(believing)
75 I really think I should work on getting started with using
precision agriculture within the next two years.
Contemplation
76 I am preparing to start using precision agriculture within
the next year.
Preparation
77 I am aware of the importance of using precision
agriculture, but I can’t do it right now.
Precontemplation
(believing)
61
Scoring of the Stages
The URICA short form includes subscales that measure stage of change—
precontemplation (nonbelieving), precontemplation (believing), contemplation,
preparation, action, and maintenance. The subscales are combined arithmetically to
generate a continuous scale that can be used to assess the change. Stage of change
scores for this study were calculated by summing the standardized scores for
maintenance, action, preparation, and contemplation and subtracting the standardized
scores for precontemplation (Marcus et al., 1992; McConnaughy et al., 1983).
Decisional Balance
Decisional balance, proposed by Janis and Mann (1977), was used to compare
the gains and losses of making a change. Decisional balance represents both cognitive
and motivational aspects of decision making. Careful selection of the scale items helps
ensure content validity of the construct (Nunnally, 1978). Possible scale items should
be formulated by the conceptual definitions of construct (Anastasi, 1986). Following
these recommendations, the possible items for the pros and cons of the decisional
balance were generated from research on the adoption of precision agriculture and
were pre-tested.
Pros
The specific items for the pros of the decisional balance construct were taken
from precision agriculture research that identified advantages of using precision
agriculture. The perception of economic value and operational benefits is important to
explain the adoption of these technologies (Batte & Arnholt, 2003; Cochrane, 1993;
62
Rogers, 1995). Use of precision agriculture leads to varying inputs by decreasing
inputs in areas where the chemicals are not needed which leads to reduction in costs.
Increasing inputs, such as chemicals, potentially means that yields will be greater in
those areas, thus increasing yields is a potential advantage of using precision
agriculture. Both reducing costs and increasing production yield greater profits. These
three benefits have been documented in research and in the agricultural industry press
as potential benefits of precision agriculture (Batte, 2000; Godwin et al., 2003).
Table 5 shows the items that represented the pros. Each item is displayed with
the reference. These items were part of the questionnaire; the participants were asked
to rate the importance of each statement in their decision to use or not use precision
agriculture tools.
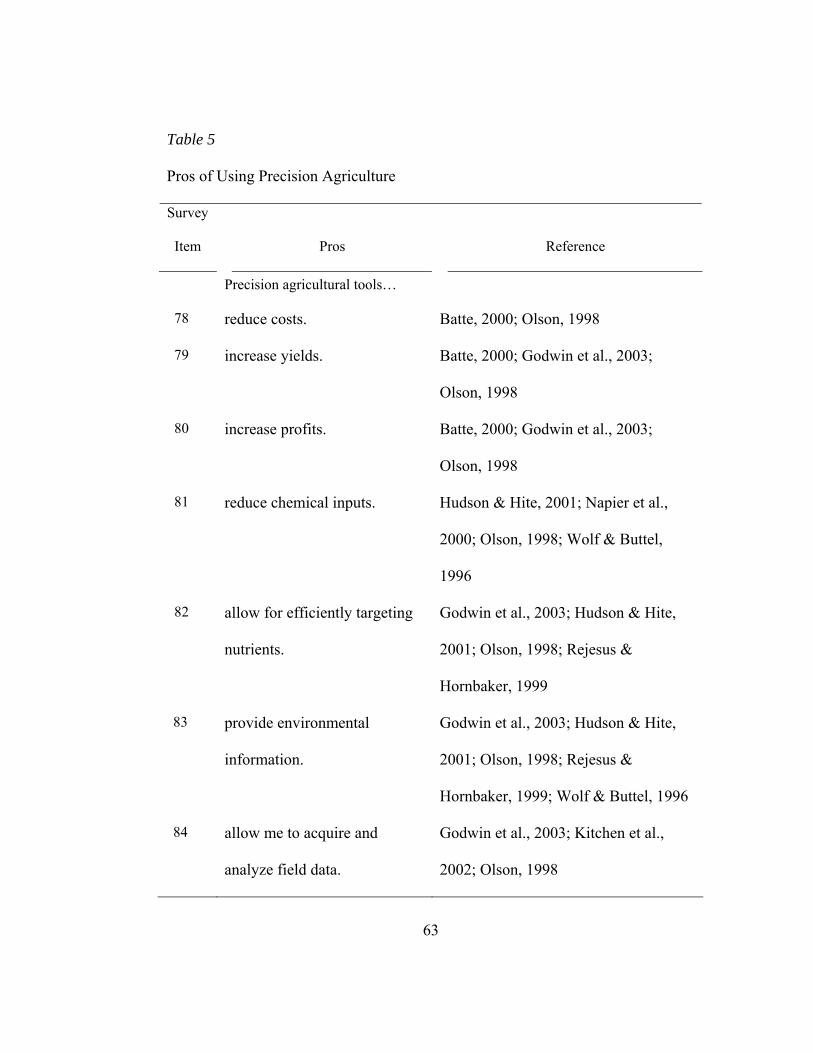
63
Table 5
Pros of Using Precision Agriculture
Survey
Item Pros Reference
Precision agricultural tools…
78 reduce costs. Batte, 2000; Olson, 1998
79 increase yields. Batte, 2000; Godwin et al., 2003;
Olson, 1998
80 increase profits. Batte, 2000; Godwin et al., 2003;
Olson, 1998
81 reduce chemical inputs. Hudson & Hite, 2001; Napier et al.,
2000; Olson, 1998; Wolf & Buttel,
1996
82 allow for efficiently targeting
nutrients.
Godwin et al., 2003; Hudson & Hite,
2001; Olson, 1998; Rejesus &
Hornbaker, 1999
83 provide environmental
information.
Godwin et al., 2003; Hudson & Hite,
2001; Olson, 1998; Rejesus &
Hornbaker, 1999; Wolf & Buttel, 1996
84 allow me to acquire and
analyze field data.
Godwin et al., 2003; Kitchen et al.,
2002; Olson, 1998
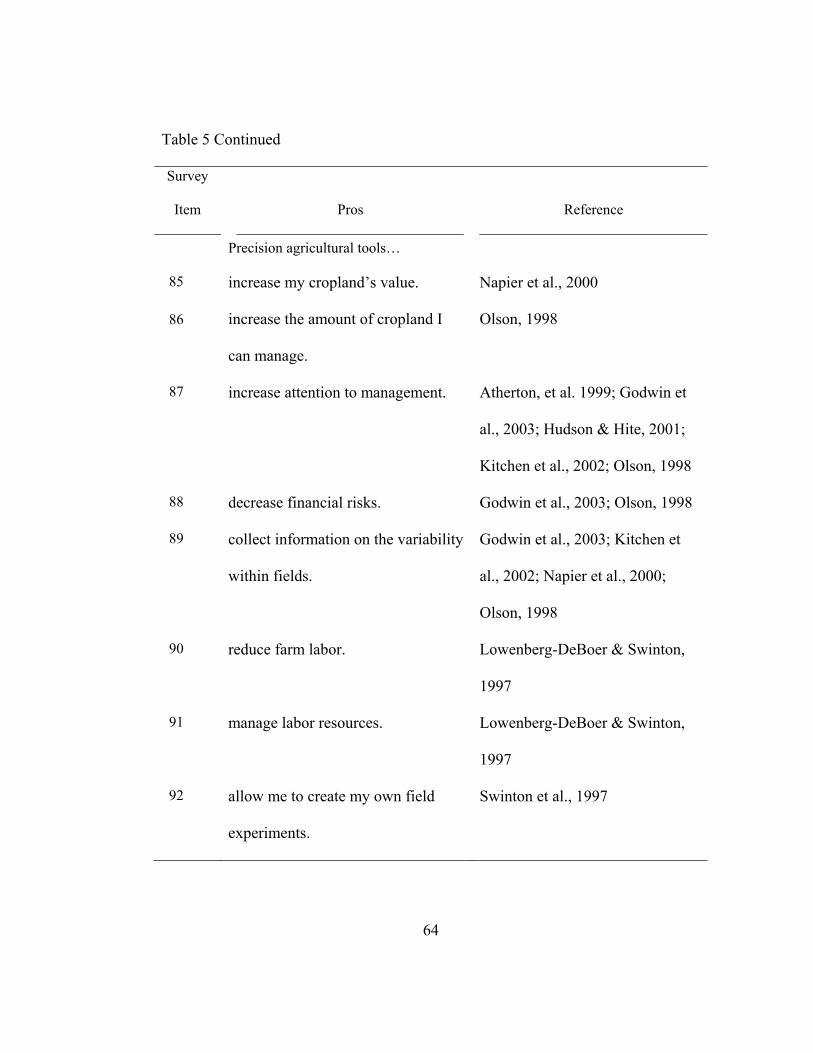
64
Table 5 Continued
Survey
Item Pros Reference
Precision agricultural tools…
85 increase my cropland’s value. Napier et al., 2000
86 increase the amount of cropland I
can manage.
Olson, 1998
87 increase attention to management. Atherton, et al. 1999; Godwin et
al., 2003; Hudson & Hite, 2001;
Kitchen et al., 2002; Olson, 1998
88 decrease financial risks. Godwin et al., 2003; Olson, 1998
89 collect information on the variability
within fields.
Godwin et al., 2003; Kitchen et
al., 2002; Napier et al., 2000;
Olson, 1998
90 reduce farm labor. Lowenberg-DeBoer & Swinton,
1997
91 manage labor resources. Lowenberg-DeBoer & Swinton,
1997
92 allow me to create my own field
experiments.
Swinton et al., 1997
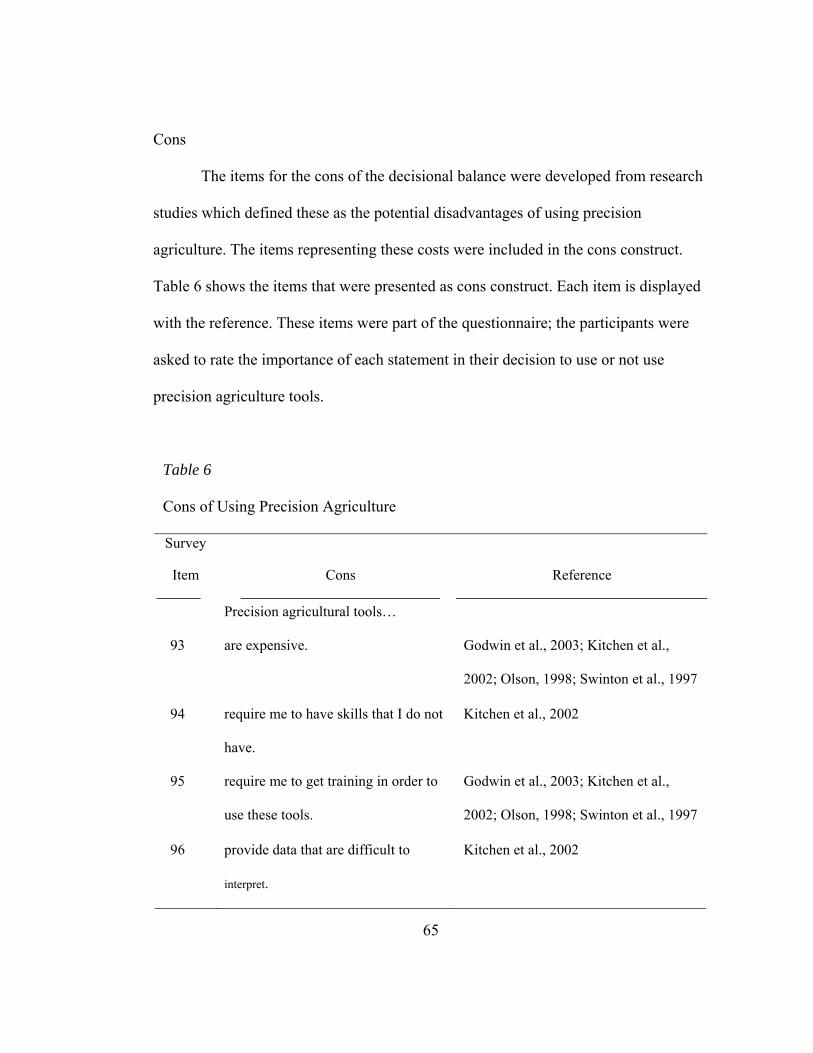
65
Cons
The items for the cons of the decisional balance were developed from research
studies which defined these as the potential disadvantages of using precision
agriculture. The items representing these costs were included in the cons construct.
Table 6 shows the items that were presented as cons construct. Each item is displayed
with the reference. These items were part of the questionnaire; the participants were
asked to rate the importance of each statement in their decision to use or not use
precision agriculture tools.
Table 6
Cons of Using Precision Agriculture
Survey
Item Cons Reference
Precision agricultural tools…
93 are expensive. Godwin et al., 2003; Kitchen et al.,
2002; Olson, 1998; Swinton et al., 1997
94 require me to have skills that I do not
have.
Kitchen et al., 2002
95 require me to get training in order to
use these tools.
Godwin et al., 2003; Kitchen et al.,
2002; Olson, 1998; Swinton et al., 1997
96 provide data that are difficult to
interpret.
Kitchen et al., 2002
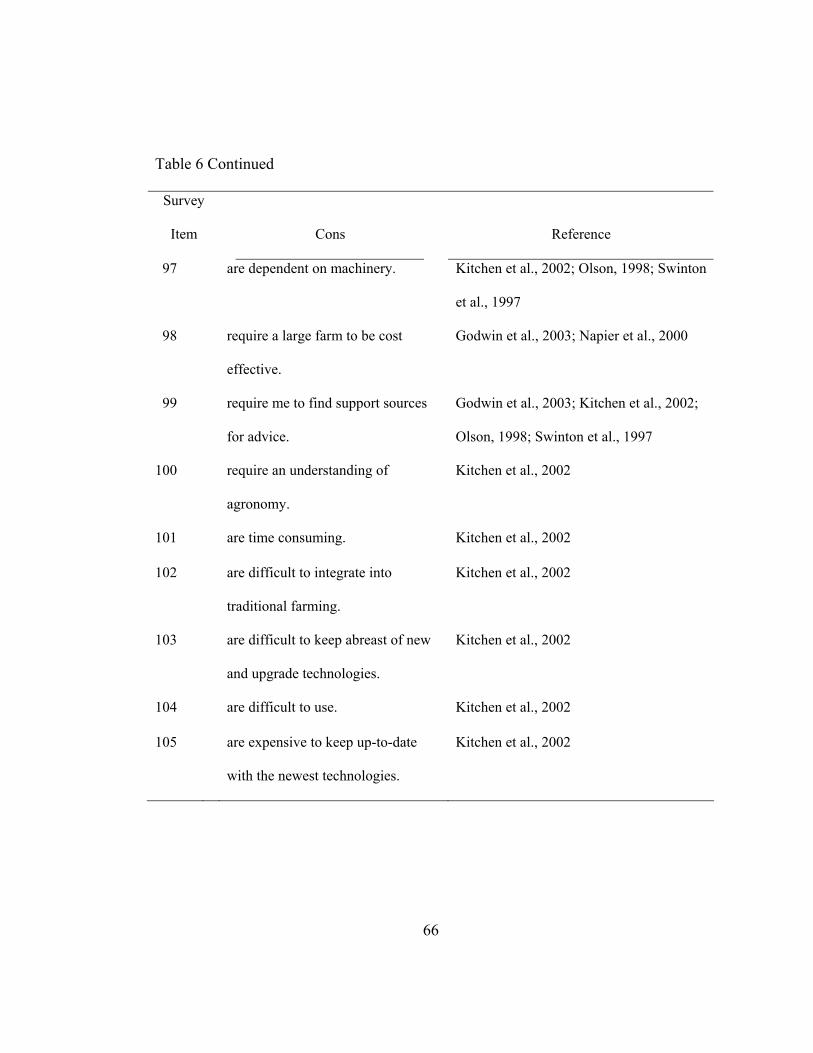
66
Table 6 Continued
Survey
Item Cons Reference
97 are dependent on machinery. Kitchen et al., 2002; Olson, 1998; Swinton
et al., 1997
98 require a large farm to be cost
effective.
Godwin et al., 2003; Napier et al., 2000
99 require me to find support sources
for advice.
Godwin et al., 2003; Kitchen et al., 2002;
Olson, 1998; Swinton et al., 1997
100 require an understanding of
agronomy.
Kitchen et al., 2002
101 are time consuming. Kitchen et al., 2002
102 are difficult to integrate into
traditional farming.
Kitchen et al., 2002
103 are difficult to keep abreast of new
and upgrade technologies.
Kitchen et al., 2002
104 are difficult to use. Kitchen et al., 2002
105 are expensive to keep up-to-date
with the newest technologies.
Kitchen et al., 2002
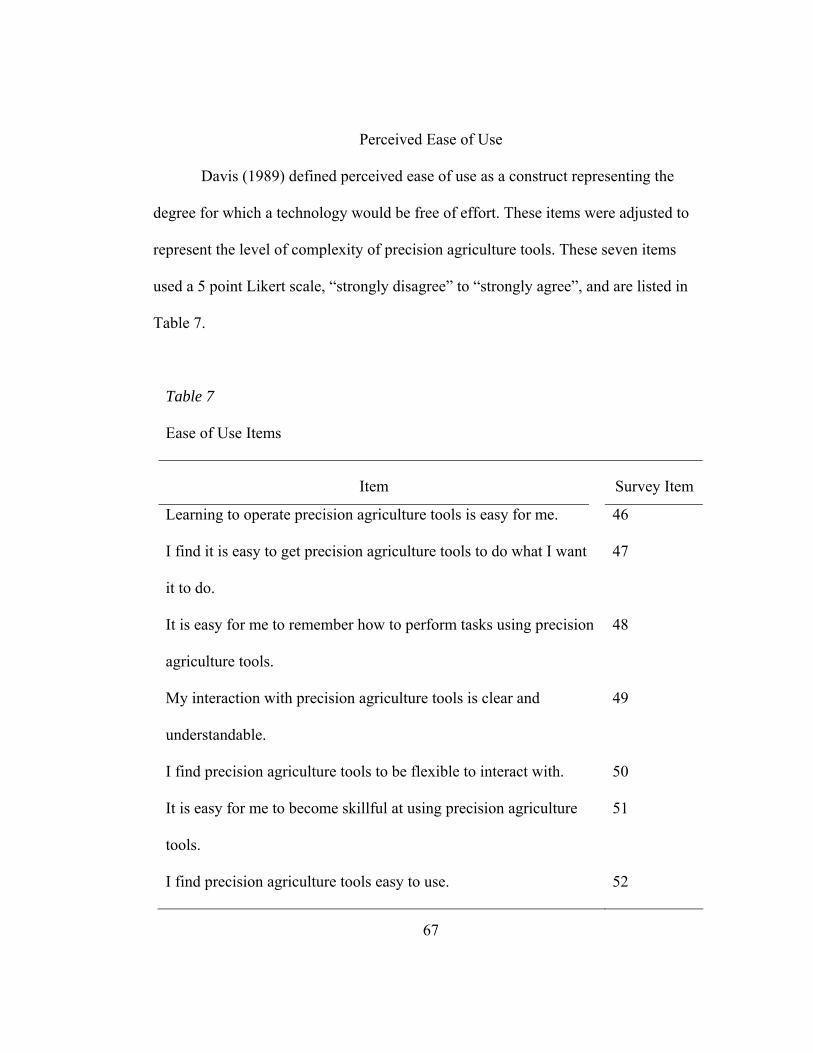
67
Perceived Ease of Use
Davis (1989) defined perceived ease of use as a construct representing the
degree for which a technology would be free of effort. These items were adjusted to
represent the level of complexity of precision agriculture tools. These seven items
used a 5 point Likert scale, “strongly disagree” to “strongly agree”, and are listed in
Table 7.
Table 7
Ease of Use Items
Item
Survey Item
Learning to operate precision agriculture tools is easy for me. 46
I find it is easy to get precision agriculture tools to do what I want
it to do.
47
It is easy for me to remember how to perform tasks using precision
agriculture tools.
48
My interaction with precision agriculture tools is clear and
understandable.
49
I find precision agriculture tools to be flexible to interact with. 50
It is easy for me to become skillful at using precision agriculture
tools.
51
I find precision agriculture tools easy to use. 52
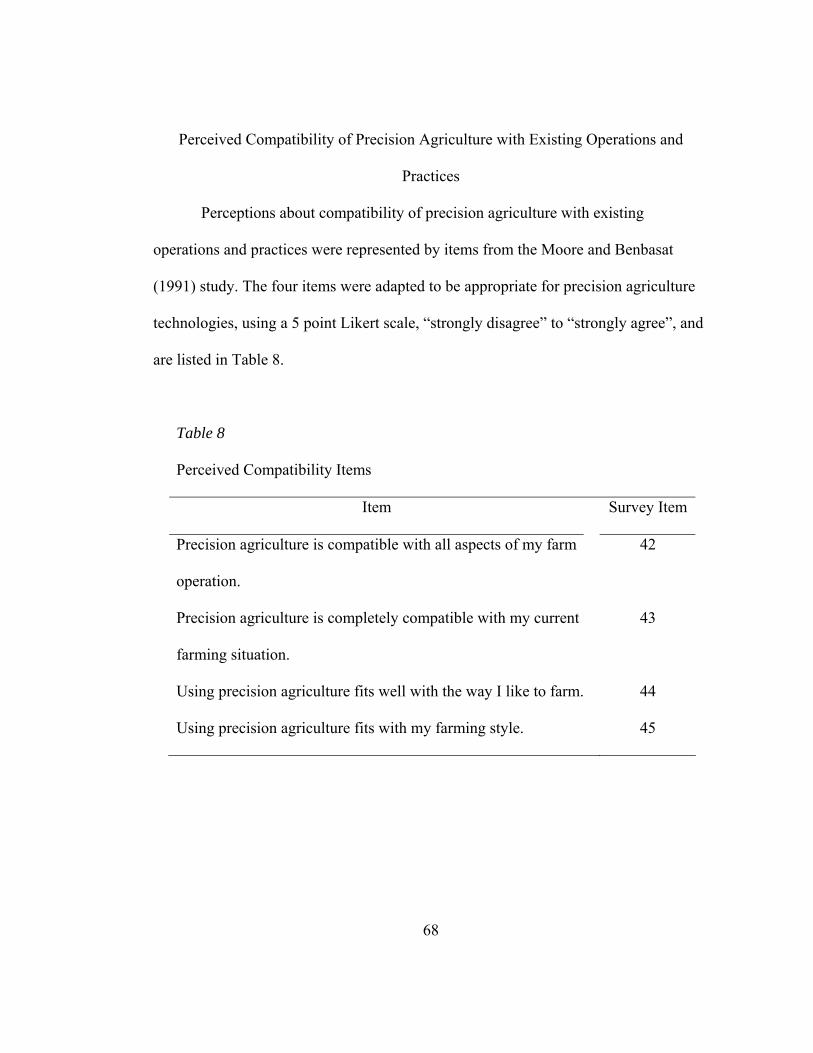
68
Perceived Compatibility of Precision Agriculture with Existing Operations and
Practices
Perceptions about compatibility of precision agriculture with existing
operations and practices were represented by items from the Moore and Benbasat
(1991) study. The four items were adapted to be appropriate for precision agriculture
technologies, using a 5 point Likert scale, “strongly disagree” to “strongly agree”, and
are listed in Table 8.
Table 8
Perceived Compatibility Items
Item Survey Item
Precision agriculture is compatible with all aspects of my farm
operation.
42
Precision agriculture is completely compatible with my current
farming situation.
43
Using precision agriculture fits well with the way I like to farm. 44
Using precision agriculture fits with my farming style. 45
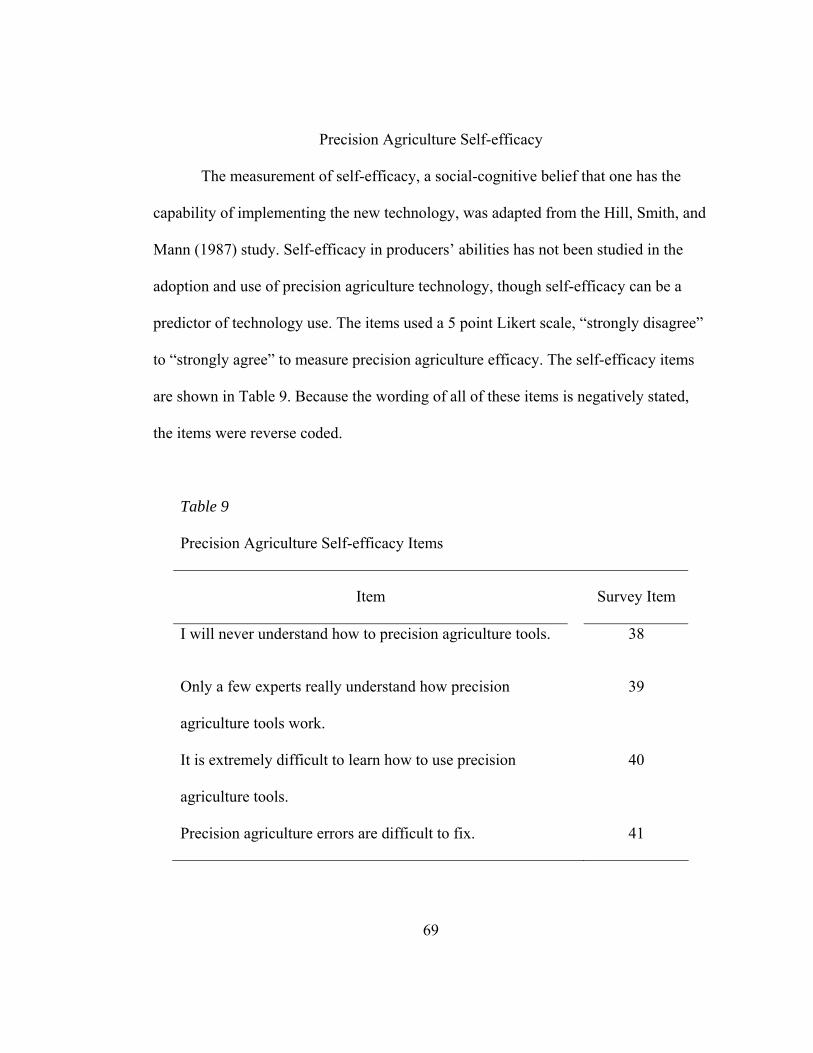
69
Precision Agriculture Self-efficacy
The measurement of self-efficacy, a social-cognitive belief that one has the
capability of implementing the new technology, was adapted from the Hill, Smith, and
Mann (1987) study. Self-efficacy in producers’ abilities has not been studied in the
adoption and use of precision agriculture technology, though self-efficacy can be a
predictor of technology use. The items used a 5 point Likert scale, “strongly disagree”
to “strongly agree” to measure precision agriculture efficacy. The self-efficacy items
are shown in Table 9. Because the wording of all of these items is negatively stated,
the items were reverse coded.
Table 9
Precision Agriculture Self-efficacy Items
Item
Survey Item
I will never understand how to precision agriculture tools. 38
Only a few experts really understand how precision
agriculture tools work.
39
It is extremely difficult to learn how to use precision
agriculture tools.
40
Precision agriculture errors are difficult to fix. 41
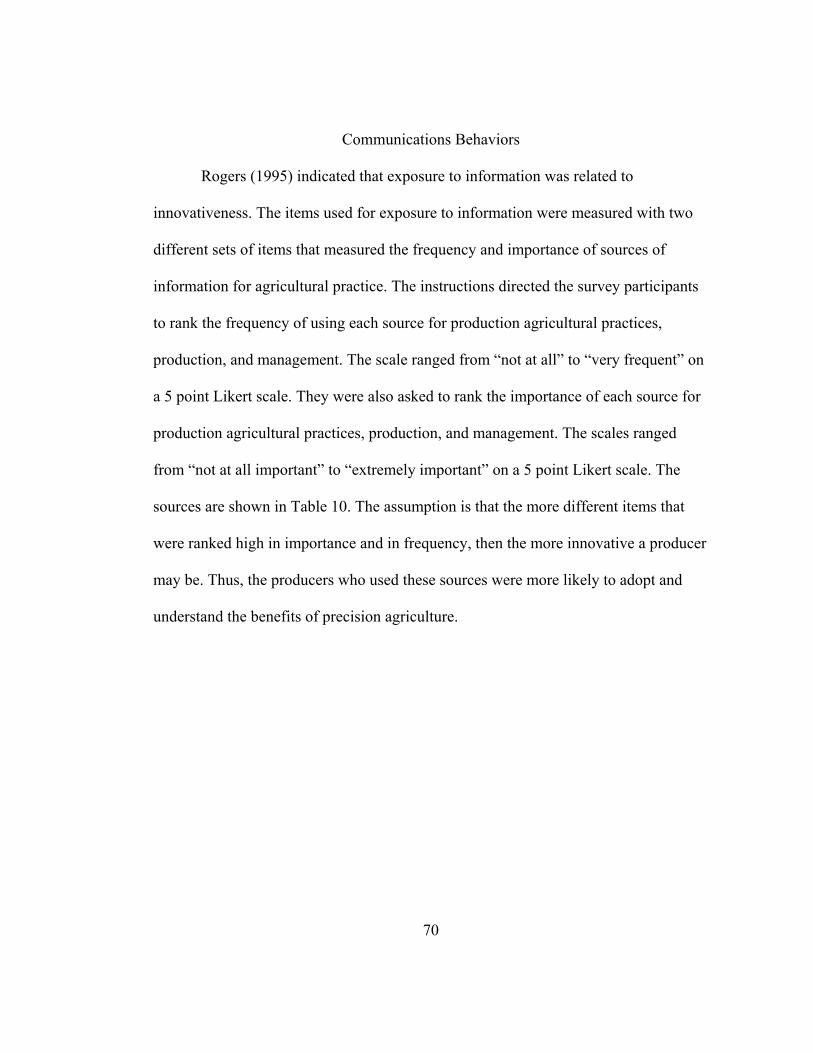
70
Communications Behaviors
Rogers (1995) indicated that exposure to information was related to
innovativeness. The items used for exposure to information were measured with two
different sets of items that measured the frequency and importance of sources of
information for agricultural practice. The instructions directed the survey participants
to rank the frequency of using each source for production agricultural practices,
production, and management. The scale ranged from “not at all” to “very frequent” on
a 5 point Likert scale. They were also asked to rank the importance of each source for
production agricultural practices, production, and management. The scales ranged
from “not at all important” to “extremely important” on a 5 point Likert scale. The
sources are shown in Table 10. The assumption is that the more different items that
were ranked high in importance and in frequency, then the more innovative a producer
may be. Thus, the producers who used these sources were more likely to adopt and
understand the benefits of precision agriculture.
71
Table 10
Sources of Information for Agricultural Production, Practices, and Management
Item
Survey Item
University Extension Agent, Specialist, or Representative 4 and 14
University Extension/Research Newsletters, Publications 5 and 15
Other farmers 6 and 16
Agribusiness Vendor 7 and 17
Production Magazine 8 and 18
TV News 9 and 19
Radio 10 and 20
Newspaper 11 and 21
Internet Resource 12 and 22
Email Group/List 13 and 23
Farm Size, Educational Level, and Off-Farm Employment
Farm size was measured with two different items. One item asked about how
many acres the producers operate and the next item asked the amount of sales of the
farming operation (Napier et al., 2000). Sales were broken into 6 categories: Less than
$10,000; $10,000 to $24,999; $25,000 to $49,999; $50,000 to $99,999; $100,000 to
$249,999; and more than $250,000.
72
Education level was measured as having some high school, high school degree
or GED, trade school, some college, a college degree, and a graduate degree. Off-farm
employment was measured with a single yes/no answer to the question, “Are you
employed outside the farm?”
Knowledge of Precision Agriculture
While the focus of this study is on the adoption of precision agriculture, those
participants who know nothing or very little about precision agriculture will not be
able to rank the importance of these tools. Therefore, one item for each tool was asked
about the participant’s knowledge of that tool. Respondents ranked their level of
knowledge of each of the tools. The ranking included six options: Never heard of this
tool; Heard of this tool, but do not know what it is; Heard about this tool and know a
little about it; Know what this tool is, but do not know how it is used or how to use it;
Know what this tool is and how it is used, but do not know how to use it; and Know
what this tool is, how it is used, and how to use it.
Participants
Survey data were collected from agricultural producers in Alabama who have
more than 50 acres of row crops. The sample for this study is a USDA-NASS list of
agricultural producers. The population of farmers with more than 50 acres of row
crops is 2,805 farms. To ensure the confidentiality of all participants, the USDA-
NASS Alabama Statistics Office administered the survey and arranged all
correspondence with participants.
73
Survey Procedure
The questionnaire was reviewed by a group of agricultural researchers,
Cooperative Extension specialists, Extension field agents, and statisticians with the
Alabama Agricultural Statistics Office. 1,117 surveys were mailed to farmers with
more than 50 acres in row crop production. Along with the survey, a letter signed by
this researcher explaining that the responses would be anonymous (see Appendix A)
was included in the mailing. The survey was four pages long, included 108 questions.
All questions were written as single items, with the exception of the third question on
the first page which had 6 items. The survey was addressed to be returned to USDA-
NASS (see Appendix B).
Sampling Methods
The sample for this study was the USDA-NASS list of agricultural producers
in Alabama. This list is continually updated by obtaining current information from a
variety of local and state sources. Crop acreages, livestock and poultry inventories,
economic data, and various operator control data characteristics are maintained for
each farm operator on the list.
The USDA-NASS Alabama Statistics Office randomly selected participants
who operate more than 50 acres of row crop or grains. Because precision agriculture
requires a significant amount of investment, 50 acres was used as a minimum cut-off
for the sample.
Participant selection and survey administration were completed by the USDA-
NASS Alabama Statistics Office. Farmers were mailed using a self-administered
74
survey instrument. A postcard reminder was sent to those farmers who did not respond
after two weeks of the questionnaire being mailed. The surveys were addressed to be
returned to USDA-NASS Alabama Statistics Office. After a few weeks, the Alabama
Statistics Office called the farmers who had not responded to the survey and
encouraged them to complete the survey. An additional survey was sent to
respondents, if they needed it.
Plan of Analysis
This section provides a summary of the statistical and analytical tools used to
analyze the data generated from the survey method. The statistical tools used to
analyze the data were descriptive statistics, confirmatory factor analysis, and structural
equation modeling.
Missing Data
Mean substitution was used to replace missing data. The general rule of thumb
is that mean substitution is appropriate when less than 10 percent of the data are
missing (Roth, 1994). In his study, Downey (1998) also found that mean substitution
provided very good representation of the original data when there is less than 20
percent of the data missing. Thus, the missing data were replaced with the mean of the
item using the SPSS replacing mean function.
Descriptive Statistics
The first step in analyzing the results of the survey collection was the
examination of the demographic data and usage of the precision agriculture tools.
Variables examined were off-farm employment, educational level, farm size by farm
75
sales, farm size by acreage managed, communications behaviors, and levels of use for
each precision agriculture tool. Additionally, a comparison of the acreage managed
variable was conducted for non-respondents and respondents. The non-response data
was provided by USDA-NASS.
Confirmatory Factor Analysis
The second step involved in analyzing the data was to use confirmatory factor
analysis to evaluate construct validity and reliability of the scales. Construct validity
was examined using convergent and discriminant validity of the constructs.
Convergent validity represents how well the items load on their respective factors and
is evaluated by the statistical significance as expressed by the critical ratio of each
loading (Anderson & Gerbing, 1988; Bollen, 1989). The critical ratio is calculated
from the regression weight divided by the standard error. Convergent validity is
considered to be satisfactory when the items load on their respective constructs and
each loading is greater than .5 and is statistically significant. When the critical ratio is
greater than 1.96 for a given item, then the item is significant (p < .05) (Anderson &
Gerbing, 1988; Bollen, 1989).
Discriminant validity is inferred when measures of each construct converge on
their respective true scores that are unique from the loading of other constructs
(Churchill, 1979). Discriminant validity was assessed for each of the constructs by
comparing the χ2 difference between a constrained model and a model where the
constructs were allow to freely covary for each pair of constructs in the model
76
(Anderson & Gerbing, 1988). This test was performed separately for the stage of
change and the decisional balance constructs.
Additionally, Cronbach’s alpha statistics were utilized to test for the internal
consistency, also called reliability, of each stage of change subscale and perceived
ease of use, perceived compatibility and precision agriculture self-efficacy scales. The
Cronbach statistic ranges from zero to one and values close to one indicate excellent
internal consistency. Values for the Cronbach estimates should be above .70 to
achieve fair internal consistency, .80 to achieve good internal consistency, and .90 to
achieve excellent internal consistency (Cicchetti, 1994).
For each construct, the assessment of overall fit, or goodness of fit, was
conducted using several goodness of fit measures (Hu & Bentler, 1999). The most
common goodness of fit measure is the χ2 statistic. A non-significant χ2, when the p-
value is greater than .05, indicates a good fit. While this is the only goodness of fit
measure that indicates significance, a non-significant χ2 is implausible because it is so
sensitive to sample size and the number of indicators in the model (Browne & Mels,
1992). Therefore, other measures were also used to assess an adequate fit.
An alternative to the χ2 statistic is the χ2 to degrees of freedom ratio. The ratio
should approach the value of one. Several rules of thumb are recommended as the
upper limit to indicate an acceptable fit. Recommended values range from a low-end
of two (Byrne, 2001) to five (Wheaton, Muthen, Alwin, & Summers, 1977). Some IS
researchers have used a value of three to indicate a satisfactory fit (Kettinger, Lee, &
Lee, 1995; Segars & Grover, 1993).
77
RMSEA, another fit measure, is the average size of the fitted residuals per
degrees of freedom. RMSEA is one of the fit indices that is affected by sample size.
Values of zero indicate a perfect fit and values of .05 or less indicate a close fit, values
of .08 indicate an adequate fit, and values of .10 or greater are not acceptable (Browne
& Cudeck, 1993).
The other goodness of fit indices used are Comparative Fit Index (CFI),
Normed Fit Index (NFI), and Tucker-Lewis Index (TLI). CFI, also known as the
Bentler Comparative Fit Index, compares the existing model fit with a null model
which assumes the latent variables in the model are uncorrelated. The CFI is less
sensitive to sample sizes than other goodness of fit indices. CFI penalizes for the
number of parameters in the model. Values range from zero to one. A value of one
indicates a perfect fit, with greater than .90 indicate an adequate fit model and values
exceeding .95 indicate a good fit (Hu & Bentler, 1999).
The NFI reflects the proportion by which the researcher’s model improves fit
compared to the null model. One disadvantage of using NFI is that it increases as
parameters are added. Values greater than .90 indicate an adequate fit and values
greater than .95 indicate a good fit.
The TLI is similar to the NFI, but penalizes for model complexity. A value of 1
indicates a perfect fit. Values greater than .90 indicate an adequate fit and values
greater than .95 indicate a good fit (Hu & Bentler, 1999).
78
Decisional Balance and Stage Correlations
It is hypothesized that the stage of changes influences decisional balance. As
the decisional balance increases, the stage score should also increase. The components
of decisional balance, the pros and cons, were also analyzed for correlation with stage
of change.
Structural Equation Modeling
The third step in the analysis was to evaluate the hypothesized structural
equation model by using Analysis of Moment Structures (AMOS) which
simultaneously estimates the model, including latent and observed variables,
exogenous and endogenous variables, and the paths to these variables. The overall fit
and explanatory power of the model was examined. The relative strength and
significance of the individual paths were also evaluated.
The assessment of overall fit, or goodness of fit, was conducted using several
goodness of fit measures (Hu & Bentler, 1999). The goodness of fit measures used
were the χ2 statistic, χ2 to degrees of freedom ratio, RMSEA, CFI, NFI, and TLI.
The final step in the analysis was to test the hypotheses. Each of the paths of
the structural model was accessed by evaluating the significance of the path (p < .05).
Additionally, the relative strength of each of the paths was examined by evaluating the
standardized regression weights. The hypotheses as described in Chapter 2, Table 1
were evaluated.
79
Summary
The purpose of this research is to create a model that describes, explains, and
predicts the stage of change associated with the precision agriculture adoption-
decision process, and ultimately, use of precision agriculture tools. Confirmatory
factor analysis was used to assess the convergent and discriminant validity of the
constructs. The proposed model, Figure 2, and the hypotheses, Table 1, were tested
using structural equation modeling.
80
CHAPTER 4
RESULTS
This chapter presents the results of statistical analyses. Results presented are
descriptive statistics, confirmatory factor analysis, path analysis using structural
equation modeling, and hypotheses testing.
Descriptive Statistics
The Alabama Agricultural Statistics Office randomly sampled 1,177 farmers
from a population of 2,805 farms with more than 50 acres of row crops. The average
size farm in the sampled population was 491 row crop acres. The average size farm
that responded to the survey was 495 row crop acres. Thus, there was no significant
difference in the respondents’ and non-respondents’ farm size acreage.
Out of 587 (50% response rate) responses, 301 of these farmers indicated that
at least one of the targeted row crops were grown during the 2005 crop year. The
remaining 286 surveys that were returned, but were labeled as non-usable because the
respondents no longer grow row crops. They are either retired and no longer in
business, or they are still actively farming but no longer grow row crops. In other
words, they may be growing other crops (i.e. hay) and/or raising cattle. Out of the 301
surveys from farmers who indicated that they grew at least one row crop, 26 of these
farmers indicated that they grew fewer than 50 acres in row crops. Of the remaining
81
275 surveys, 14 had only a few items marked so these were also marked as unusable,
leaving 261 usable surveys. These 261 surveys represent 22 percent of the sample and
roughly 10 percent of the population.
Acres Managed
Of the 261 usable surveys, the average farm size was 495 acres with a standard
deviation of 524. The minimum farm size was 50 acres and the maximum farm size
was 3,100 acres. These surveys represented 129,180 acres of row crop land in
Alabama. Of these farms, 147 farms grow corn totaling 24,051 acres; 138 farms grow
cotton totaling 56,514 cotton acres; 98 farms grow peanuts totaling 23,491 peanut
acres; 98 farms grow soybeans totaling 20,033 acres; and 45 farms grow 4,809 acres.
A summary of the acres represented in the survey is shown in Table 11.
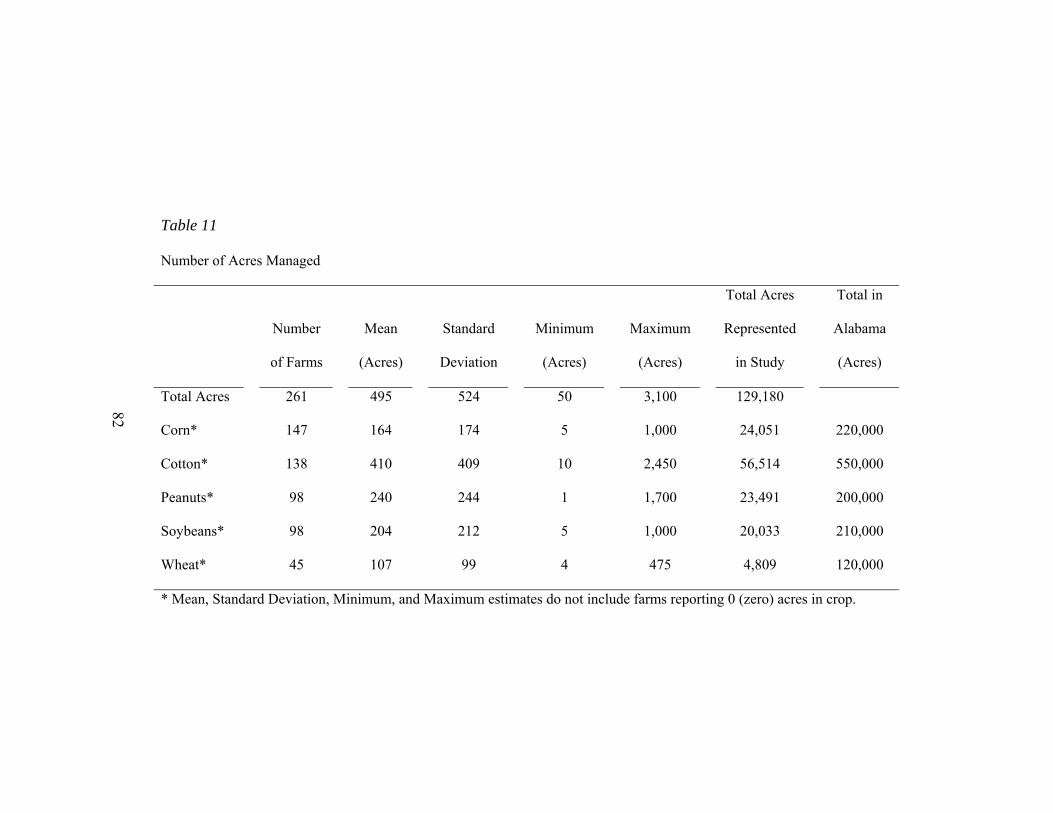
82
Table 11
Number of Acres Managed
Number
of Farms
Mean
(Acres)
Standard
Deviation
Minimum
(Acres)
Maximum
(Acres)
Total Acres
Represented
in Study
Total in
Alabama
(Acres)
Total Acres 261 495 524 50 3,100 129,180
Corn* 147 164 174 5 1,000 24,051 220,000
Cotton* 138 410 409 10 2,450 56,514 550,000
Peanuts* 98 240 244 1 1,700 23,491 200,000
Soybeans* 98 204 212 5 1,000 20,033 210,000
Wheat* 45 107 99 4 475 4,809 120,000
* Mean, Standard Deviation, Minimum, and Maximum estimates do not include farms reporting 0 (zero) acres in crop.
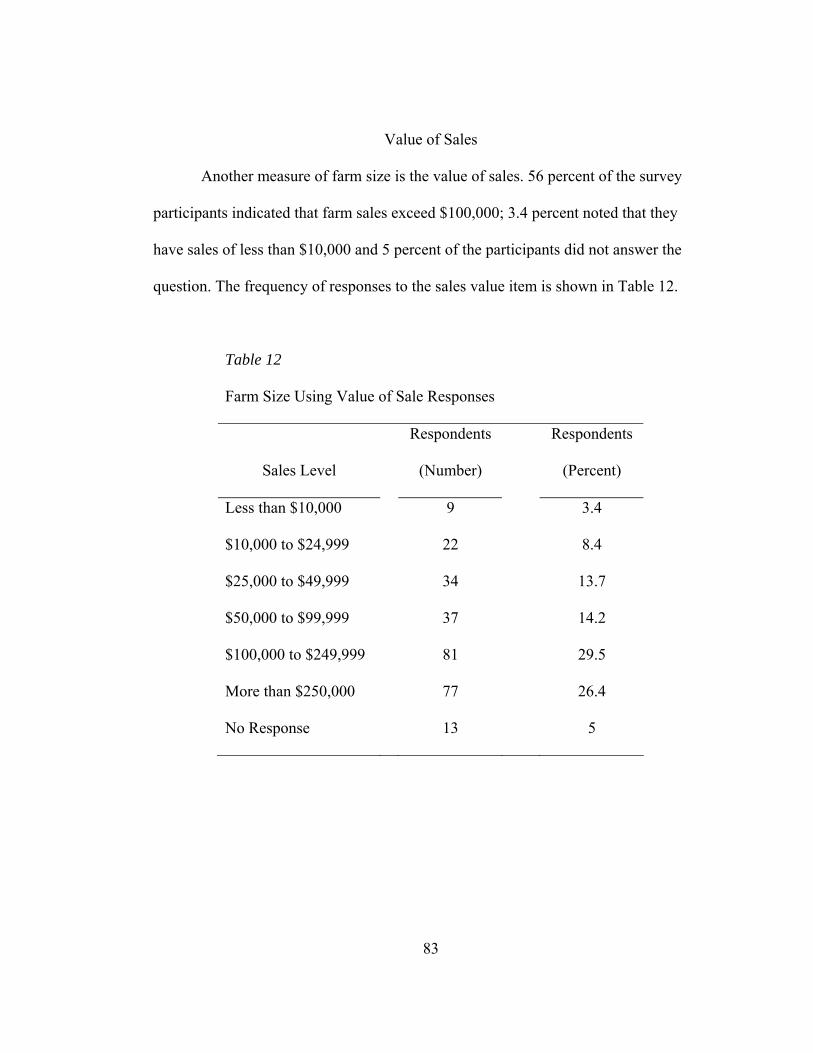
83
Value of Sales
Another measure of farm size is the value of sales. 56 percent of the survey
participants indicated that farm sales exceed $100,000; 3.4 percent noted that they
have sales of less than $10,000 and 5 percent of the participants did not answer the
question. The frequency of responses to the sales value item is shown in Table 12.
Table 12
Farm Size Using Value of Sale Responses
Sales Level
Respondents
(Number)
Respondents
(Percent)
Less than $10,000 9 3.4
$10,000 to $24,999 22 8.4
$25,000 to $49,999 34 13.7
$50,000 to $99,999 37 14.2
$100,000 to $249,999 81 29.5
More than $250,000 77 26.4
No Response 13 5

84
Farm Status and Educational Level
Of the 261 survey respondents, 68 percent of the respondents indicated that
they farm full-time. 30.7 percent of the respondents are employed off-the-farm. A
summary of farming status is shown in Table 13. 31.1 percent of the respondents had
trade school or some college and 26.4 percent of the respondents had a college or
graduate degree. A summary of the education level of the respondents is shown in
Table 13.
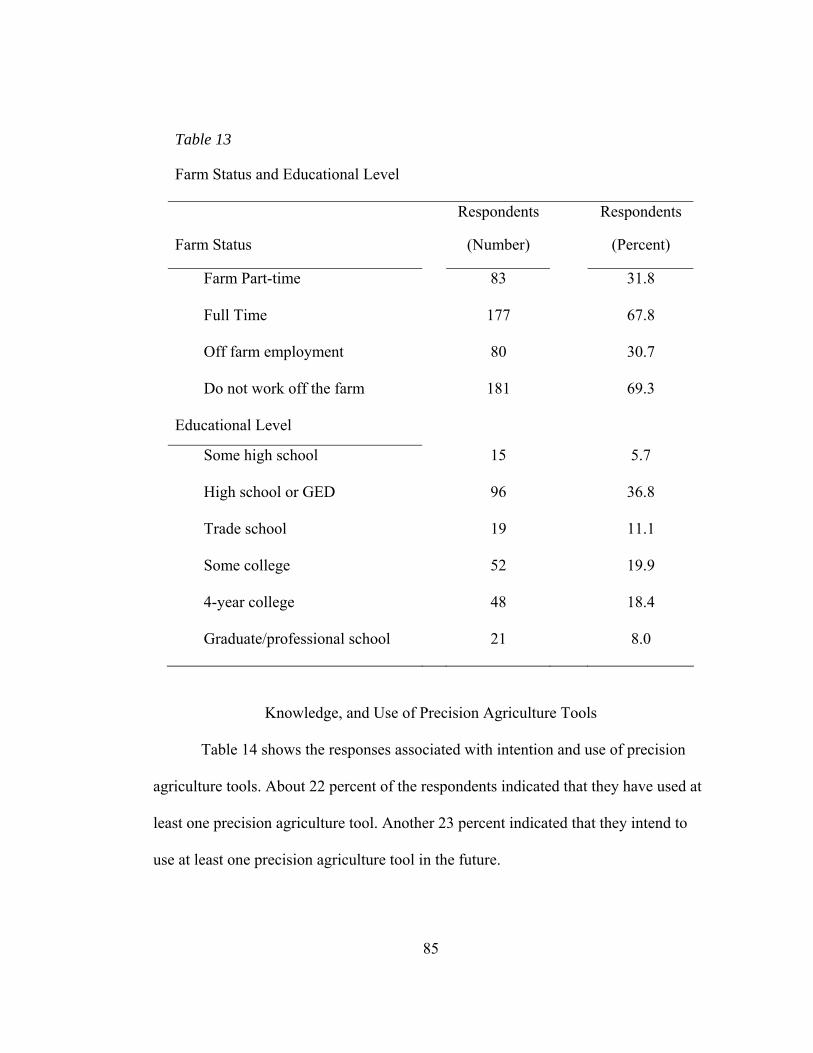
85
Table 13
Farm Status and Educational Level
Farm Status
Respondents
(Number)
Respondents
(Percent)
Farm Part-time 83 31.8
Full Time 177 67.8
Off farm employment 80 30.7
Do not work off the farm 181 69.3
Educational Level
Some high school 15 5.7
High school or GED 96 36.8
Trade school 19 11.1
Some college 52 19.9
4-year college 48 18.4
Graduate/professional school 21 8.0
Knowledge, and Use of Precision Agriculture Tools
Table 14 shows the responses associated with intention and use of precision
agriculture tools. About 22 percent of the respondents indicated that they have used at
least one precision agriculture tool. Another 23 percent indicated that they intend to
use at least one precision agriculture tool in the future.
86
This result indicates that Alabama is still in the early stages of adoption, which
is behind in the adoption rates of others in the United States (Daberkow & McBride,
2003; Isik et al., 2000). A recent survey of Ohio farmers indicated 32 of the farmers
has adopted at least one precision agriculture tool (Batte, 2005).
While some studies have indicated that the yield monitor is the tool most often
adopted (Precision Ag, 2005; Swinton et al., 1997), in this study, the variable rate
application technologies were adopted by more farmers than any other tool. The least
known tool was the light bar guidance system.

87
Table 14
Intention and Use of Precision Agriculture Tools
VRA
Grid
Sampling
Yield
Monitor Lightbar
Auto-
guidance GIS
Remote
Sensing
Mean 1.60 1.38 1.27 1.23 1.20 1.11 .99 Standard Deviation 1.331 1.179 1.006 1.331 1.043 1.015 .932
Statement Frequency of Response
I have never heard of this tool. 36 45 38 80 50 63 74
I have at least some knowledge of this
tool, but I do not intend to use this tool
on my farm in the foreseeable future.
135 144 164 120 158 151 142
I intend to use this tool in the
foreseeable future, but not within the
next year.
47 41 38 26 35 26 28
I intend to use this tool within the next
year. 20 15 19 11 12 18 10
I have been using this tool less than 2
years. 12 17 3 17 5 6 4
I have been using this tool for more
than 2 years. 19 7 7 12 8 4 3
88
Communications Behaviors
In this sample, most farmers cited Extension and University staff, Extension
publications, other farmers, and other vendors as sources that they frequently or very
frequently used. The survey participants also rated these same sources as important
and very important. Radio, Internet, and email are the sources cited the least as
frequently used sources for agricultural production information. Table 15 shows the
number of participants selecting how frequently they used the various sources. Table
16 shows how farmers rated the importance of these sources.
These two methods of rating sources yielded similar results. For simplicity, a
communications behavior score was created by taking the mean of the frequently used
source items. An individual who uses several sources frequently would have a higher
score than someone who uses few sources. The premise is that those who are exposed
to many communication channels have more information to make decisions.
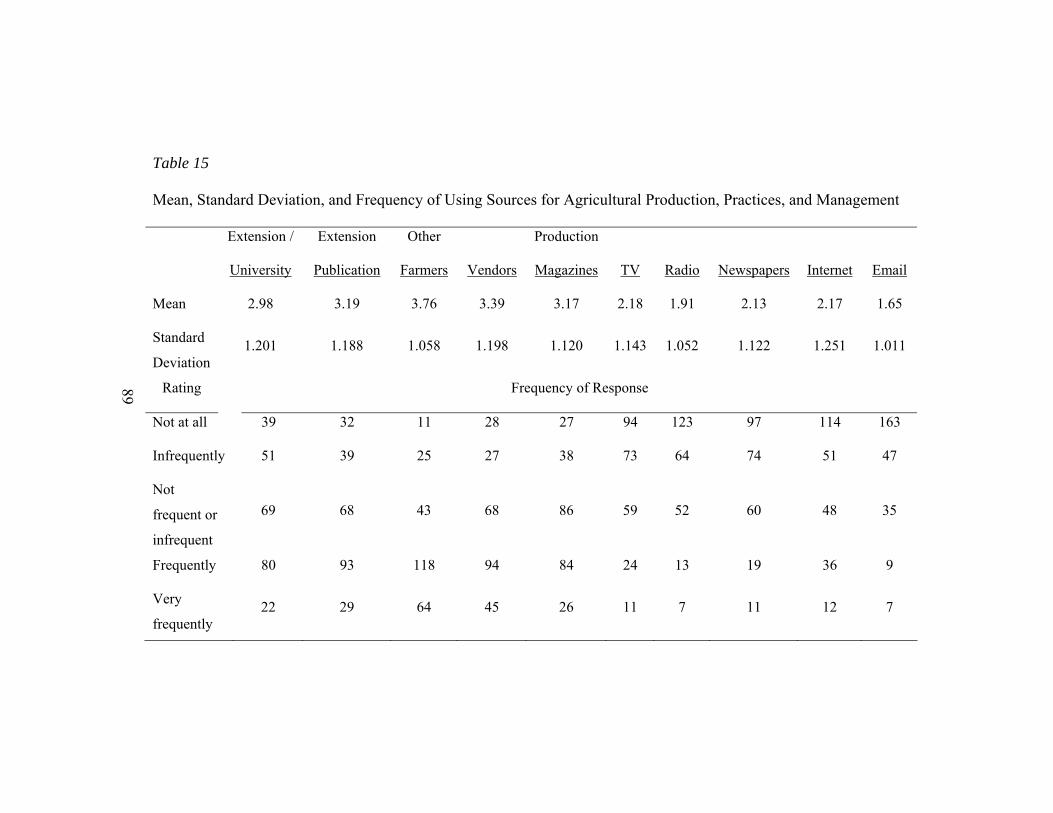
89
Table 15
Mean, Standard Deviation, and Frequency of Using Sources for Agricultural Production, Practices, and Management
Extension /
University
Extension
Publication
Other
Farmers Vendors
Production
Magazines TV Radio Newspapers Internet Email
Mean 2.98 3.19 3.76 3.39 3.17 2.18 1.91 2.13 2.17 1.65
Standard
Deviation 1.201 1.188 1.058 1.198 1.120 1.143 1.052 1.122 1.251 1.011
Rating Frequency of Response
Not at all 39 32 11 28 27 94 123 97 114 163
Infrequently 51 39 25 27 38 73 64 74 51 47
Not
frequent or
infrequent
69 68 43 68 86 59 52 60 48 35
Frequently 80 93 118 94 84 24 13 19 36 9
Very
frequently 22 29 64 45 26 11 7 11 12 7
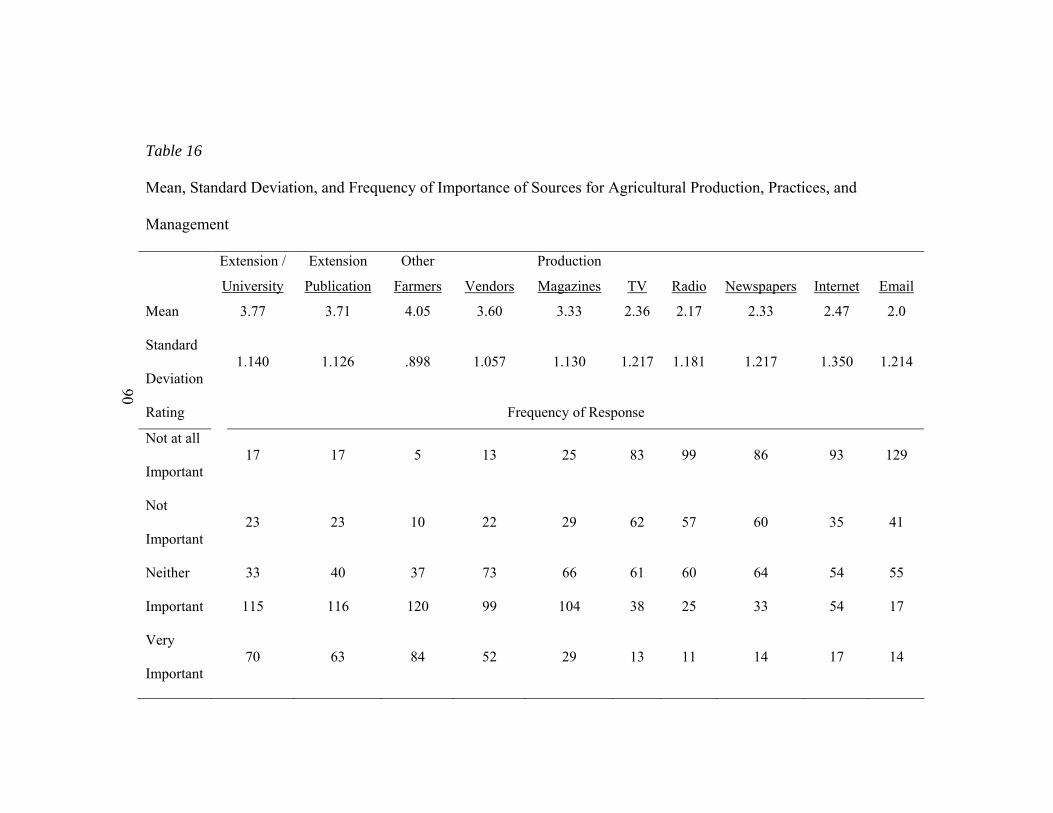
90
Table 16
Mean, Standard Deviation, and Frequency of Importance of Sources for Agricultural Production, Practices, and
Management
Extension /
University
Extension
Publication
Other
Farmers Vendors
Production
Magazines TV Radio Newspapers Internet Email
Mean 3.77 3.71 4.05 3.60 3.33 2.36 2.17 2.33 2.47 2.0
Standard
Deviation 1.140 1.126 .898 1.057 1.130 1.217 1.181 1.217 1.350 1.214
Rating Frequency of Response
Not at all
Important 17 17 5 13 25 83 99 86 93 129
Not
Important 23 23 10 22 29 62 57 60 35 41
Neither 33 40 37 73 66 61 60 64 54 55
Important 115 116 120 99 104 38 25 33 54 17
Very
Important 70 63 84 52 29 13 11 14 17 14
91
Confirmatory Factor Analysis
Following data collection and examining the descriptive statistics,
confirmatory factor analyses and structural equation modeling were conducted by
using SPSS and AMOS. Separate confirmatory factor analysis for each of the
constructs (stage of change, decisional balance, perceived compatibility, perceived
ease of use, and precision agriculture self-efficacy) was conducted. Convergent
validity was confirmed by examining the factor loadings on the respective latent
variables and determining if the factor loading was greater than .5 and was significant
( p < .05) (Anderson & Gerbing, 1988; Bollen, 1989). Convergent validity of each
construct is described in this section.
Cronbach alpha estimates were utilized to test internal consistency of the stage
of change subscales and perceived ease of use, perceived compatibility and precision
agriculture self-efficacy scales. Discriminant validity was determined by comparing
the chi-square (χ2) difference between a constrained model and a model where the
constructs were allowed to freely covary for each pair of factors (Anderson &
Gerbing, 1988).
Several fit indices were evaluated to determine the adequacy of each of these
constructs to fit the data. χ2 statistic, χ2 to degrees of freedom ratio, Root Mean Square
Residual (RMSEA), Comparative Fit Index (CFI), Normed Fit Index (NFI), and
Tucker Lewis Index (TLI), were used to evaluate how well the constructs fits the data.
92
Stage of Change
Confirmatory factor analysis was performed on the stage of change construct.
The six factors in the stage of change construct are maintenance, action, preparation,
contemplation, precontemplation-believing, and precontemplation non-believing. The
initial confirmatory factor analysis indicated that three items had standardized
regression weights of less then .5. Items 64 (precontemplation-believing) had a
regression weight of .25. Item 63 (precontemplation-believing) had a standardized
regression weight of .432 and Item 61 (precontemplation-nonbelieving) had a
standardized regression weight of .474. Although these three items were significant,
the standardized regression weights were less than the level needed to indicate
convergent validity (Anderson & Gerbing, 1988; Bollen, 1989). All three of these
items were dropped from the analysis. The mean, standard deviations, standardized
regression weights, and critical ratio for each item of these stage of change factors are
presented in Table 17.
For the maintenance factor, the reliability coefficient was .906, indicating
excellent reliability (Cicchetti, 1994). The standardized regression weights for the
maintenance factor were above .7 and were significant (p < .001). For the action
factor, reliability coefficient was .884, indicating excellent reliability (Cicchetti,
1994). The standardized regression weights for the action factor were above .6 and
were significant (p < .001).
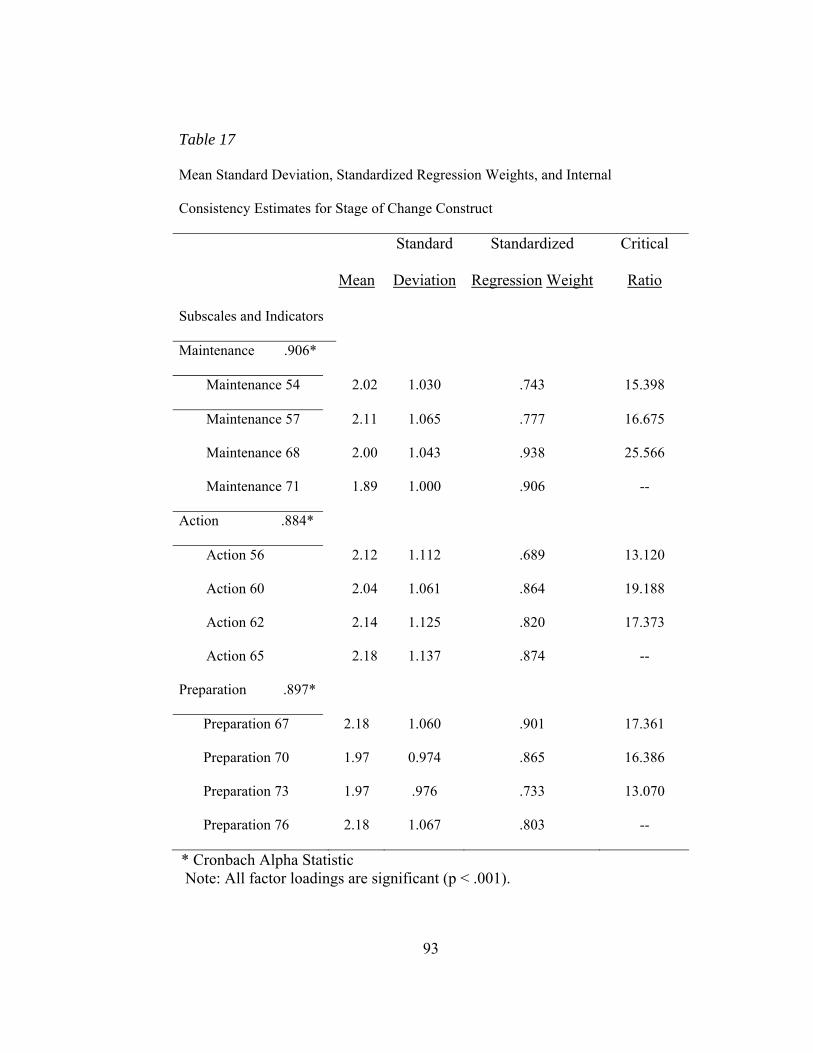
93
Table 17
Mean Standard Deviation, Standardized Regression Weights, and Internal
Consistency Estimates for Stage of Change Construct
Mean
Standard
Deviation
Standardized
Regression Weight
Critical
Ratio
Subscales and Indicators
Maintenance .906*
Maintenance 54 2.02 1.030 .743 15.398
Maintenance 57 2.11 1.065 .777 16.675
Maintenance 68 2.00 1.043 .938 25.566
Maintenance 71 1.89 1.000 .906 --
Action .884*
Action 56 2.12 1.112 .689 13.120
Action 60 2.04 1.061 .864 19.188
Action 62 2.14 1.125 .820 17.373
Action 65 2.18 1.137 .874 --
Preparation .897*
Preparation 67 2.18 1.060 .901 17.361
Preparation 70 1.97 0.974 .865 16.386
Preparation 73 1.97 .976 .733 13.070
Preparation 76 2.18 1.067 .803 --
* Cronbach Alpha Statistic Note: All factor loadings are significant (p < .001).
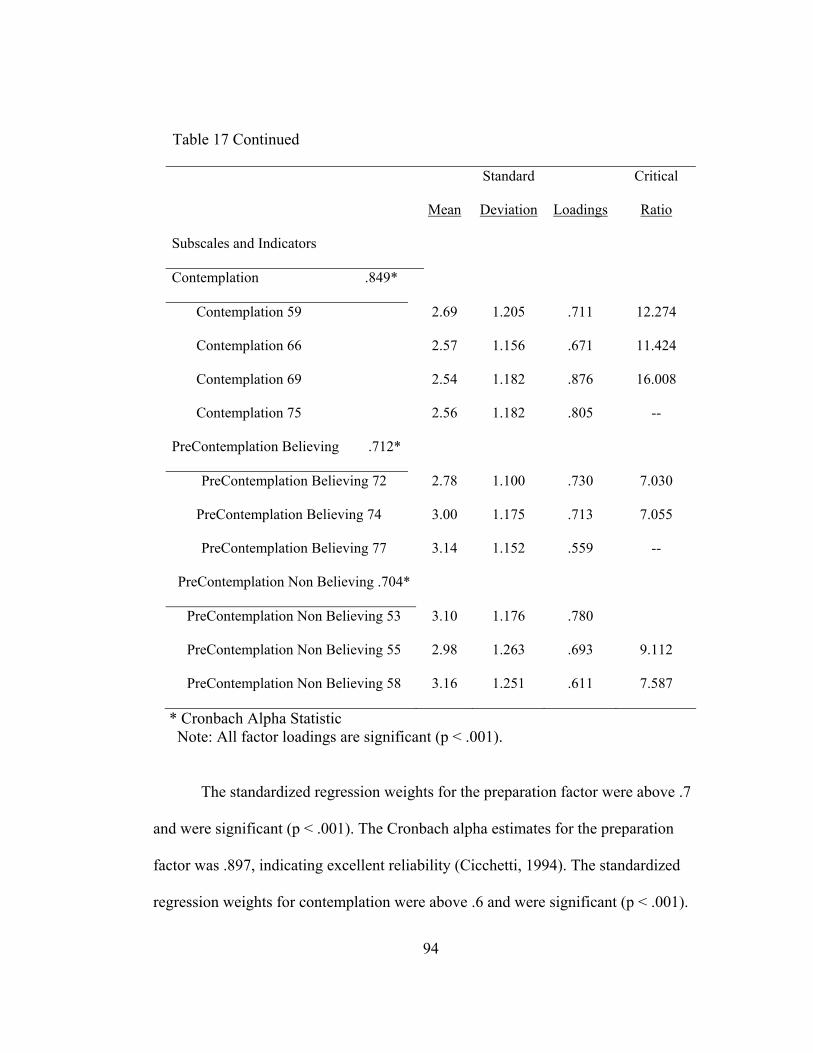
94
Table 17 Continued
Mean
Standard
Deviation Loadings
Critical
Ratio
Subscales and Indicators
Contemplation .849*
Contemplation 59 2.69 1.205 .711 12.274
Contemplation 66 2.57 1.156 .671 11.424
Contemplation 69 2.54 1.182 .876 16.008
Contemplation 75 2.56 1.182 .805 --
PreContemplation Believing .712*
PreContemplation Believing 72 2.78 1.100 .730 7.030
PreContemplation Believing 74 3.00 1.175 .713 7.055
PreContemplation Believing 77 3.14 1.152 .559 --
PreContemplation Non Believing .704*
PreContemplation Non Believing 53 3.10 1.176 .780
PreContemplation Non Believing 55 2.98 1.263 .693 9.112
PreContemplation Non Believing 58 3.16 1.251 .611 7.587
* Cronbach Alpha Statistic Note: All factor loadings are significant (p < .001).
The standardized regression weights for the preparation factor were above .7
and were significant (p < .001). The Cronbach alpha estimates for the preparation
factor was .897, indicating excellent reliability (Cicchetti, 1994). The standardized
regression weights for contemplation were above .6 and were significant (p < .001).
95
The Cronbach alpha estimates for the preparation factor was .849, indicating excellent
reliability (Cicchetti, 1994).
Two items of the precontemplation believing subscale (items 63 and 64) had
regression weights of less than .5 and were dropped from the model. The three
remaining items for this subscale had regression weights greater than .5 and were
significant (p < 001), indicating convergent validity (Anderson & Gerbing, 1988;
Bollen, 1989). The Cronbach alpha statistic for the 3 item precontemplation-believing
subscale was .712. While the goal for internal consistency is at least .8 (Nunnally,
1978), an internal consistency of .7 is considered to be adequate (Cicchetti, 1994).
Item number 61 in the precontemplation-non believing subscale was dropped
because its standardized regression weight was less than .5 (Anderson & Gerbing,
1988; Bollen, 1989). The three remaining items of the precontemplation non-believing
subscale had standardized regression weights of more than .6. The Cronbach alpha
statistic for the precontemplation-non believing subscale was .704, indicating adequate
reliability (Cicchetti, 1994). The mean, standard deviations, standardized regression
weights, and critical ratio for each of these items are presented in Table 17.
Discriminant validity was determined by comparing the χ2 difference between
a constrained model and a model where the factors were allowed to freely covary for
each pair of factors in the model (Anderson & Gerbing, 1988). The test consists of
calculating the χ2 difference between a model which constrains the correlations
between two factors to unity and another model which allows the correlations between
the constructs to covary. This test was performed for the stage of change factors. The
96
comparison for the constrained and unconstrained model was significant. The χ2diff
(dfdiff =15, N =261) = 77.433 (p < .001), thereby providing evidence of discriminant
validity and confirming the six-factor structure for the stage of change construct.
The goodness of fit for the stage of change construct was examined by using
the χ2 statistic, χ2 to degrees of freedom ratio, RMSEA, CFI, NFI, and TLI. The χ2
statistic was significant (χ2= 538.582, df = 194, p < 0.001) for the hypothesized model
which indicated poor fit. The ratio χ2 to degrees of freedom ratio was 2.78 was under
the recommended benchmark of 3 (Kettinger et al., 1995; Segars & Grover, 1993)
which also indicated an adequate fit. Additionally, the RMSEA statistic (.083)
indicated an adequate fit. The CFI (.914) indicated that the stage of change CFA
model was an adequate fit. NFI (.873) and TLI (.898) were slightly below .90. The
goodness of fit measures are provided in Table 18. Additionally, the overall model for
the stage of change construct is shown in Figure 3.
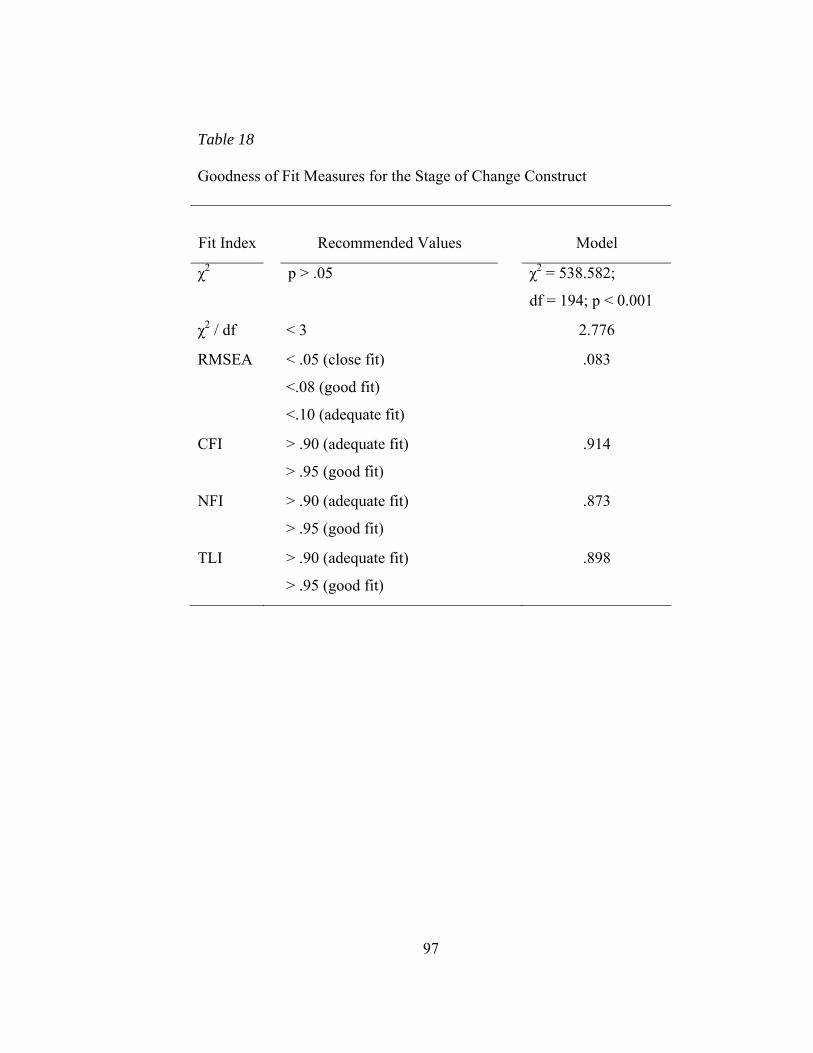
97
Table 18
Goodness of Fit Measures for the Stage of Change Construct
Fit Index Recommended Values Model
χ2 p > .05 χ2 = 538.582;
df = 194; p < 0.001
χ2 / df < 3 2.776
RMSEA < .05 (close fit)
<.08 (good fit)
<.10 (adequate fit)
.083
CFI > .90 (adequate fit)
> .95 (good fit)
.914
NFI > .90 (adequate fit)
> .95 (good fit)
.873
TLI > .90 (adequate fit)
> .95 (good fit)
.898
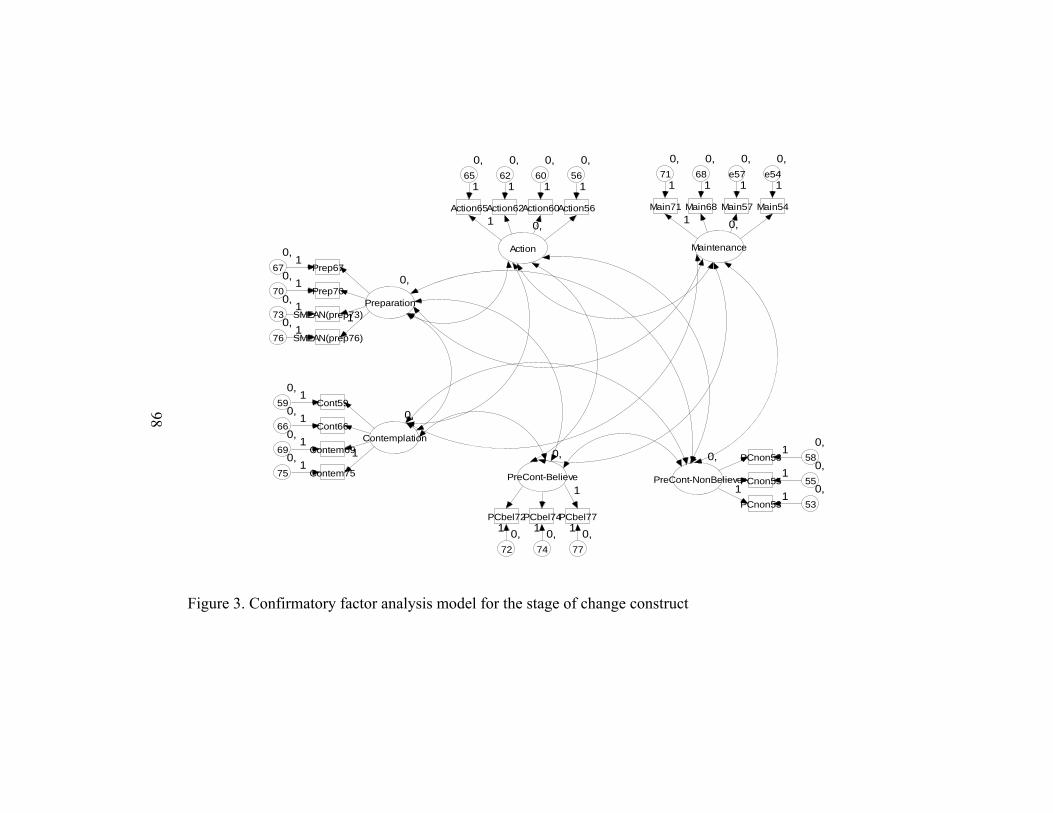
98
Figure 3. Confirmatory factor analysis model for the stage of change construct
0,
Maintenance
Main71
0,71
1
1
Main68
0,68
1
Main57
0,e57
1
Main54
0,e54
1
0,
Action
Action65
0,65
Action62
0,62
Action60
0,60
Action56
0,56
1
1 1 1 1
0,
PreCont-NonBelieve
PCnon580,
58
PCnon550,
55
PCnon530,
53
1
11
1
0,
Contemplation
Contem750,
75
Contem690,
69
Cont660,
66
Cont590,
59
11
1
1
1
0,
Preparation
SMEAN(prep76)0,
76
SMEAN(prep73)0,
73
Prep700,
70
Prep670,
67
11
1
1
1
0,
PreCont-Believe
PCbel77
0,77
PCbel74
0,74
PCbel72
0,72
1
111
99
Staging Algorithm
A stage score is calculated using the standardized (mean) scores for each of six
factors—maintenance, action, preparation, contemplation, precontemplation-believing,
and precontemplation-nonbelieving were computed. The standardized scores for
maintenance, action, preparation, and contemplation scales were summed, and then,
the standardized scores for precontemplation subscales were subtracted to create a
stage score. The following formula demonstrates the calculation for this score:
Stage Score =
+ mean(action) + mean(maintenance) + mean(contemplation)
- mean(precontemplation-believing) - mean(precontemplation-nonbelieving)
Decisional Balance
Confirmatory factor analysis was performed on the pros and cons subscales of
the decisional balance. For pros subscale, the reliability coefficient is .982, thus,
indicating excellent internal consistency (Cicchetti, 1994). The Cronbach alpha
reliability statistic was .964 for the cons subscale, indicating excellent internal
consistency.
Confirmatory factor analysis was conducted on decisional balance factor. The
original CFA model for decisional balance construct is shown in Figure 4. This model
indicated that the error variances of the indicator variables were assumed to be
uncorrelated. For the decisional balance CFA model, the χ2 statistic was significant
(χ2 = 1998.24, df= 349, p < .001), indicating a poor fit. The χ2 to degrees of freedom
ratio was 5.73 above the recommended 3 (Kettinger et al., 1995; Segars & Grover,
100
1993) and 5 (Wheaton et al., 1977). Additionally, the RMSEA statistic (.131)
indicated an inadequate fit. Other measures showed that the decisional balance
construct was a good fit where the indices CFI, TLI, and NFI were all above .90.
These goodness of fit measures are shown in Table 19.
Several items appeared to share error variance because the correlations
between many of them appeared to be greater than the correlations with the other
items in the construct. This seems reasonable after evaluating the content of the items.
From the pros factor, items (78, 79, and 80) concerning reducing costs, increasing
yields and increasing profits appeared to share the error variances. Additionally, the
error terms for items (81 and 82) concerning reducing chemicals and targeting
nutrients also appeared to be correlated. The two items (84 and 89) both address the
benefit of obtaining detail information from the fields. Two items (90 and 91) relate to
reducing farm labor and managing labor farm labor. Also, items, 78 and 90, relate to
reducing costs and reducing labor. Since reducing labor obviously will reduce cost,
these two items also shared the error variance associated with these two items.
Of the cons indicator variables, several appeared to share error variances. Items
93 and 105 both relate to the expensive of the precision agriculture tools. Item 93
states, “Precision agriculture tools are expensive”, and item 105 states, “Precision
agriculture tools are expensive to keep up-to-date.” Items 94 and 95 relate to skills and
training needed to be able to use precision agriculture tools.” Additionally, item 96
relates to data that are difficult to interpret and item 94 relates to skills that the
participant does not have. Items 102 and 103 relate to the precision agriculture tools
101
are difficult to use. Specifically, item 102 relates to the difficulty of integrating
precision agriculture into traditional farming. Also, 104 is an item indicating the
difficulty of keeping abreast of new precision agriculture technologies. Item 101
relates to the time consideration of precision agriculture and item 102 relates to that
the difficulty of integrating precision agriculture into traditional farming.
Figure 5 shows the modified CFA model of the decisional balance construct.
The χ2 statistic was significant (χ2 = 1128.50, df = 333, p < .001) for the modified
CFA model of the decisional balance construct indicating a poor fit. However, a
significant χ2 is not uncommon because χ2 is very sensitive to sample size (Browne &
Mels, 1992). Although the χ2 was significant, the χ2 to degrees of freedom ratio (3.39)
was under the recommended benchmark of 5 (Wheaton et al., 1977), but over the
recommended benchmark of 3 (Kettinger et al., 1995; Segars & Grover, 1993). The
RMSEA statistic (.096) also indicated an acceptable fit. CFI and TLI were over .90,
indicating an adequate fit. However, the NFI estimate was slightly under the .90
benchmark. These goodness of fit measures for the original CFA model and the
modified CFA model of the decisional balance are shown in Table 19.
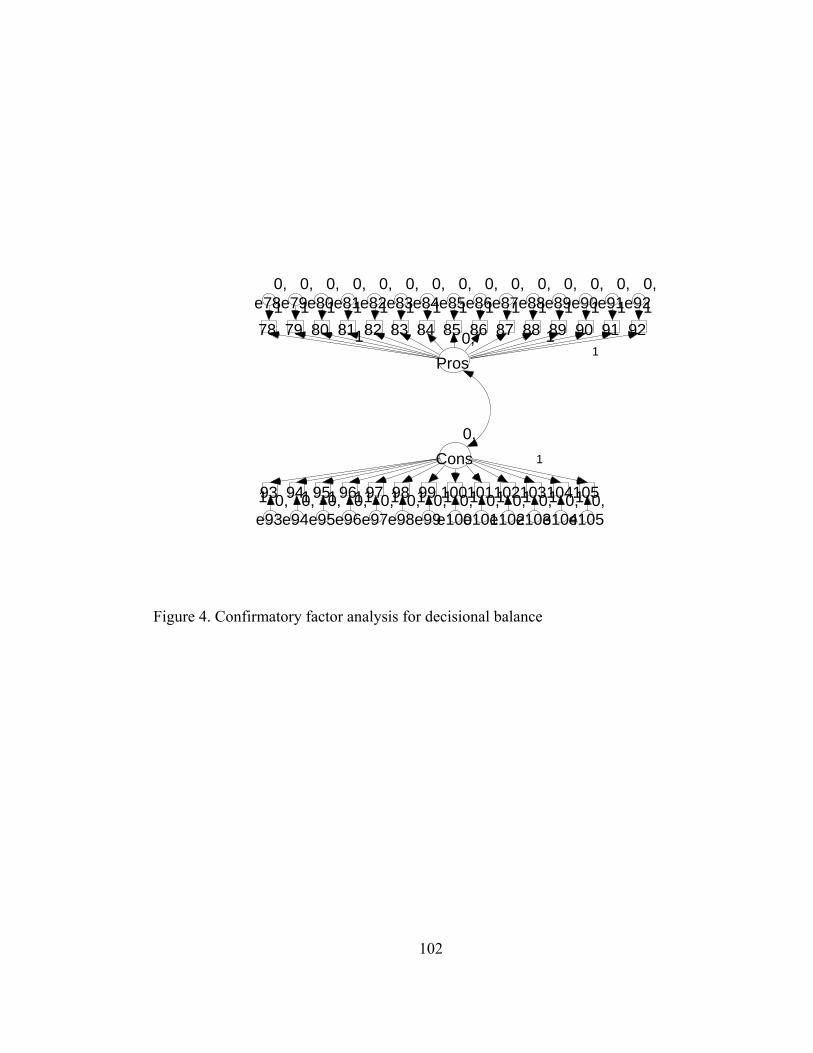
102
Figure 4. Confirmatory factor analysis for decisional balance
0,Pros
78
0, e78
1
1 79
0, e79 1
80
0,e801
81
0,e811
82
0,e821
83
0,e831
84
0,e841
85
0,e851
86
0,e861
87
0,e871
88
0,e881
89
0, e89 1
90
0, e90 1
91
0, e91 1
92
0,e92
1
1
0,Cons
105 0, e105
104 0, e104
1030,e103
1020,e102
1010,e101
1000,e100
990,e99
980,e98
970,e97
960,e96
950,e95
94 0, e94
93 0, e93
1
1 11111111111 1
1
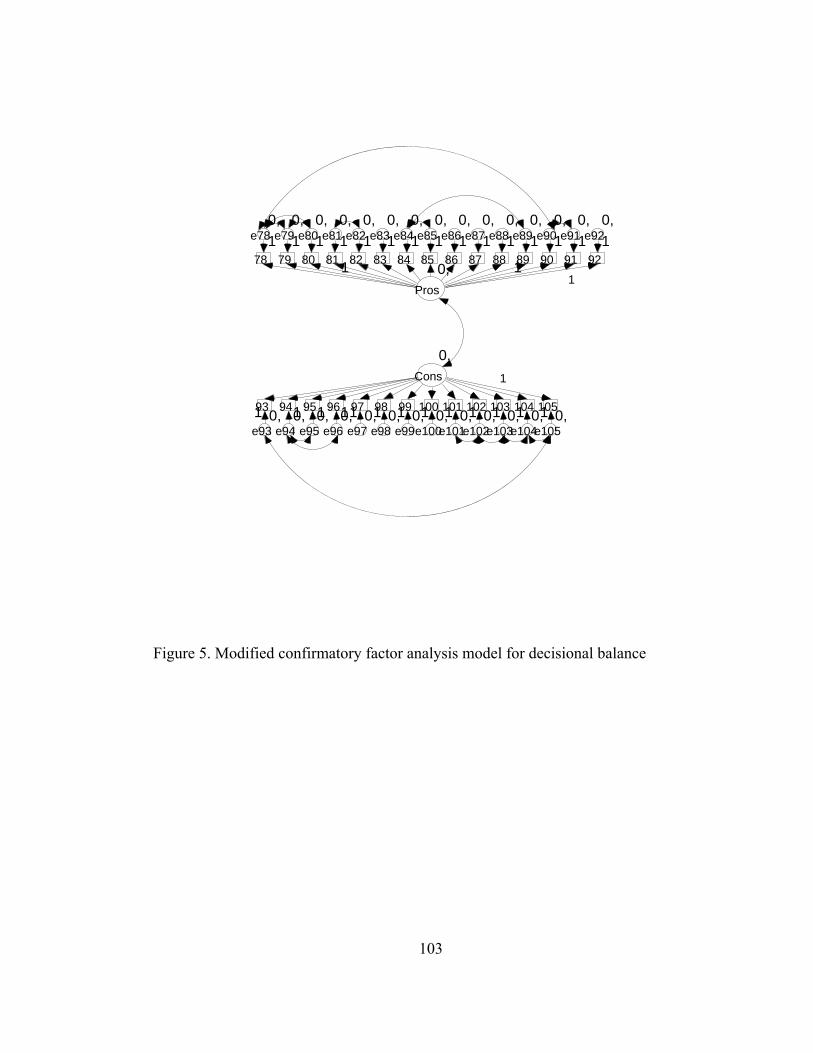
103
Figure 5. Modified confirmatory factor analysis model for decisional balance
0,Pros
78
0, e78
1
1 79
0, e79 1
80
0,e80 1
81
0,e811
82
0,e821
83
0,e831
84
0,e841
85
0,e851
86
0,e861
87
0,e871
88
0,e881
89
0,e891
90
0,e901
91
0, e91 1
92
0, e92
1
1
0,Cons
1050,
e105
1040,
e104
1030,
e103
1020,
e102
1010,
e101
1000,
e100
990,
e99
980,
e98
970,
e97
960,
e96
95 0,
e95 94
0, e94
93 0,
e93
1
11111111111 1 1
1
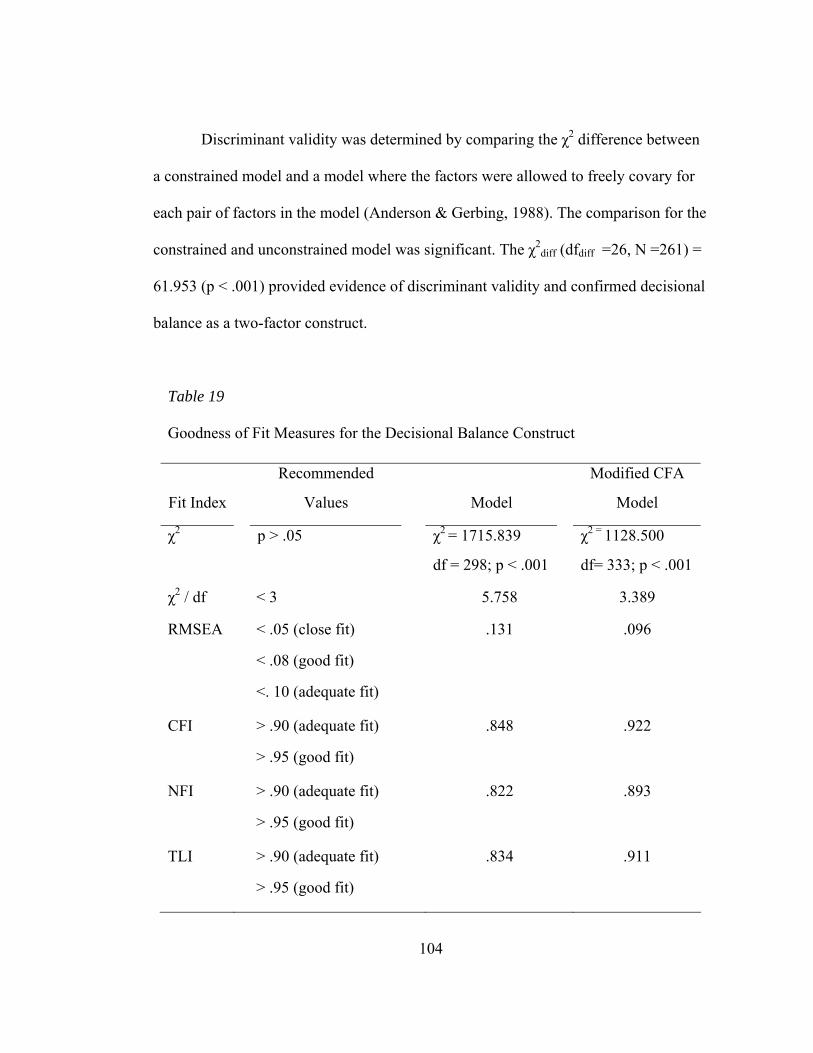
104
Discriminant validity was determined by comparing the χ2 difference between
a constrained model and a model where the factors were allowed to freely covary for
each pair of factors in the model (Anderson & Gerbing, 1988). The comparison for the
constrained and unconstrained model was significant. The χ2diff (dfdiff =26, N =261) =
61.953 (p < .001) provided evidence of discriminant validity and confirmed decisional
balance as a two-factor construct.
Table 19
Goodness of Fit Measures for the Decisional Balance Construct
Fit Index
Recommended
Values Model
Modified CFA
Model
χ2 p > .05 χ2 = 1715.839
df = 298; p < .001
χ2 = 1128.500
df= 333; p < .001
χ2 / df < 3 5.758 3.389
RMSEA < .05 (close fit)
< .08 (good fit)
<. 10 (adequate fit)
.131 .096
CFI > .90 (adequate fit)
> .95 (good fit)
.848 .922
NFI > .90 (adequate fit)
> .95 (good fit)
.822 .893
TLI > .90 (adequate fit)
> .95 (good fit)
.834 .911
105
The standardized regression weights for the pros scale were above .75 and
significant (p < .001), confirming convergent validity. The loadings for the cons
subscale were above .74 and were significant (p <.001), confirming convergent
validity. The Cronbach alphas of these two scales were very high which is expected
because the large number of items within each scale (Hinkin, 1995). The pros subscale
had 15 items and the cons subscale had 13 items. The mean, standard deviations,
standardized regression weights, and critical ratio for each of these items are presented
in Table 20.
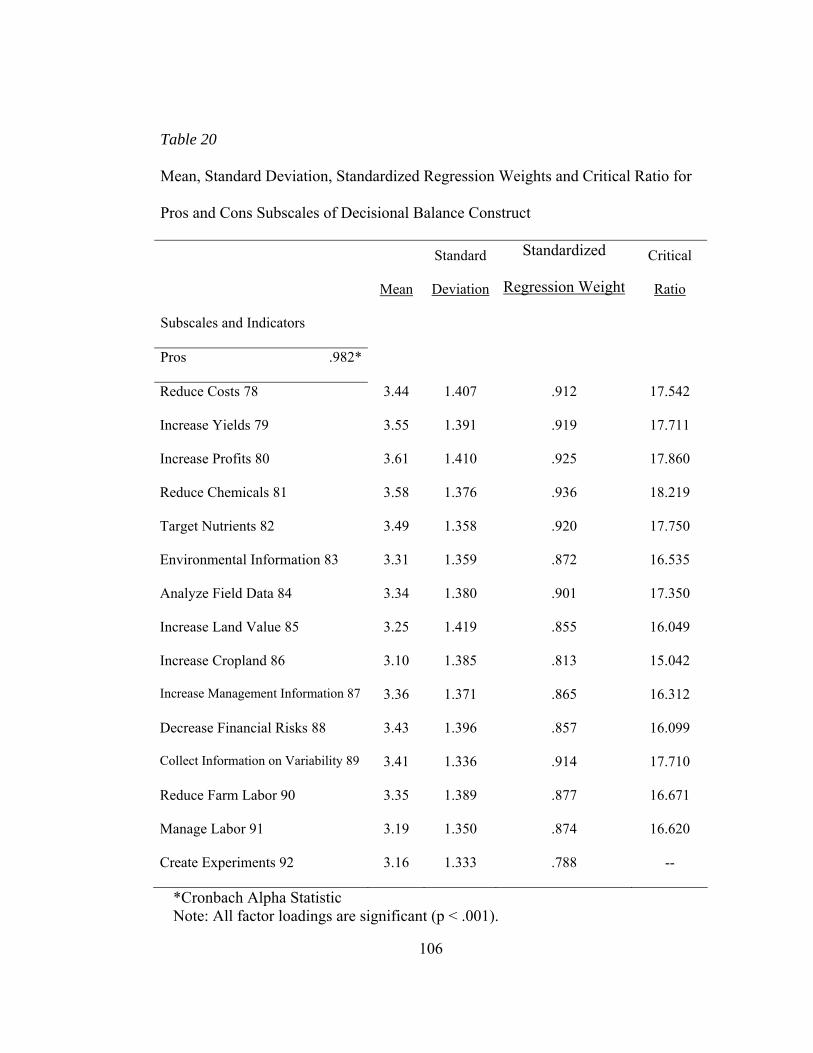
106
Table 20
Mean, Standard Deviation, Standardized Regression Weights and Critical Ratio for
Pros and Cons Subscales of Decisional Balance Construct
Mean
Standard
Deviation
Standardized
Regression Weight
Critical
Ratio
Subscales and Indicators
Pros .982*
Reduce Costs 78 3.44 1.407 .912 17.542
Increase Yields 79 3.55 1.391 .919 17.711
Increase Profits 80 3.61 1.410 .925 17.860
Reduce Chemicals 81 3.58 1.376 .936 18.219
Target Nutrients 82 3.49 1.358 .920 17.750
Environmental Information 83 3.31 1.359 .872 16.535
Analyze Field Data 84 3.34 1.380 .901 17.350
Increase Land Value 85 3.25 1.419 .855 16.049
Increase Cropland 86 3.10 1.385 .813 15.042
Increase Management Information 87 3.36 1.371 .865 16.312
Decrease Financial Risks 88 3.43 1.396 .857 16.099
Collect Information on Variability 89 3.41 1.336 .914 17.710
Reduce Farm Labor 90 3.35 1.389 .877 16.671
Manage Labor 91 3.19 1.350 .874 16.620
Create Experiments 92 3.16 1.333 .788 --
*Cronbach Alpha Statistic Note: All factor loadings are significant (p < .001).
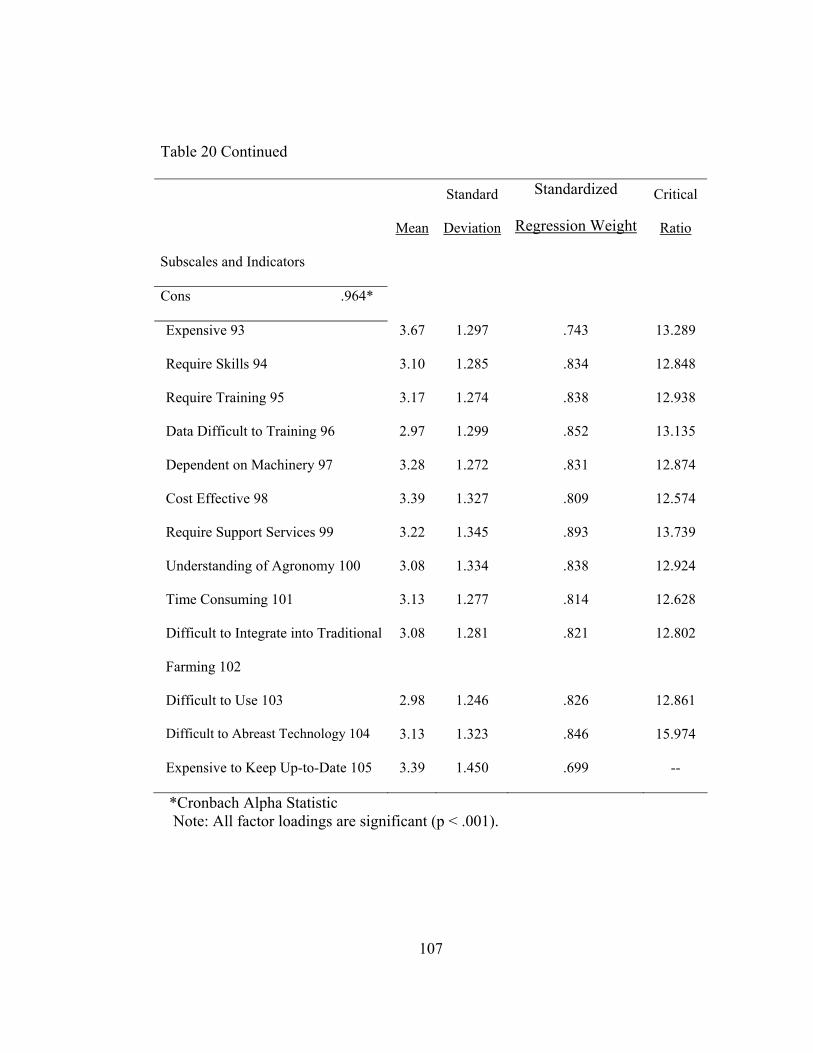
107
Table 20 Continued
Mean
Standard
Deviation
Standardized
Regression Weight
Critical
Ratio
Subscales and Indicators
Cons .964*
Expensive 93 3.67 1.297 .743 13.289
Require Skills 94 3.10 1.285 .834 12.848
Require Training 95 3.17 1.274 .838 12.938
Data Difficult to Training 96 2.97 1.299 .852 13.135
Dependent on Machinery 97 3.28 1.272 .831 12.874
Cost Effective 98 3.39 1.327 .809 12.574
Require Support Services 99 3.22 1.345 .893 13.739
Understanding of Agronomy 100 3.08 1.334 .838 12.924
Time Consuming 101 3.13 1.277 .814 12.628
Difficult to Integrate into Traditional
Farming 102
3.08 1.281 .821 12.802
Difficult to Use 103 2.98 1.246 .826 12.861
Difficult to Abreast Technology 104 3.13 1.323 .846 15.974
Expensive to Keep Up-to-Date 105 3.39 1.450 .699 --
*Cronbach Alpha Statistic Note: All factor loadings are significant (p < .001).
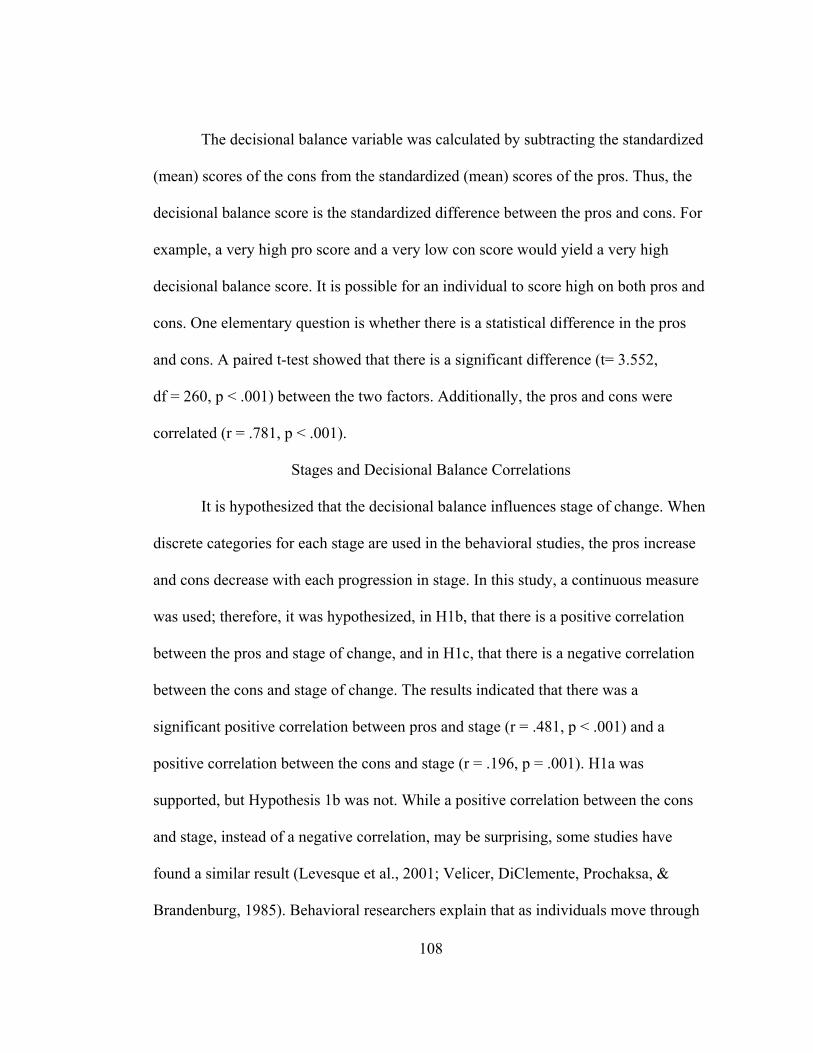
108
The decisional balance variable was calculated by subtracting the standardized
(mean) scores of the cons from the standardized (mean) scores of the pros. Thus, the
decisional balance score is the standardized difference between the pros and cons. For
example, a very high pro score and a very low con score would yield a very high
decisional balance score. It is possible for an individual to score high on both pros and
cons. One elementary question is whether there is a statistical difference in the pros
and cons. A paired t-test showed that there is a significant difference (t= 3.552,
df = 260, p < .001) between the two factors. Additionally, the pros and cons were
correlated (r = .781, p < .001).
Stages and Decisional Balance Correlations
It is hypothesized that the decisional balance influences stage of change. When
discrete categories for each stage are used in the behavioral studies, the pros increase
and cons decrease with each progression in stage. In this study, a continuous measure
was used; therefore, it was hypothesized, in H1b, that there is a positive correlation
between the pros and stage of change, and in H1c, that there is a negative correlation
between the cons and stage of change. The results indicated that there was a
significant positive correlation between pros and stage (r = .481, p < .001) and a
positive correlation between the cons and stage (r = .196, p = .001). H1a was
supported, but Hypothesis 1b was not. While a positive correlation between the cons
and stage, instead of a negative correlation, may be surprising, some studies have
found a similar result (Levesque et al., 2001; Velicer, DiClemente, Prochaksa, &
Brandenburg, 1985). Behavioral researchers explain that as individuals move through
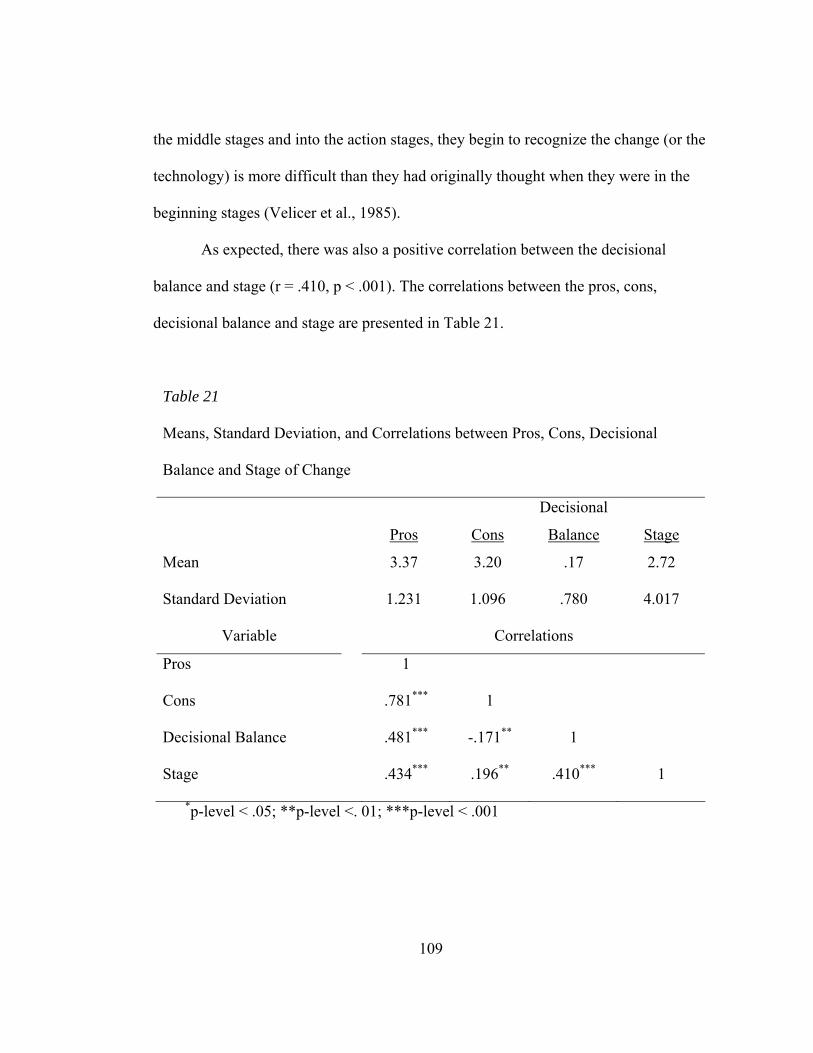
109
the middle stages and into the action stages, they begin to recognize the change (or the
technology) is more difficult than they had originally thought when they were in the
beginning stages (Velicer et al., 1985).
As expected, there was also a positive correlation between the decisional
balance and stage (r = .410, p < .001). The correlations between the pros, cons,
decisional balance and stage are presented in Table 21.
*p-level < .05; **p-level <. 01; ***p-level < .001
Table 21
Means, Standard Deviation, and Correlations between Pros, Cons, Decisional
Balance and Stage of Change
Pros Cons
Decisional
Balance Stage
Mean 3.37 3.20 .17 2.72
Standard Deviation 1.231 1.096 .780 4.017
Variable Correlations
Pros 1
Cons .781*** 1
Decisional Balance .481*** -.171** 1
Stage .434*** .196** .410*** 1
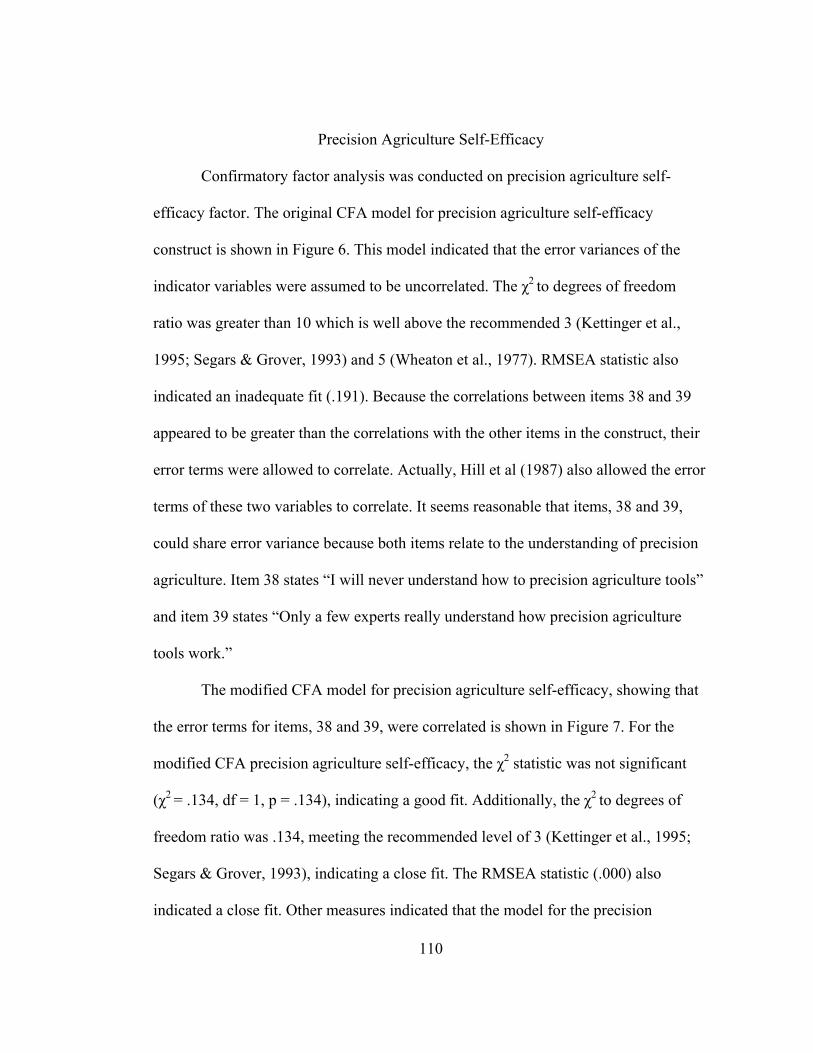
110
Precision Agriculture Self-Efficacy
Confirmatory factor analysis was conducted on precision agriculture self-
efficacy factor. The original CFA model for precision agriculture self-efficacy
construct is shown in Figure 6. This model indicated that the error variances of the
indicator variables were assumed to be uncorrelated. The χ2 to degrees of freedom
ratio was greater than 10 which is well above the recommended 3 (Kettinger et al.,
1995; Segars & Grover, 1993) and 5 (Wheaton et al., 1977). RMSEA statistic also
indicated an inadequate fit (.191). Because the correlations between items 38 and 39
appeared to be greater than the correlations with the other items in the construct, their
error terms were allowed to correlate. Actually, Hill et al (1987) also allowed the error
terms of these two variables to correlate. It seems reasonable that items, 38 and 39,
could share error variance because both items relate to the understanding of precision
agriculture. Item 38 states “I will never understand how to precision agriculture tools”
and item 39 states “Only a few experts really understand how precision agriculture
tools work.”
The modified CFA model for precision agriculture self-efficacy, showing that
the error terms for items, 38 and 39, were correlated is shown in Figure 7. For the
modified CFA precision agriculture self-efficacy, the χ2 statistic was not significant
(χ2 = .134, df = 1, p = .134), indicating a good fit. Additionally, the χ2 to degrees of
freedom ratio was .134, meeting the recommended level of 3 (Kettinger et al., 1995;
Segars & Grover, 1993), indicating a close fit. The RMSEA statistic (.000) also
indicated a close fit. Other measures indicated that the model for the precision

111
agriculture self-efficacy was a good fit. These goodness of fit measures for the original
CFA model and the modified CFA model for the precision agriculture self-efficacy
construct are shown in Table 22.
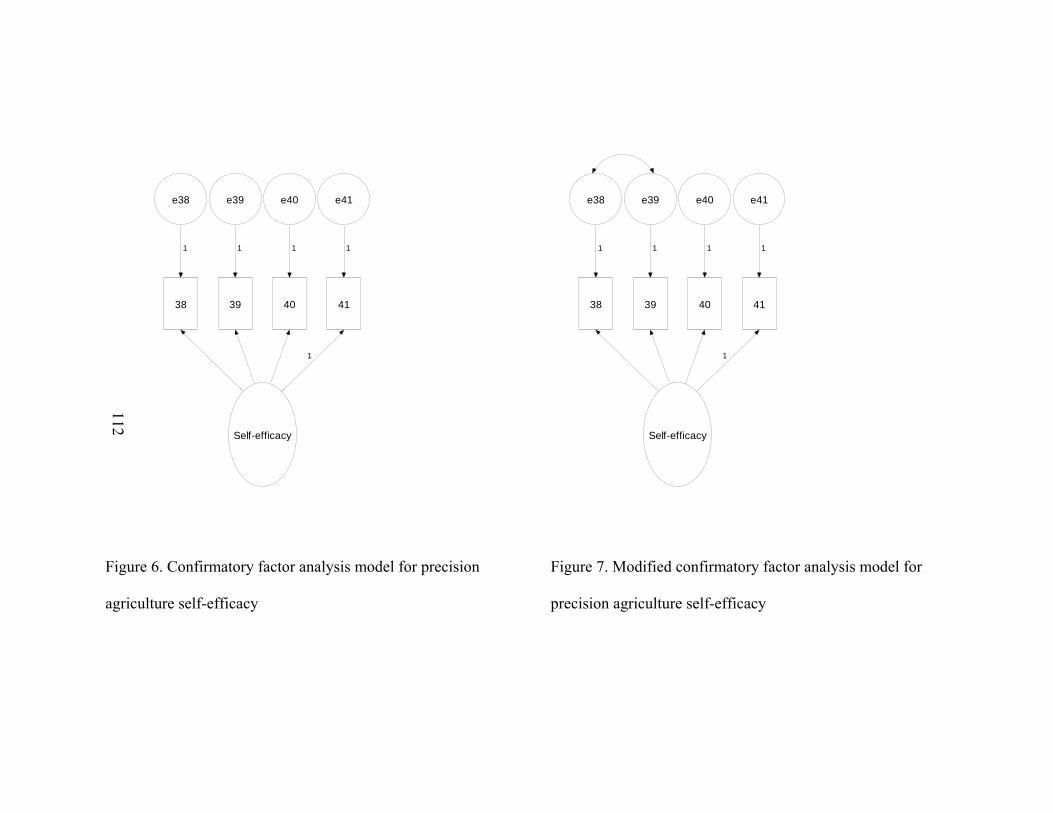
112
Figure 6. Confirmatory factor analysis model for precision
agriculture self-efficacy
Figure 7. Modified confirmatory factor analysis model for
precision agriculture self-efficacy
Self-efficacy
38
e38
1
39
e39
1
40
e40
1
41
e41
1
1
Self-efficacy
38
e38
1
39
e39
1
40
e40
1
41
e41
1
1
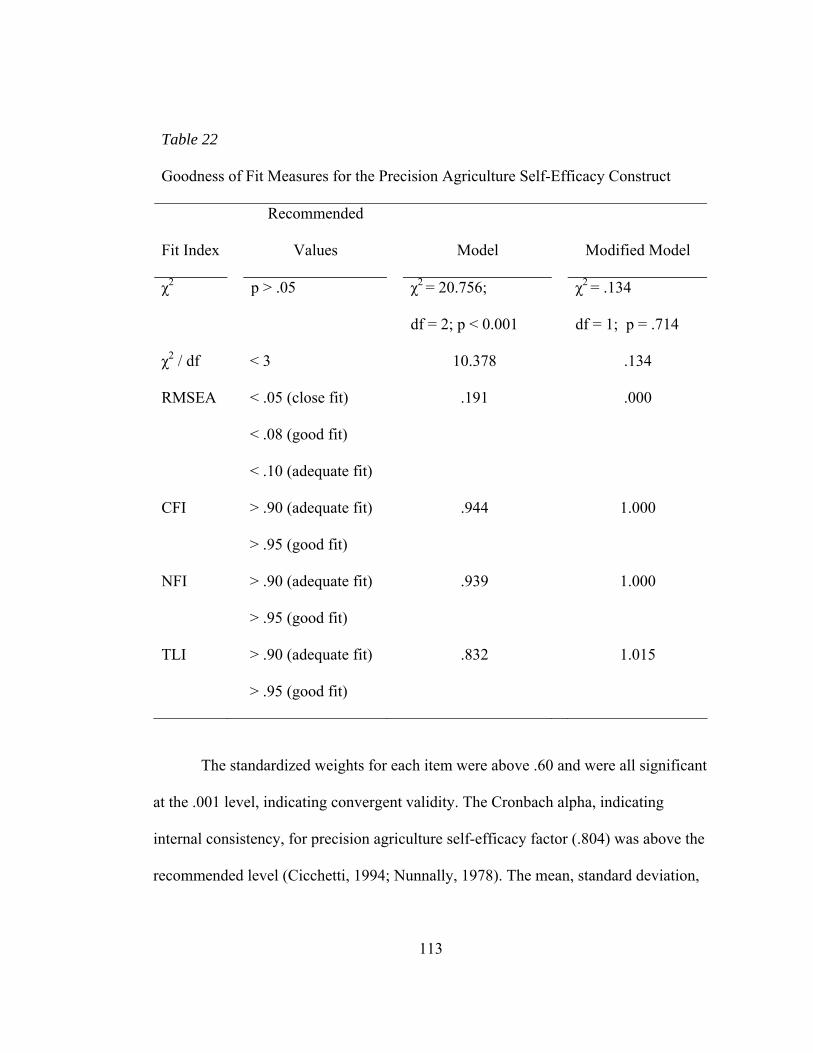
113
Table 22
Goodness of Fit Measures for the Precision Agriculture Self-Efficacy Construct
Fit Index
Recommended
Values Model Modified Model
χ2 p > .05 χ2 = 20.756;
df = 2; p < 0.001
χ2 = .134
df = 1; p = .714
χ2 / df < 3 10.378 .134
RMSEA < .05 (close fit)
< .08 (good fit)
< .10 (adequate fit)
.191 .000
CFI > .90 (adequate fit)
> .95 (good fit)
.944 1.000
NFI > .90 (adequate fit)
> .95 (good fit)
.939 1.000
TLI > .90 (adequate fit)
> .95 (good fit)
.832 1.015
The standardized weights for each item were above .60 and were all significant
at the .001 level, indicating convergent validity. The Cronbach alpha, indicating
internal consistency, for precision agriculture self-efficacy factor (.804) was above the
recommended level (Cicchetti, 1994; Nunnally, 1978). The mean, standard deviation,
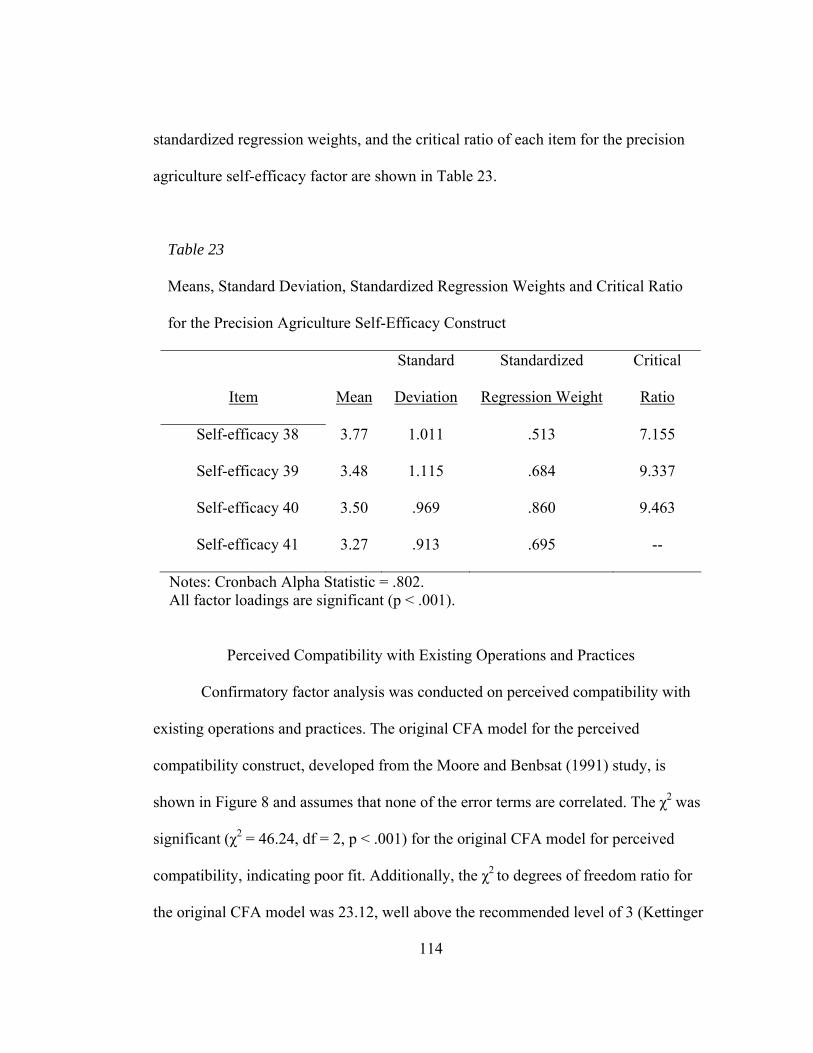
114
standardized regression weights, and the critical ratio of each item for the precision
agriculture self-efficacy factor are shown in Table 23.
Table 23
Means, Standard Deviation, Standardized Regression Weights and Critical Ratio
for the Precision Agriculture Self-Efficacy Construct
Item Mean
Standard
Deviation
Standardized
Regression Weight
Critical
Ratio
Self-efficacy 38 3.77 1.011 .513 7.155
Self-efficacy 39 3.48 1.115 .684 9.337
Self-efficacy 40 3.50 .969 .860 9.463
Self-efficacy 41 3.27 .913 .695 --
Notes: Cronbach Alpha Statistic = .802. All factor loadings are significant (p < .001).
Perceived Compatibility with Existing Operations and Practices
Confirmatory factor analysis was conducted on perceived compatibility with
existing operations and practices. The original CFA model for the perceived
compatibility construct, developed from the Moore and Benbsat (1991) study, is
shown in Figure 8 and assumes that none of the error terms are correlated. The χ2 was
significant (χ2 = 46.24, df = 2, p < .001) for the original CFA model for perceived
compatibility, indicating poor fit. Additionally, the χ2 to degrees of freedom ratio for
the original CFA model was 23.12, well above the recommended level of 3 (Kettinger
115
et al., 1995; Segars & Grover, 1993) and 5 (Wheaton et al., 1977). The RMSEA
statistic also indicated an inadequate fit (.185).
Because the correlations between items 42 and 43 appeared to be greater than
the correlations with the other items in the construct, their error variances were
allowed to correlate. Item 42 states “Precision agriculture is compatible with all
aspects of my farm operation,” and item 43 states “Precision agriculture is completely
compatible with my current farming situation.” It seems reasonable that these items
could share in the error variance because both items relate to the farming operation
and situation.
In the modified CFA model for the perceived compatibility, the two error
terms associated with these two items were allowed to be correlated. Figure 9 shows
the modified model. The χ2 statistic was not significant (χ2 = .280, df = 1, p = .596) for
the modified model which indicated good fit. The ratio χ2 to degrees of freedom ratio
for the modified CFA model was .280, meeting the recommended level of 3 (Kettinger
et al., 1995; Segars & Grover, 1993). Other measures indicated that the modified
model for the perceived compatibility was a good fit, as well. These goodness of fit
measures for the original CFA model and the modified CFA model for the perceived
compatibility construct are shown in Table 24.
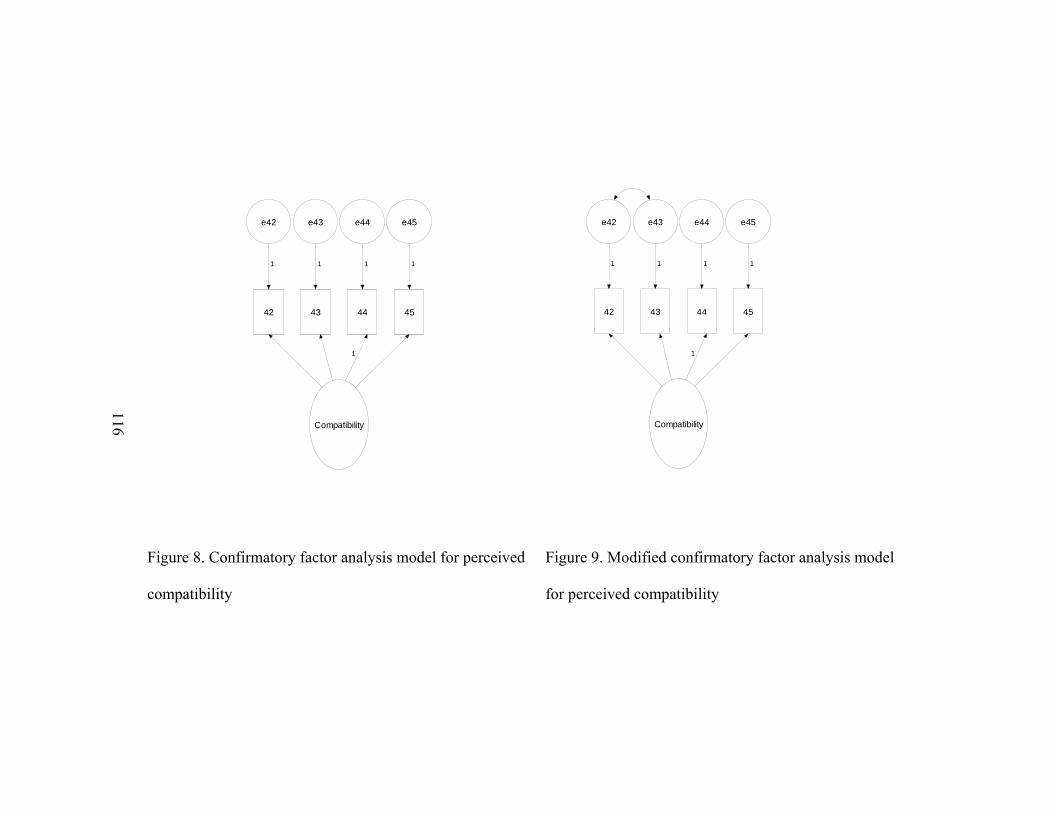
116 Compatibility
42
e42
1
43
e43
1
44
e44
1
45
e45
1
1
Compatibility
42
e42
1
43
e43
1
44
e44
1
45
e45
1
1
Figure 8. Confirmatory factor analysis model for perceived
compatibility
Figure 9. Modified confirmatory factor analysis model
for perceived compatibility
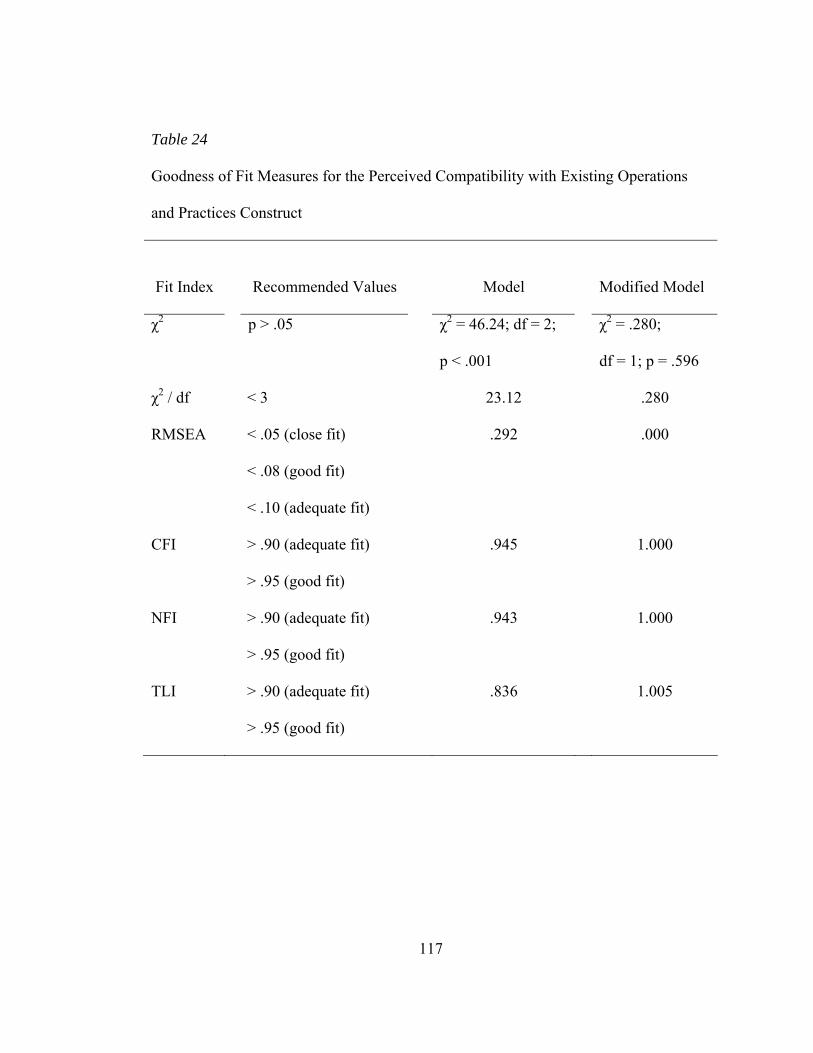
117
Table 24
Goodness of Fit Measures for the Perceived Compatibility with Existing Operations
and Practices Construct
Fit Index Recommended Values
Model Modified Model
χ2 p > .05 χ2 = 46.24; df = 2;
p < .001
χ2 = .280;
df = 1; p = .596
χ2 / df < 3 23.12 .280
RMSEA < .05 (close fit)
< .08 (good fit)
< .10 (adequate fit)
.292 .000
CFI > .90 (adequate fit)
> .95 (good fit)
.945
1.000
NFI > .90 (adequate fit)
> .95 (good fit)
.943
1.000
TLI > .90 (adequate fit)
> .95 (good fit)
.836 1.005
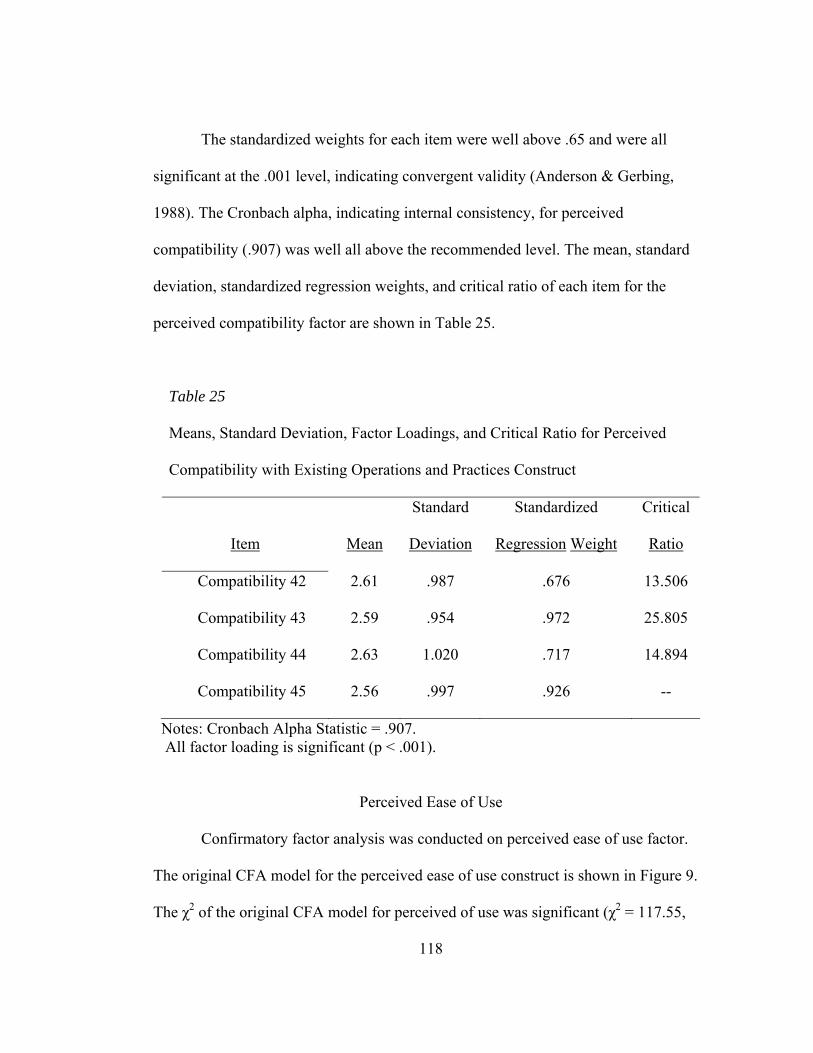
118
The standardized weights for each item were well above .65 and were all
significant at the .001 level, indicating convergent validity (Anderson & Gerbing,
1988). The Cronbach alpha, indicating internal consistency, for perceived
compatibility (.907) was well all above the recommended level. The mean, standard
deviation, standardized regression weights, and critical ratio of each item for the
perceived compatibility factor are shown in Table 25.
Table 25
Means, Standard Deviation, Factor Loadings, and Critical Ratio for Perceived
Compatibility with Existing Operations and Practices Construct
Item Mean
Standard
Deviation
Standardized
Regression Weight
Critical
Ratio
Compatibility 42 2.61 .987 .676 13.506
Compatibility 43 2.59 .954 .972 25.805
Compatibility 44 2.63 1.020 .717 14.894
Compatibility 45 2.56 .997 .926 --
Notes: Cronbach Alpha Statistic = .907. All factor loading is significant (p < .001).
Perceived Ease of Use
Confirmatory factor analysis was conducted on perceived ease of use factor.
The original CFA model for the perceived ease of use construct is shown in Figure 9.
The χ2 of the original CFA model for perceived of use was significant (χ2 = 117.55,
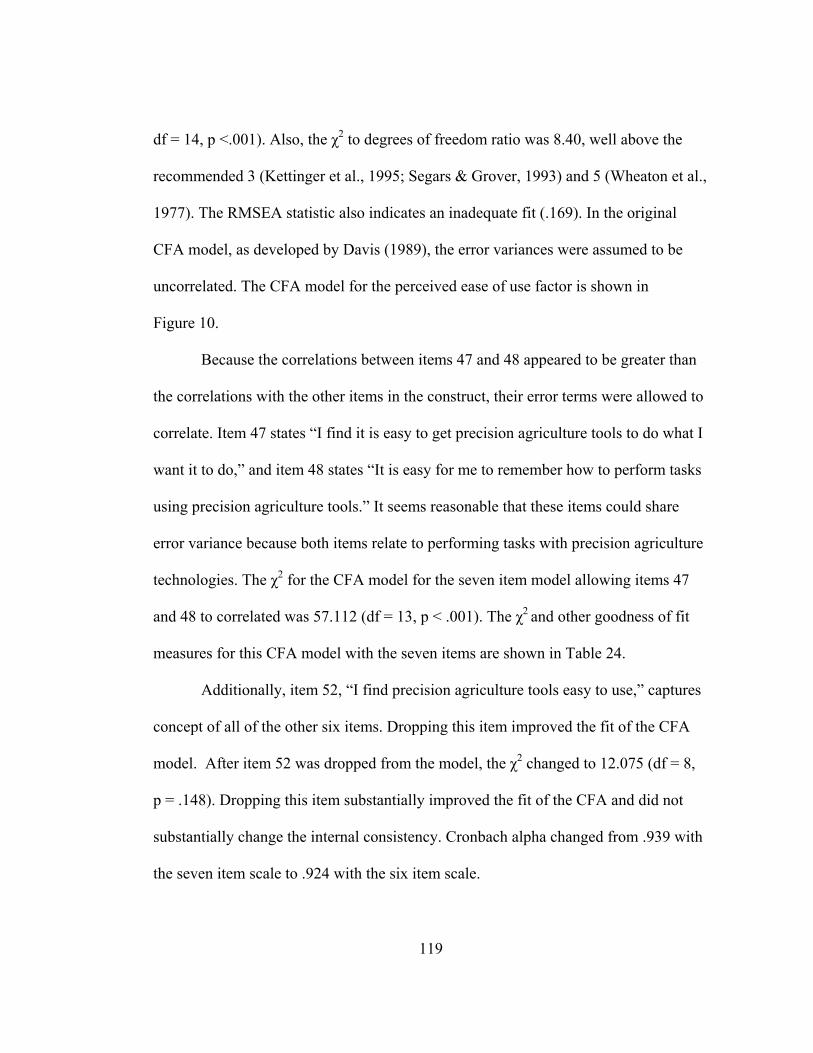
119
df = 14, p <.001). Also, the χ2 to degrees of freedom ratio was 8.40, well above the
recommended 3 (Kettinger et al., 1995; Segars & Grover, 1993) and 5 (Wheaton et al.,
1977). The RMSEA statistic also indicates an inadequate fit (.169). In the original
CFA model, as developed by Davis (1989), the error variances were assumed to be
uncorrelated. The CFA model for the perceived ease of use factor is shown in
Figure 10.
Because the correlations between items 47 and 48 appeared to be greater than
the correlations with the other items in the construct, their error terms were allowed to
correlate. Item 47 states “I find it is easy to get precision agriculture tools to do what I
want it to do,” and item 48 states “It is easy for me to remember how to perform tasks
using precision agriculture tools.” It seems reasonable that these items could share
error variance because both items relate to performing tasks with precision agriculture
technologies. The χ2 for the CFA model for the seven item model allowing items 47
and 48 to correlated was 57.112 (df = 13, p < .001). The χ2 and other goodness of fit
measures for this CFA model with the seven items are shown in Table 24.
Additionally, item 52, “I find precision agriculture tools easy to use,” captures
concept of all of the other six items. Dropping this item improved the fit of the CFA
model. After item 52 was dropped from the model, the χ2 changed to 12.075 (df = 8,
p = .148). Dropping this item substantially improved the fit of the CFA and did not
substantially change the internal consistency. Cronbach alpha changed from .939 with
the seven item scale to .924 with the six item scale.
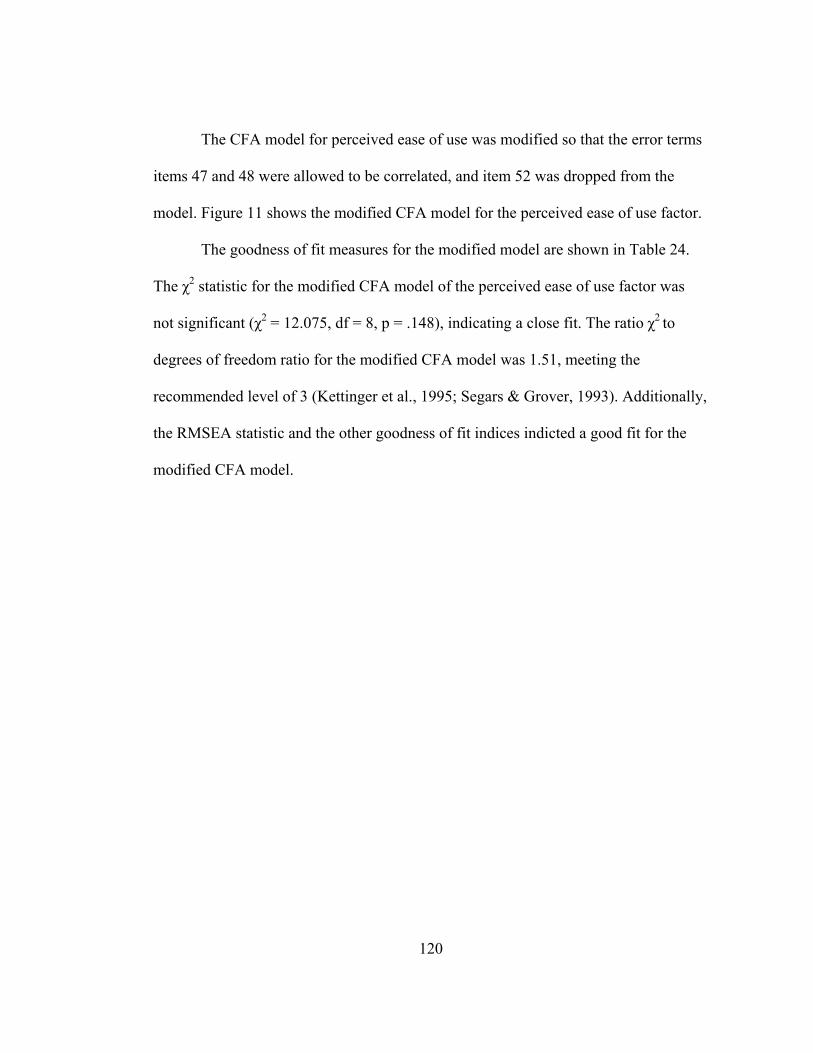
120
The CFA model for perceived ease of use was modified so that the error terms
items 47 and 48 were allowed to be correlated, and item 52 was dropped from the
model. Figure 11 shows the modified CFA model for the perceived ease of use factor.
The goodness of fit measures for the modified model are shown in Table 24.
The χ2 statistic for the modified CFA model of the perceived ease of use factor was
not significant (χ2 = 12.075, df = 8, p = .148), indicating a close fit. The ratio χ2 to
degrees of freedom ratio for the modified CFA model was 1.51, meeting the
recommended level of 3 (Kettinger et al., 1995; Segars & Grover, 1993). Additionally,
the RMSEA statistic and the other goodness of fit indices indicted a good fit for the
modified CFA model.
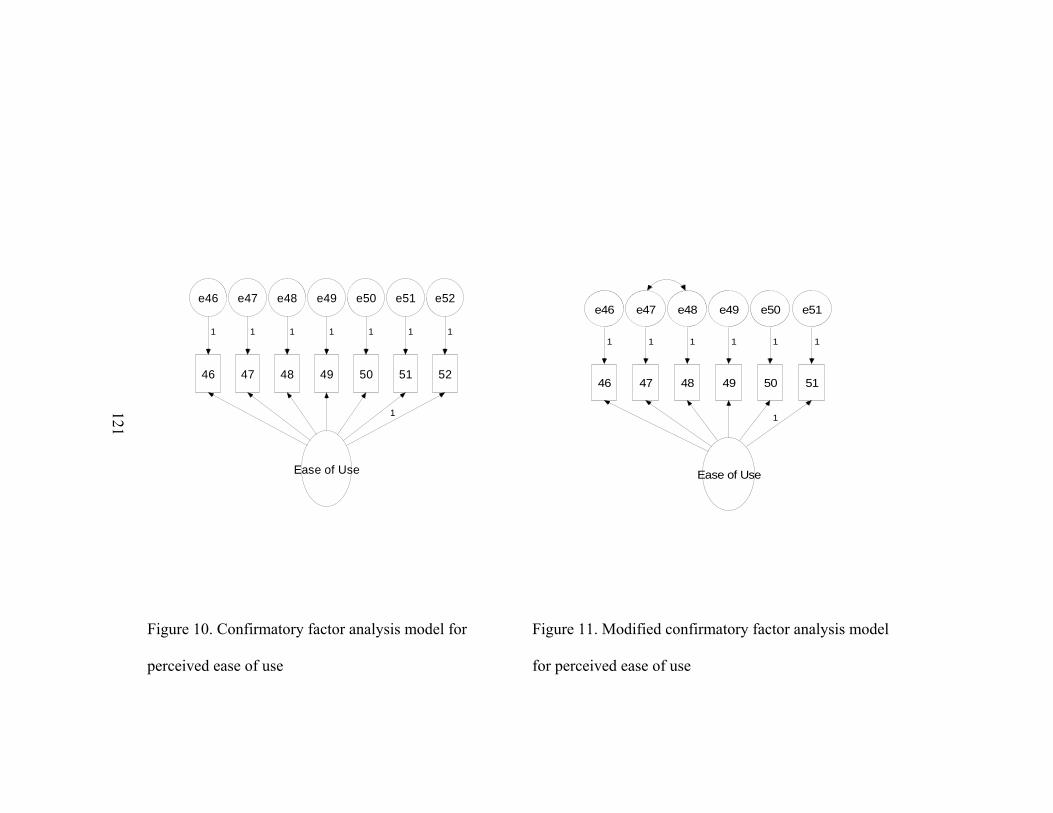
121
Ease of Use
46
e46
1
47
e47
1
48
e48
1
49
e49
1
50
e50
1
51
e51
1
52
e52
1
1
Ease of Use
46
e46
1
47
e47
1
48
e48
1
49
e49
1
50
e50
1
51
e51
1
1
Figure 10. Confirmatory factor analysis model for
perceived ease of use
Figure 11. Modified confirmatory factor analysis model
for perceived ease of use
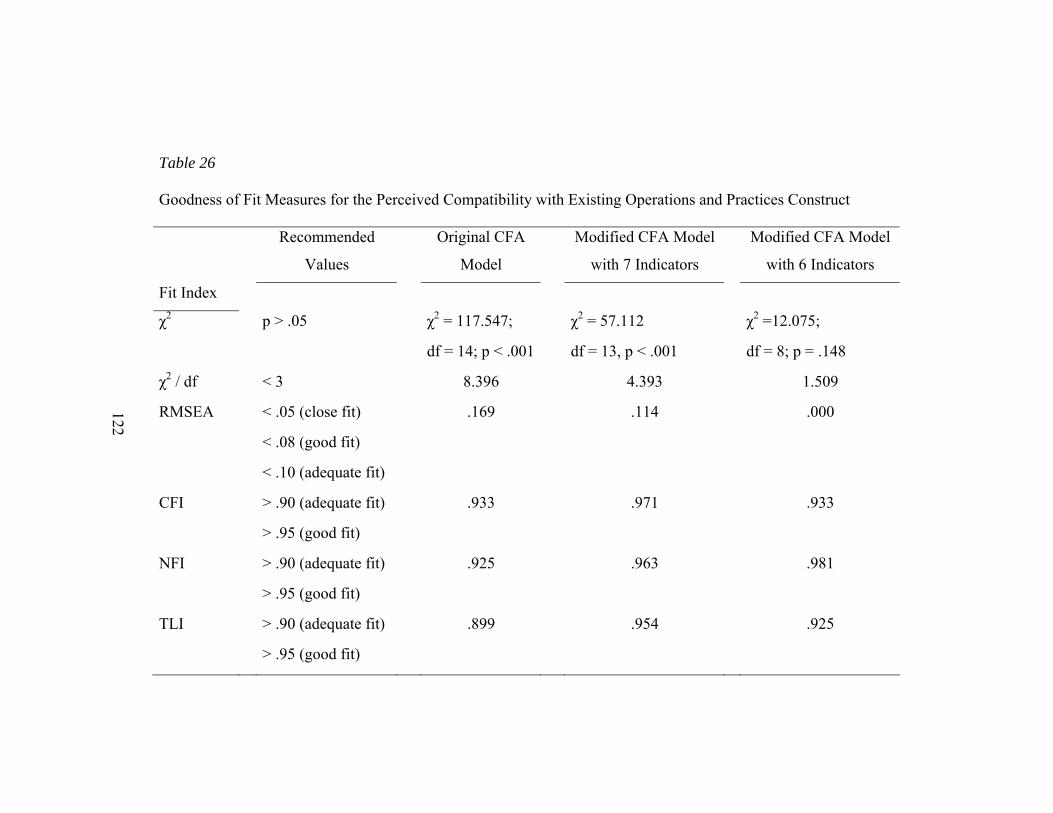
122
Table 26
Goodness of Fit Measures for the Perceived Compatibility with Existing Operations and Practices Construct
Recommended
Values
Original CFA
Model
Modified CFA Model
with 7 Indicators
Modified CFA Model
with 6 Indicators
Fit Index
χ2 p > .05 χ2 = 117.547;
df = 14; p < .001
χ2 = 57.112
df = 13, p < .001
χ2 =12.075;
df = 8; p = .148
χ2 / df < 3 8.396 4.393 1.509
RMSEA < .05 (close fit)
< .08 (good fit)
< .10 (adequate fit)
.169 .114 .000
CFI > .90 (adequate fit)
> .95 (good fit)
.933 .971 .933
NFI > .90 (adequate fit)
> .95 (good fit)
.925 .963 .981
TLI > .90 (adequate fit)
> .95 (good fit)
.899 .954 .925

123
The standardized weights for each item were well above .70 and were all
significant at the .001 level, indicating convergent validity. The Cronbach alpha,
indicating internal consistency, for perceived ease of use (.924) was well all above the
recommended level. The mean, standard deviation, standardized regression weights
and critical ratio for each item for the perceived ease of use factor are shown in Table
27.
Table 27
Means, Standard Deviation, Factor Loadings, and Critical Ratio for Perceived
Ease of Use Construct
Items Mean
Standard
Deviation
Standardized
Regression Weights
Critical
Ratio
Ease of Use 46 2.91 .932 .808 15.579
Ease of Use 47 2.69 .855 .716 13.067
Ease of Use 48 2.76 .911 .734 13.531
Ease of Use 49 2.78 .924 .864 17.291
Ease of Use 50 2.79 .840 .894 18.237
Ease of Use 51 2.90 .943 .837 --
Notes: Cronbach Alpha Statistic = .924. All factor loadings are significant (p < .001).
124
Path Analysis Using Structural Equation Modeling
The hypothesized research model was evaluated using AMOS which
simultaneously estimates the model, including latent and observed variables,
exogenous and endogenous variables, and the paths to these variables. The overall fit
of the model was examined. The relative strength and significance of the individual
paths was also evaluated.
This model describes the mediating effects of precision agriculture self-
efficacy, perceived ease of use, compatibility, communication behaviors, and
decisional balance on precision agriculture stage of change. Several goodness of fit
measures were used to analyze the structural model to verify its ability to fit the data.
These measures were χ2 statistic, χ2 to degrees of freedom ratio, RMSEA, CFI, NFI,
and TLI. After the model was examined for fitting the data adequately, the model and
the hypotheses were tested by analyzing the significance of the paths. Additionally,
the standardized weights, as a relative strength of the paths, and the explanatory power
were examined.
Goodness of Fit
The hypothesized model with the indicator variables shown is given in
Figure 12. The goodness of fit measures are shown in Table 28. The χ2 statistic was
significant (χ2 = 315.136; df = 160; p < .001) for the hypothesized model which
indicated a poor fit. However, a significant χ2 is not uncommon because χ2 is very
sensitive to sample size (Browne & Mels, 1992). Although the χ2 was significant, the
125
χ2 to degrees of freedom ratio was 1.97, under the recommended benchmark of 3
(Kettinger et al., 1995; Segars & Grover, 1993) , indicating an adequate fit.
Another measure of a good fit is the RMSEA. A value of zero indicates a
perfect fit, .05 or less indicates a close fit, less than of .08 indicates an adequate fit,
and .10 or greater is not acceptable (Browne & Cudeck, 1993). The RMSEA statistic
of the model was .061, indicating an adequate fit.
Three goodness of fit indices were also used. These indices range from zero to
one, with values exceeding .90 indicating an adequate fit and values exceeding .95
indicating a good fit (Hu & Bentler, 1999). CFI and TLI resulted in values greater than
.94, thus indicating an adequate fit. NFI was close to the .90 benchmark with a value
of .894. These goodness of fit measures, shown in Table 28, provided support for the
hypothesized model.
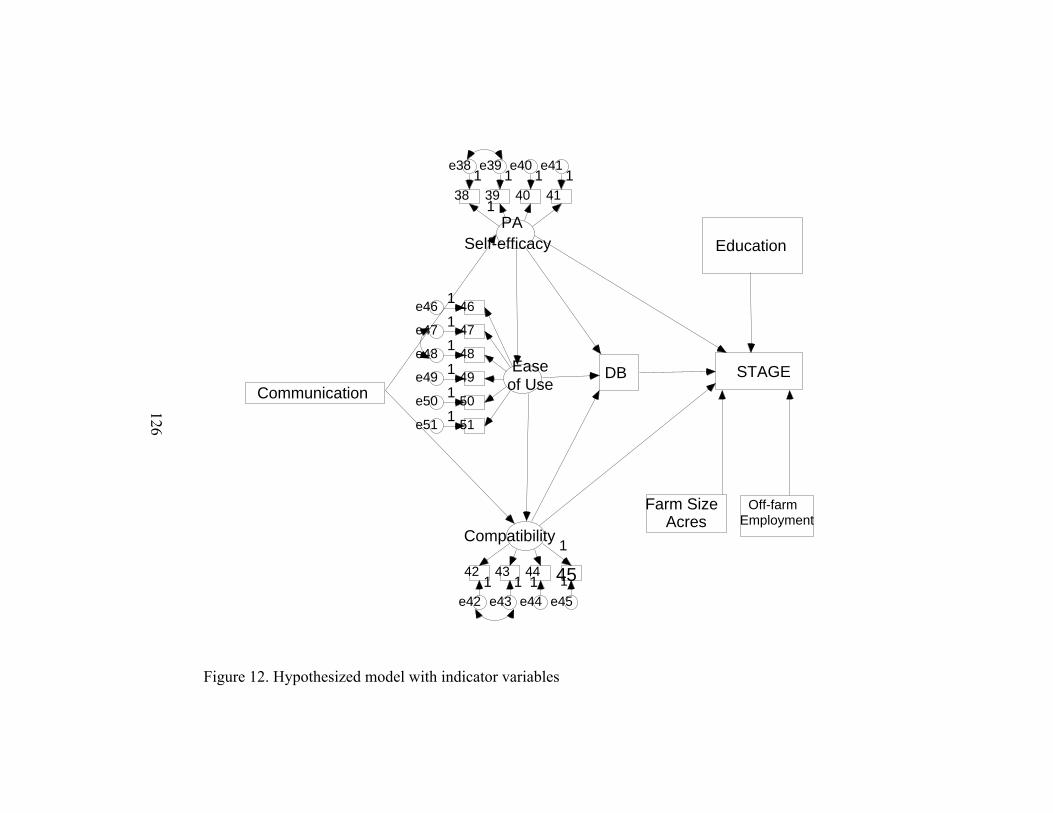
126
Figure 12. Hypothesized model with indicator variables
PASelf-efficacy
38
e38
1
139
e391
40
e401
41
e411
Ease of Use
51e51
50e50
49e49
111
Compatibility
45e45
44
e44
43
e43
42
e42
1
1111
48e48 147e47 146e46 1
Communication STAGE
Off-farm Employment
Farm SizeAcres
Education
DB
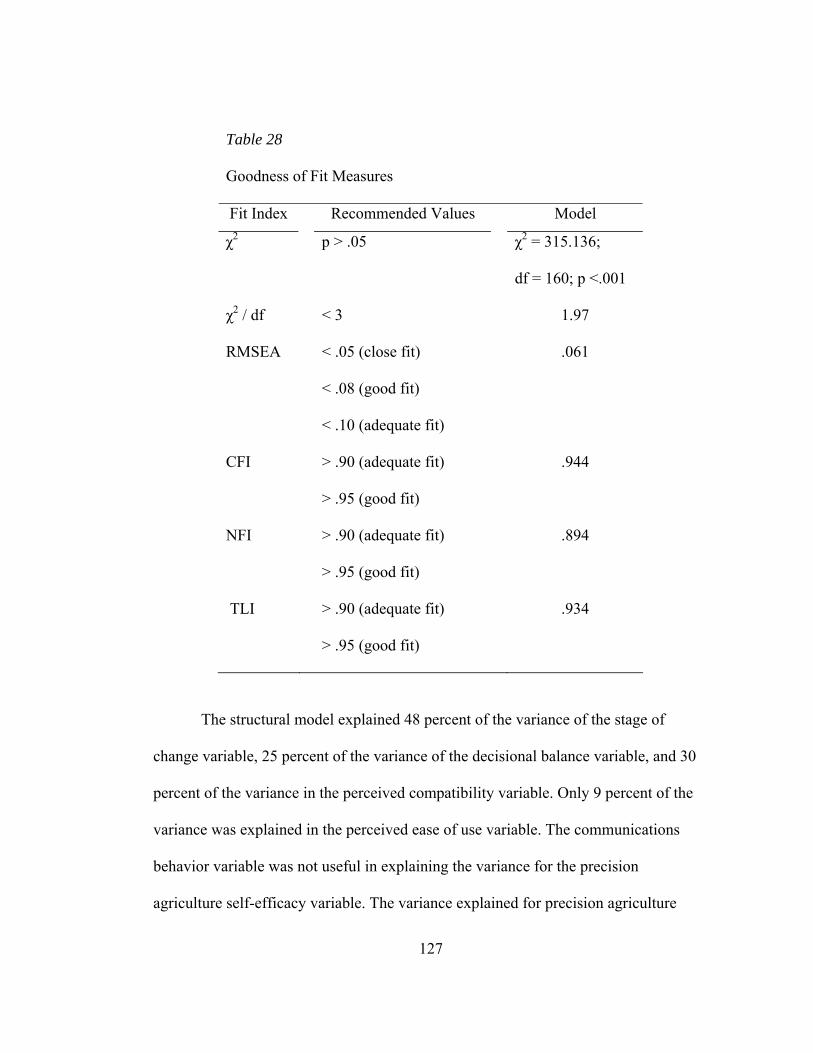
127
Table 28
Goodness of Fit Measures
Fit Index Recommended Values Model
χ2 p > .05 χ2 = 315.136;
df = 160; p <.001
χ2 / df < 3 1.97
RMSEA < .05 (close fit)
< .08 (good fit)
< .10 (adequate fit)
.061
CFI > .90 (adequate fit)
> .95 (good fit)
.944
NFI > .90 (adequate fit)
> .95 (good fit)
.894
TLI > .90 (adequate fit)
> .95 (good fit)
.934
The structural model explained 48 percent of the variance of the stage of
change variable, 25 percent of the variance of the decisional balance variable, and 30
percent of the variance in the perceived compatibility variable. Only 9 percent of the
variance was explained in the perceived ease of use variable. The communications
behavior variable was not useful in explaining the variance for the precision
agriculture self-efficacy variable. The variance explained for precision agriculture
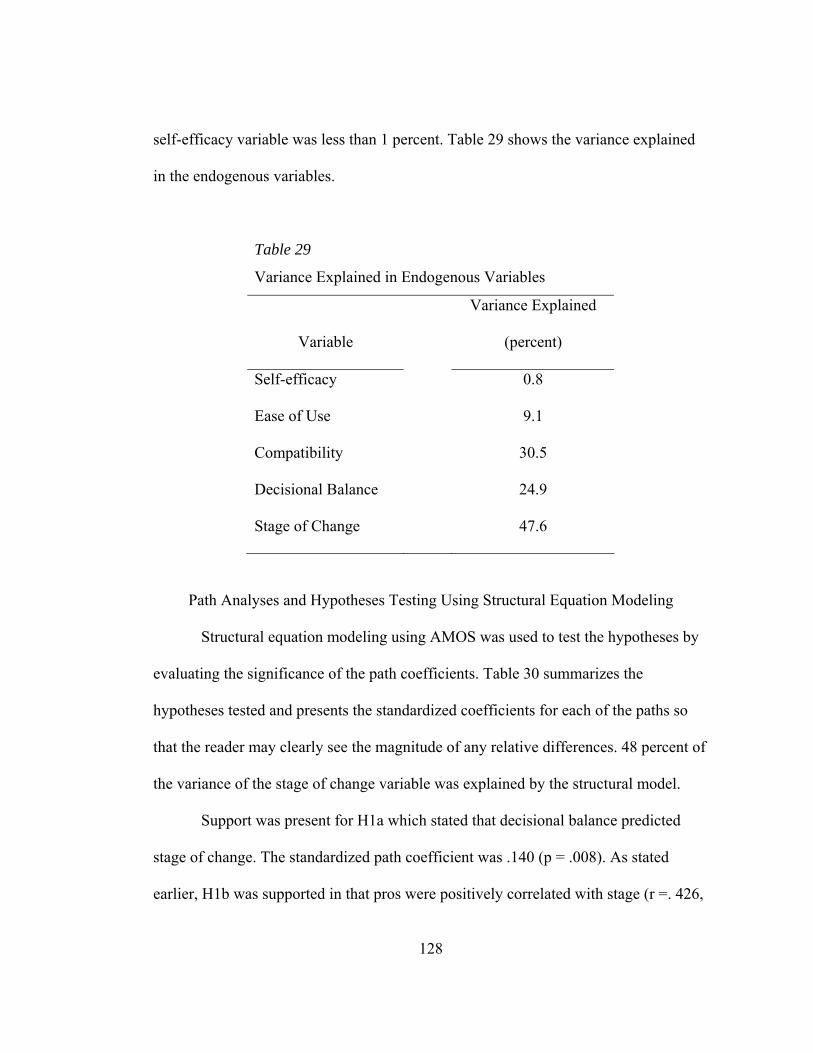
128
self-efficacy variable was less than 1 percent. Table 29 shows the variance explained
in the endogenous variables.
Table 29
Variance Explained in Endogenous Variables
Variable
Variance Explained
(percent)
Self-efficacy 0.8
Ease of Use 9.1
Compatibility 30.5
Decisional Balance 24.9
Stage of Change 47.6
Path Analyses and Hypotheses Testing Using Structural Equation Modeling
Structural equation modeling using AMOS was used to test the hypotheses by
evaluating the significance of the path coefficients. Table 30 summarizes the
hypotheses tested and presents the standardized coefficients for each of the paths so
that the reader may clearly see the magnitude of any relative differences. 48 percent of
the variance of the stage of change variable was explained by the structural model.
Support was present for H1a which stated that decisional balance predicted
stage of change. The standardized path coefficient was .140 (p = .008). As stated
earlier, H1b was supported in that pros were positively correlated with stage (r =. 426,
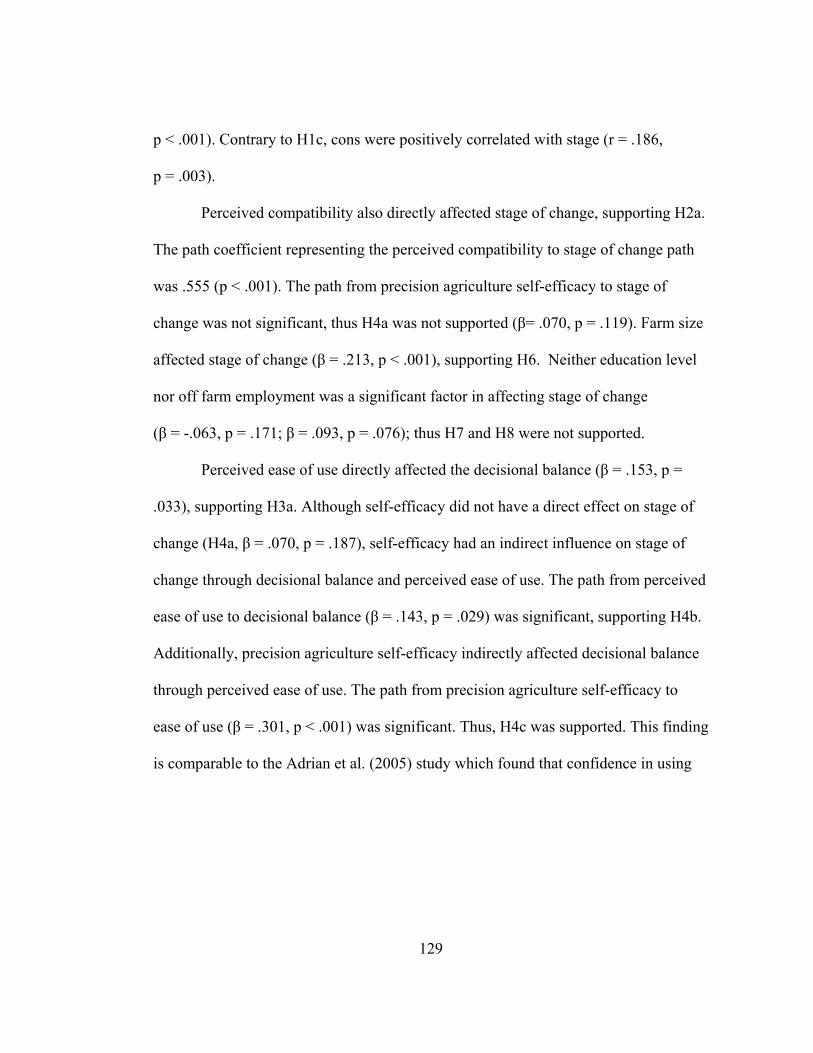
129
p < .001). Contrary to H1c, cons were positively correlated with stage (r = .186,
p = .003).
Perceived compatibility also directly affected stage of change, supporting H2a.
The path coefficient representing the perceived compatibility to stage of change path
was .555 (p < .001). The path from precision agriculture self-efficacy to stage of
change was not significant, thus H4a was not supported (β= .070, p = .119). Farm size
affected stage of change (β = .213, p < .001), supporting H6. Neither education level
nor off farm employment was a significant factor in affecting stage of change
(β = -.063, p = .171; β = .093, p = .076); thus H7 and H8 were not supported.
Perceived ease of use directly affected the decisional balance (β = .153, p =
.033), supporting H3a. Although self-efficacy did not have a direct effect on stage of
change (H4a, β = .070, p = .187), self-efficacy had an indirect influence on stage of
change through decisional balance and perceived ease of use. The path from perceived
ease of use to decisional balance (β = .143, p = .029) was significant, supporting H4b.
Additionally, precision agriculture self-efficacy indirectly affected decisional balance
through perceived ease of use. The path from precision agriculture self-efficacy to
ease of use (β = .301, p < .001) was significant. Thus, H4c was supported. This finding
is comparable to the Adrian et al. (2005) study which found that confidence in using
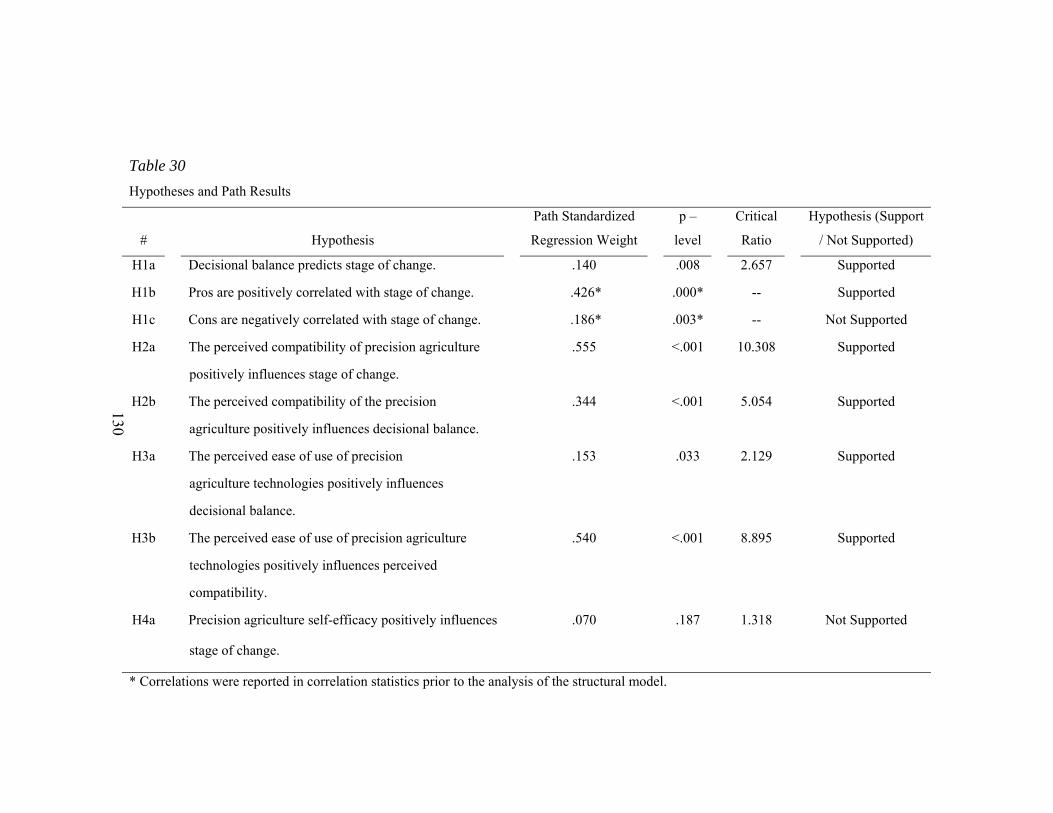
130
Table 30
Hypotheses and Path Results
# Hypothesis
Path Standardized
Regression Weight
p –
level
Critical
Ratio
Hypothesis (Support
/ Not Supported)
H1a Decisional balance predicts stage of change. .140 .008 2.657 Supported
H1b Pros are positively correlated with stage of change. .426* .000* -- Supported
H1c Cons are negatively correlated with stage of change. .186* .003* -- Not Supported
H2a The perceived compatibility of precision agriculture
positively influences stage of change.
.555
<.001 10.308 Supported
H2b The perceived compatibility of the precision
agriculture positively influences decisional balance.
.344 <.001 5.054 Supported
H3a The perceived ease of use of precision
agriculture technologies positively influences
decisional balance.
.153 .033 2.129 Supported
H3b The perceived ease of use of precision agriculture
technologies positively influences perceived
compatibility.
.540 <.001 8.895 Supported
H4a Precision agriculture self-efficacy positively influences
stage of change.
.070 .187 1.318 Not Supported
* Correlations were reported in correlation statistics prior to the analysis of the structural model.
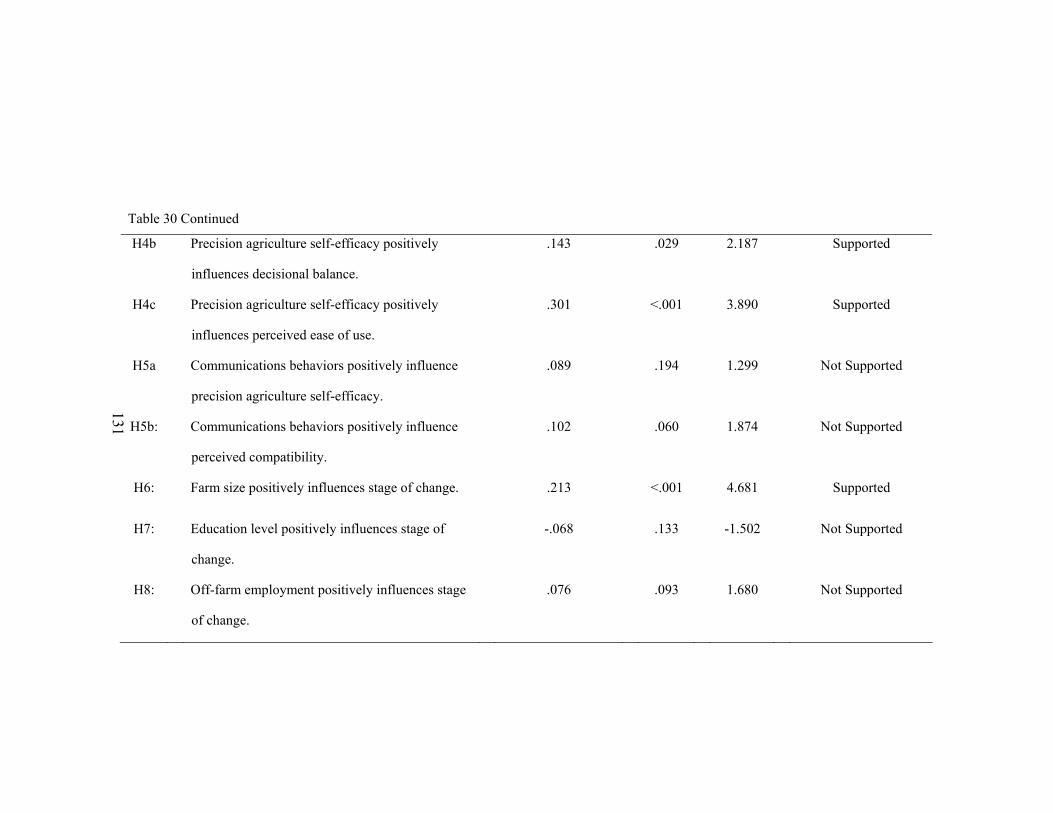
131
Table 30 Continued
H4b Precision agriculture self-efficacy positively
influences decisional balance.
.143 .029 2.187 Supported
H4c Precision agriculture self-efficacy positively
influences perceived ease of use.
.301 <.001 3.890 Supported
H5a Communications behaviors positively influence
precision agriculture self-efficacy. .089 .194 1.299 Not Supported
H5b: Communications behaviors positively influence
perceived compatibility.
.102 .060 1.874 Not Supported
H6: Farm size positively influences stage of change. .213 <.001 4.681 Supported
H7: Education level positively influences stage of
change.
-.068 .133 -1.502 Not Supported
H8: Off-farm employment positively influences stage
of change.
.076 .093 1.680 Not Supported
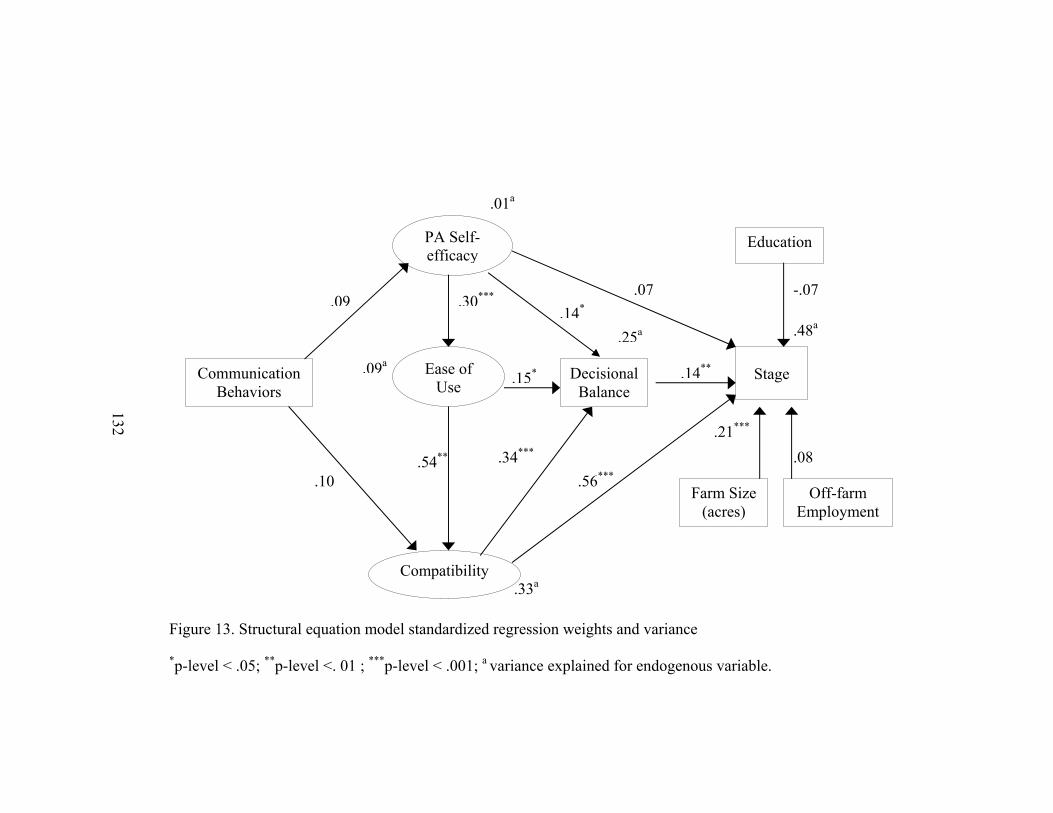
132
Figure 13. Structural equation model standardized regression weights and variance
*p-level < .05; **p-level <. 01 ; ***p-level < .001; a variance explained for endogenous variable.
.14**
.34*** .56***
.07
.54**
.30***.09
.10
-.07
.08 .21***
PA Self-efficacy
Ease of Use
Compatibility
Communication Behaviors
Decisional Balance
Stage
Off-farm Employment
Farm Size (acres)
Education
.09a
.33a
.01a
.48a .25a.14*
.15*
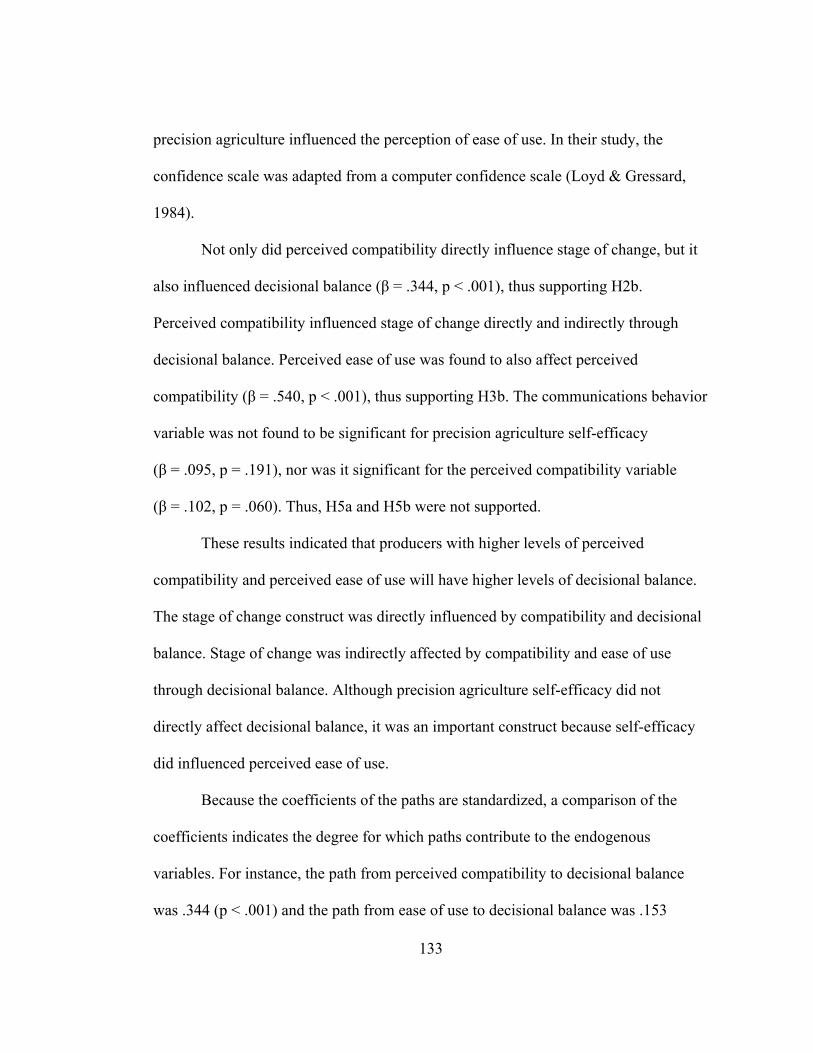
133
precision agriculture influenced the perception of ease of use. In their study, the
confidence scale was adapted from a computer confidence scale (Loyd & Gressard,
1984).
Not only did perceived compatibility directly influence stage of change, but it
also influenced decisional balance (β = .344, p < .001), thus supporting H2b.
Perceived compatibility influenced stage of change directly and indirectly through
decisional balance. Perceived ease of use was found to also affect perceived
compatibility (β = .540, p < .001), thus supporting H3b. The communications behavior
variable was not found to be significant for precision agriculture self-efficacy
(β = .095, p = .191), nor was it significant for the perceived compatibility variable
(β = .102, p = .060). Thus, H5a and H5b were not supported.
These results indicated that producers with higher levels of perceived
compatibility and perceived ease of use will have higher levels of decisional balance.
The stage of change construct was directly influenced by compatibility and decisional
balance. Stage of change was indirectly affected by compatibility and ease of use
through decisional balance. Although precision agriculture self-efficacy did not
directly affect decisional balance, it was an important construct because self-efficacy
did influenced perceived ease of use.
Because the coefficients of the paths are standardized, a comparison of the
coefficients indicates the degree for which paths contribute to the endogenous
variables. For instance, the path from perceived compatibility to decisional balance
was .344 (p < .001) and the path from ease of use to decisional balance was .153
134
(p = .033), thus compatibility seemed to contribute almost twice as much to decisional
balance than perceived ease of use. Similarly, the path coefficient from compatibility
to stage of change .555 (p < .001) was more than twice of the path coefficient from
farm size to stage of change (β = .213, p < .001). This result indicated that perceived
compatibility may be more important to the stage of change than farm size, although
both were important contributing factors.
Summary
The purpose of this research is to create a model that describes, explains, and
predicts the stage of change associated with the precision agriculture adoption-
decision process. The proposed model described in Figure 2 and the hypotheses
described in Table 1 were tested by using structural equation modeling. Decisional
balance predicted stage of change. Farm size and compatibility with operations and
style of farming also directly influenced stage of change. Factors that indirectly
affected stage of change were perceived ease of use and precision agriculture self-
efficacy.
Communications behavior, educational level, and off-farm employment did not
contribute to the model significantly. These results imply that the model was effective
in predicting stage of change and decisional balance.
135
CHAPTER 5
DISCUSSION
Very little attention has been given to the perceptions and attitudinal reasons
farmers adopt precision agriculture technologies (Adesina & Baidu-Forson, 1995;
Cochrane, 1993). By evaluating the perceptions and attitudes of farmers, researchers
and practitioners can begin to understand why farmers adopt technologies and what
industry and researchers may focus on to affect adoption of these technologies.
This research used a multidisciplinary approach to develop a model that
explained some of the factors that influence the intention to use precision agriculture
technologies. This model was derived from the Transtheoretical Model (Prochaska &
Norcross, 2001; Prochaska et al., 1988), the Technology Acceptance Model’s ease of
use subscale (Davis, 1989), Moore and Benbasat’s (1991) compatibility scale, and
Hill’s et al. (1987) self-efficacy scale. The decisional balance variable was developed
using the publicized advantages and disadvantages of the precision agriculture.
This study empirically tested how the effects of the perceived advantages and
disadvantages of precision agriculture, perceived ease of use, perceived compatibility,
and precision agriculture self-efficacy affected the stage of change associated with the
adoption of precision agriculture. Additionally, farm size, educational level, and off-
farm employment were tested for the effects on the stage of change.
136
Review of Results
Confirmatory factor analysis and structural equation modeling were used to
test the hypothesized model. The results indicated that the model fit the data
adequately. Decisional balance, compatibility, and farm size directly influenced stage
of change. Perceived ease of use, perceived compatibility, and precision agriculture
self-efficacy affected decisional balance. Precision agriculture self-efficacy affected
perceived ease of use and decisional balance and indirectly stage of change.
Communications behavior did not affect precision agriculture self-efficacy and
perceived compatibility. Educational level and off-farm employment did not influence
stage of change.
While decisional balance and farm size were influential in explaining the stage
of change, compatibility showed a very strong influence on stage of change and on
decisional balance. These results confirm the notion that individuals will accept
change if they think it is compatible with their operations and goals (Armenakis &
Harris, 2002; Chau & Hu, 2002; Moore & Benbasat, 1991; Rogers, 1995). The
standardized path coefficient for perceived compatibility to stage of change was more
than twice of the standardized path coefficient from farm size to stage. The
standardized path coefficient from perceived compatibility to stage of change was
more than three times the standardized path coefficient from decisional balance to
stage of change. This comparison indicated that cognitive perceptions of costs and
benefits and perceptions of the technologies are important in the stage of change. This
comparison verified the opinions that factors other than economic benefit are
137
important to farmers making the decision to use precision agriculture (Cochrane,
1993; Vanclay, 1992). Likewise, the factors that determine the decisional balance
were found to be perceived ease of use, perceived compatibility, and precision
agriculture self-efficacy.
Implications
The proposed stage of change model associated with the precision agriculture
expands our knowledge of precision agriculture use by examining perceptions and
attitudes toward precision agriculture tools. The results of this study are important to
test existing psychology and information systems concepts within the agricultural
industry. This research also helps us understand that factors, other than perceived
economic benefit, are important in making the decision to use precision agriculture
technologies.
Figure 14 demonstrates the effects of the attitudes and perceptions of farmers’
decisions to use precision agriculture technologies. At the beginning of the continuum
is the early stage of change. The typical farmer in the early stage of change is not
interested in adopting precision agriculture. These farmers belong to one of two
groups. One group includes those who have made a deliberate decision to not adopt,
even though they understand some of the benefits. The other group who has no
intention in adopting are those who are either not aware of the technologies or that
they have not given much consideration to adopt precision agriculture.
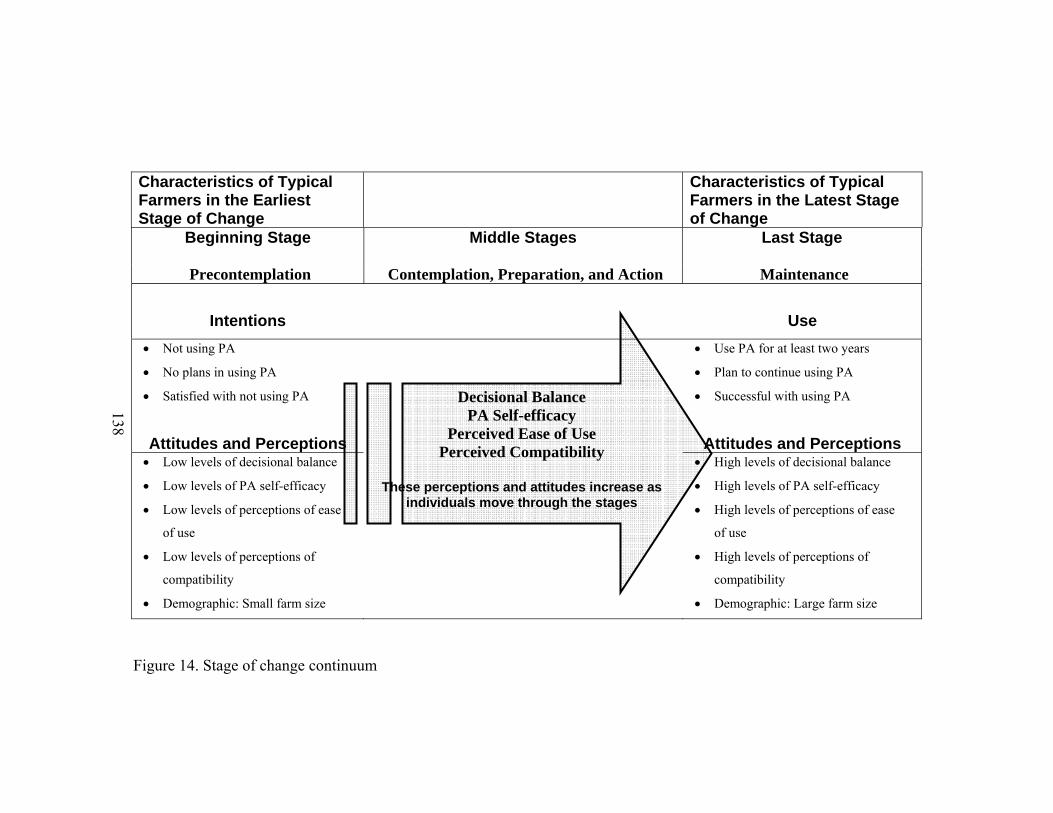
138
Characteristics of Typical Farmers in the Earliest Stage of Change
Characteristics of Typical Farmers in the Latest Stage of Change
Beginning Stage Middle Stages
Last Stage
Precontemplation Contemplation, Preparation, and Action Maintenance
Intentions
Use
• Not using PA
• No plans in using PA
• Satisfied with not using PA
• Use PA for at least two years
• Plan to continue using PA
• Successful with using PA
Attitudes and Perceptions Attitudes and Perceptions • Low levels of decisional balance
• Low levels of PA self-efficacy
• Low levels of perceptions of ease
of use
• Low levels of perceptions of
compatibility
• Demographic: Small farm size
• High levels of decisional balance
• High levels of PA self-efficacy
• High levels of perceptions of ease
of use
• High levels of perceptions of
compatibility
• Demographic: Large farm size
Figure 14. Stage of change continuum
Decisional Balance PA Self-efficacy
Perceived Ease of Use Perceived Compatibility
These perceptions and attitudes increase as
individuals move through the stages
139
As an individual moves from the earliest stage through the middle stages and
into the latest stage, each attitude increases. The pivotal decisional point is the
decisional balance construct. As farmers believe the advantages outweigh the
disadvantages of using precision agriculture, they move further along in the stages of
change.
On the end of the continuum is the maintenance stage. These farmers have
used precision agriculture for at least two years and plan to continue. These farmers
typically perceive the precision agriculture as easy to use and compatible with their
operations and practices. They also have confidence in their abilities to use precision
agriculture technologies. They weigh the importance of advantages greater than the
disadvantages, in terms of importance. They will also manage large farms.
The stage of change model can be used as a basis to study the adoption of other
technological advancements. This study used established constructs adapted to the
precision agriculture context to analyze the relationship between perceptions and
attitudes and the intention to use precision agricultural tools.
Limitations
The results and contributions of this study should be evaluated by considering
the limitations of the study. One limitation of this study is that the generalizability of
the results is limited to row crop farmers in Alabama. Because of differences in
production practices among agricultural producers, generalizing these results should
be limited to row crop farmers in the southeastern United States with farms over 50
acres.
140
Another limitation is that the study is a cross-sectional study. This study did
not examine whether intention actually predicts precision agriculture use. For those
farmers who intend to use precision agriculture within the next two years, a
longitudinal study could validate intention and use. Furthermore, this study used only
self-report measures. Correlating actual use and stage of change measures over a
particular time period could strengthen the study and our understanding of the
behavior and intention of potential precision agriculture adopters.
No economic measures were used to indicate that precision agriculture actually
improves the economic status of the farm. Linking economic benefit to actual use was
beyond the scope of this study. However, correlating the perceptions of precision
agriculture, stage of change, actual use, and economic improvement over a time period
could expand researchers’ and practitioners’ understanding of use and benefit of these
technologies.
Contributing to the decisional balance is the perception that precision
agriculture is compatible with the farming operations and practices. The perception of
compatibility is an important area for change agents to understand because the
perception of compatibility leads directly to influencing the stage of change, but also
indirectly through the decisional balance. Focusing on the goals of the farmers, change
agents and vendors should demonstrate how these tools can help farmers use precision
agriculture tools meet their goals. Change agents should demonstrate how these tools
work and how they integrate with existing equipment. Thus, the perception of
compatibility with farming practices and operations should increase, thus increasing
141
the level of decisional balance and moving the farmer to a later stage of change.
Support has been found that demonstration of agricultural practices and technologies
helps change the practices and technology use among agricultural producers (Heiniger,
Havlin, Crouse, Kvien, & T., 2002).
The perception of ease of use contributes to both the decisional balance and the
perception of compatibility with farming operations and practices. Focusing on
complexity issues may help farmers better understand the technology; thus, increasing
the perceptions of ease of use. As the levels of perceptions of ease of use increase, so
will the levels of the perception of compatibility. Furthermore, high levels of precision
agriculture self-efficacy lead to perceptions that precision agriculture technologies are
easy to use and are beneficial, increasing the decisional balance. Change agents should
consider targeting educational efforts in helping farmers become comfortable with
precision agriculture technologies.
Future Research
Although the findings of these results provide valuable insight into what
factors are considered when farmers make the decision to use precision agriculture
technologies, there are several areas where future research would be beneficial. One
point of interest is that there was no significant relationship found between
communication behaviors and self-efficacy and communications behaviors and
compatibility. This study used a measure of communications behaviors as the average
of the frequency of use of various informational sources.
142
The communication behaviors variable did not contribute to the model as
posited by Rogers (1995). A consideration of particular types of communications
behavior may be more explanatory. Rather than using the frequency of use of several
information sources, the type of source of information may be more important in
explaining differences in self-efficacy and compatibility. For instance, those who used
information from Internet sources or from professional sources, like Extension and
University staff and agribusiness vendors, may have the propensity to see precision
agriculture as compatibility with their operations and goals. Conversely, the use of
mass media sources may not indicate a relevant relationship to compatibility.
Additionally, the low level of variance explained in self-efficacy and ease of
use suggests that other variables may contribute to these factors. Further development
of additional constructs, such as managerial abilities, could also lead to a better
understanding and motivations and capabilities of farmers. For example, do
managerial abilities make differences in precision agriculture self-efficacy, perceived
ease of use, and perceived compatibility? Also, do computer technical skills make a
difference in these constructs? Understanding what factors are important in affecting
precision agriculture self-efficacy would help change agents improve farmers’
confidence in using precision agriculture technologies.
In spite of the overall support for the hypothesized model, there is still room
for improvement. Decisional balance–the decision making construct—was created
using publicized benefits and disadvantages. The pros subscale included 15 items and
the cons subscale included 13 items. The reliability of these constructs was high, as
143
expected, because the number of items would indicate high reliability (Hinkin, 1995).
Furthermore, the error variance of several items was shared. The number of items and
the shared error variance leads us to believe that the construct could be refined with a
reduction of the items. Additionally, more parsimony pros and cons subscales should
be developed to reduce respondent fatigue (Anastasi, 1986) and shorten the survey
form.
The stage of change in this model was created using a continuous variable
adapted from the Marcus et al., (1992) study. However, no specific values were
specified to categorize stages of change. Although the categorical stage of change
measure does provide stage specific values for each stage (Prochaska & Norcross,
2001; Prochaska et al., 1988), TTM researchers have not provided stage specifics in
the use of the stage of change continuous variable (Marcus et al., 1992). More research
is needed to specifically identify the stages.
A similar study using the categorical stage of change measure may help
determine which form of stage of change variable would be better to use in this
context. One advantage of the categorical scale is that it uses only a few items, rather
than the 25 items used in this study. Thus, a categorical scale may be more
parsimonious. However, it may not provide as much explanatory value.
The practical side of the TTM is to match intervention techniques to the stage
of change. These interventions are based on the processes of change. As described in
Chapter 2, these processes of change help individuals move through the stages of
change. In clinical settings, the stage of change is determined and the intervention
144
techniques are matched to the stage which then, in turn, helps individuals change
behavior, moving them through the stages of change. Before a determination of which
interventions would be effective for each of the stages, the processes of change, as
described in Chapter 2, should be tested in the precision agriculture context.
Despite a plethora of IS studies on use of information technologies, the TTM
and a comprehensive decision-making construct have not been used in the IS field of
research. This stage of change model could be adapted for adoption of information
technologies within organizations. A decisional balance construct should be developed
that is appropriate for the technology being studied. Additionally, the target behavior
and a time-frame associated with the intention of adoption should be defined as well.
It is likely that the target behavior for using a technology within an organization would
be different than using precision agriculture.
Summary
This study investigated factors that affect the decision to use precision
agriculture tools. The theoretical model developed and tested the mediating roles of
decisional balance, perceived compatibility perceived ease of use, and self-efficacy.
The findings suggest that these factors are important in predicting the stage of change.
These findings are important because they offer tangible evidence that these factors
are important in making the decision to use precision agriculture.
145
REFERENCES
Adesina, A. A., & Baidu-Forson, J. (1995). Farmers' perceptions and adoption of new
agricultural technology: Evidence from analysis in Burkina Faso and Guinea,
West Africa. Agricultural Economics, 13, 1-9.
Adesina, A. A., & Zinnah, M. M. (1993). Technology characteristics, farmers'
perceptions and adoption decisions: A Tobit model application in Sierra Leone.
Agricultural Economics, 9, 291-311.
Adrian, A. M., Dillard, C., & Mask, P. (2004). GIS in agriculture. In J. B. Pick (Ed.),
Geographic Information Systems in Business (pp. 324-342). Hershey, PA: Idea
Group Publishing.
Adrian, A. M., Norwood, S. H., & Mask, P. L. (2005). Producers' perceptions and
attitudes toward precision agriculture technologies. Computers and Electronics
in Agriculture, 48(3), 256-271.
Ajzen, I., & Madden, T. J. (1986). Prediction of goal-directed behavior: Attitudes,
intentions, and perceived behavioral control. Journal of Experimental Social
Psychology, 22, 453-474.
Anastasi, A. (1986). Evolving concepts of test validations. Annual Review of
Psychology, 37, 1-15.
146
Anderson, J. C., & Gerbing, D. W. (1988). Structural equation modeling in practice: A
review and recommended two-step approach. Psychological Bulletin, 103,
411-423.
Armenakis, A., A., & Harris, S. G. (2002). Crafting a change message to create
transformational readiness. Journal of Organizational Science, 15(2), 169-183.
Armenakis, A., A., Harris, S. G., & Feild, H. S. (1993). Creating readiness for
organizational change. Human Relations, 46(3), 1-23.
Armenakis, A., A., Harris, S. G., & Feild, H. S. (1999). Making change permanent a
model for institutionalizing change. In W. Pasmore & R. Woodman (Eds.),
Research in Organizational Change and Development (Vol. 12, pp. 97-128).
Greenwich, CT: JAI Press.
Armitage, C. J., Sheeran, P., Conner, M., & Arden, M. A. (2004). Stages of change or
changes of stage? Predicting transitions in transtheoretical model stages in
relation to healthy choice. Journal of Consulting and Clinical Psychology,
72(3), 491-499.
Atherton, B. C., Morgan, M. T., Shearer, S. A., Stombaugh, T. S., & Ward, A. D.
(1999). Site-specific farming: A perspective on information needs, benefits,
and limitations. Journal of Soil and Water Conservation, 54(2), 455-461.
Bandura, A. (1986). Social foundations of thought and action: A social cognitive
theory. Englewood Cliffs, NJ: Prentice-Hall.
Batte, M. (2005). Changing computer use in agriculture: Evidence from Ohio.
Computers and Electronics in Agriculture, 47(1), 1-13.
147
Batte, M. T. (2000). Factors influencing the profitability. Journal of Soil and Water
Conservation, 55(1), 12-20.
Batte, M. T., & Arnholt, M. W. (2003). Precision arming adoption and use in Ohio:
Case studies of six leading-edge adopters. Computers and Electronics in
Agriculture, 38, 125-139.
Batte, M. T., Pohlman, X., Forster, D. L., & Sohngen, B. (2003). Adoption and Use of
Precision Farming Technologies: Results of a 2003 Survey of Ohio Farmers
(No. AEDE-RP-0039-03). Columbus, Ohio: The Ohio State. Agriculture
Education and Development Center.
Beal, G., E., Rogers, E. M., & Bohlen, J. (1957). Validity of the concept of stages in
the adoption process. Rural Sociology, 22, 166-168.
Beal, G., & Rogers, E. M. (1960). The adoption of two farm practices in a central
Iowa community (No. RSE). Ames, IA: Iowa Agricultural and Home
Economics Experiment Station.
Bergeron, F., Raymond, L., & Rivard, S. (2001). Fit in strategic information
technology management research: An empirical comparison of perspectives.
Omega International Journal of Management Science, 29(2), 125-137.
Bollen, K. A. (1989). Structural Equations with Latent Variables. New York, NY:
Wiley.
Bouma, J., Stoorvogel, J., van Alphen, B. J., & Booltink, H. W. G. (1999). Pedology,
precision agriculture, and the changing paradigm of agricultural research. Soil
Science Society of America Journal, 63(6), 1763-1768.
148
Browne, M. W., & Cudeck, R. (1993). Alternative ways of assessing model fit. In K.
A. Bollen & J. S. Long (Eds.), Testing Structural Equation Models (pp. 132-
162). Beverly Hills, CA: Sage.
Browne, M. W., & Mels, G. (1992). RAMONA Users Guide. Columbus, Ohio: The
Ohio State University.
Brynjolfsson, E., & Hitt, L. (1996). Paradox lost? Firm-level evidence on the returns
to information systems spending. Management Science, 42(4), 541-558.
Byrne, B. M. (2001). Structural Equation Modeling with AMOS Basic Concepts,
Applications, and Programming. Mahwah, NJ: Lawrence Erlbaum Associates.
Chan, Y. E., Huff, S. L., Barclay, D. W., & Copeland, D. G. (1997). Business strategic
orientation, information systems strategic orientation, and strategic alignment.
Information Systems Research, 8(2), 125-150.
Chau, P. Y. K. (2001). Influence of computer attitude and self-efficacy on IT usage
behavior. Journal of End User Computing, 13, 27-33.
Chau, P. Y. K., & Hu, P. J. (2002). Examining a model of information technology
acceptance by individual professionals: An exploratory study. Journal of
Management Information Systems, 18(4), 191-229.
Chen, Y., & Zhu, J. (2004). Measuring information technology's indirect impact on
firm performance. Information Technology and Management, 5(1-2), 9-22.
Churchill, G. A. (1979). A paradigm for developing better measures of marketing
constructs. Journal of Marketing Research, 16, 64-73.
149
Cicchetti, D. V. (1994). Guidelines, criteria, and rules of thumb for evaluating normed
and standardized assessments instruments in psychology. Psychological
Assessment, 6(4), 284-290.
Coch, L., & French, J. (1948). Overcoming resistance to change. Human Relations,
1(4), 512-532.
Cochrane, W. (1993). The Development of American Agriculture: A Historical
Analysis. Minneapolis, MN: University of Minnesota Press.
Coleman, J. S., Katz, E., & Menzel, H. (1966). Medical Innovation: A Diffusion Study.
New York, NY: Bobbs-Merrill.
Compeau, D. R., & Higgins, C. A. (1995). Computer self-efficacy: Development of a
measure and initial test. MIS Quarterly, 19, 189-211.
Cunningham, C. E., Woodward, C. A., Shannon, H. S., McIntosh, J., Lendrum, B.,
Rosenbloom, D., et al. (2002). Readiness for organizational change: A
longitudinal study of workplace, psychological and behavioral correlates.
Journal of Occupational and Organizational Psychology, 75, 377-392.
Daberkow, S. G., & McBride, W. D. (2003). Farm and operator characteristics
affecting the awareness and adoption of precision agriculture technologies in
the US. Precision Agriculture, 4, 163-177.
Davis, F. D. (1989). Perceived usefulness, perceived ease of use, and user acceptance
of information technology. MIS Quarterly, 13, 319-339.
Davis, G., Cassady, W., & Massey, R. Precision Agriculture: An Introduction. In U.
Extension (Ed.) (pp. 1-7): University of Missouri-System.
150
DiClemente, C. C., Prochaska, J. O., Fairhust, S. K., Velicer, W. F., Velasquez, M.
M., & Rossi, J. S. (1991). The process of smoking cessation: An analysis of
precontemplation, contemplation, and preparation stages of change. Journal of
Consulting and Clinical Psychology, 59, 295-304.
DiClemente, C. C., Prochaska, J. O., & Gibertini, M. (1985). Self-efficacy and the
stages of self-change of smoking. Cognitive Therapy and Research, 9(2), 181-
200.
Downey, R. G. A. (1998). Missing data in Likert ratings: A comparison of
replacement methods-method for measuring attitudes by R. Likert. Journal of
General Psychology, 125(2), 175-191.
Fishbein, M., & Ajzen, I. (1975). Belief, Attitude, Intention and Behavior. Reading,
MA: Addison-Wesley.
Gist, M. E. (1987). Self-efficacy: Implications for organizational behavioral and
human resource management. Academy of Management Review, 12, 472-485.
Godwin, R. J., Richards, T. E., Wood, G. A., Welsh, J. P., & Knight, S. M. (2003). An
economic analysis of the potential for precision farming in UK cereal
production. Biosystems Engineering, 84(4), 533-545.
Greenstein, D. K., Franklin, M. E., & McGuffin, P. (1999). Measuring motivation to
change: An examination of the University of Rhode Island change assessment
questionnaire (URICA) in an adolescent sample. Psychotherapy, 36(1), 47-55.
151
Heiniger, R. W., Havlin, J. L., Crouse, D. A., Kvien, C., & T., K. (2002). Seeing is
believing: The role of field days and tours in precision agriculture education.
Precision Agriculture, 3, 309-318.
Hill, T., Smith, N. D., & Mann, M. F. (1987). Role of efficacy expectations in
predicting the decision to use advanced technologies: The case of computers.
Journal of Applied Psychology, 72(2), 307-313.
Hinkin, T. R. (1995). A review of scale development practices in the study of
organizations. Journal of Management, 21(5), 967-988.
Hoag, D. L., Ascough II, J. C., & Frasier, W. M. (1999). Farm computer adoption in
the Great Plains. Journal of Agricultural and Applied Economics, 31, 57-67.
Hoag, D. L., Ascough II, J. C., & Frasier, W. M. (2000). Will farmers use computers
for resource and environmental management? Journal of Soil and Water
Conservation, 55(4), 456-461.
Howard, M. (1996). Technology helps farmers target and reduce chemicals. Christian
Science Monitor, 88(248), 10.
Hu, L., & Bentler, P. M. (1999). Cutoff criteria for fit indexes in covariance structure
analysis: Conventional criteria versus new alternatives. Structural Equation
Modeling, 6.
Hudson, D., & Hite, D. (2001). Adoption of precision agriculture technology in
Mississippi: Preliminary results from a producer survey (No. 2001-001).
Starkville, MS: Department of Agricultural Economics, Mississippi State
University.
152
Hudson, D., & Hite, D. (2003). Willingness to pay for water quality improvements:
The case of precision application technology. Journal of Agricultural and
Resource Economics, 27, 433-449.
Igbaria, M., & Iivari, J. (1995). The effects of self-efficacy on computer usage. Omega
International Journal of Management Science, 23, 587-605.
Intarapapong, W., Hite, D., & Hudson, D. (2003). The economic and environmental
impacts of variable rate application: The case of Mississippi (Research Report
No. Research Report 2002-2003). Starkville, Mississippi: Mississippi State
University.
Isik, M., Khanna, M., & Winter-Nelson, A. (2000, 2000). Sequential investment in
site-specific crop management under output price uncertainty. Paper presented
at the 2000 International Precision Agriculture Conference.
Janis, I. L., & Mann, L. (1977). Decision Making: A Psychological Analysis of
Conflict, Choice, and Commitment. New York, NY: Free Press.
Kettinger, W. J., Lee, C. C., & Lee, S. (1995). Perceived service quality and user
satisfaction with the information services function. Decision Sciences, 25(5),
737-766.
Khanna, M. (2001). Sequential adoption of site-specific technologies and its
implications for nitrogen productivity: A double selectivity model. American
Journal of Agricultural Economics, 83(1), 35-45.
153
Khanna, M., Isik, M., & Winter-Nelson, A. (2000). Investment in site-specific crop
management under uncertainity: Implications for nitrogen pollution control
and environmental policy. Agricultural Economics, 24, 9-21.
Kitchen, N. R., Snyder, C. J., Franzen, D. W., & Wiebold, W. J. (2002). Educational
needs of precision agriculture. Precision Agriculture, 3, 341-351.
Lamar, R. V. (1966). In-service Education Needs Related to Diffusion on an
Innovation (pp. 72): Berkeley, University of California.
Larkin, S. L., Perruso, L., Marra, M. C., Roberts, R. K., English, B. C., Larson, J. A.,
et al. (2005). Factors affecting perceived improvements in environmental
quality from precision farming. Journal of Agricultural and Applied
Economics, 37(3), 577-588.
Levesque, D., Prochaska, J. M., & Prochaska, J. O. (1999). Stages of change and
integrated delivery service. Consulting Psychology Journal: Practice and
Research, 51(4), 226-241.
Levesque, D., Prochaska, J. M., & Prochaska, J. O. (2001). Organizational stages and
processes of change for continuous quality improvement in health care.
Consulting Psychology Journal: Practice and Research, 53(3), 139-153.
Lowenberg-DeBoer, J. (1996). Precision farming and the new information technology:
Implications for farm management, policy, and research: Discussion. American
Journal of Agricultural Economics, 78, 1281-1284.
Lowenberg-DeBoer, J. (1999). Risk management potential of precision farming
technologies. Journal of Agricultural and Applied Economics, 31, 275-285.
154
Loyd, B. H., & Gressard, C. (1984). Reliability and factorial validity of computer
attitude scales. Educational and Psychological Measurement, 44, 501-505.
Marcus, B. H., Selby, V. C., Niaura, R. S., & Rossi, J. S. (1992). Self-efficacy and the
stages of exercise behavior change. Research Quarterly for Exercise and
Sport, 63, 60-66.
Markus, M. L., & Robey, D. (1988). Information technology and organizational
change, causal structure in theory and research. Management Science, 34(5),
583-598.
Marshall, S. J., & Biddle, S. J. H. (2001). The transtheoretical model of behavior
change: A meta-analysis of applications to physical activity and exercise.
Annals of Behavioral Medicine, 23(4), 229-246.
McConnaughy, E. A., DiClemente, C. C., Prochaksa, J., & Velicer, W. F. (1989).
Stages of change in psychotherapy: A follow-up report. Psychotherapy, 26,
494-503.
McConnaughy, E. A., Prochaksa, J., & Velicer, W. F. (1983). Stages of change in
psychotherapy: Measurement and sample profiles. Psychotherapy, 20, 368-
373.
Milbrath, Y. L., & Kinzie, M. B. (2000). Computer technology training for perspective
teachers: Computer attitudes and perceived self-efficacy. Journal of
Technology and Teacher Education, 8, 373- 375.
155
Moore, G., & Benbasat, I. (1991). Development of an instrument to measure the
perceptions of adopting an information technology innovation. Information
Systems Research, 2, 192-222.
Napier, T., Robinson, J., & Tucker, M. (2000). Adoption of precision farming with
three Midwest watersheds. Journal of Soil and Water Conservation, 55(2),
135-147.
National Research Council. (1997). Precision Agriculture in the 21st Century:
Geospatial and Information Technologies in Crop Management. Washington,
D. C.: National Academy Press.
Necessary, J. R., & Parish, T. S. (1996). The relationship between computer usage and
computer related- attitudes and behaviors. Education, 116, 384-386.
Nunnally, J. C. (1978). Psychometric Theory (2nd ed.). New York: McGraw-Hill.
Olson, K. (1998). Sixth Joint Conference Food, Agriculture, and the Environment:
Center for International Food and Agricultural Policy, University of
Minnesota.
Orr, C., Allen, D., & Poindexter, S. (2001). The effect of individual differences on
computer attitudes: an empirical study. Journal of End User Computing, 13,
26-40.
Precision Ag. (2005, March 2005). Precision ag starting to catch on in South. Cotton
Farming, 6.
156
Prochaksa, J., DiClemente, C. C., & Norcross, J. C. (1992). In search of how people
change: Applications to addictive behaviors. American Psychologist, 47(9),
1102-1114.
Prochaska, J. M., Levesque, D. A., Prochaska, J. O., Dewart, S. R., & Wing, G. R.
(2001). Mastering change: A core competency for employees. Brief Treatment
and Crisis Intervention, 1(1), 7-15.
Prochaska, J. M., Prochaska, J. O., & Levesque, D. (2001). A transtheoretcal approach
to changing organizations. Administration and Policy in Mental Health, 28(4),
247-261.
Prochaska, J. O. (1994). Strong and weak principles for progressing from
precontemplation to action on the basis of 12 problem behaviors. Health
Psychology, 13, 47-51.
Prochaska, J. O., & Norcross, J. C. (2001). Stages of change. Psychotherapy, 38(4),
443-448.
Prochaska, J. O., Velicer, W. F., DiClemente, C. C., & Fava, J. (1988). Measuring
processes of change: Applications to the cessation of smoking. Journal of
Consulting and Clinical Psychology, 56, 520-528.
Rainer, R. K., Jr., & Miller, M. D. (1996). An assessment of the psychometric
properties of the computer attitude scale. Computer in Human Behavior, 12,
93-105.
Reed, G. R. (1994). Measuring stage of change for exercise behavior change, URICA-
E2. Unpublished Dissertation.
157
Rejesus, R. M., & Hornbaker, R. H. (1999). Economic and environmental evaluation
of alternative pollution-reducing nitrogen management practices in central
Illinois. Agriculture, Ecosystems and Environment, 75 (1), 41-54.
Rogers, E. M. (1983). Diffusion of Innovations (3rd ed.). New York, NY: The Free
Press.
Rogers, E. M. (1995). Diffusion of Innovations (4th ed.). New York. NY: The Free
Press.
Rosen, C. S. (2000). Is the sequencing of change processes by stage consistent with
health problems? A meta-analysis. Health Psychology, 19, 593-604.
Roth, P. L. (1994). Missing data: A conceptual review for applied psychologists.
Personnel Psychology, 47(3), 537-560.
Sawyer, J. (1994). Concepts of variable rate technology with considerations for
fertilizer applications. Journal of Production Agriculture, 7, 195-201.
Segars, A. H., & Grover, V. (1993). Re-examining perceived ease of use and
usefulness: A confirmatory factor analysis. MIS Quarterly, 17(4), 517-525.
Smith, A., Morrison, P., Goe, W. R., & Kenny, M. (2004). Computer and Internet Use
by Great Plains Farmers (No. 04-010): University of California, Davis.
Sonka, S. (1998, Retrieved May 23, 2003, 1998). Precision agriculture as a priority.
Paper presented at the 2nd National Stakeholder Symposium, Washington D.C.
Sonka, S. T., & Coaldrake, K. F. (1996). Cyberfarm: What does it look like? What
does it mean? American Journal of Agricultural Economics, 78, 1263-1266.
158
Swinton, S. M., & Lowenberg-DeBoer, J. (1998). Evaluating the profitability of site-
specific farming. Journal of Production Agriculture, 11(4), 439-446.
Swinton, S. M., Marsh, S. B., & Ahmad, M. (1997). Whether and How to Invest in
Site-Specific Crop Management: Results of Focus Group Interviews in
Michigan (No. 96-37). East Lansing, MI: Department of Agricultural
Economics, Michigan State University.
Vanclay, F. (1992). Barriers to adoption: A general overview of the issues. Rural
Society, 2(2), 10-12.
Velicer, W. F., DiClemente, C. C., Prochaksa, J., & Brandenburg, N. (1985).
Decisional balance measure for assessing and predicting smoking status.
Journal of Personality and Social Psychology, 48(5), 1279-1289.
Velicer, W. F., Norman, G. J., Fava, J. L., & Prochaska, J. O. (1999). Testing 40
predictions from the transtheoretical model. Addictive Behaviors, 24, 455-369.
Venkatesh, V. (2000). Determinants of perceived ease of use: integrating control,
intrinsic motivation, and emotion into the technology acceptance model.
Information Systems Research, 11(4), 342-365.
Weinstein, N. D., Rothman, A., J., & Sutton, S. R. (1998). Stage theories of health
behavior: Conceptual and methodological issues. Health Psychology, 17(3),
290-299.
Wheaton, B., Muthen, B., Alwin, D., & Summers, G. (Eds.). (1977). Assessing
reliability and stability in panel models. San Francisco, CA: Jossey-Bass.
159
Wiebold, B., Sudduth, K., Davis, G., Shannon, K., & Kitchen, N. Determining
barriers to adoption and research needs of precision agriculture. Missouri
Precision Agriculture Center, University of Missouri and USDA/ARS.
Wolf, S. A., & Buttel, F. H. (1996). The political economy of precision farming.
American Journal of Agriculture Economics, 78, 1269-1275.

160
APPENDICES

161
Appendix A
Cover Letter for the Survey Instrument

162
Dear Producer:
Did you know that Alabama has shown a slower rate of adoption of precision agriculture tools than most other states? Precision agriculture involves collecting field and crop information as they vary throughout fields and linking this varying information to field locations to determine and apply the appropriate and varying input levels.
Anne Mims Adrian is conducting a survey as part of her requirements to complete a doctorate in Management Information Systems. The purpose of Anne’s research is to investigate the factors that influence farmers’ decisions to adopt and use precision agriculture technologies. Regardless of whether you use precision agriculture, please take 10 to 15 minutes to complete this survey. It is only four pages long.
Answering this survey is voluntary and your response serves as an informed consent to participate in the study. Although you are under no obligation to complete the survey, your participation could possibly help researchers, Extension specialists and agents, and practitioners develop better precision agriculture educational programs and products. If you decide to participate, please complete each question to your best knowledge.
Any information obtained in this study is anonymous. We assure you that the responses will not be published or communicated in any way that could possibly identify you with the responses. Collectively, information gathered from you and other respondents may be used to fulfill an educational requirement, published in a dissertation, published in a professional journal, and presented at a professional meeting. You may withdraw from participation at any time by not completing the survey. However, whatever information is completed may be used in this study.
Your decision whether or not to participate will not jeopardize your future relations with Auburn University or the Alabama Cooperative Extension System. If you have any questions, feel free to call or email Anne Adrian (334 844 3507 or [email protected]) or her dissertation advisor, Dr. Kelly Rainer, Privett Professor, Department of Management, College of Business, 334 844 4071, [email protected].
For more information regarding your rights as a research participant you may contact the Auburn University Office of Human Subjects Research or the Institutional Review Board by phone (334) 844-5966 or e-mail at [email protected] or [email protected].
Sincerely,
W. Gaines Smith Interim Director Alabama Cooperative Extension System [email protected]
Anne Mims Adrian, Co-Leader Computer Technology Unit Alabama Cooperative Extension System PhD student, Department of Management Auburn University

163
Appendix B
Survey Instrument
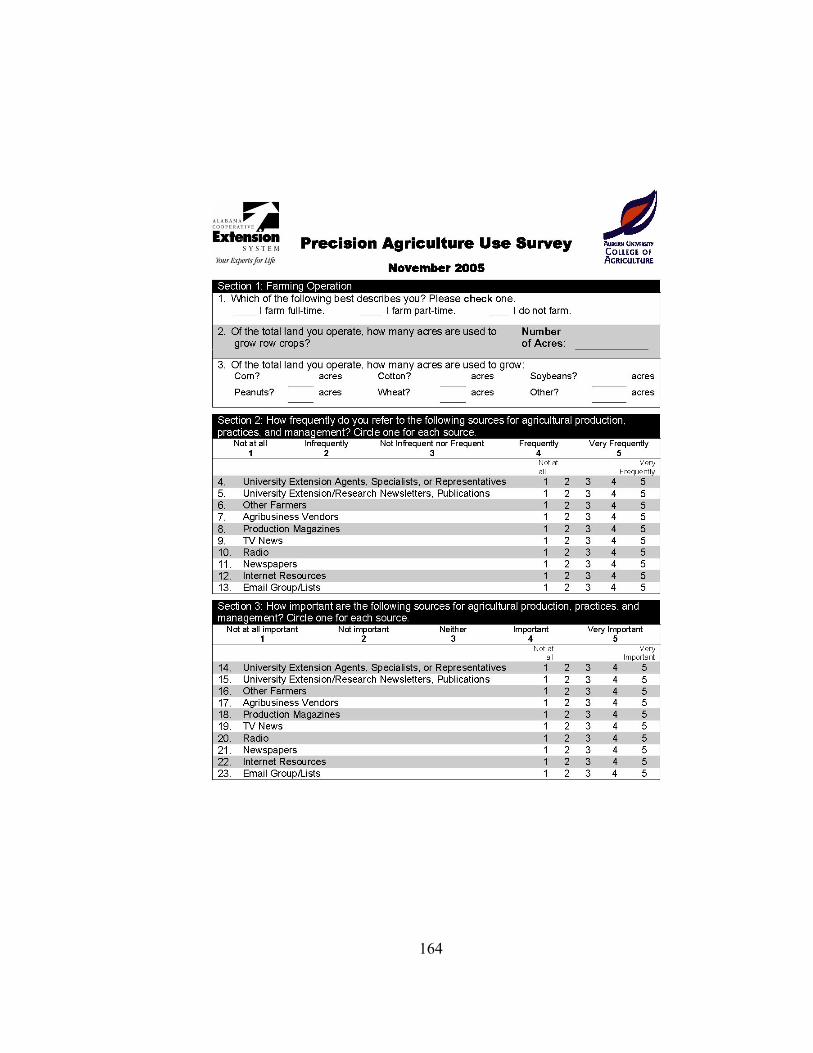
164
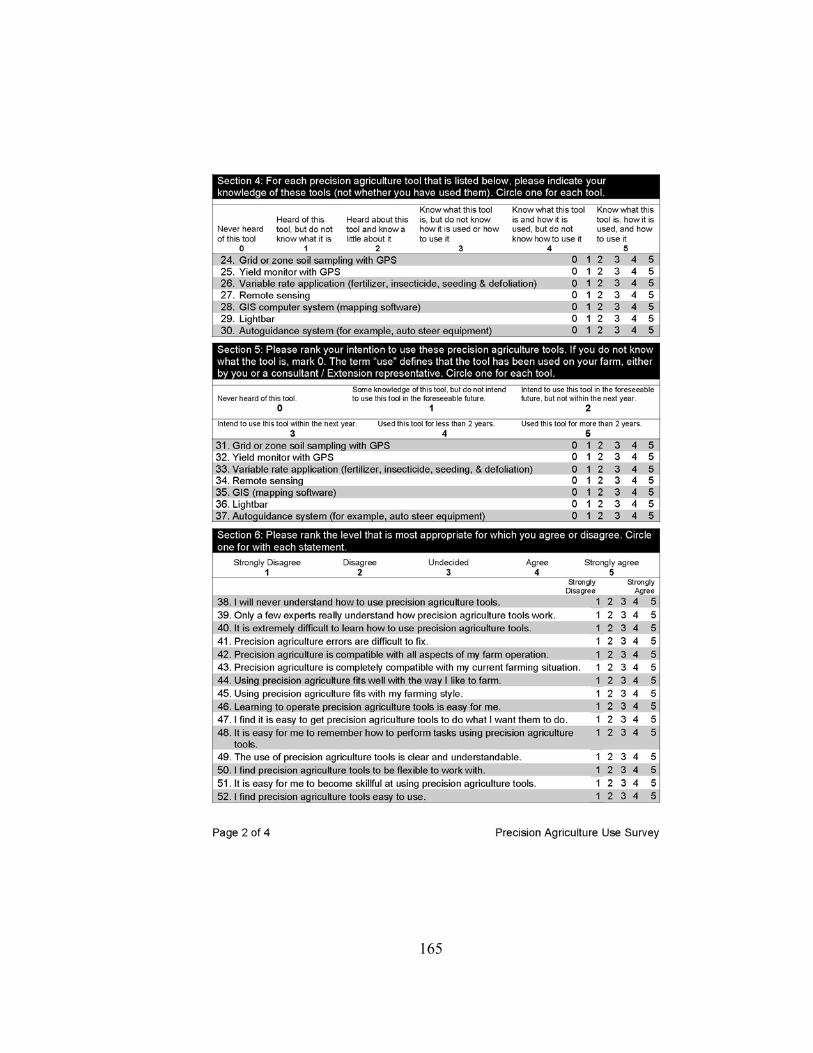
165
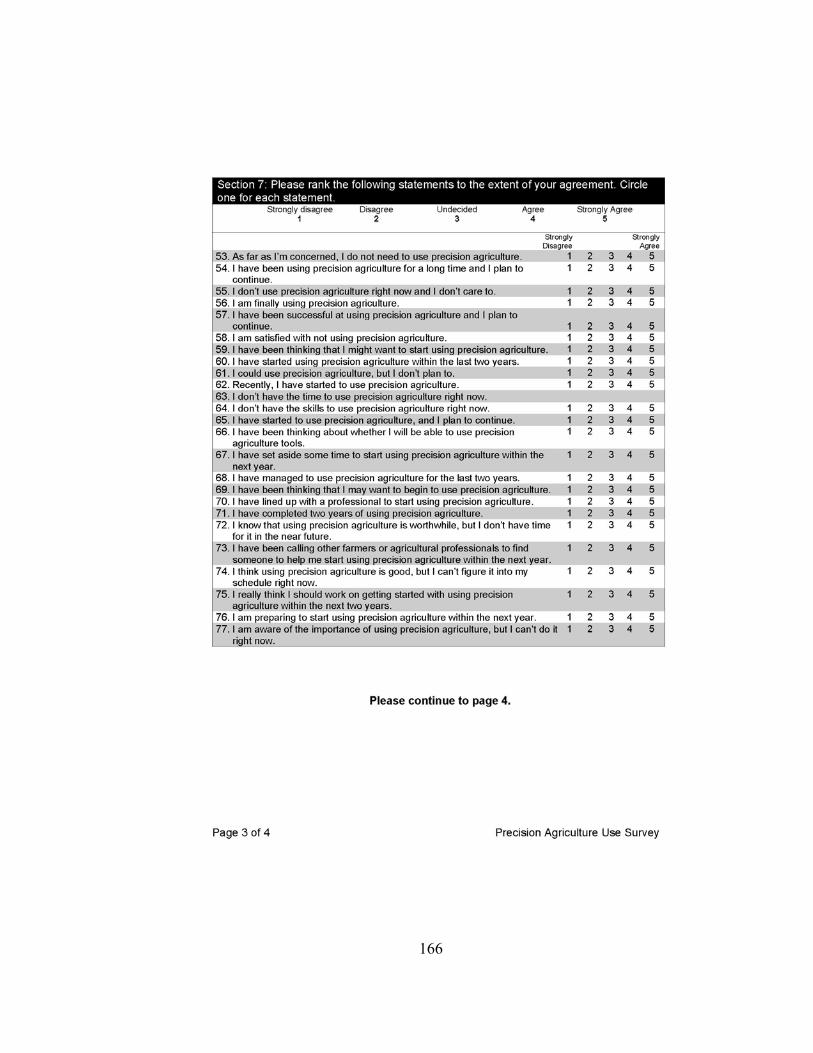
166
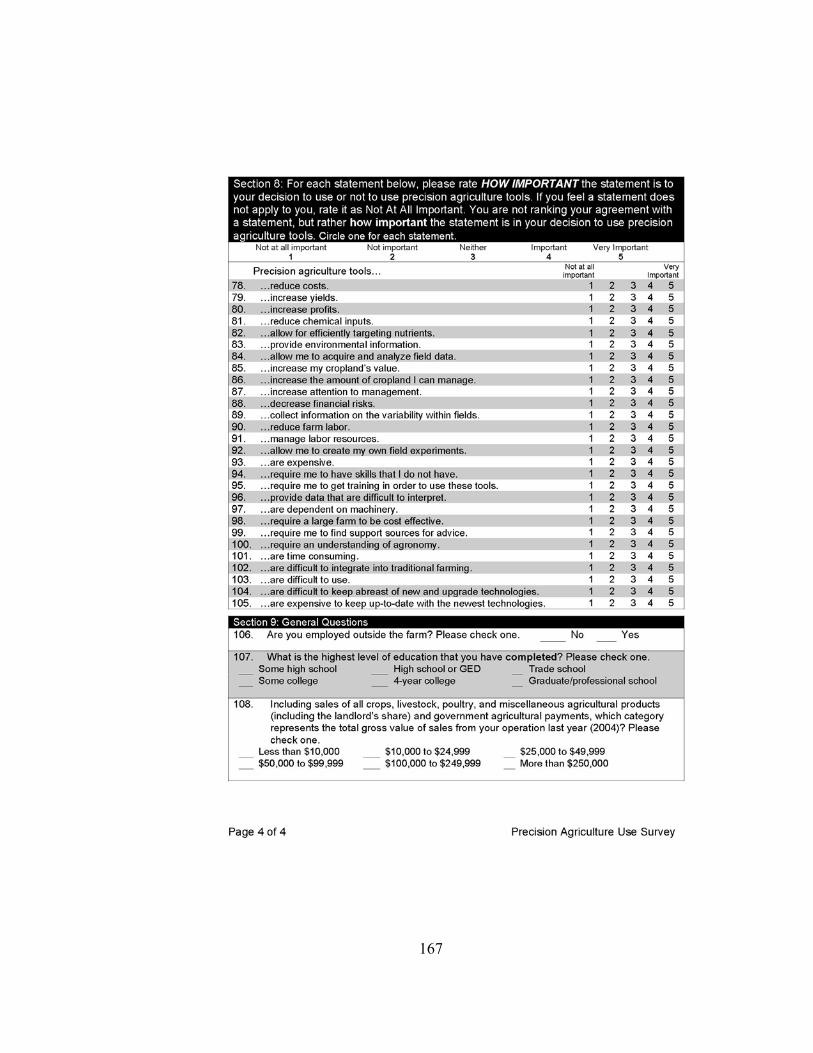
167