factors influencing adoption of innovative
TRANSCRIPT
FACTORS INFLUENCING ADOPTION OF INNOVATIVE
STRATEGIES ON SME’S IN KENYA: A CASE OF KABETE
TOWN KIAMBU COUNTY
BY
ERIC C KIMANI
UNITED STATES INTERNATIONAL UNIVERSITY –
AFRICA
SPRING 2017
FACTORS INFLUENCING ADOPTION OF INNOVATIVE
STRATEGIES ON SME’S IN KENYA: A CASE OF KABETE
TOWN KIAMBU COUNTY
BY
ERIC C KIMANI
A Research Project Report Submitted to the Chandaria School of
Business in Partial Fulfillment of the Requirement for the Degree of
Masters in Business Administration (MBA)
UNITED STATES INTERNATIONAL UNIVERSITY –
AFRICA
SPRING 2017

ii
STUDENT’S DECLARATION
I, the undersigned, declare this my original work and has not been submitted to any other
college, institution or university other than United States University-Africa in Nairobi for
academic credit.
Signed: __________________________ Date: _________________________
Eric C Kimani (ID 641603)
This project report has been presented for examination with my approval as the appointed
supervisor.
Signed: __________________________ Date: _________________________
Scott Bellows
Signed: __________________________ Date: _____________________________
Dean Chandaria School of Business

iii
COPYRIGHT
© 2016 Eric C Kimani
ALL RIGHTS RESERVED. Any unauthorized reprint or use of this research report is
prohibited. No part of study may be reproduced or transmitted in any form or by any
means, electronic or mechanical, including photocopying, recording, or by any
information storage and retrieval system without express written permission from the
author and the university.
iv
ABSTRACT
This research is aimed at establishing the factors that influence the adoption of innovative
strategies in SME’s in Kenya as they are perceived to be one of the engines that drive the
economy. The specific objectives of this study are: To determine whether human capital
influence innovation on SME’s in kabete town , To determine whether organizational
capital influence innovation on SME’s in kabete town, To determine whether Discovery
influence innovation on SME’s in kabete town. To determine whether exploit influence
innovation on SME’s in kabete town
The research questions were: How does human capital affect innovation on small and
medium enterprises in Kenya? Does organizational capital affect innovation on small and
medium enterprises in Kenya?Does discovery affect the adoption of innovative strategy
on small and medium enterprises in Kenya? And does Exploitation affect the adoption of
innovation strategy on small and medium enterprises in Kenya? From the sampling frame
a representative sample of 64 enterprises was obtained randomly and structure questioner
and interviews were used to gather primary data. The obtained data was analyzed and
translated into meaningful information with frequency distribution tables used to draw up
conclusions.
The literature review gave more information about the factors influencing the adoption of
innovative strategies on small scale enterprises in Kenya though a indepth review on the
human capital, organizational capital, the discovery of business idea and the exploitation
of the business itself. The research used a descriptive research design in collecting the
data from the selected respondents and used stratified sampling technique to select a
sample that represented the entire population of 637 enterprises of which a sample of 64
was used. A carefully crafted questionnaire was constructed and tested in order to detect
any ambiguities
The findings indicated that majority of the respondents answered the questionnaire to the
researchers expectation with 86%. The researcher found that there was no statistical
significant between human capital, organizational capital, discovery and exploit in
relation to innovation. The researcher therefore concluded that even though there was a
great relationship between the independent variable and dependent variable in other parts
of the world where a similar study was conducted Kenyan SMEs posted a different

v
outcome. Therefore the researcher recommended a further and a different approach in
conducting the same research since majority of the SMEs in Kenya did not understand
what innovation was all about and the measures used to evaluate innovation were not
applicable in Kenya.

vi
ACKNOWLEDGEMENT
The chief sources to which I am indebted are indicated in the reference section of this
work. However, I must make mention of my supervisor Scott Bellows of United States
International University, through whose guidance, scrutiny and vital comments, I was
able to complete this work. I am also grateful to the business people in kabete town for
there incredibale feedback. My sincere thanks also goes to my lovely dear wife milka and
Daughter Shana for the moral support towards the complition of this research project.

vii
DEDICATION
I would like to dedicate this work to the following persons who helped me achieve this
much in many ways: My dear wife Milkah and daughter Shana,family, friends, colleges
and classmates for enabling me to reach this far through patience, tireless effort and
sacrifices.
viii
TABLE OF CONTENTS STUDENT’S DECLARATION ........................................................................................ ii
COPYRIGHT ................................................................................................................... iii
ABSTRACT ....................................................................................................................... iv
ACKNOWLEDGEMENT ................................................................................................ vi
DEDICATION.................................................................................................................. vii
LIST OF TABLES ............................................................................................................ xi
LIST OF FIGURES ......................................................................................................... xii
CHAPTER ONE ................................................................................................................ 1
1.0 INTRODUCTION........................................................................................................ 1
1.1 Background of the problem ........................................................................................... 1
1.2 Statement of the Problem ............................................................................................... 3
1.3 Purpose of the Study ...................................................................................................... 4
1.4 Research Questions ........................................................................................................ 4
1.5 Significant of the study .................................................................................................. 4
1.6 Scope of the study .......................................................................................................... 5
1.7 Definition of Terms........................................................................................................ 5
1.8 Chapter Summary .......................................................................................................... 6
CHAPTER TWO ............................................................................................................... 7
2.0 LITERATURE REVIEW ........................................................................................... 7
2.1 Introduction .................................................................................................................... 7
2.2 Effect of Human Capital on Adoption of Innovation Strategies .................................... 7
2.3 Effect of Organizational Capital on the Adoption of Innovation Strategies ................ 11
2.4 How does Discovery affect the Adoption of Innovative Strategies? ........................... 15
2.5 How does Exploitation affect the Adoption of Innovative Strategies? ........................ 19
3.6 Chapter Summary ........................................................................................................ 23
ix
CHAPTER THREE ......................................................................................................... 24
3.0 RESEARCH METHODOLOGY ............................................................................. 24
3.1Introduction ................................................................................................................. 24
3.2Research Design............................................................................................................ 24
3.3 Population and Sampling Design ................................................................................. 24
3.4 Data Collection Methods ............................................................................................. 26
3.5 Research Procedure ...................................................................................................... 26
3.6 Data Analysis Methods ................................................................................................ 27
3.7 Chapter Summary ........................................................................................................ 27
CHAPTER FOUR ............................................................................................................ 28
4.0 RESULTS AND FINDINGS ..................................................................................... 28
4.1 Introduction .................................................................................................................. 28
4.2 Response Rate .............................................................................................................. 28
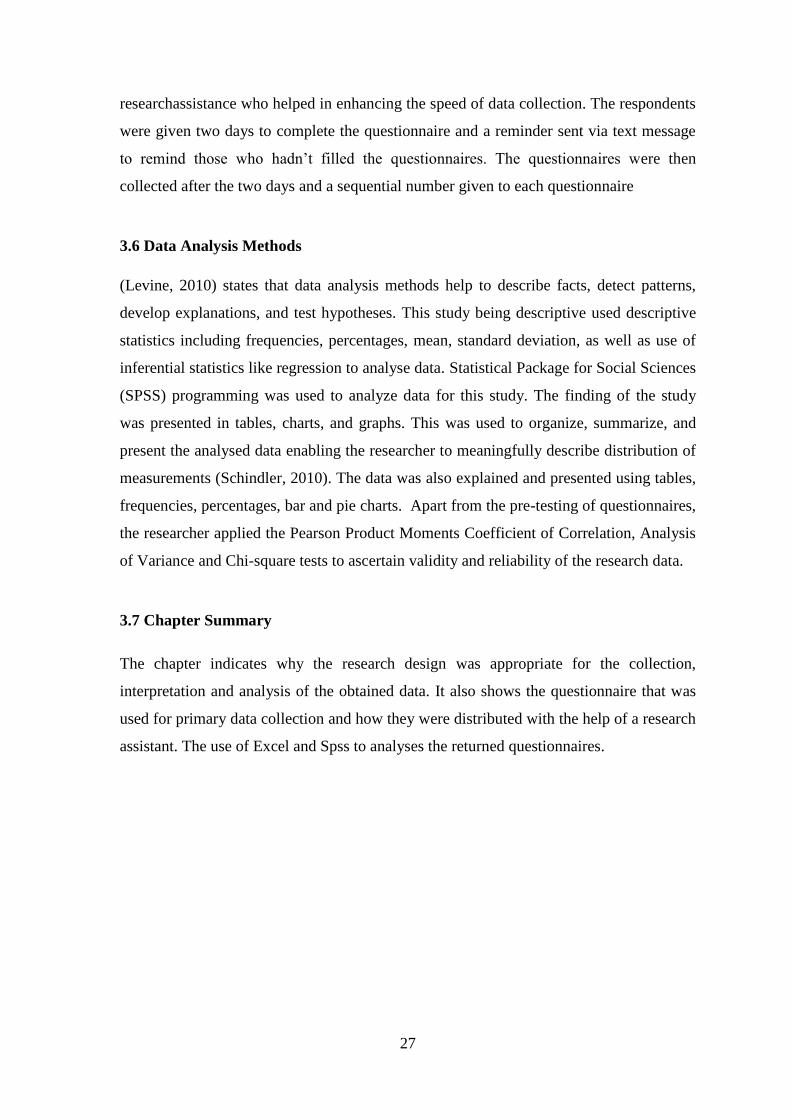
4.3Background information ............................................................................................... 28
4.4 Human Capital and Innovation .................................................................................... 30
4.5 Organizational Capital and Innovation ........................................................................ 32
4.6 Descriptive Statistics .................................................................................................... 36
4.7 Correlations .................................................................................................................. 37
4.8 Model Summary........................................................................................................... 38
4.9 Coefficients of Linear Regression Model .................................................................... 40
4.10 Chapter Summary ...................................................................................................... 41
CHAPTER FIVE ............................................................................................................. 42
5.0 DISCUSSION, CONCLUSIONS AND RECOMMENDATIONS ........................ 42
5.1Introduction ................................................................................................................... 42
5.2 Summary ...................................................................................................................... 42

x
5.3 Discussions .................................................................................................................. 43
5.4 Conclusion ................................................................................................................... 46
5.5 Recommendations ........................................................................................................ 47
REFERENCES ................................................................................................................. 49
APPENDICES .................................................................................................................. 54
APPENDIX I: INTRODUCTORY LETTER ............................................................... 54
xi
LIST OF TABLES
Table 3.1 Sample Distribution ........................................................................................... 26
Table 4.1: Level of Education ............................................................................................ 30
Table 4.2: Training............................................................................................................. 31
Table 4.3: Management Training ....................................................................................... 31
Table 4.4: Entrepreneurship experience ............................................................................ 32
Table 4.5: Adjustment to product and services .................................................................. 33
Table 4.6: Growth Potential ............................................................................................... 33
Table 4.7: Duration ............................................................................................................ 34
Table 4.8: low pricing ........................................................................................................ 34
Table 4.9: Product Quality ................................................................................................. 35
Table 4.10: Innovation perception ..................................................................................... 35
Table 4.11: Descriptive Statistics ...................................................................................... 36
Table 4.12: Model Summary ............................................................................................. 38
Table 4.13: Anova .............................................................................................................. 39

xii
LIST OF FIGURES
Figure 4.1: Duration of timethe Respondent's business has been in existence .................. 28
Figure 4. 2: The main business activities of the Respondent's Business ........................... 29
Figure 4.3: Respondent Gender ......................................................................................... 30
1
CHAPTER ONE
1.0 INTRODUCTION
1.1 Background of the Problem
Small and medium enterprises are set up for the purpose of starting and running a
business for profit maximization and hence contributing largely to economic growth(Pitt,
2010).However the challenges facing this concept of profit maximization requires more
than what is available to the entrepreneur in terms of resources, training, and attention
among others. As a result of this the creativity and new ideas decline hindering
acquisition of the relevant skill that drive this sector towards success.
A positive relationship between small and medium enterprises and economic growth in
developed countries has been documented(Gibson, 2011). Since the 80’s most of the
African Countriesimplemented economic financial reforms to achieve macroeconomic
stability which have led to greater macroeconomic stability, improved economic
governance, improved fiscal and monetary management and overall economic
performance.
SME’s have been recognized by professional and the governments as one of the engine
that drive the economy of a country and uphold private sector development. Thegrowth of
this sector translates to the growth of many elements including improved living standards,
poverty eradication, employment, and capital formation. On the aspect of planning SME’s
are more and more recognized as the principle means for achieving sustainable and
equitable diversification. In most countries, including developed countries like
china,japan,US accounts for over half of the employments, sales produced and hence
contributing to the overall GDP(Reynold, 2010).
Up until the early 60s economist viewed the progression of small business in less
developed countries to be as a result of scarcity in management experience and capital
which was argued that with economic growth the small traditional business will be
superseded by the modern form of large scale production to ensure an organized
2
transition. Small industries were enjoying more attention and support mainly in sectors
where modern techniques were applied (Pitt, 2010).
From the “African employment report” (ILO/JASPA, 2010) the small and medium
enterprises make a significant contribution to the (GDP) of most of the African countries
i.e. Nigeria (24.5%), Benin (17.7%), Liberia (34.6%) and Kenya (19.5%). In our country
Kenya this sector is expected to play a role in employment creation and as the projection
for 2000 this sector was expected to create 75% of the urban jobs and 50% of the jobs in
the rural areas (ILO, 2012). Currently this sector employs (40-60%) of the urban labour
force.
It is recognized generally that small and medium enterprises face unique challenges
which affect their innovation capability hence hindering their ability to contribute
effectively to the development of the economy. The cited problems are lack of human
capital, organizational capital and discovery & exploitation of ideas (Harper, 2013).A
recent study by International center for Economic Growth (Ackerman, 2003) and central
Bureau of Statistics (CBS), indicated that a lot needs to be done to small and medium
enterprises with regards to management and information, human capital, training among
other issues faced by SME’s. However it indicated that policy formation by the
government remains to be a major shortcoming and focus need to be maintained inorder
for the intervention programs to have meaningful impact on small and medium
enterprises.
In Kenya SME’s has concentrated in retail services hence providing for the majority of
the jobs in various sectors i.e. agriculture,wholesale,transport and restaurant among
others. Startups of businesses have been attracted to this sector because it requires less
capital to start. TheKenyan population has grown significantly hence creating
unemployment due to poor planning resulting to the crop of small business that provide
income to this population. The Government promised 500,000 jobs every year and this
has not been realized so far and as a result of this new business will continue being
created without proper structure or knowledge for the sake of survival and to provide for
the next meal (Reynolds, 2010).
3
Entrepreneurship is the practice of mobilizing, identifying, exploiting and utilizing ideas,
concepts, opportunities in order to earn an income and as well attain desired goals and
objectives(Harper, 2013). Also according to Central Bureau of statistics 2012 looks at
small and medium enterprises as a constitute of semi organized and unregulated practices
carried out by self-employed people in stalls, open markets, streets or undeveloped plots
within urban areas. According to Strategic Business Advisor Africa Ltd (SME banking
Sector, 2012) indicate that they are about 2.2 million Small and medium enterprises in
Kenya(Gourova, 2006).
1.2 Statement of the Problem
Small and medium enterprises contribution to the economy has not been highlighted
adequately. This sector plays a vital role in the growth of the Kenyan economy. Economic
Survey (2006) indicated that over 50% of new jobs are created from this sector but
despite this significance three out of five businesses fail within few months of operation
(Kenya National Bureau of Statistic, 2007). This issue is of great concern not only to the
business owner but to the government, private co-operations, and citizen among others.
The government through its policies and budget allocations has acknowledged this crucial
role and has made effort to energize this sector(Perker, 2011). There have been grants,
incentives and support agencies all geared towards making the SME’s sector a success.
Despite of all this efforts the sector still faces challenges interms of Innovations and due
to improper policies and lack of documented information this makes it rather unuseful to
anyone who wants to venture into this sector or what to find out more about it. Hopefully
this research will enrich and add to the existing data and information available.
According to (Belwal, 2011)cited the lack of Innovation strategies as a challenge on their
business on the initial stage before they are able to break even, this has made many of the
business to collapse because they don’t have creative ways to sustain themselves
throughout this phase. Also the sector being characterized by many uneducated people
and hence the aspect of proper management becomes a big issue for them to scale up the
business from one stage to the next. Literature review has further shown factors such as
Human capital, Organizational capital, Discovery and exploitation as some of the
challenges posed by SMEs in developing countries that leads to lack of
Innovation(Appelbaum, 2007). Time is now for us to do something surgical to safeguard
4
this sector inorder to achieve the vision 2030. Given the importance of the SME sector in
the Kenyan economy and the fact that they are prone to failure if they don’t innovate
hence there is a need to investigate this factors that affect them when it comes to
innovation strategies that if tackled well this sector will grow and thrive.
1.3 Purpose of the Study
The main purpose of this study was to determine factors influencingthe lack of innovation
strategies on small and medium enterprises in Kenya with specific reference to selected
entrepreneurs from Kabete town KiambuCounty.
1.4 Research Questions
The research will sought to solve the following questions
1.4.1 How does human capital influencethe adoption of innovation strategies on small
and medium enterprises in Kenya?
1.4.2 How does Organizational capital influencethe adoption of innovation strategies on
small and medium enterprises in Kenya?
1.4.3 How does Discovery influencethe adoption of innovative strategies onsmall and
medium enterprises in Kenya?
1.4.4 How does Exploitation influence the adoption of innovation strategies on small
and medium enterprises in Kenya?
1.5 Significant of the study
1.5.1 Entrepreneur
This study created availability of information to SMEs on the factors that influence the
adoption of innovation strategies on their businesses and what they can do to mitigate
them. Also the knowledge acquired will not only improve the performance of their
business but also help them to survive.
1.5.2 Financial Institutions
The study will be significant to the financial institution as they develop product to suit the
target market of Enterprise. It will give them more information on what strategy the
business are adopting and they can create products to suite them hence improving their
business as well.
5
1.5.3 The Government
The study will be significant to the government because it act as a base from where these
businesses are carried out. Through the policies formation the government will be well
informed on which measure to take to encourage more and more businesses to innovate
and grow this sector.
1.5.4 Scholars
This research will contribute to the body of knowledge on factors affecting the adoption
innovation strategy onsmall and medium enterprises in Kenya. It will act as a source of
knowledge for further research on SMEs and scholars will find the outcome of the
research useful as a source of literature review when carrying out research on other areas
related to SMEs.
1.6 Scope of the study
The study was confined to SMEs in Kabete town KiambuCounty. According to registrar
of companies the registered business in kabete town are 637 which represent the target
population in this area and a sample size of 64was selected for the research which was
deemed to be sufficient for the research. The research time frame was September 2016-
Nov 2016.
1.7 Definition of Terms
1.7.1 Small and medium enterprises (SMEs)
SMEs are defined in Kenya as a small business employing 9 people or less.
(Hisrich, 2008)
1.7.2 Entrepreneurship
This is the practice of mobilizing, identifying, exploiting and utilizing ideas, concepts,
opportunities in order to earn an income and as well attain desired goals and
objectives.(Harpat, 2011)
1.7.3 Human Capital
This is Intangible collection of resources possessed by individual and groups within a
given geographical area. These resources include all the knowledge, talents, skills,
6
abilities, experience, which are possessed by this individuals collectively.(Richard Huff
2011 human capital economics
1.7.4 Organizational Capital
Organizational capital can be defined as the accumulation of firm’s resources and
business strategies. Ideally there are two variables related to the renewal and development
component of an organizational capacity (Reynolds P. , 2007)
1.7.5 Discovery
Discovery in perspective is the identification and the refinement of venture ideas this is
mostly prior to the business startup, it’s the conceptual aspect of the business process
were emerging entrepreneurs seek, encounter or improve product and services to take
advantage of curtain markets(Reynolds P. , 2007).
1.7.6 Exploitation
Exploitation is the process in which business people actually work on the business idea by
acquiring resource and entering or creating a new market (Cropanzano, 2003)
1.7.7 Innovation
The introduction of a new good, new quality of a good; the introduction of a new method
of producing goods; the opening of a new market opportunity; the conquest of a new
source of supply of raw materials and partially manufactured goods; or the application of
a new form of organization in any industry, such as the creation or breaking up of a
monopoly position. (Davidsson, 2005)
1.8 Chapter Summary
This chapter looks at the background of the study, Statement of the problem, objectives of
the study, significance of the study, scope of the study and definition of terms. Chapter
two will present literature review based on the specific objectives of this research paving
way for chapter three that will look at the research methodology that will be used in this
research.
7
CHAPTER TWO
2.0 LITERATURE REVIEW
2.1 Introduction
The chapter looked into the related literature that involves factors influencing the
adoption of innovative strategies on small and medium enterprises industry globally,
regionally and also in Kenya.
The main aim of the literature review was to give the researcher background information
about the topic under investigation and how the factors have been reviewed and
documented by other scholars. The factors looked into included Human capital,
Organizational capital, Discovery and Exploitation.
2.2 Effect of Human Capital on Adoption of Innovation Strategies
Most researchers who are interested with the relationship between entrepreneurship and
success of it have emphasized on the importance of the entrepreneur in the process of
success of the business. Past studies have indicated that human capital is necessary for the
success and survival of these small businesses (Corbett, 2005).
The theory of human capital tries to argue that people try to gain reward for the
investment they have put in through human capital ((Belwal, 2011)and seek to maximize
the benefit of in.The Idea that firm success is influenced by its human capital is not
new(Piliavin, 1991). The firm higher stock of human capital causes it to be successful in
various ways due to a mixture of qualities posed by the employees and as a result they are
able to innovate hence offering it a competitive advantage over its rival businesses
(Baum, 2004)Entrepreneurs who engage the employees by investing more in their human
capital are more likely to enjoy the benefit of their investments as compared to those who
don’t (Callero, 2007). Present literature on entrepreneurship has had a number of
arguments about how human capital increases innovation in a business and eventually
making it a success. First, Human capital help the business owners to discover and exploit
a business opportunity which in most cases is not easy to identify if the human capital is
not present on an entrepreneur, Increase on human capital enables the business to be more
8
innovative because of the diverse ideas, experience and thought patterns that individual
brings on the table (Shepherd, 2005).Secondly human capital is associated with strategic
planning which brings in the aspect of being innovative inorder to achieve the strategic
ideas that an entrepreneur may have, in achieving this the business is able to thrive and
grow exponentially.
2.2.1 Knowledge of Human Capital
The knowledge that human capital brings to a business is immense and well related to
human capital on the aspect of acquiring of knowledge which is an ingredient of total
human capital(Strahan, 2006). The knowledge can help discover a new line of business or
a new set of customers. Also this can help in mobilizing of financial resources that can be
used to expand the business or acquire other additional resources that can be of much
usefulness to the business. This knowledge also contributes a lot in other innovative
strategy that boost the growth and expansion of the business which in the end compensate
for the lack of other important resources i.e. financial resources (Anderson J. &., 2009)
Owners of must of small medium enterprise with greater human capital achieve a great
deal of business growth and are able to bring out various innovative strategies which
contribute highly to the business as opposed to those without the human capital in their
business (Hoang, 2003). Contend that all workers have specific knowledge, skills and
experience that they have acquired in their previous working life, also they may have
acquired experience from training attained previously, which contribute towards their
value on human capital. This value is well expressed on the performance of the individual
in the business and how they are able to handle various task assigned to them that
differentiate them from any other person with lower human capital. Business that have
individual with a higher human capital enjoy a diverse range of resources that together
contribute to the business being able to adopt innovative strategies and hence keeping
them above the pack in the business environment. This is a rare thing in most of the
country to have such skills(Hoang, 2003).Overall the literature that has been in existence
emphasizes the great importance of the human capital to small and medium enterprises
success. This literature also distinguishes between the different characteristics of
individuals within the business, such as professional proficiency, training, social related
skills and experience. Studies in the past have shown that entrepreneurs with higher level
of human capital on their employees have a very high chance of being innovative and
9
hence be able to withstand the ups and down’s of the business and still manage to grow
and post positive profitability’s(Coleman, 2007). There is widespread settlement that
social capital in a business which is in form of resources that are embedded in the
entrepreneurs personal networks which is critical to the performance of small firms. For
example network connections enables entrepreneurs to identify new business
opportunities or new markets, obtain resources at cost that are below market rate, and
increase legitimacy through external stakeholders (Coleman, 2007)
2.2.2Human Capital competence
The link between human capital and the competence of a person has been proved in the
study of Liao and(Yao, 2007) were he stated that the ability of a person to be competent
in his work is highly based on the human capital he has interms of skills and knowledge
acquired. This competence can be determined by the way an Entrepreneurs Evaluation his
business performance which is one of the key things that can help the Owner determine if
the business is innovating or not but unfortunately this concept is grocery underestimated
by SMEs. This is the case because of the inadequate knowledge base necessary to asses a
financial statement which in the end can help them make adjustments on the financial
positions(Verheul, 2013).
According to (White & Yu, 2004) stated out that many entrepreneurs would prefer to
avoid the subject of Financial statement when this topic is brought out and their response
is “they will employ an accountant to do the statements for me “which is very unfortunate
for them because they think because there business are small they don’t need this
accounting method, though it does not matter the size every business needs proper
financial management system for it to make innovation strategies which will lead to
business growth. The knowledge of financial system helps the owner to now the status of
his business financially and he is able to project based on the information acquired from
this (Hoang H. &., 2012).
ECA,(2011) carried out a study on enhancing the competitiveness of small micro
enterprise in Africa. The study found out that shortage and insufficient financial
institutions for SMEs support was a major obstacle for their innovation. Example the
Senegalese private sector was incapacitated due to the fact that most financial institutions
were not fully equipped to serve the SME sector.
10
According to (Morris, 2009) the study agree on how crucial management is to the
successful performance of any enterprise. Management competence encompasses
management skills, Functional skills and behavior management. Hence competence such
as financial control, marketing and networking are management functions. Nevertheless
the goods produced from this sector are low compared to those produced by more formal
settings (Kithylo, 2014)this can be attributed to lack of relevant skills or low quality of
materials used to produce. This is evidence as most of the SMEs lack sufficient
knowledge, technical training and skills that are necessary to do business in the modern
and highly competitive markets.
It’s the responsibility of the management to formulate the necessary financial controls in
the business so that all necessary records are well kept. Decisions such as the type of
market to adopt, what and when to advertise, size of the market, pricing policy, staffing
and employee training are all management functions in the docket of an entrepreneur
(Munene, 2011).
According to (Storey, 2011)the factors that affect growth of a business were; ownership,
business performance management/people and location of the business. However
(Kupferberg, 2010)who studied entrepreneurial career commitment and humanistic
concluded that most important factors of success among entrepreneurs were; Strong
analytical skills, Investing in personal reputation, broad biographic experiences outside
the professional field, successful records of previous work, and the abilty to communicate
effectively with customer’s
According to (Ploruiman, 2010) view’s management as a technique by which the
objective and purpose of a particular human group are determined, affected and clarified,
Sir Charles however sees management as a process of getting things done through agency
and community with a view to fulfill the purpose for which it exists. Charles emphasized
the accomplishment of the task through the efforts of the people, It implies that the
manager has the duty to guide and coordinate the efforts towards the realization of this
goals which can only be achieved when the owner has the knowledge and the skills about
management (Sekaran, 2013).
11
(Orwa, 2011)stated that people venture into business without proper planning and
sometimes for wrong motives mostly for making money. Even if they anticipate making
money it’s good to have objectives in place which will help organization to realize its
purpose and this will act as a guide line of the firm’s relations to its employees, clients,
government and lenders. In addition to be effective the owner needs to have a good
understanding of different style of leadership.
2.2.3 Human Capital Network
In previous years there have been several studies that have been conducted focusing on
human capital, their relationship with individual networks and their effects on the groups
and organizations (Hoang 2003). Network on human capital not only influences
individuals but also has a significantly effect on the way that organizations are managed,
run, maintained and sustained (Omri and Frikha, 2012). The role that networks plays on
human capital are not only studied within the discipline of sociology but are also
increasingly being used to understand entrepreneurial behavior in the new enterprises
start up phases, development, success and growth (Granovatter 2005).
However fewer studies have empirically tested the influence of human capital on small
and micro-business innovation. Among thesevarious studies are those of Blumberg and
Honig 1998. This study confirms the important role of human capital and particularly the
influence on entrepreneur’s innovative capabilities as they also include the networking on
their firms. The role of human capital and its influence on the entrepreneurs plays great
role in making the firm succeed. This fore mentioned approaches gives a suggestion that
accessing this capital by a firm is an essential element of small business success Honig
1998.
2.3 Effect of Organizational Capital on the Adoption of Innovation Strategies
It’s well known that new firms usually face serious difficulties to survive the initial stage
of their operation. Lack of organizational capital is attributed to these failures such as
product quality, and firm’s ability to adapt to the changing environment.
Organizational capital can be defined as the accumulation of firm’s resources and
business strategies. Ideally there are two variables related to the renewal and development
12
component of an organizational capacity (Roos et al., 1998) one which is the level of
adaptation to the market and firm age, which mostly appears to be crucial to explain the
new venture growth and success. The adaptation to the market represent the different
changes produced within a firm during the initial stage of building the business that helps
in meeting the market conditions such as number of new products, quality, price of the
product, customers, suppliers, location and partners. Organizations that persist in refining
their strategies to adjust to the new markets conditions are the ones that thrive and
perform best (Birley 2001). Businesses that have a firm strategy and that are oriented
toward quality tend to operate better and succeed. While owners of this businesses which
are both stable and growing always consider innovation as an important strategic activity
to remain in business for them to remain competitive as compared to businesses that
consider low pricing (Kalleberg 2001).
2.3.1 Organizational Capital Adoptability
The empirical evidence about the business indicates that an organization with capital
adoptability enables it to adjust to market dynamics and results to growth and eventually
innovate Leitch (2001). In additional to learning in an organization there are other firms
attributes that although are tangible are important in explaining new business innovations,
in the case of large sums of financial resources at the moment of the firms creation
contribute to a positive endurance of the business. Furthermore a great founding team of
entrepreneurs with additional accumulation of experience within a firm allows the
innovation expansion of business sources of financial (Hofer 1999). Interestingly these
firms grow both the sales and market share making their businesses to be more
competitive. Organizational capital elements such intra-firms learning, business
strategies, structural flexibility are relevant components of the intellectual capital
embedded within a firm which seems to influence the firms’ survival and growth (Leitch
2001).The empirical evidence about the business indicate that firm flexibility for adapting
to a market which is perceived to be a high potential determines the business success and
growth.
More investment in organizational capital is expected to yield a higher productivity of
individual. While the economic value of organizational capital cannot be questioned and
an important question that entrepreneurs are asking is what type and how much
organizational capital is required to make my business to be innovative (Bates, 1999).
13
The business resources, strategies, experience and motivation that entrepreneurs bring to
a business can be expected to determine the innovative level of a business as they
contribute toward the pillar of organizational capital.
The knowledge based acquired in institutions of higher learning can be enriched with
business experiences which can be associated with prior involvement of entrepreneur in
the management position. The studies has shown that business are more likely to innovate
when entrepreneur have had prior experience in an organization were innovation was
present at a prior company (Stuart 1998). Another useful experience is the prior creation
of a business which create a lot of learning lesson especially on the startup stage where
most business face a lot of challenges (dyke et al,1996). Others not so profound
experience is learning from people within your networks who have gained experience in
running the business.
In additional to the organizational component of a business, venture success can be
determined by the owner characteristics of a business. Typically prior studies have shown
the effect that a business age and size affect the survival and growth of a business (Birley
1997). Another significant of a business character is its legal form by which a company is
created; some studies reveal that organization performance is considerably superior when
the business is started by a team of strategic entrepreneurs (Doutriaux 1992).
2.3.2Organizational Management Competence
According to (Morris, 2009) the study agree on how crucial management is to a
businessman as he embark on innovation strategies. Management competence
encompasses management skills, Functional skills and behavior management. Hence
competence such as financial control, marketing and networking are management
functions. Nevertheless the goods produced from this sector are low compared to those
produced by more formal settings (Kithylo, 2014)this can be attributed to lack of relevant
skills or low quality of materials used to produce. This is evidence as most of the SMEs
lack sufficient knowledge, technical training and skills that are necessary to do business
in the modern and highly competitive markets.
It’s the responsibility of the management to formulate the necessary financial controls in
the business so that all necessary records are well kept. Decisions such as the type of
14
market to adopt, what and when to advertise, size of the market, pricing policy, staffing
and employee training are all management functions in the docket of an entrepreneur
himself (Munene, 2011).
According to (Storey, 2011)the factors that affect strategic innovation strategies are;
ownership, business performance management/people and location of the business.
However (Kupferberg, 2010)who studied entrepreneurial career commitment and
humanistic concluded that most important factors of innovation among entrepreneurs
were; Strong analytical skills, Investing in personal reputation, broad biographic
experiences outside the professional field, successful records of previous work, and the
abilty to communicate effectively with customer’s
According to (Ploruiman, 2010) view’s management as a technique by which the
objective and purpose of a particular human group are determined, affected and clarified,
Sir Charles however sees management as a process of getting things done through agency
and community with a view to fulfill the purpose for which it exists. Charles emphasized
the accomplishment of the task through the efforts of the people, It implies that the
manager has the duty to guide and coordinate the efforts towards the realization of this
goals which can only be achieved when the owner has the knowledge and the skills about
management which he can transform into innovation(Sekaran, 2013).
(Orwa, 2011)indicated that people venture into business without proper planning and
sometimes for wrong motives mostly for making money soonest. Even if they anticipate
making money it’s good to have objectives in place which will help organization to
realize its purpose and this will act as a guide line of the firm’s relations to its employees,
clients, government and lenders. In addition to be effective the owner needs to have a
good understanding of different style of leadership.
A study of challenges facing SMEs in Nigeria noted that poor management inadequate
competent personnel were some of the major challenges facing SMEs in the country
(Onugu, 2011). He argued that in order for us to view and asses this issue of poor
management in its true perspective, it would be imperative to outline the circumstances
leading to it and also the implication it has on business innovative strategy. A small size
company because of their sizes and scope of operation cannot afford nor attract the “A-
15
Class” type of management that is enjoyed highly by large organizations. The “A” type of
managers needed to man this type of Industries usually prefers to take appointment in
large companies or the public sector which could give them room for advancement. Those
left to take up appointment with medium sized industries are those either not able to
secure lucrative appointment or those with inadequate education or professional
qualification and training in the field. Implication of having wrong management in the
right place is that decisions are made that are wrong due to lack of enough professional to
give the right advice. An investment company in an appraisal report of one company felt
that inefficient management have led to innovative issues,(Onugu, 2011)
The study also made it clear that weakness in companies information technology,
administration, human resource, finance and accounting arise from the lack of personnel
with adequate education and technical background that can promoter SME and their staff.
Inadequate managerial, technological and scientific competence among the SME result in
less innovative businesses with inadequate capacity on process technology, design and
patents, poor and substandard products that cannot compete locally or internationally and
Poor managerial ability which also manifests and is reinforced by lack of leadership and
inappropriate training in various aspects of SMEs management (Onugu, 2011)
Business innovative strategies are as a result of managerial decisions; these decisions are
constrained to the resources of a firm. The larger the amount of organizational capital the
more the businessman is provided with more flexibility to undertake a wider array of
innovative strategies and therefore would influence positively business success (Cooper et
al., 1999). The strategic decision making of a business is an organizational intangible
process that is supposed to affect directly the progress of a business. Sandberg and Hofer
(1992) found out that firms which emphasized a product differentiation type of an
innovative strategy outperformed the rest of the startup business, whereas other studies
showed that business strategies oriented towards the production of high quality products
were related positively to the survival of a business and the growth of it (Kalleberg 1992).
2.4 How does Discovery affect the Adoption of Innovative Strategies?
The greatest entrepreneurship process is often considered to have two components that is
discovery and exploitation of venture ideas. The major task has been to identify the
16
factors that promote engagement in the start-up process before they are initiated and on
the startup stage (Davidsson 2005). Discovery in perspective is the identification and the
refinement of venture ideas this is mostly prior to the business startup, it’s the conceptual
aspect of the business process were emerging entrepreneurs seek, encounter or improve
product and services to take advantage of curtain markets ((Reynolds P. , 2007).
As compared to exploitation which is the process in which business people actually work
on the business idea by acquiring resource and entering or creating a new market
(Coombes, 2006). Recent theoretical models of entrepreneurship identity have proposed
strong links between entrepreneur’s self-concepts and subsequent outcomes (shepherd &
Haynie, 2009). From various experiment it’s not clear why self-identities motivate
entrepreneurial action. However studies suggest that business men have a strong sense of
self (Hoang H. a., 2003)and that they tend to see themselves as an out-group different
from non-entrepreneurs, this stream of work shows that entrepreneurs themselves
strongly distinguish there role from other social roles and have a distinct perceptions
about self-meaning associated with the role. For example (Appelbaum, 2007) interviewed
technological entrepreneurs to develop conceptions of the innovative process based on the
social and subjective self. They stated how the entrepreneur view of himself as an
entrepreneur and innovator influenced their actions in various ways.
2.4.1Discoveryof Information
Discovery information accessibility has been the key to many people in search business
idea or new market, this information helps them understand the gaps in the market which
present opportunities for business. This is information may havebeen availed through past
research or feedbacks Stanley (2010).
Access to Information by business people through the Information and communication
technologies (ICT) platforms has been identified as one of the areas that need attention
both from the government and business service providers if the SME sector is to achieve
any innovative strategies. Businessmen in Africa operate in a poor information
environment due to lack of adequate support services and poor information technological
infrastructures (Hussain, 2012). Technology accessibility has not been given the same
attention as other constraints to the innovativeness of SMEs.
17
The emergence of technology particularly the internet has allowed small and medium
enterprises to compete effectively and efficiently locally and internationally (UNDP,
2010). Technology plays an important role in the field of business and commerce
nowadays. As the developing countries struggles with keeping pace with emerging
technologies the developed world are forging ahead with E-transformation of businesses.
In an ever challenging global society effective use of technology has become crucial for
innovative success of businesses especially the SMEs despite the high numbers of
acquisition by large organizations. The adoption of technology by big co-operation is not
evident in SMEs clearing the fact that SME faces significant and unique challenges in
adopting Technology (Sabir R.I & Sabir, 2012).
According to a study of e-commerce in china it was found that many important barriers to
e-commerce adoption which include; High cost of Internet access, limited diffusion of
computers and lack of online payment processes were identified to directly inhibit e-
commerce. According to (Cooray, 2013) inadequate transportation and delivery networks,
uncertain tax rule and limited availability of banking services indirectly inhibite-
commerce. (Cloete, 2012)studied that SME adoption of e-commerce is heavily influenced
by factors within the organization. Other factors that hindered the adoption were Lack of
access to computer software’s, computers, hardware’s and telecommunications at a
reasonable price.
According to (Thomala, 2010) in his study on perception of SMEs regarding to
contributors of failure of this sector in south African found out that it is an important issue
that businesses be properly marketed to make their products to be visible. He argued that
it was imperative for SMEs to improve the way they marketed their products as it was
indicated by a response carried out which indicated that 65.8% agreed that businesses
collapse because of poor product marketing. He also observed that the findings confirmed
that Gbadamosi (2006:4)(q.t) found on SMEs limited market capacity that the economic
power of many of these SMEs are small, hence they mostly serve their localities and its
environment.
(Francis, 2010)acknowledge that small and medium enterprises are important in
economies in Africa especially in respect to employment. The globe poses ever increasing
18
challenges but with the growth of technology some of these challenges will be easily
solve if not completely eliminated.
There is a persistent need to connect most enterprises in most parts of Africa with foreign
investors to speed up technology upgrade. There is a division between the urban and rural
because of lack of infrastructure in the rural areas such as electricity which make it
impossible for this small enterprise to access internet. Thus technological change which
was meant to bring change to the small and medium enterprises in the rural area is not
able to make the change due to these limitations (saunders Gray & Goregaokar, 2014).
Based on the Kenya government (2012) the policy on the use of technology in the
creation of goods and services is to encourage the application of it to minimize waste,
create possibilities of recycling and use of local and renewable materials. Although this
policies appears explicit, it is not clear as to which government intervention or policy
measures have intended to affect the manner in which SMEs choice the technology to
use.
Just like current identities possible selves have been used to successful predict behavioral
outcome related to those selves.Vandellen & Hoyle, 2008 noted that desired future self-
image affect behavior most strongly when they are important and meaningful to the
individual by activating the process of self-regulation. Particularly more possible as we
have discovered, desired future and self-images affect the behavior more strongly when
they are more meaningful and important to the individual by activating a process of self-
regulation. More particularly the possible selves implicated in the three types of
anticipatory self-regulatory functions (Higgins,2000) that functions through a
comparison-adjusted process by providing information about what will happen if a person
behaves or may fail to behave in a curtain way or becomes a different kind of a person,
providing information concerning a person’s likely to experience when engaging in some
activity or an objective and providing responses and feedback information about how a
person is doing in relation to undesired or desired outcome.
19
2.5How does Exploitation affect the Adoption of Innovative Strategies?
Exploitation on the other hand is the process in which business people actually work on
the business idea by acquiring resource and entering or creating a new market (Coombes,
2006). Recent theoretical models of entrepreneurship identity have proposed strong links
between entrepreneur’s self-concepts and how they exploit an idea (shepherd & Haynie,
2009). From various experiment it’s not clear why self-identities motivate entrepreneurial
action. However studies suggest that business men have a strong sense of exploiting a
business idea (Hemingway, 2005) and that they tend to see themselves as an out-group
different from non-entrepreneurs, this stream of work shows that entrepreneurs
themselves strongly distinguish there role from other social roles and have a distinct
perceptions about self-meaning associated with their role as executors of a business idea.
For example Hellstrom and Berglund (2002) interviewed technological entrepreneurs to
develop conceptions of the innovative process based on the social and subjective self.
They stated how the entrepreneur view of himself as an entrepreneur and how innovation
influences how he is able to exploit a business idea (Hemingway, 2002).
2.5.1Prior Entrepreneurial Experience
Prior start-up experience in starting one’s own firm mostly generates a positive effect on
how the entrepreneur is able to execute the business. Davidson and Honig 1997 found out
that previous experience in starting own firm typically generate a positive effects on the
startup stage of business which determines the level at which the business will grow to.
He also found out that previous entrepreneurship experience was positively related to the
probability of entering into a new business and making progress in exploiting the
opportunity.Similary entrepreneur experience also allows individuals to identify various
opportunities and exploit more innovative opportunities.
The belief that past start-up experience provides tacit, familiarity of the role, social
networks and explicit knowledge that can help turn entrepreneur motivation into action
and be able to exploit a business idea. We are of the opinion that interaction effect
existing between past experience and motivation of the entrepreneur brings about growth
in the business and the person is able to build on the business idea faster and easier
(Hemingway,2002). Specifically we suggest that individuals equipped with more
experience in the identifying an idea and actualizing it would benefit more from this
20
experience, this effect will be stronger when it’s pared with strong entrepreneur identity
aspiration, this is the case because past experience is about what an entrepreneur can do
and identity is based on the willingness of the entrepreneur to do it.
The most considerable effect would occur when an individual has what it takes to engage
well in an enterprise and is also interested in doing it as well these results to a successful
exploitation of the business which at the end results into strategic innovation and positive
progress in the business (Callero, 2007). However several sociological and psychological
mechanisms could be at work to produce this effect. First past experience suggest
individual learning within the entrepreneurial process have the opportunity to learn from
the mistakes they have made in the past and avoid to repeat them in the future With this
prial knowledge they may have what it take to exploit a business idea to the fullest and
avoiding setbacks on the way(Callero, 2007).
Example from Alsos and kolvereid (1998) found that experienced entrepreneurs tend to
carry out earlier adjustments than other without this experience doing it for the first time.
Second prior entrepreneur experience provide role familiarity which easily facilitate into
the role of an entrepreneur (Macmillan, 1986). Third the past entrepreneurial experience
strengthens the identity aspiration behavior which is linked through social ties from past
startup involvement to the full maturity of the business. This type of network not only
offers direct support for exploitation and discovery activities but also create a better off
social context for an individual to receive feedback and identity validation, thereby
strengthening and increasing the frequency of role behavior’s that are possibly associated
with entrepreneur exploit capability.
2.5.2 Exploit of Entrepreneur aspiration
Entrepreneur aspiration is concerned with something desired but not currently possessed
by an individual. In entrepreneurship aspiration first we ask ourselves when an
entrepreneur stops being an entrepreneur. Another author looks at one possible view of
entrepreneurship and the starting and running own firm. The view define them as business
owner implying that the moment one ceases that activity related to business ownership
the person will stop being an entrepreneur(Davidsson, 2005).
21
This implies that an established entrepreneur will become less important to such
individuals as identity validation diminishes. Secondly since individuals usually move in
and out of roles they refocus their energies on other different aspect of their lives (Carroll
1998), If someone with prior startup experience had acquired an entrepreneurial identity,
when does she or he no longer possess it? Hoang (1997) propose that dormant
characteristic are those where the self –character remains but it becomes less important
than other characters of an individual.
Those with entrepreneur aspiration but who are not the current owners of the business
will most likely abandon the entrepreneur identity or have a dormant one that is relatively
unimportant. In both cases the entrepreneur self is unrealized and so the aspiration to be
an entrepreneur is potentially meaningful even for those with past entrepreneurial
experience (Carroll 1998). Taking this into thought we propose that having prior start-up
experience coupled with strong entrepreneur identity aspiration would result in greater
involvement in gestational events that would either predictor taken alone.
2.5.3 Exploitation of entrepreneurs Innovation
The relationship between exploit and innovation is on the way business people execute
their business acquiring resources and entering into a new market. It’s through innovation
that this business people stand out of the park by using innovative strategies (Coombes,
2006).
Innovation can be defined as the introduction of a new good, new quality of a good; the
introduction of a new method of producing goods; the opening of a new market
opportunity; the conquest of a new source of supply of raw materials and partially
manufactured goods; or the application of a new form of organization in any industry,
such as the creation or breaking up of a monopoly position Schumpeter (2006).
Innovation in the aspect of exploitation has been looked at as the ability of a new business
to adapt to changes in the environment that affect their market, production, change of
price or customers, business that are able to make this changes are often perceive to be
business that are well exploited.
The model of entrepreneurial exploitation recently offered by Cardon et al. (2009)
specifically identifies the relationship between the exploitation process and innovation
especially through the way business people persist through challenges and are committed
22
to the business venture, this set of attitude results into innovation as they try to make
changes to adopt to the new business environment.
Many businesses know that the primary guarantee of a firm to stand out and grow is
established during exploitation stage, Thornhill (2006) made a suggestion that effective
exploitation of a business inline to innovation is key to developing a business to success
as it helps these enterprises to be competitive advantage and increase in profitability
(Reynold, 2010). Heunks (2001) defines success as any sign of economic profitability like
growth, increase productivity and profit as ingredients that are need for an organization to
be termed innovative.
The results of Steven M. Farmer (2006) showed that innovation and exploitation plays an
important role for forming a link between human capital, organizational capital, Exploit
and Discovery as it acts as the final outcome of entrepreneurs when they have maximally
utilized the human and organization capital have sort and executed there business
effectively.
The relationship between exploitation and innovation is based on the skill processed by a
person who is either acquired through experience or through trainings, this skill enable an
individual to be more innovative in solving business challenges. Baldwin and Johnson
(1999) stated that the introduction of innovation into the exploitation of a business is both
an important part of innovation strategy in small and medium enterprises. They further
stated that firms managed by individuals with less experience or who lack formal
education have shown to be less innovative (Hoang H. &., 2012). According to Romano
(1998) must owners of small business often lack the type of training or education that is
connected to innovative activities? This lack of skills prevents small firms from
transforming the knowledge of customers into new products and services. This challenge
is commonly experienced during the exploitation of a business.
The study by Koellinger (2008) showed that educational background of managers,
entrepreneurs and owners of the business have shown to be more important factors in the
innovativeness of small businesses. Thornhill (2006) study went ahead and interviewed
845 Canadian innovative firms and demonstrated that there is a positive relationship
between individual knowledge, training and experience which are attributes of a person
running the business and innovations. Similarly Koskinen and Vanharanta (2002) also
23
determined that knowledge, learning and experience gained in the enterprise can play an
important role in making the business thrive and innovative.
Penrose (2001) indicated that the idea of a business innovativeness being influenced by
exploitation is not a new concept. The more the business owner stocks up his experience
in running the business the more innovative it will be and the competitive it will be to its
rivals (Brown et al, 2005). When people engage in businesses, those who invest more in
themselves as business owners are more likely to evolve and enjoy their companies that
those who invested in less of themselves(Callero, 2007).
There is a great argument about how exploitation increases business innovativeness. First
the owners self-experience and knowledge acquired makes it easier for him to identify
and exploit business opportunities that are not easily noticeable by others (Verheul,
2013). Second his knowledge can be used as a planning strategy and risk mitigation
strategy that in turn can positively affect the business success. Thirdly knowledge from
the businessman can be used to add more resources such as financial, physical capital and
market share. Finally micro-enterprises owners with higher exploitation capabilities tend
to achieve a greater profitability as compared to those with less (Honig, 1998). Cantner et
al (2010) argues that all employees have specific knowledge and competence they have
acquired through their past experience and training which contributes to their value as
businessmen.
2.6 Chapter Summary
This chapter reviewed literature in relation to the factors that influence the adoption of
innovation strategies on small and medium enterprises in Kenya. The first section of the
literature review looked at the extent to which Human capital influence the adoption of
innovation strategies on SMEs in Kenya. The second section looked at how
Organizational capital influences the adoption of innovative strategies on SMEs in Kenya.
The third section looked at how the discovery of a business idea influences the adoption
of innovative strategies on SMEs in Kenya and the fourth section looked at how
exploitation of a business venture influences the adoption of innovative strategies on
SMEs in Kenya. The next chapter will discuss the research methodology that was used in
this project.
24
CHAPTER THREE
3.0 RESEARCH METHODOLGY
3.1 Introduction
The chapter gives an explanation on the design used the methodology employed and the
population targeted and a justification of using the research design. It also describes the
type and source of data and the characteristic of the population used in the study and the
technique used to obtain the sample, the procedures and description of the sample method
used, procedure of data collection and collecting instruments. Finally it describes how
data was collected and the appropriate data analysis methods which was used to obtain
the data.
3.2 Research Design
It refers to the overall strategy that is chosen to integrate the different components of the
study in a logical and coherent way, to ensure that one addresses research problem
effectively (Saunders, 2012). The design provides the framework for evidence generation
that is suited to a certain criteria and to the research question in which the investigator is
interested in. The study useddescriptive research design a scientific method involving
watching and portraying the conduct of a subject without affecting it in any capacity.
According to Creswell (2012) state that a descriptive research design is used if the data
collected is to describe a person, organizations, settings and phenomena. The design used
it because it helped the researcher to obtain information concerning the status of
phenomena. The design helped the research observe and describe the behavior of the
subject under study without influencing it and therefore considering descriptive research
as most appropriate for the study.
3.3 Population and Sampling Design
3.3.1 Population
Neuman (2010) refers to population as a group of people or study subject which is similar
in one way or more and which forms a subject of the study in a particular way. According
to registrar of companies the registered business in Kiambu town are 637 which represent
the target population in this area.
25
3.3.2 Sampling Design
A stratified sampling technique was used to ensure that certain sub-groups in the
population were well represented in the sample population. Stratified technique refers to
as the process of selecting a sample in such a way that identified subgroups are
represented in the sample in the same proportion as they exist in the population
patton(2012). The population was divided into homogenous sub-groups known as strata,
from each stratum a random sample was selected randomly which eventually is combined
with other strata to represent the population.
3.3.2.1 Sampling Frame
From the 637 owned SMEs a sample size of 64was chosen from the population which
represented 10% of the target population.
3.3.2.2 Sampling Technique
A sampling technique involves the procedure of selecting a sample from a population.
(Schindler, 2010). The researcher used stratified random sampling. The technique ensured
that different groups to be adequately represented in the sample result. The method was
cost effective and consumed less time as compared to other sampling designs.
Respondents were selected using their type of business they run. The activity was
followed by picking of one respondent after the other systematically starting with sole
proprietor, followed by the one with partnership then followed by family owned and
finally others proportionate to the stratum sample size. The selected respondents from
each station were summed up to form the total sample size.
3.3.2.3 Sample Size
The sample size is a tinier set of the bigger populace (Schindler, 2010). It must be keenly
chosen to be an agent of the populace and the requirement for the researcher to guarantee
that the subdivisions involved in the examination are precisely catered for. The research
had a sample size of 64 small and medium enterprises. This sample size is believed to be
26
large enough to provide the data required for this research. This is indicated in the table
below
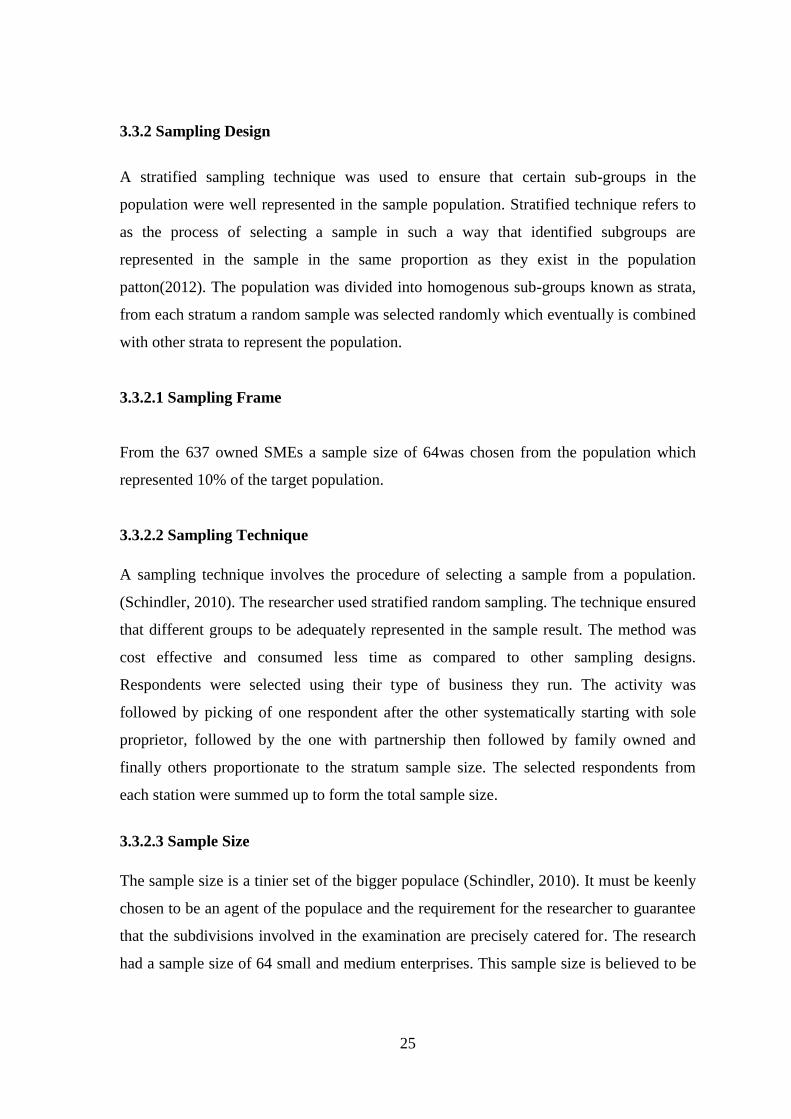
Table 3.1 Sample Distribution
3.4 Data Collection Methods
Datawas collected using questionnaires and personal interviews. Questionnaires are a pre-
planned set of questions designed to give a specific type of information to meet the need
of the researcher. The structure of the questioner was linkert structure. The reason for
using questionnaires is they focus directly on the issue of the research and can be used to
collect more data and can also be sent on mail to respondents or use the services of a
research assistant to take to the respondents.
3.5 Research Procedure
A pilot test included 6 respondents wasdone to assess the accuracy of the questionnaires.
The respondents were not part of the actual sample. This guaranteed the reliability of the
information gathering instruments utilized. Based on the feedback from the six
respondents, the necessary changes were done on the questionnaire and the final
questionnaire prepared for collection of data. The researcher sought permission from the
county council to conduct the research supported by an introductory letter from the
university indicating the purpose of collecting the research. Upon authorization of the
questionnaires they were disseminated to the respondents with the help of
Category Target Population Sample Size
Sole Proprietorship 265 22
Partnership 187 18
Family Owned 101 10
Others 84 14
Total 637 64
27
researchassistance who helped in enhancing the speed of data collection. The respondents
were given two days to complete the questionnaire and a reminder sent via text message
to remind those who hadn’t filled the questionnaires. The questionnaires were then
collected after the two days and a sequential number given to each questionnaire
3.6 Data Analysis Methods
(Levine, 2010) states that data analysis methods help to describe facts, detect patterns,
develop explanations, and test hypotheses. This study being descriptive used descriptive
statistics including frequencies, percentages, mean, standard deviation, as well as use of
inferential statistics like regression to analyse data. Statistical Package for Social Sciences
(SPSS) programming was used to analyze data for this study. The finding of the study
was presented in tables, charts, and graphs. This was used to organize, summarize, and
present the analysed data enabling the researcher to meaningfully describe distribution of
measurements (Schindler, 2010). The data was also explained and presented using tables,
frequencies, percentages, bar and pie charts. Apart from the pre-testing of questionnaires,
the researcher applied the Pearson Product Moments Coefficient of Correlation, Analysis
of Variance and Chi-square tests to ascertain validity and reliability of the research data.
3.7 Chapter Summary
The chapter indicates why the research design was appropriate for the collection,
interpretation and analysis of the obtained data. It also shows the questionnaire that was
used for primary data collection and how they were distributed with the help of a research
assistant. The use of Excel and Spss to analyses the returned questionnaires.
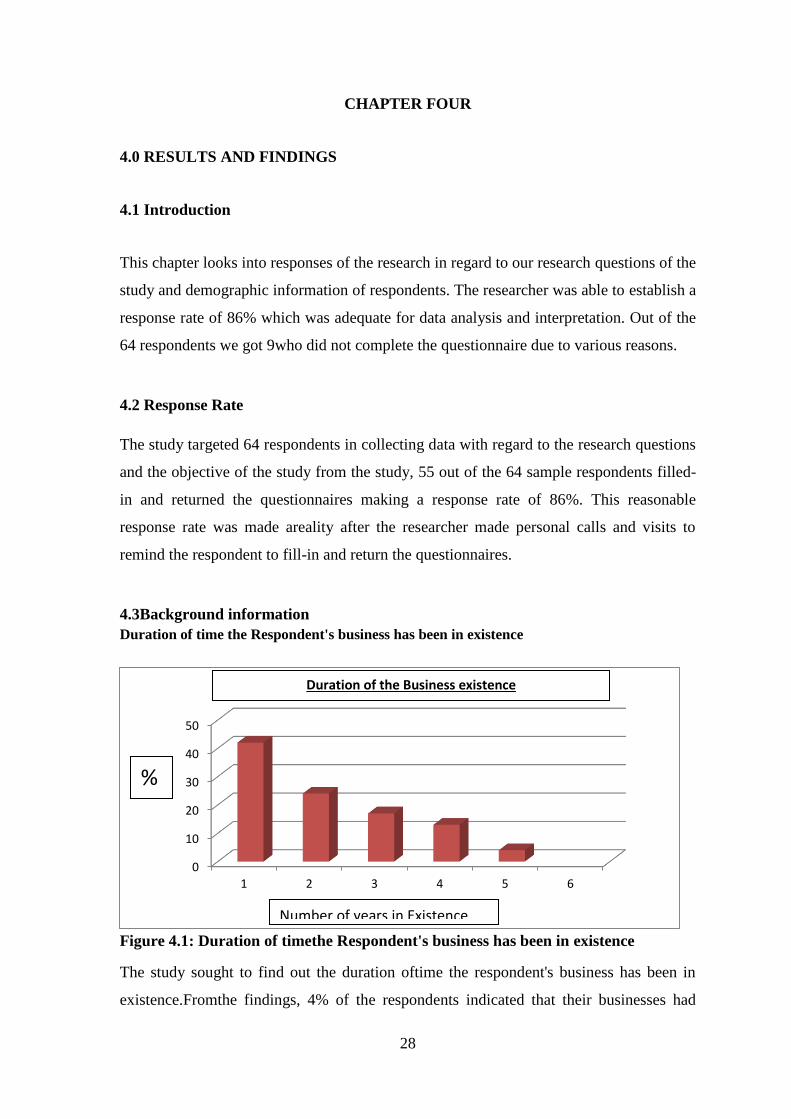
28
CHAPTER FOUR
4.0 RESULTS AND FINDINGS
4.1 Introduction
This chapter looks into responses of the research in regard to our research questions of the
study and demographic information of respondents. The researcher was able to establish a
response rate of 86% which was adequate for data analysis and interpretation. Out of the
64 respondents we got 9who did not complete the questionnaire due to various reasons.
4.2 Response Rate
The study targeted 64 respondents in collecting data with regard to the research questions
and the objective of the study from the study, 55 out of the 64 sample respondents filled-
in and returned the questionnaires making a response rate of 86%. This reasonable
response rate was made areality after the researcher made personal calls and visits to
remind the respondent to fill-in and return the questionnaires.
4.3Background information
Duration of time the Respondent's business has been in existence
Figure 4.1: Duration of timethe Respondent's business has been in existence
The study sought to find out the duration oftime the respondent's business has been in
existence.Fromthe findings, 4% of the respondents indicated that their businesses had
0
10
20
30
40
50
1 2 3 4 5 6
Duration of the Business existence
Number of years in Existence
%
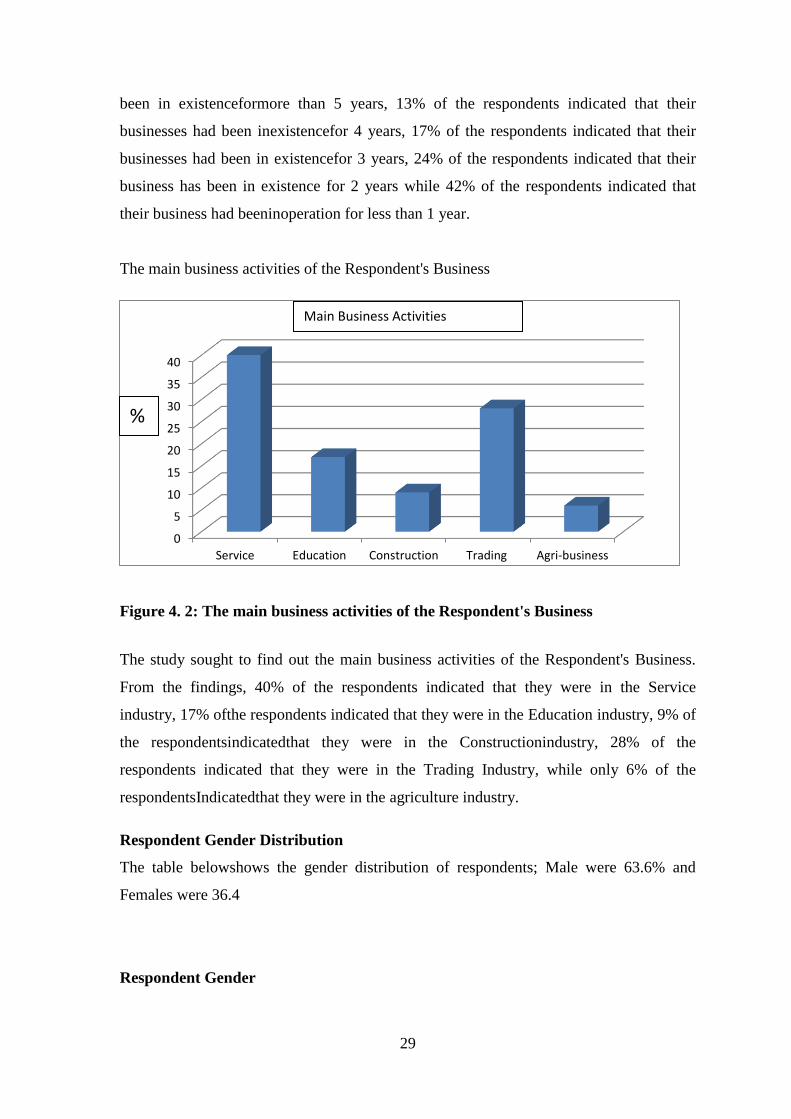
29
been in existenceformore than 5 years, 13% of the respondents indicated that their
businesses had been inexistencefor 4 years, 17% of the respondents indicated that their
businesses had been in existencefor 3 years, 24% of the respondents indicated that their
business has been in existence for 2 years while 42% of the respondents indicated that
their business had beeninoperation for less than 1 year.
The main business activities of the Respondent's Business
Figure 4. 2: The main business activities of the Respondent's Business
The study sought to find out the main business activities of the Respondent's Business.
From the findings, 40% of the respondents indicated that they were in the Service
industry, 17% ofthe respondents indicated that they were in the Education industry, 9% of
the respondentsindicatedthat they were in the Constructionindustry, 28% of the
respondents indicated that they were in the Trading Industry, while only 6% of the
respondentsIndicatedthat they were in the agriculture industry.
Respondent Gender Distribution
The table belowshows the gender distribution of respondents; Male were 63.6% and
Females were 36.4
Respondent Gender
0
5
10
15
20
25
30
35
40
Service Education Construction Trading Agri-business
Main Business Activities
%
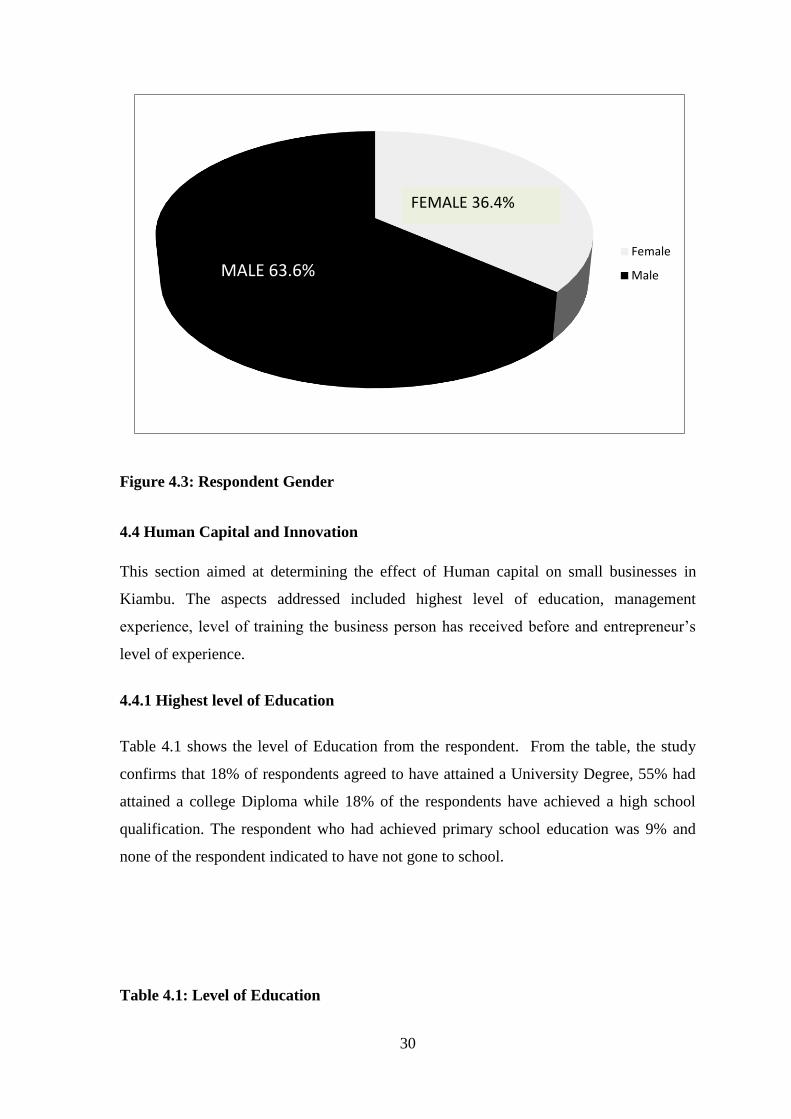
30
Figure 4.3: Respondent Gender
4.4 Human Capital and Innovation
This section aimed at determining the effect of Human capital on small businesses in
Kiambu. The aspects addressed included highest level of education, management
experience, level of training the business person has received before and entrepreneur’s
level of experience.
4.4.1 Highest level of Education
Table 4.1 shows the level of Education from the respondent. From the table, the study
confirms that 18% of respondents agreed to have attained a University Degree, 55% had
attained a college Diploma while 18% of the respondents have achieved a high school
qualification. The respondent who had achieved primary school education was 9% and
none of the respondent indicated to have not gone to school.
Table 4.1: Level of Education
Female
MaleMALE 63.6%
FEMALE 36.4%
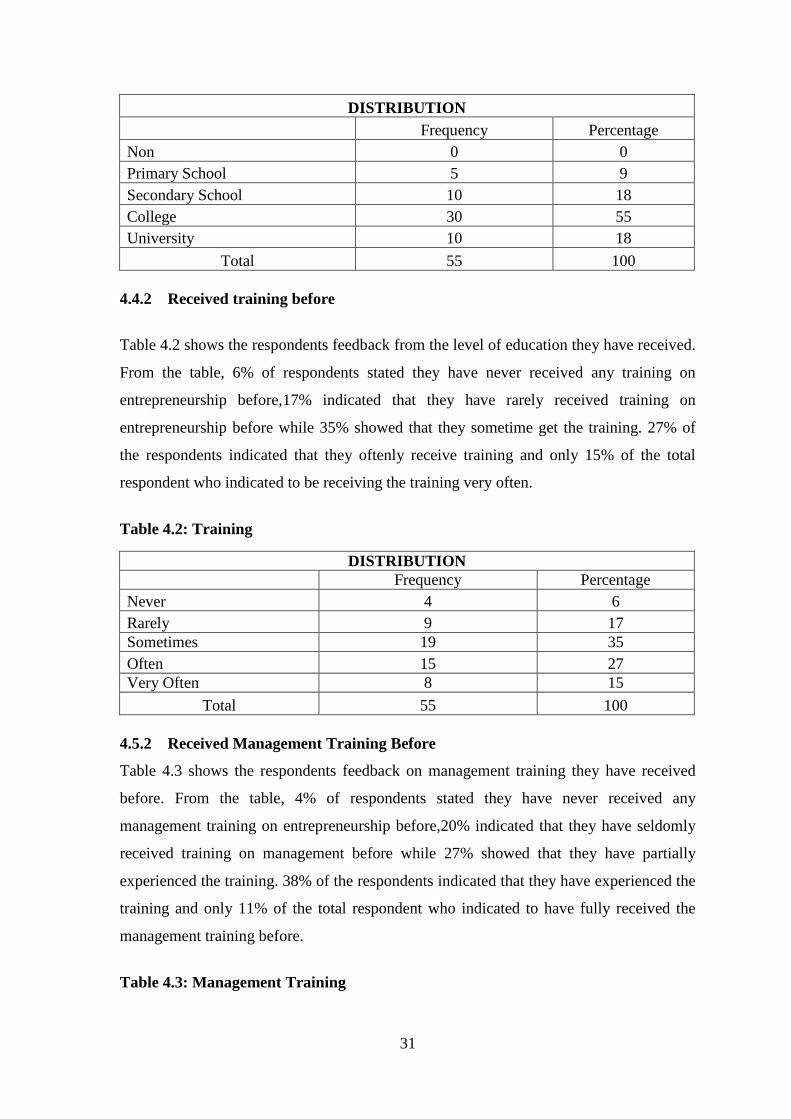
31
DISTRIBUTION
Frequency Percentage
Non 0 0
Primary School 5 9
Secondary School 10 18
College 30 55
University 10 18
Total 55 100
4.4.2 Received training before
Table 4.2 shows the respondents feedback from the level of education they have received.
From the table, 6% of respondents stated they have never received any training on
entrepreneurship before,17% indicated that they have rarely received training on
entrepreneurship before while 35% showed that they sometime get the training. 27% of
the respondents indicated that they oftenly receive training and only 15% of the total
respondent who indicated to be receiving the training very often.
Table 4.2: Training
DISTRIBUTION
Frequency Percentage
Never 4 6
Rarely 9 17
Sometimes 19 35
Often 15 27
Very Often 8 15
Total 55 100
4.5.2 Received Management Training Before
Table 4.3 shows the respondents feedback on management training they have received
before. From the table, 4% of respondents stated they have never received any
management training on entrepreneurship before,20% indicated that they have seldomly
received training on management before while 27% showed that they have partially
experienced the training. 38% of the respondents indicated that they have experienced the
training and only 11% of the total respondent who indicated to have fully received the
management training before.
Table 4.3: Management Training
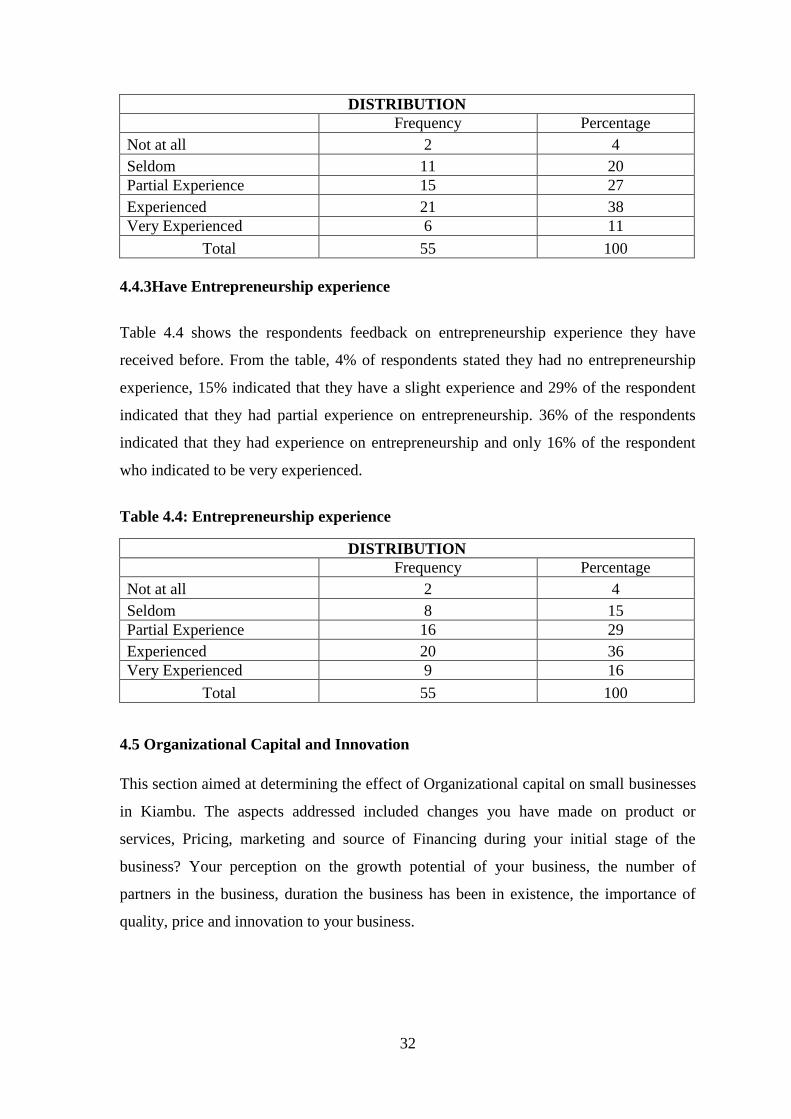
32
DISTRIBUTION
Frequency Percentage
Not at all 2 4
Seldom 11 20
Partial Experience 15 27
Experienced 21 38
Very Experienced 6 11
Total 55 100
4.4.3Have Entrepreneurship experience
Table 4.4 shows the respondents feedback on entrepreneurship experience they have
received before. From the table, 4% of respondents stated they had no entrepreneurship
experience, 15% indicated that they have a slight experience and 29% of the respondent
indicated that they had partial experience on entrepreneurship. 36% of the respondents
indicated that they had experience on entrepreneurship and only 16% of the respondent
who indicated to be very experienced.
Table 4.4: Entrepreneurship experience
DISTRIBUTION
Frequency Percentage
Not at all 2 4
Seldom 8 15
Partial Experience 16 29
Experienced 20 36
Very Experienced 9 16
Total 55 100
4.5 Organizational Capital and Innovation
This section aimed at determining the effect of Organizational capital on small businesses
in Kiambu. The aspects addressed included changes you have made on product or
services, Pricing, marketing and source of Financing during your initial stage of the
business? Your perception on the growth potential of your business, the number of
partners in the business, duration the business has been in existence, the importance of
quality, price and innovation to your business.
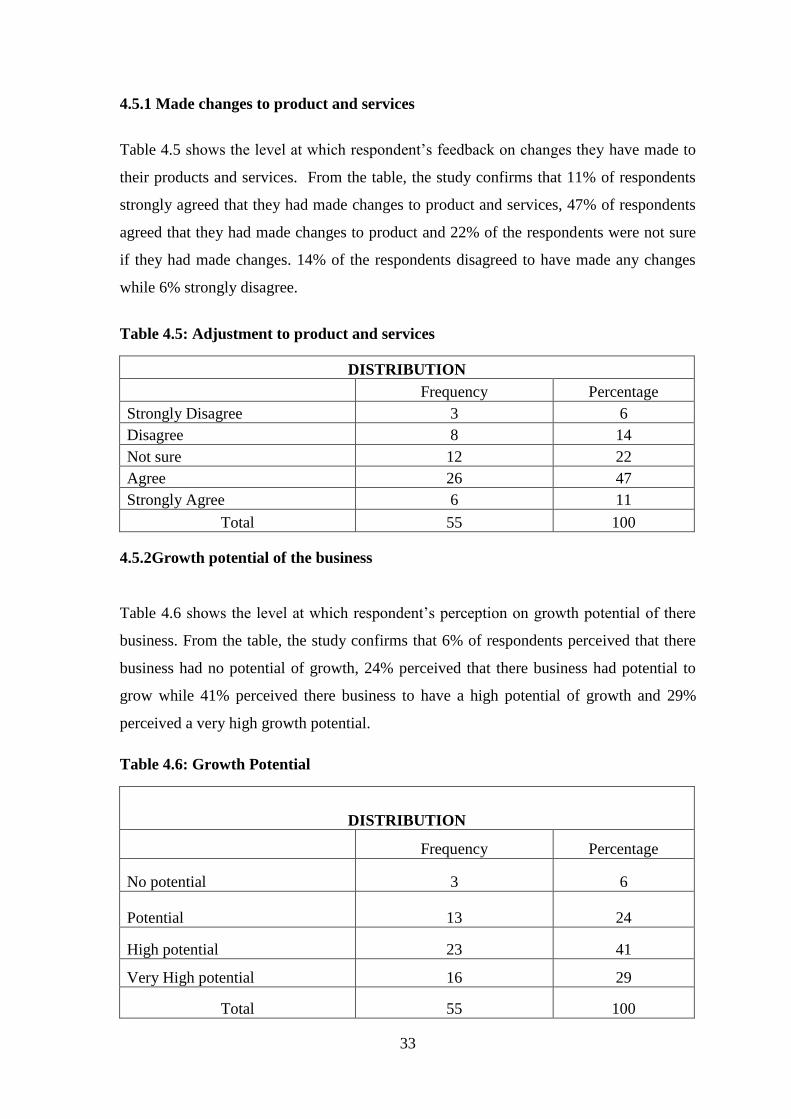
33
4.5.1 Made changes to product and services
Table 4.5 shows the level at which respondent’s feedback on changes they have made to
their products and services. From the table, the study confirms that 11% of respondents
strongly agreed that they had made changes to product and services, 47% of respondents
agreed that they had made changes to product and 22% of the respondents were not sure
if they had made changes. 14% of the respondents disagreed to have made any changes
while 6% strongly disagree.
Table 4.5: Adjustment to product and services
DISTRIBUTION
Frequency Percentage
Strongly Disagree 3 6
Disagree 8 14
Not sure 12 22
Agree 26 47
Strongly Agree 6 11
Total 55 100
4.5.2Growth potential of the business
Table 4.6 shows the level at which respondent’s perception on growth potential of there
business. From the table, the study confirms that 6% of respondents perceived that there
business had no potential of growth, 24% perceived that there business had potential to
grow while 41% perceived there business to have a high potential of growth and 29%
perceived a very high growth potential.
Table 4.6: Growth Potential
DISTRIBUTION
Frequency Percentage
No potential 3 6
Potential 13 24
High potential 23 41
Very High potential 16 29
Total 55 100
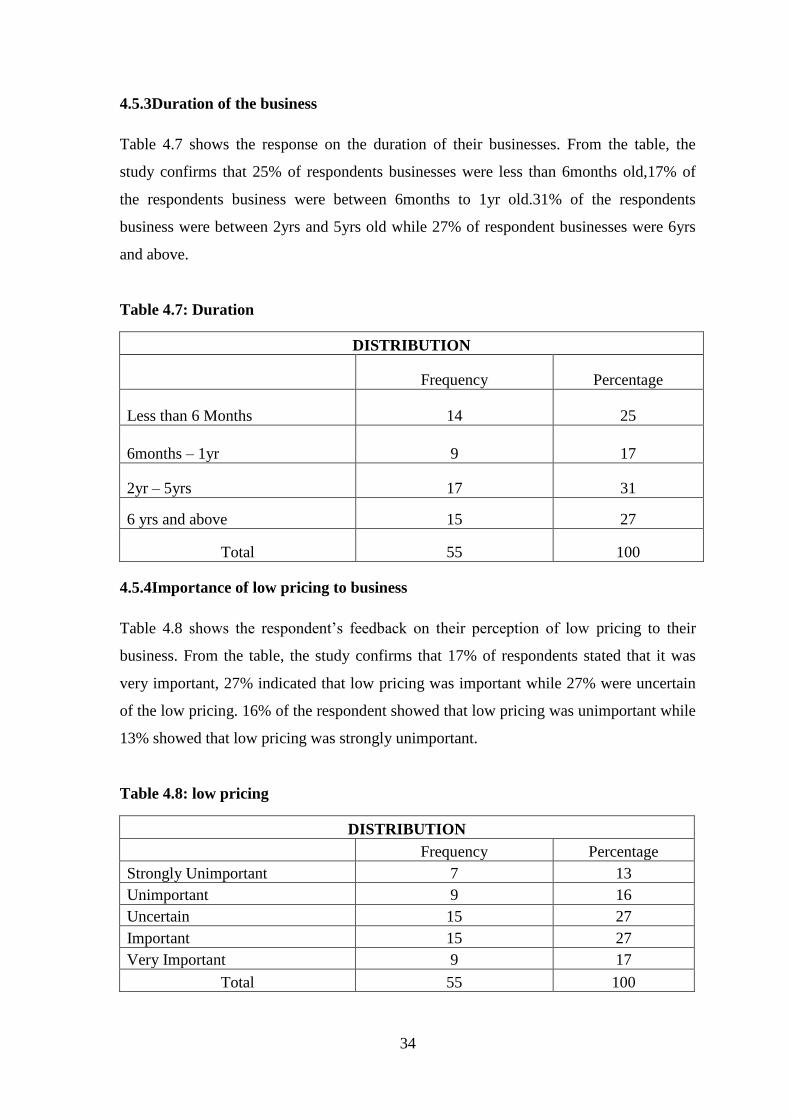
34
4.5.3Duration of the business
Table 4.7 shows the response on the duration of their businesses. From the table, the
study confirms that 25% of respondents businesses were less than 6months old,17% of
the respondents business were between 6months to 1yr old.31% of the respondents
business were between 2yrs and 5yrs old while 27% of respondent businesses were 6yrs
and above.
Table 4.7: Duration
DISTRIBUTION
Frequency Percentage
Less than 6 Months 14 25
6months – 1yr 9 17
2yr – 5yrs 17 31
6 yrs and above 15 27
Total 55 100
4.5.4Importance of low pricing to business
Table 4.8 shows the respondent’s feedback on their perception of low pricing to their
business. From the table, the study confirms that 17% of respondents stated that it was
very important, 27% indicated that low pricing was important while 27% were uncertain
of the low pricing. 16% of the respondent showed that low pricing was unimportant while
13% showed that low pricing was strongly unimportant.
Table 4.8: low pricing
DISTRIBUTION
Frequency Percentage
Strongly Unimportant 7 13
Unimportant 9 16
Uncertain 15 27
Important 15 27
Very Important 9 17
Total 55 100
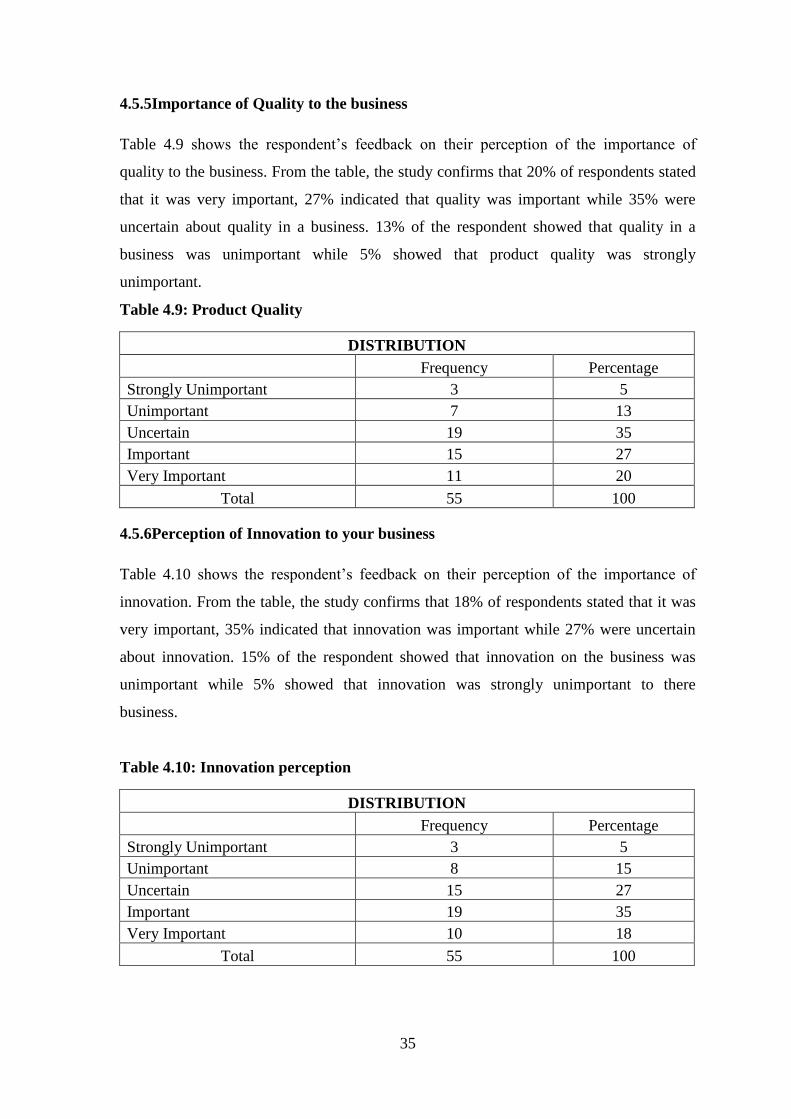
35
4.5.5Importance of Quality to the business
Table 4.9 shows the respondent’s feedback on their perception of the importance of
quality to the business. From the table, the study confirms that 20% of respondents stated
that it was very important, 27% indicated that quality was important while 35% were
uncertain about quality in a business. 13% of the respondent showed that quality in a
business was unimportant while 5% showed that product quality was strongly
unimportant.
Table 4.9: Product Quality
DISTRIBUTION
Frequency Percentage
Strongly Unimportant 3 5
Unimportant 7 13
Uncertain 19 35
Important 15 27
Very Important 11 20
Total 55 100
4.5.6Perception of Innovation to your business
Table 4.10 shows the respondent’s feedback on their perception of the importance of
innovation. From the table, the study confirms that 18% of respondents stated that it was
very important, 35% indicated that innovation was important while 27% were uncertain
about innovation. 15% of the respondent showed that innovation on the business was
unimportant while 5% showed that innovation was strongly unimportant to there
business.
Table 4.10: Innovation perception
DISTRIBUTION
Frequency Percentage
Strongly Unimportant 3 5
Unimportant 8 15
Uncertain 15 27
Important 19 35
Very Important 10 18
Total 55 100
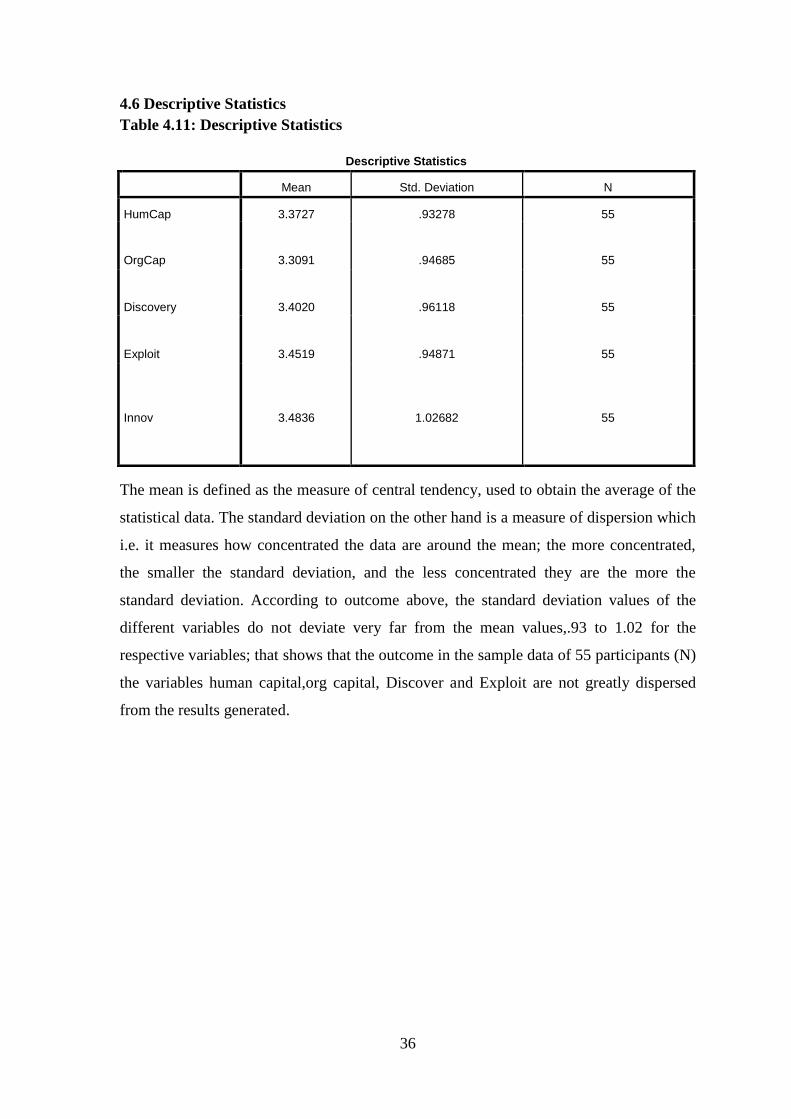
36
4.6 Descriptive Statistics
Table 4.11: Descriptive Statistics
Descriptive Statistics
Mean Std. Deviation N
HumCap 3.3727 .93278 55
OrgCap
3.3091
.94685
55
Discovery
3.4020
.96118
55
Exploit
3.4519
.94871
55
Innov 3.4836 1.02682 55
The mean is defined as the measure of central tendency, used to obtain the average of the
statistical data. The standard deviation on the other hand is a measure of dispersion which
i.e. it measures how concentrated the data are around the mean; the more concentrated,
the smaller the standard deviation, and the less concentrated they are the more the
standard deviation. According to outcome above, the standard deviation values of the
different variables do not deviate very far from the mean values,.93 to 1.02 for the
respective variables; that shows that the outcome in the sample data of 55 participants (N)
the variables human capital,org capital, Discover and Exploit are not greatly dispersed
from the results generated.
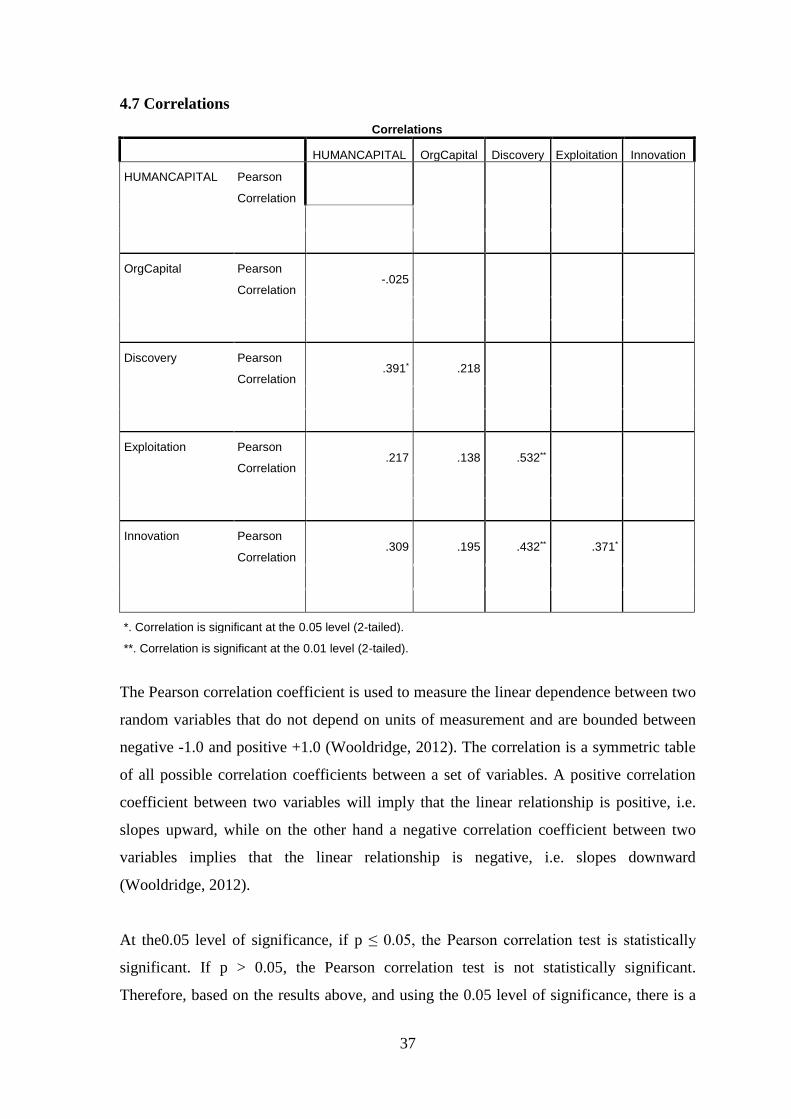
37
4.7 Correlations
Correlations
HUMANCAPITAL OrgCapital Discovery Exploitation Innovation
HUMANCAPITAL Pearson
Correlation
OrgCapital Pearson
Correlation -.025
Discovery Pearson
Correlation .391* .218
Exploitation Pearson
Correlation .217 .138 .532**
Innovation Pearson
Correlation .309 .195 .432** .371*
*. Correlation is significant at the 0.05 level (2-tailed).
**. Correlation is significant at the 0.01 level (2-tailed).
The Pearson correlation coefficient is used to measure the linear dependence between two
random variables that do not depend on units of measurement and are bounded between
negative -1.0 and positive +1.0 (Wooldridge, 2012). The correlation is a symmetric table
of all possible correlation coefficients between a set of variables. A positive correlation
coefficient between two variables will imply that the linear relationship is positive, i.e.
slopes upward, while on the other hand a negative correlation coefficient between two
variables implies that the linear relationship is negative, i.e. slopes downward
(Wooldridge, 2012).
At the0.05 level of significance, if p ≤ 0.05, the Pearson correlation test is statistically
significant. If p > 0.05, the Pearson correlation test is not statistically significant.
Therefore, based on the results above, and using the 0.05 level of significance, there is a
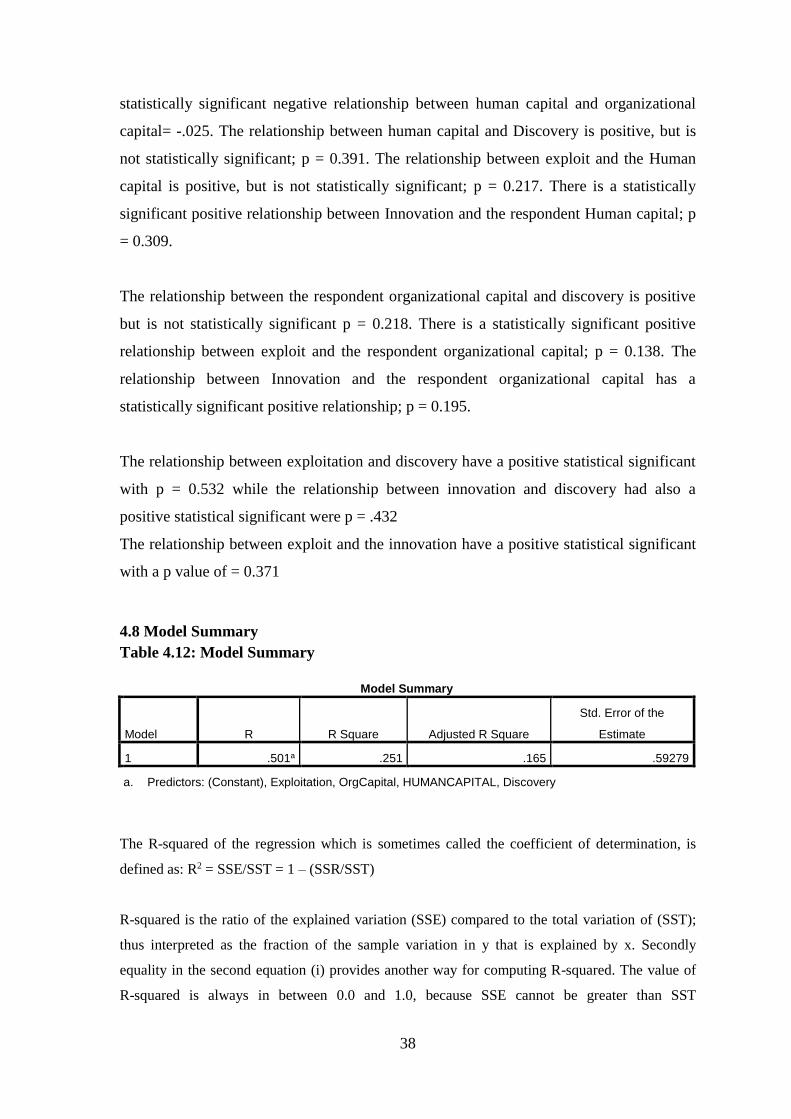
38
statistically significant negative relationship between human capital and organizational
capital= -.025. The relationship between human capital and Discovery is positive, but is
not statistically significant; p = 0.391. The relationship between exploit and the Human
capital is positive, but is not statistically significant; p = 0.217. There is a statistically
significant positive relationship between Innovation and the respondent Human capital; p
= 0.309.
The relationship between the respondent organizational capital and discovery is positive
but is not statistically significant p = 0.218. There is a statistically significant positive
relationship between exploit and the respondent organizational capital; p = 0.138. The
relationship between Innovation and the respondent organizational capital has a
statistically significant positive relationship; p = 0.195.
The relationship between exploitation and discovery have a positive statistical significant
with p = 0.532 while the relationship between innovation and discovery had also a
positive statistical significant were p = .432
The relationship between exploit and the innovation have a positive statistical significant
with a p value of = 0.371
4.8 Model Summary
Table 4.12: Model Summary
Model Summary
Model R R Square Adjusted R Square
Std. Error of the
Estimate
1 .501a .251 .165 .59279
a. Predictors: (Constant), Exploitation, OrgCapital, HUMANCAPITAL, Discovery
The R-squared of the regression which is sometimes called the coefficient of determination, is
defined as: R2 = SSE/SST = 1 – (SSR/SST)
R-squared is the ratio of the explained variation (SSE) compared to the total variation of (SST);
thus interpreted as the fraction of the sample variation in y that is explained by x. Secondly
equality in the second equation (i) provides another way for computing R-squared. The value of
R-squared is always in between 0.0 and 1.0, because SSE cannot be greater than SST
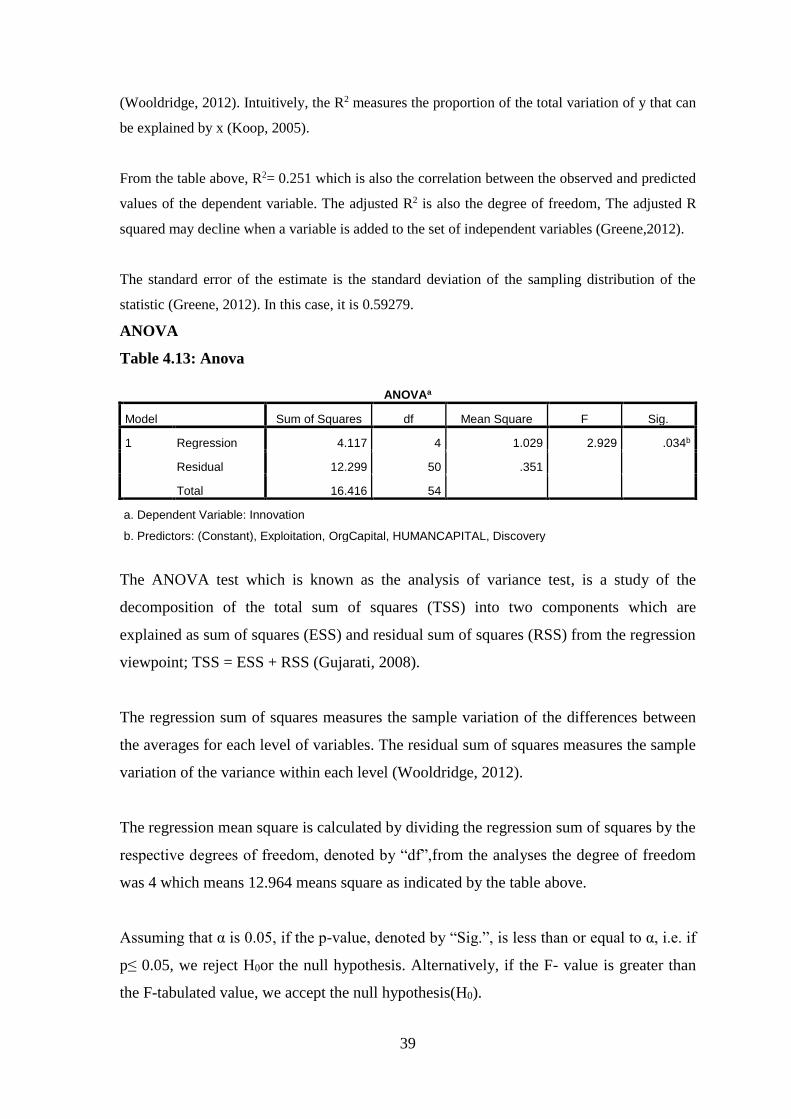
39
(Wooldridge, 2012). Intuitively, the R2 measures the proportion of the total variation of y that can
be explained by x (Koop, 2005).
From the table above, R2= 0.251 which is also the correlation between the observed and predicted
values of the dependent variable. The adjusted R2 is also the degree of freedom, The adjusted R
squared may decline when a variable is added to the set of independent variables (Greene,2012).
The standard error of the estimate is the standard deviation of the sampling distribution of the
statistic (Greene, 2012). In this case, it is 0.59279.
ANOVA
Table 4.13: Anova
ANOVAa
Model Sum of Squares df Mean Square F Sig.
1 Regression 4.117 4 1.029 2.929 .034b
Residual 12.299 50 .351
Total 16.416 54
a. Dependent Variable: Innovation
b. Predictors: (Constant), Exploitation, OrgCapital, HUMANCAPITAL, Discovery
The ANOVA test which is known as the analysis of variance test, is a study of the
decomposition of the total sum of squares (TSS) into two components which are
explained as sum of squares (ESS) and residual sum of squares (RSS) from the regression
viewpoint; TSS = ESS + RSS (Gujarati, 2008).
The regression sum of squares measures the sample variation of the differences between
the averages for each level of variables. The residual sum of squares measures the sample
variation of the variance within each level (Wooldridge, 2012).
The regression mean square is calculated by dividing the regression sum of squares by the
respective degrees of freedom, denoted by “df”,from the analyses the degree of freedom
was 4 which means 12.964 means square as indicated by the table above.
Assuming that α is 0.05, if the p-value, denoted by “Sig.”, is less than or equal to α, i.e. if
p≤ 0.05, we reject H0or the null hypothesis. Alternatively, if the F- value is greater than
the F-tabulated value, we accept the null hypothesis(H0).
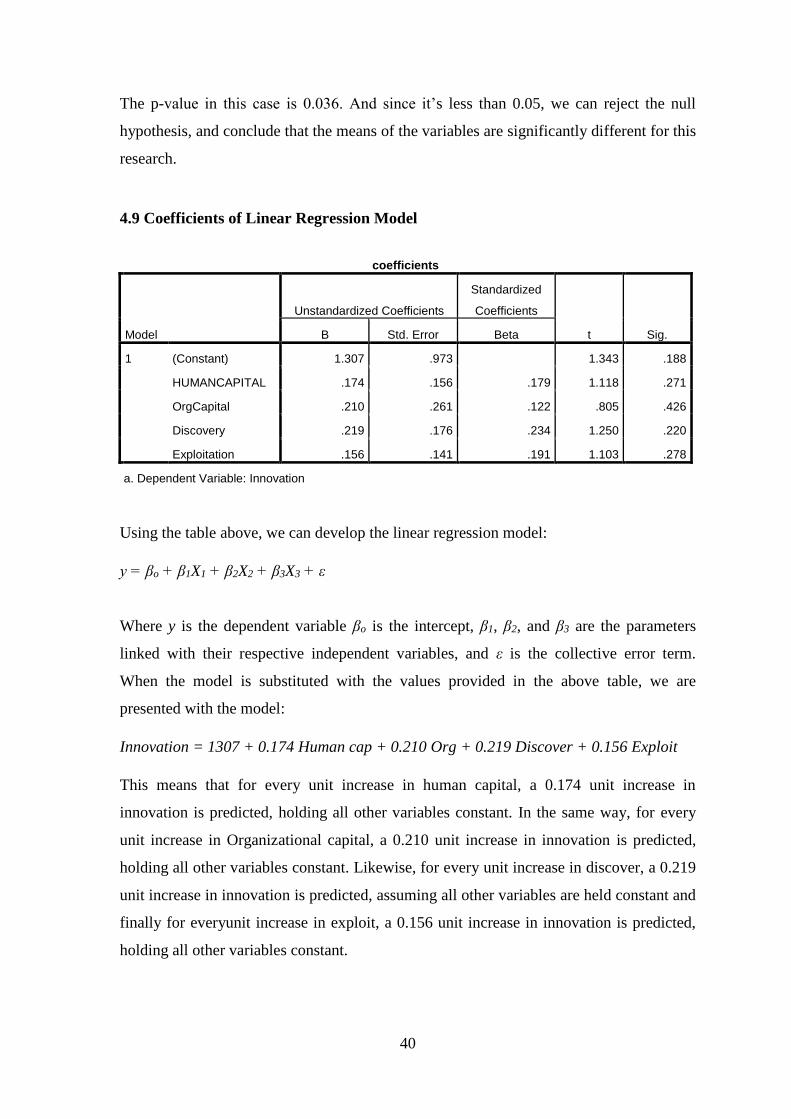
40
The p-value in this case is 0.036. And since it’s less than 0.05, we can reject the null
hypothesis, and conclude that the means of the variables are significantly different for this
research.
4.9 Coefficients of Linear Regression Model
coefficients
Model
Unstandardized Coefficients
Standardized
Coefficients
t Sig. B Std. Error Beta
1 (Constant) 1.307 .973 1.343 .188
HUMANCAPITAL .174 .156 .179 1.118 .271
OrgCapital .210 .261 .122 .805 .426
Discovery .219 .176 .234 1.250 .220
Exploitation .156 .141 .191 1.103 .278
a. Dependent Variable: Innovation
Using the table above, we can develop the linear regression model:
y = βo + β1X1 + β2X2 + β3X3 + ε
Where y is the dependent variable βo is the intercept, β1, β2, and β3 are the parameters
linked with their respective independent variables, and ε is the collective error term.
When the model is substituted with the values provided in the above table, we are
presented with the model:
Innovation = 1307 + 0.174 Human cap + 0.210 Org + 0.219 Discover + 0.156 Exploit
This means that for every unit increase in human capital, a 0.174 unit increase in
innovation is predicted, holding all other variables constant. In the same way, for every
unit increase in Organizational capital, a 0.210 unit increase in innovation is predicted,
holding all other variables constant. Likewise, for every unit increase in discover, a 0.219
unit increase in innovation is predicted, assuming all other variables are held constant and
finally for everyunit increase in exploit, a 0.156 unit increase in innovation is predicted,
holding all other variables constant.
41
The standard error terms are the terms other than the independent variables that affect the
dependent variable, “innovation” (Wooldridge, 2012).
The standardized beta coefficients are the coefficients that are obtained if one
standardizes all of the variables in the regression, including both the dependent and
independent variables, and ran the regression. By standardizing the variables before
running the regression, all variables will be on the same scale, and one can make a
comparison on the magnitude of the coefficients to see which one has more of an effect.
Also, the larger betas are associated with the larger t-values and lower p-values they have.
The columns labeled t and Sig. in the table above are the t-statistics and their associated
two-tailed p-values used in testing whether a given coefficient is significantly different
from zero. Using alpha (α) = 0.05, the coefficient for Human capital (0.174) is not
statistically significantly different from 0, because its p-value is 0.271, which is greater
than 0.05. The coefficient for Org capital (0.210) is not significantly different from 0,
because its p-value is 0.426, which is less than 0.05. The coefficient for discovery (0.219)
is not statistically significantly different from 0, because its p-value is 0.220, which is
greater than 0.05. The coefficient for Exploit(0.156) is not statistically significantly
different from 0, because its p-value is 0.278, which is greater than 0.05.The intercept is
not significantly different from 0 at the 0.05 alpha level, because its p value is 0.188.So
none of the individual regression result where significant.
4.10 Chapter Summary
This chapter has provided the results and findings with respect to the data given out by
the respondents from the businessmen in kabete. The next chapter provides the summary,
discussions, conclusions and recommendations.
42
CHAPTER FIVE
5.0 DISCUSSION, CONCLUSIONS AND RECOMMENDATIONS
5.1Introduction
This chapter provides the summary of the findings from chapter four as well as
discussion, conclusions and recommendations of the study. This chapter is arranged in a
way that it starts with the chapter summary, and then followed by discussions, conclusion,
and finally recommendations.
5.2 Summary
The objective of this study was to establish the factors that affect the adoption of
innovative strategies on sme’s in Kenya. The specific objective of the study was to
investigate the effect of Human Capital on Innovation, determining the effect of
Organizational Capital on Innovation, the effect of Discovery on innovation and the effect
of Exploit on innovation
The study used a descriptive research design with the use of questionnaires to obtain the
need information from the respondents. The population of the study was 64 businessmen
from Nairobi county kabete constituency. Data was collected using a structured
questionnaire and analyzed using the statistics package for social sciences (SPSS). The
analyzed Data was arranged in percentages, frequencies, means and standard deviations.
The simple regression was computed to determine the relationships between the
independent and dependent variables.
On human capital the study found out that there was not statistical significance between
human capital and innovation. This was due to the way training and academic studies are
carried out in Kenya which doesn’t mold one into becoming and entrepreneur.
The study established that organizational capital though it had a positive relationship
lacked a statistical significance. The result was not significant from the study in Kenya
because small enterprises don’t tend to change their approach of doing business so in
most case they apply the wait and see approach to their business.
43
On discovery the study found out the relationship was not statistically significant due to
the approach we used in searching for a business ideas, majority of entrepreneur’s in the
sme’s just copy businesses that they think is successful or what they have heard is
working well rather than following the due process of getting an idea.
On exploitation of business idea the study found out that there was not statistical
significance between exploit and innovation. This was due to the way majority of the
people were running there small business which they didn’t see the need to recruit, patent
or map out there financial. There mode of running the business was based on survival
5.3 Discussions
5.3.1 Human Capital and Innovation
The relationship between human capital and innovation was positive at 0.174 but it was
not statistically significant because its p-value was 0.271, which is > than 0.05.This study
contradicts the work of Anis Omri & Maha Ayadi (2014) who carried a similar study in
Tunisia and the study was significant indicating an influence in human capital to
innovation. Another study was carried out in Japan by Mohamed Amine Bouraoui (2013)
who results confirmed a significant relationship between human capital and innovation.
On the other hand the findings from the work of Mahemba and De Bruijn (2003) and
Baulom (2004) found a different outcome when their study confirmed that there was no
significant relationship between training and innovation with training being a component
of human capital. From their study they indicated that regardless of the number of
training one attends they do not result in entrepreneurs becoming innovative.
Thornhill (2006) study went ahead and interviewed 845 Canadian innovative firms and
demonstrated that there was a positive significant relationship between human capital and
innovation. Similarly Koskinen and Vanharanta (2002) also determined that there was
asignificant relationship between human capital and innovation through the knowledge,
learning and experience gained in the enterprise.
This researcher hypothesizes that the reason the study failed to show significant in Kenya
was due to the quality of education offered in the county which is more theoretical and
less practical so even if someone has the highest number of training and academic
qualification which were used to measure human capital he still has less opportunity to
44
practice what he has learnt to be innovative. Also the majority of people going for this
training in Kenya maybe more interested in getting the certificate as opposed to the
lesson. The researcher also hypothesized that the study failed to show any significant due
to majority of SMEs in Kenya not having employees who contributes towards the human
capital of the business as compared to other parts of the world were SMEs have over 10
employees.
5.3.2 Organizational capital and Innovation
The relationship between organizational capital and innovation was positive at 0.210
which means for every unit increase in organizational capital a 0.210 unit increase in
innovation is predicted. However the relationship was not statistically significant because
its p-value was 0.426, which is greater than 0.05.
This stands in contrast to a study carried out in Spainby Inaki Pena (2006)that indicated a
strong relationship between organizational capital and innovation. The study tastedthe
level of adoption to the market and the firm age which in Spain proved significant to
innovation.
According to a Birley and Westhead (2000) study the firm age contributes significantly to
the level of innovation. This is due to the number of learning and transformational
process for a long time which is expected to results in ability to make innovative changes
at ease. In Kenya majority of the sme’s are below 5 years which hindered them from
having such immense experience in running business?
This researcher hypothesizes that the result was not significant from the study in Kenya
because small enterprises don’t tend to change their approach of doing business so in
most case they apply the wait and see approach to their business. It’s here in the country
where we see hawkers being chased daily but they still go back to the city showing a lack
of adoption to new regulations, others still would rather lower their prices than make
innovative moves.
The researcher also hypothesized that the result was not significant because of lack of
resources needed by the organization like research and development department that
enable the big cooperates to adjust because of the forecast. This was confirmed by the
work of Schumpeter (2001) who emphasized that the ability of large firms to invest in
programs that leads to new products through R&D which clearly note possible for small
45
and micro-enterprises which are handicapped due to their lack of capital. Firtsch and
Meschede (2001) also added that the availability of financial capital is the main factor in
small enterprises innovation activities.
5.3.3 Discover and Innovate
The relationship between organizational capital and innovation was positive at 0.219
which means for every unit increase in organizational capital a 0.219 unit increase in
innovation is predicted. However the relationship was not statistically significant because
its p-value was 0.220, which is greater than 0.05.
A similar study carried out by Steven Farmer (2009) in Taiwan, china and USA showed a
significant strong relationship between the discovery processes of an idea with
innovation, this is so because in these countries they prefer to follow the due process of
searching for the idea and the feedback they get is an honest opinion. Another study
carried out by Cefis and Marsili (2006) found a significant positive relationship between
discovery of a business idea with innovation but also highlighted that they were very few
theoretical and empirical studies that have been done before that can support this
relationship.
This researcher hypothesizes that the approach in which people search for an idea,
majority entrepreneurs in the sme’s just copy businesses that they think is successful or
what they have heard is doing well rather than following the due process of getting an
idea. Also researcher hypothesized that the Kenya culture especially those in the urban
centers were the research was conducted have the tendency of following the crowd and
doing something because is fashionable, so if the media highlights that farming is good
everyone will be doing farming the next day which affected the outcome of how people
get a business idea.
5.3.4 Exploit and Innovate
The relationship between Exploit and innovation was positive at 0.156 which means for
every unit increase in exploit a 0.156 unit increase in innovation is predicted. However
the relationship was not statistically significant because its p-value was 0.278, which is
greater than 0.05.
46
This was not the case in a similar study conducted in USA were there was a higher
significant due to the way they handle the business, were proper structure needs to be put
in place before they even start the business. Similarly another study carried out in
Germany by McGrath & Macmillan (1992) found a significant relationship though he
also noted that there was lack of consistency in which entrepreneurs view their roles
across cultures and hence additional work was needed.
The result was not statistically significant because majority of the people who responded
to the survey were running small business and they don’t see the need to recruit, patent or
map out there financial. On the other hand the culture in Kenya effected the way small
business traders do their business this is due to the way they are locked out from various
opportunities that can help them innovate like access to finances, training and exposes to
technologies that can assist them innovate there business.
5.4 Conclusion
5.4.1 Human Capital
The study concludes that there was no significant relationship between human capital and
innovation, although these results were proved otherwise when another study was carried
out in other parts of the country like Tunisia and Japan.The study also concluded that
there other parts of the country apart from Kenya were the study showed a lack of
significant especially between training and innovation hence the conclusion that the study
may vary in result from different parts of the world.The study also conclude that the
likelihood of the lack of significant in Kenya was due to the quality of training and
education that entrepreneur receive which in most cases is not appropriate to the work
environment out there.
5.4.2 Organizational Capital
On organizational capital the study concludes that there was no significant relationship
between the two variables indicating that in Kenya organizational capital does not ideally
influence innovation. This study was significant in Spain but proved otherwise Kenya.
The study concluded that it was not significant in Kenya due to fewer resources that
SMEs have to embrace innovative strategies also the way SMEs run business were its
more of survival rather than innovate were prices and threats act as a way of managing
completion.
47
5.4.3 Discovery
The study concludes that there was no significant relationship between discovery of a
business idea and innovation, although these results were proved otherwise when the
study was carried out in Taiwan, China and USA it was not so in Kenya. The study also
concluded that there was a need to do more research on discovery as very few theoretical
and empirical studies have been done before that supports this relationship. The study
concluded the failure as a result of the way Kenyan search for a business idea which
majority copy what they think is doing well or what they think is fashionable. Also the
trust level in Kenya is very low hence we don’t trust our friends with our business ideas
which they were meant to give us feedback.
5.4.4 Exploit
On the exploit of the business idea the study concludes that there was no significant
relationship between exploit and innovation. On the other hand a similar study was done
in USA and the results were significant. The study concludes that the study was not
significant in Kenya likely because of our culture of doing business were small traders are
locked out of many opportunities as compared to the rest of the world.
5.5 Recommendations
5.5.1 Recommendations for improvement
5.5.1.1 Human Capital
The study recommends that future studies in Kenya on human capital and innovation
should include other factors such as one’s environment, family background. This could
possibly show an inclination towards innovation. The study also recommends the quality
of education and training offered should be more practical and relevant to the market it
going to be exercised. The study also recommends entrepreneur to be open to training
because they add value to the way they run their business which eventually builds up to
innovation. The study also recommends a diverse experience for running of business
rather than the one we have people doing the same role for 10years.
5.5.1.2 Organizational Capital
The study recommends that future studies in Kenya on organizational capital and
innovation should include small enterprises resources rather than generalizing the
resources for big organization with small ones like departments that are not there in small
48
enterprises. The study recommends organizations to be open to innovative ideas to
withstand the market dynamics instead of using price wars and threats.
5.5.1.3 Discover
The study recommends a wider scope of studies on discovery as Kenyan way of sourcing
for a business idea varies with other parts of the world. Although this study was
significant in other parts of the world like USA,Taiwan and China the study recommends
that more business incubation be set up in parts of the countries were ideas can be tested
to see if the fit for the market. The study also recommends the government to be open to
more entrepreneurship training that will help especially the SMEs who may lack the
resources to attend these trainings.
5.5.1.4 Exploit
The study recommends the inclusion of other factors when exploiting a business idea
such as government policies, culture and behavior of Kenyans which is unique from other
parts of the world. The study also recommend the government to open financial support
to the SMEs, and also other resources that may be of help towards there road to
innovation.
5.5.2 Recommendation for further research
The study highly recommends further studies on the factors that influence the innovation
adoption in Kenya since this has not been research deeply in Kenya hence there is lack of
understanding on what innovation is all about when it comes to business. Majority of
entrepreneurs just start the business for survival and not for innovativeness.
49
REFERENCES
Ackerman, V. &. (2003). Sharing Expertise beyond knowledge management. Cambridge:
MIT Press.
Anderson. (2011). Technology implication for women in gender roles.
Anderson, J. &. (2009). Predicting the performance of measures in a confirmatory factor
analysis with a pretest assessment of their substantive validates. Journal of
Applied Psychology, 76.
Appelbaum, S. R. (2007). How to measure an organization innovation ability. Business
facilitating factor, 15-25.
Baum, J. &. (2004). Journal of Applied Psychology. The relationship of entrepreneurial
traits, skill, and motivation to subsequent, 89.
Belwal, S. G. (2011). The relationship of entrepreneurial traits, skill, and motivation to
subsequent. Journal of Applied Psychology, 89.
Callero, P. H. (2007). Helping behavior as role behavior: Disclosing social structure and
history in the analysis of prosocial action. Social Psychology Quarterly, 50.
Chung. (2010). Analysis of deficiencies in financial management of SME in china.
Cloete. (2012). SME acceptance of E-commerce Leadership and information processing
Linking perceptions and performance. Organizational Behavior and Human
Decision, 167-203.
Coleman, S. (2007). The Role of Human and Financial Capital in the Profitability and
Growth of Women-Owned Small Firms. Journal of Small Business Management
45:3,, 303-317.
Cooray. (2013). Walk through cleaner production assessment in SMEs Frontiers of
entrepreneurship research. Journal of Business Venturing, 1,, 241-243.
Corbett, A. (. (2005). Entrepreneurship Theory and Practice. Experiential learning with
the process of opportunity identification and exploitation., 29.
Cormirck, M. (2011). Factors affecting SME in rural arears of kenya.
Cropanzano, R. J. (2003). A goal hierarchy model of personality, motivation, and
leadership Research in organizational behavior. Greenwich: JIT Press.
Davidsson, P. (. (2005). Entrepreneurship research innovator, coordinator and
disseminator. JIT Press.
Eisenmann, T. (2013). Entrepreneurship. what is entrepreneurship in the view of todays
business world.
50
Etemad. (2013). Enhancing the competitiveness of small and medium enterprises in
kenya.
Forsman. (2010). Business development success in SMEs. Small business and enterprise
development.
Francis, M. (2010). Learning about failure and Understanding the dynamics of leadership
The role of follower self-concepts. Journal of Business Venturing, 167-202.
Gibson, H. (2011). A longitudinal study of cognitive factors influencing. Journal of
Business Venturing, 10, 371–391.
Gourova, A. &. (2006). International workshop on learning networks for lifelong
competence development. A note on organizational learning and knowledge
sharing in the context of innovation practice, 1-5.
Harpat, C. (2011). Becoming a founder: How founder role identity affects
entrepreneurial. Journal of Business Venturing., 43-44.
Harper. (2013). Replication in strategic management: Scientific testing for. Kansas city.
Hill. (2011). Supporting and Balancing Risk and Performance.
Hisrich, R. P. (2008). Opportunity recognition: Perceptions and behaviors of
entrepreneurs. Kansas: MIT Press.
Hoang, H. &. (2012). Becoming a founder: How founder role identity affects
entrepreneurial transitions and persistence in founding. Journal of Business
Venturing.
Hoang, H. a. (2003). Network-based research in entrepreneurship: a critical review.
Journal of Business Venturing, Vol. 18, 165-167.
Holland. (2011). Exposed China shadowy private sector in the contects of the growing
technologies in the world
Hussain, O. a. (2012). Implication of ICT of small businesses Culture, entrepreneurial
orientation, and global competitiveness. Journal of world business, 401-416.
Ibrahim. (2011). An analysis of strategic factors affecting the performance of SMEs in
Nigeria.
ILO. (2012). Women In entrepreneurs.why the thrive and succeed in this dynamic sector
ILO/JASPA. (2010). Enterprise growth in Japan. Future orientation in the self-system:
Possible selves, self-regulation, and, 74.
Kapila. (2011). Unleashing the entrepreneurial potential of smes in kenya.
51
Kinyua. (2014). Factors affecting the performance of small and medium enterprises in jua
kali sector.
Kithylo. (2014). Common method biases in behavioral research: A critical review of the
literature and recommended remedies. Journal of Applied Psychology, 88.
Kupferberg. (2010). Small business management an entrepreneurial emphasis Giving
blood: The development of an altruistic identity. Journal of Applied Psychology,.
Levine. (2010). understanding the world of research an indepth analysis of research in
the real perspective. Pitman.
Morris, M. M. (2009). The dilemma of growth: Understanding venture size choices of
women entrepreneurs.
Mousafa. (2011). management of technological transfer.
Mugure, W. &. (2012). The Small Entreprenuar in the heart of an exposed and growing
african sphere.
Munene. (2011). Gender Equality in kenya Assessing entrepreneurial cognitions across
cultures. Entrepreneurship Theory and Practice, 26.
Nelson, N. a. (2011). Investing into problems facing SMEs growth.
Ondieki, S. (2012). The impact of information technology on the success and survival of
small and medium enterprises.
Onugu. (2011). Extraordinary versus ordinary discoveries. The case of American and
Chinese entrepreneurship. Opportunity identification and entrepreneurial
behavior, 163-189.
Orwa. (2011). Africa Economic Outlook Business accomplishments, gender, and
entrepreneurial selfimage. Journal of Business Venturing, 20.
Perker. (2011). A critical review of the literature and recommended remedies. Journal of
Applied Psychology,. Common method biases in behavioral, 88.
Petridou. (2012). The Enterprenuar Growth. A case study of the small micro enterprises
in the heart of africa.
Piliavin, J. &. (1991). Giving blood: The development of an altruistic identity. .
Baltimore,: John Hopslin Press.
Pitt. (2010). Journal of Business Venturing. Becoming a founder: How founder role
identity affects entrepreneurial, 42-51.
Ploruiman, E. &. (2010). Enhancing competitiveness of small and medium enterprises a
decision theoretic and prototype conceptualization of. Implications for the
prediction of risk behavior. Journal of Personality,, 54.
52
Reynold. (2010). Handbook of entrepreneurial dynamics: The process of business
creation. Thousand Oaks Press.
Reynolds. (2010). New firm gestation: Conception, birth and implications for research.
Journal of Business Venturing, 405-417.
Reynolds, P. (2007). Foundations and Trends in Entrepreneurship; new firms creation in
US. newyork: Financial Times Pitman.
Sabir R.I & Sabir, R. (2012). Managing technological Innovation and Understanding the
dynamics of leadership. Frontiers of entrepreneurship research, 662-675.
saunders Gray & Goregaokar, H. (2014). SME Innovation and Learning Properties of
emerging organizations: An empirical test. The role of networks and crisis events,
23.
Saunders, L. &. (2012). The wording and translation of research instruments.Research
method into depth. Netwell Publishers.
Schindler, C. &. (2010). Research Methods The wording and translation of research
instruments in business perspective. Chicago: World press.
Sekaran, U. &. (2013). Research methods for Business The past, present, and future of an
identity theory. JIM Press.
Sharma, B. &. (2010). Entry Barries and industry rivalry:do they mediate the relationship
between quality management practices and performance.
Shepherd, D. &. (2005). Birds of a feather don’t always flock together: Identity
management in entrepreneurship. Journal of Business Venturing,, 24.
Stewart. (2013). Macro-policies for appropriate technology in developing countries.
Storey. (2011). Small business skills audit peri-urban areas A dynamic capability
perspective. Journal of Small Business Management, 86.
Strahan, E. &. (2006). Temporal comparisons, identity, and motivation: The relation
between past, present, and possible future selves. Newyork.
Thomala, J. D. (2010). SME in Malaysia Exploring the venture creation process:
Evidence from tech and non-tech. Frontiers of entrepreneurship research, 663-
675.
Varis, M. &. (2010). Types of innovation,Sources of information and performance in
entrepreneurial SMEs.
Verheul, I. U. (2013). The Influence of personal and environmental factors on
entrepreneurs performance. Journal of Business Venturing, 483-515.
53
White & Yu, T. (2004). Extraordinary versus ordinary discoveries. The case of American
and Chinese entrepreneurship. Opportunity identification and entrepreneurial
behavior, 163-169.
Yao, X. F.-M. (2007). Who is the entrepreneur? Prototypical views of the entrepreneurial
role across three cultures. Paper presented at the Babson College
Entrepreneurship Research.

54
APPENDICES
APPENDIX I: INTRODUCTORY LETTER
Dear Sir/Madam,
RE: REQUEST TO PARTICIPATE IN A RESEARCH STUDY
This study is a requirement for the partial fulfilment for the degree of Masters in Business
Administration (MBA). The purpose of this research is to investigate the Factors
Influencing the adoption of innovative strategies on SMEs in Kenya, A case study of
Kabete town Kiambu County.
Kindly note that any information you give will be treated with confidentiality and at no
instance will it be used for any other purpose other than for this project. Your assistance
will be highly appreciated.
I look forward to your prompt response.
Regards
Eric C Kimani
55
SECTION A: PERSONAL PROFILE
1. Name of your Business: ...............................................................................
2. Nature of the enterprise (Tick where suitable)
(a) Partnership
(b) Sole proprietor
(c) Family owned
Others (specify): ..........................................................................
3. Nature/Kind of enterprise (Tick where suitable)
(a) Service
(b) Education
(c) Construction
(d) Trading
(e) Agro-allied
Others specify --------------------------
4. For how long has your enterprise been in operation? (Tick where suitable)
(a) Less than 6 months
(b) 6 months - 1 year
(c) 2 - 5 years
(d) 6 years and above
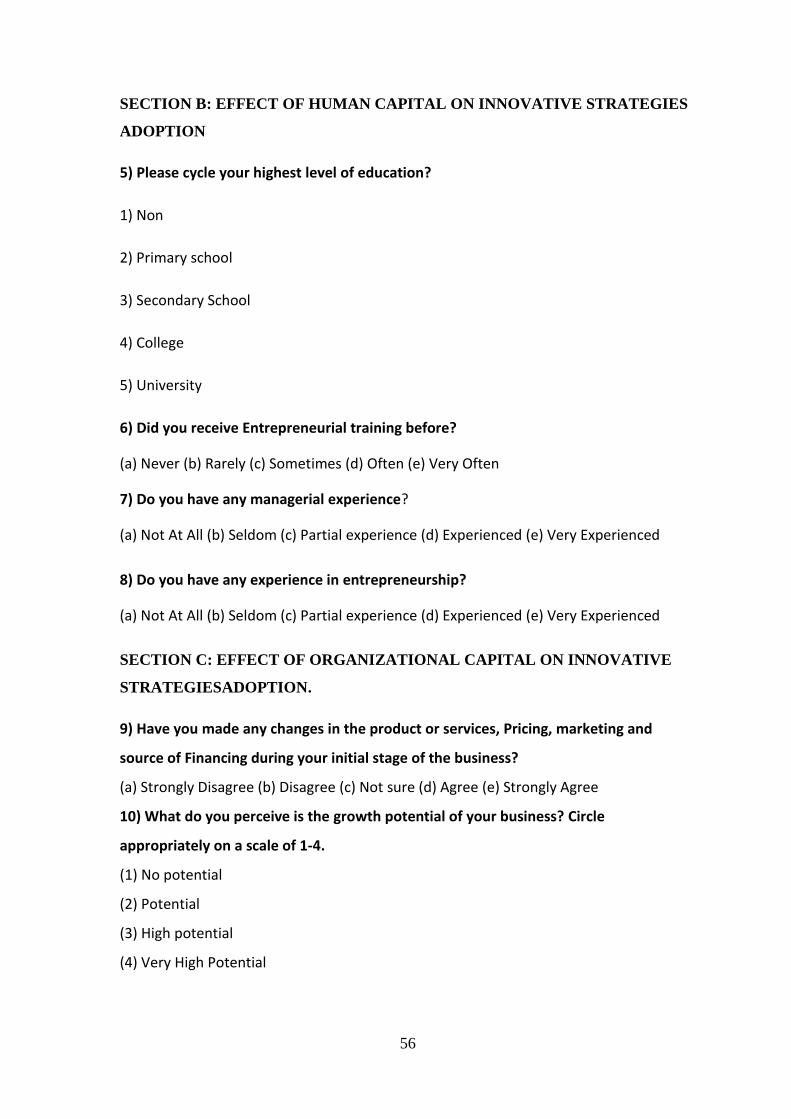
56
SECTION B: EFFECT OF HUMAN CAPITAL ON INNOVATIVE STRATEGIES
ADOPTION
5) Please cycle your highest level of education?
1) Non
2) Primary school
3) Secondary School
4) College
5) University
6) Did you receive Entrepreneurial training before?
(a) Never (b) Rarely (c) Sometimes (d) Often (e) Very Often
7) Do you have any managerial experience?
(a) Not At All (b) Seldom (c) Partial experience (d) Experienced (e) Very Experienced
8) Do you have any experience in entrepreneurship?
(a) Not At All (b) Seldom (c) Partial experience (d) Experienced (e) Very Experienced
SECTION C: EFFECT OF ORGANIZATIONAL CAPITAL ON INNOVATIVE
STRATEGIESADOPTION.
9) Have you made any changes in the product or services, Pricing, marketing and
source of Financing during your initial stage of the business?
(a) Strongly Disagree (b) Disagree (c) Not sure (d) Agree (e) Strongly Agree
10) What do you perceive is the growth potential of your business? Circle
appropriately on a scale of 1-4.
(1) No potential
(2) Potential
(3) High potential
(4) Very High Potential
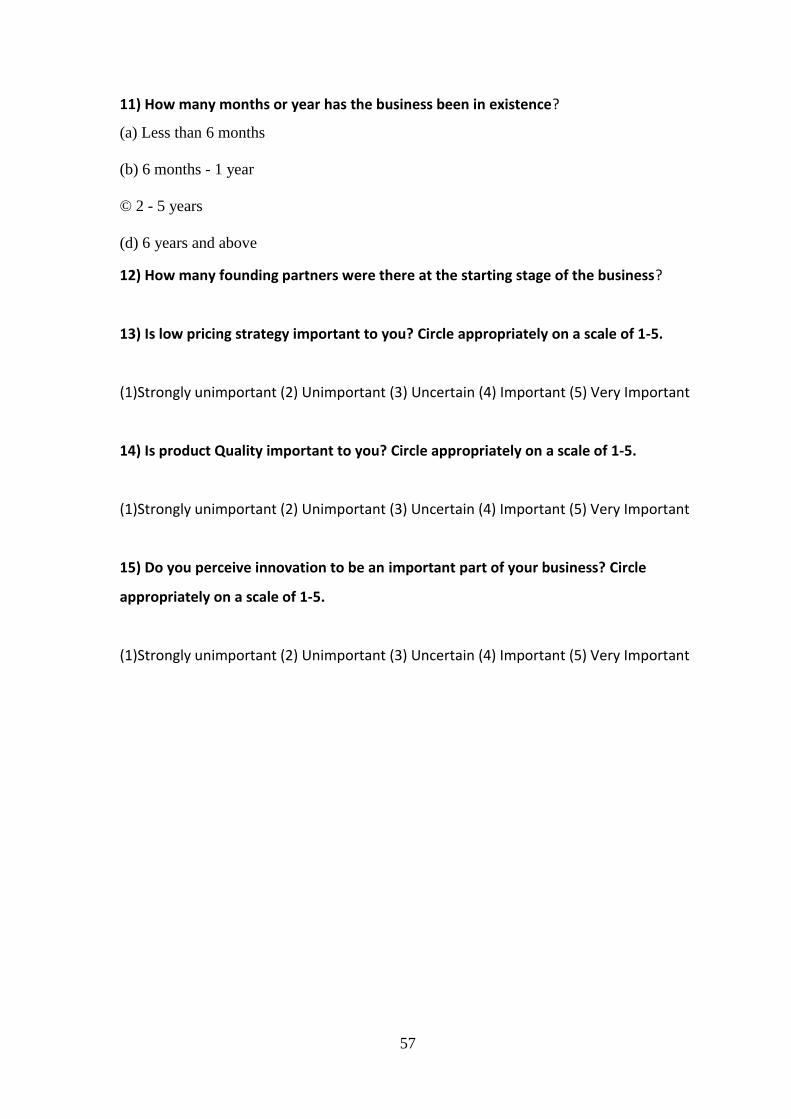
57
11) How many months or year has the business been in existence?
(a) Less than 6 months
(b) 6 months - 1 year
© 2 - 5 years
(d) 6 years and above
12) How many founding partners were there at the starting stage of the business?
13) Is low pricing strategy important to you? Circle appropriately on a scale of 1-5.
(1)Strongly unimportant (2) Unimportant (3) Uncertain (4) Important (5) Very Important
14) Is product Quality important to you? Circle appropriately on a scale of 1-5.
(1)Strongly unimportant (2) Unimportant (3) Uncertain (4) Important (5) Very Important
15) Do you perceive innovation to be an important part of your business? Circle
appropriately on a scale of 1-5.
(1)Strongly unimportant (2) Unimportant (3) Uncertain (4) Important (5) Very Important
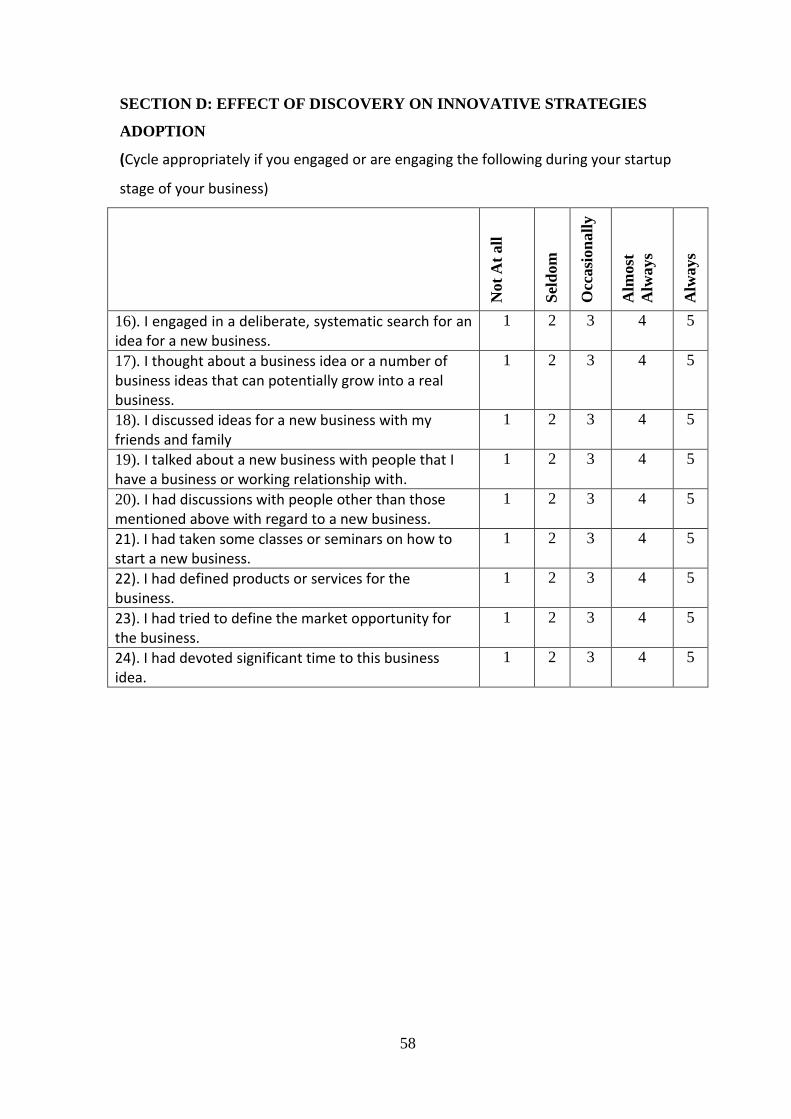
58
SECTION D: EFFECT OF DISCOVERY ON INNOVATIVE STRATEGIES
ADOPTION
(Cycle appropriately if you engaged or are engaging the following during your startup
stage of your business)
Not
At
all
Sel
dom
Occ
asi
on
all
y
Alm
ost
Alw
ays
Alw
ays
16). I engaged in a deliberate, systematic search for an idea for a new business.
1 2 3 4 5
17). I thought about a business idea or a number of business ideas that can potentially grow into a real business.
1 2 3 4 5
18). I discussed ideas for a new business with my friends and family
1 2 3 4 5
19). I talked about a new business with people that I have a business or working relationship with.
1 2 3 4 5
20). I had discussions with people other than those mentioned above with regard to a new business.
1 2 3 4 5
21). I had taken some classes or seminars on how to start a new business.
1 2 3 4 5
22). I had defined products or services for the business.
1 2 3 4 5
23). I had tried to define the market opportunity for the business.
1 2 3 4 5
24). I had devoted significant time to this business idea.
1 2 3 4 5
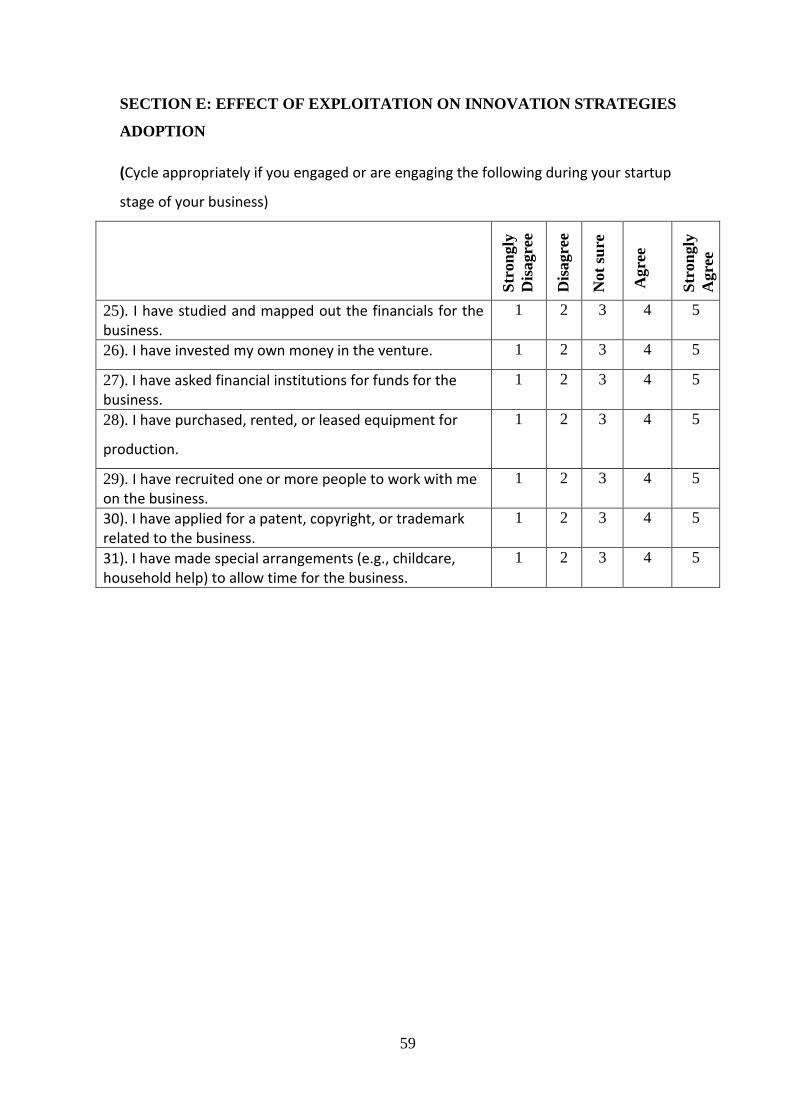
59
SECTION E: EFFECT OF EXPLOITATION ON INNOVATION STRATEGIES
ADOPTION
(Cycle appropriately if you engaged or are engaging the following during your startup
stage of your business)
Str
on
gly
Dis
agre
e
Dis
agre
e
Not
sure
Agre
e
Str
on
gly
Agre
e
25). I have studied and mapped out the financials for the business.
1 2 3 4 5
26). I have invested my own money in the venture. 1 2 3 4 5
27). I have asked financial institutions for funds for the business.
1 2 3 4 5
28). I have purchased, rented, or leased equipment for
production.
1 2 3 4 5
29). I have recruited one or more people to work with me on the business.
1 2 3 4 5
30). I have applied for a patent, copyright, or trademark related to the business.
1 2 3 4 5
31). I have made special arrangements (e.g., childcare, household help) to allow time for the business.
1 2 3 4 5
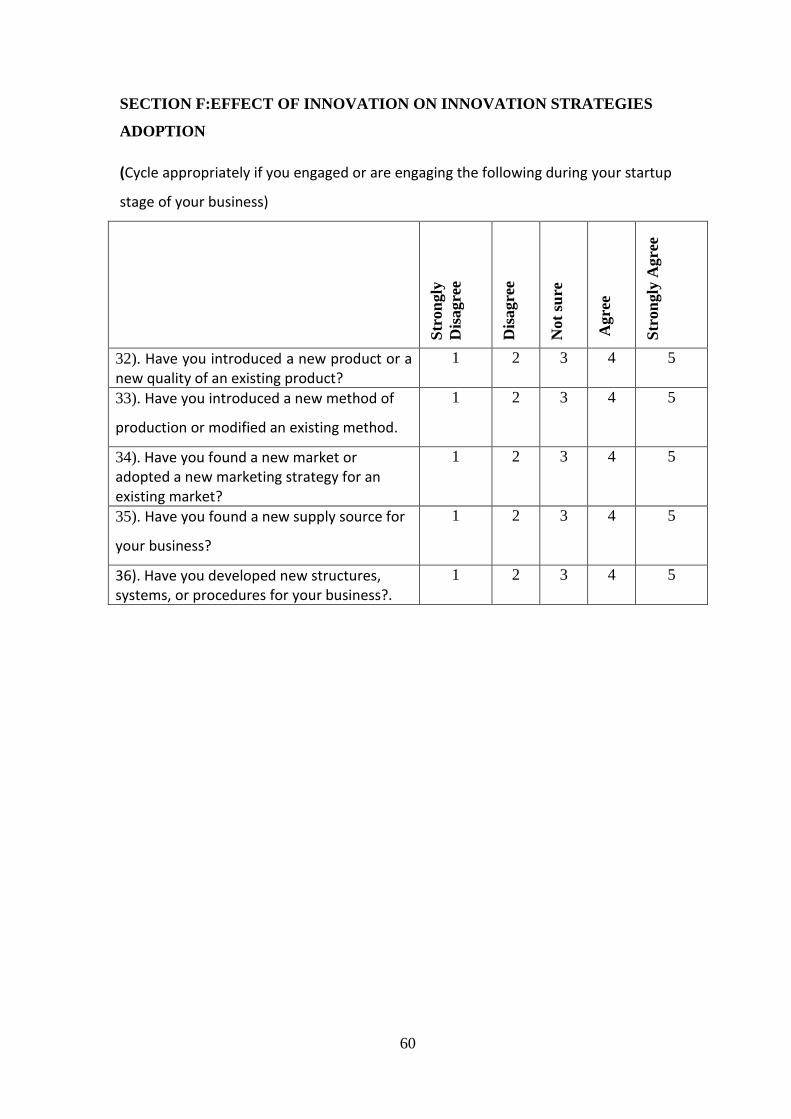
60
SECTION F:EFFECT OF INNOVATION ON INNOVATION STRATEGIES
ADOPTION
(Cycle appropriately if you engaged or are engaging the following during your startup
stage of your business)
Str
on
gly
Dis
agre
e
Dis
agre
e
Not
sure
Agre
e
Str
on
gly
Agre
e
32). Have you introduced a new product or a new quality of an existing product?
1 2 3 4 5
33). Have you introduced a new method of
production or modified an existing method.
1 2 3 4 5
34). Have you found a new market or adopted a new marketing strategy for an existing market?
1 2 3 4 5
35). Have you found a new supply source for
your business?
1 2 3 4 5
36). Have you developed new structures, systems, or procedures for your business?.
1 2 3 4 5