factors affecting the fracture energy of.a. … · master of ' science ·. approved: ......
TRANSCRIPT

FACTORS AFFECTING THE FRACTURE ENERGY
OF.A. STRUCTURAL ADHESIVE
by
Daniel George O'Connor
Thesis submitted to the Graduate :Faculty of the
Virginia Polytechnic ·tnstitut.e and Staf:e. Univer!';l:i.tY .
in partial fulfillment of the requirements for the 'degree of
MASTER OF ' SCIENCE
·. APPROVED:
R. H. Plaut
in
Engineering Mechanics · .
-H. F. Brinson, Chairman
·; ..
August;, 1979
Blacksburg, Virginia
D. H.. · _Mo;rris

ACKNOWLE:bGEMENTS.
· The author wishes to express his sincere .;i.ppreciation to:
NASA's Langley Research Center for support under NASA Grant
NGR 47-004-090, and .to . , technical . .
monitor.
· Narmco Materials, tile::,. for supplying adhesi~e material.
for his helpful assistance and patience in
the machine·shop.
and for their helpful
.··advice throughout this study.
ii

TABLE OF CONTENTS
Chapter
ACKNOWLEDGEMENTS . . .
LIST OF ILLUSTRATIONS
LIST OF TABLES •
LIST OF SYMBOLS
I. INTRODUCTION ...
II. SOME STANDARD TESTS FOR EVALUATING AD}IESIVE STRENGTH AND MODULUS AND FRACTURE ENERGY .
Strength and Modulus Tests • ! •
Tensile Tests
Shear Tests
Peel Tests . .
Fracture Energy Tests .
Mixed-Mode Fracture Energy Test
Single Lap Shear Fracture Energy Test
Peel Fracture Energy Test
Cone Fracture Energy Tests .
Blister Fracture Energy Test
Cantilever Beam Fracture Energy Tests
III. ANALYTICAL METHODOLOGY.FOR THE TDCB
The Strain Energy Release Rate
IV!. MECHANICAL AND. CHEMICAL ADHESION ·'
Surface Properties of the Adherend ..
Surface Behavior of the Adhesive
iii
ii
v
vii
viii
1
8
8 . . . 9
11
13
13
15
15
17
20
.20
24
24
35
35
.. . . 40

Chapter
Properties of the Adhesive/Adherend Interface 42
V. EXPERIMENTAL CONSIDERATIONS 46
Specimen Preparation· 46
Experimental Procedure 51
GIC Dependence to the Specimen Preparation Process ~ . . . 51
VI. REDUCTION OF EXPERIMENTAL DATA . . . ' 65
Rate Dependence of GIC • ·.·· • 65
Time Dependence of GIC . . . . 70
VIL DISCUSSION AND RESULTS . . .-· 71
Preparation, Rate and Time Dependence . 71
Fractography 72
TDGB Test Specimen Evaluation . .. 79
VIII. CONCLUSIONS AND FUTURE CONSIDERATIONS 85
BIBLIOGRAPHY 89
VITA . . . . . .. . . 92
iv

LIS'.L' OF ILLUSTRATIONS
Figure
1. Fracture Modes . .. . . . . . 2 •. · Tensile Tests
3. ·Shear Tests . •' . . . 4. Peel Test . . . . . . . 5. Mixed-Mode Test . . . :• . . . 6. Cone Test . . . . . . . _ ... _ . 7. Blister Test • .
8. Cantilever Beam Tests
9. Edge-Cracked Plate •.. .. . .. . . •· ·,.'
10. Plot of the Loading Cycle and the Work Performed in
4
10
12
14
16
19
.21.
22
25
Advancing a Crack • • • . . • . • . 26
11. Double Cantilever Beam . . . . . . ~ . . . . . . . . 12. Schematic of the TDCB Specimen . . . · .. 13. Air Trapped by Film Adhesives . . . . . 14. · TDCB Specimen Being Teste<;I. . . • . . . . . . . . 15. Loading Apparatus for Use During Cure
16. TDCB Test Set-Up . . •
17. · Comparison of "Old" to "New" Adhesive
32
34
43·
47
52
57
18. GIC vs. Bond Thickness for Piperidine-DGEBA Modified with 15% CTBN at Room Temperature . . • . . . .. • . • 58
19. Load vs. Elongation Curve for Specimens with Variable Bond Thickness . . . . . · 60
20. Load vs. Elongation Curve. :. . . . • ~ . . .
21. Isotherms: Cure of .Epoxied Resin System (TBA) •
v
61
62

Figure
22. Summary of Grc Dependence on Preparation Procedures
23. Cross Head Rate vs. GIC Curve
24. Normalized GIC vs. Crack Length·
25, Fracture Surfa.ces . . . . 26. Fracture Surfaces
27. Fracture Surfaces at SOX
28. Fracture Surfaces at 200X
29. Fiber Presence in the Adhesive •
30. Fractured Surfaces.at 5,000X
31. . Crack Propagation Sequence .
. . . .. . -.
32. Permanent Deformation in a Tested Specimen
vi
Page
64
67
69
73
74
77
78
80
81
82
84

LIST OF TABLES
Table
1. Methods Used for the Study of Solid Surfaces 39
2. Grc Test Data for Various Specimen Preparation Procedures . . • . . . • 54
3. Grc for Various Cross Head Rates 66
4. Fracture Energy of Matrix Polymers . . . . . . . . 87
vii

GIC' GIIC' GIIIC
w
p
L
M
E
A
B
a
e
y
c
U, UT
F
cS
h
m
LIST OF SYMBOLS.
Strain energy release rate for Modes i, U,. III
Work
Load
Elongation
Elastic stiffness
Poisson's ratio
Elastic modulus
Fracture surf ace area
Thickness
Crack length
Angle
Surface tension
Compliance
Stored elastic energy
Work
Displacement
TDCB dimension,
TDCB ··shape factor
viii

I. INTRODUCTION
With the move toward lightweight structural materials such as
polymers and polymer matrix composites, today's engineers are faced
with the problem of. designing methods of joining structural components
without weakening or damaging the actual members. For example, it is
impossible to use conventional penetration techniques without
drastically affecting the strength of continuous fiber reinforced
polymeric components. For this and similar reasons adhesives have
become a desirable alternative. Even in cases where penetration
methods are. acceptable, adhesives are often used as an additional
means of load transfer. Although adhesives seem to be the solution
to the problem of joining polymeric materials, many disadvantages have
become evident with their use. Assembly-line manufacturing proce-
dures were found to be easily adaptive to adhesive bonding processes,
but the industrial environment was also found to contain hard to
control contaminants which can drastically reduce bond strength [l].
A desirable feature of adhesive bonding is the reduction or elimination
of stress concentrations arising from penetration techniques, but
here again, adhesives are found to contain inherent flaws or cracks
which result in stress concentrations randomly distributed throughout
the adherent. These flaws, which may be due to trapped air,
contamination or chemical dissimilarities [2], act to reduce overall
joint strength. It is felt that since adhesive strength is heavily
influenced by the presence of flaws that fracture mechanics is the
1

2
best available tool for evaluation.
Fracture mechanics is the study of the strength of a structural
member containing a crack. Although adhesives may not initially
contain cracks, when subjected to loads their flaws may develop into
cracks. Modern fracture mechanics began with the Griffith criterion
for fracture based on equating the strain energy content·with the
energy to create new surface area at the instant of crack propagation.
Thus, for a tensile loaded, edge notched bar [3],
ae =- (2Ey/rra)l/Z (1)
where cre is the stress at crack initiation, a is the notch depth,
Eis Young's modulus, and y is the surface fracture energy. Except
for exceedingly brittle materials, experimentally determined values
for y are orders of magnitude greater than can be accounted for by
just, the rupture of.chemical bonds at the crack tip. Actually, crack
initiation involves a number of energy consuming processes within the
inunediate vicinity of the crack tip including viscoelastic and
plastic deformations. Irwin [4] demonstrated that the Griffith equa-
tion is formally correct if the surface energy term, redefined by
Irwin as the.strain energy release rate, Ge, is taken to include all
the crack tip energy dissipative processes, so that
(2)
where Ge is an index of fracture toughness and in the ideally brittle
limit, Ge = 2y.

3
The fracture energy of isotropic solids is a function of the
stress state so that it is necessary to define a strain energy
release rate for each of the three principal modes of failure {Fig. 1):
opening 'mode, Grc; in-plane shear:, Gue; and torsional shear, Gnrc·
The quantity most often used to predict failure by crack
growth is the stress intensity factor, K, .a measure of the stress in
the vicinity of a crack tip. For an isotropic material the general
expression for K is [3,5]
K = aP(a)l/Z· (3)
where P is the applied load_, a is the flaw size, and. a is a function
determined by the stress conditions and the geometry of the structure.
The strain energy release rate is related to K1 by
2 2 . G1 = 7T K1 (1 ~ v )/E (4)
where \) is Poisson Is ratio. . Equation (4) is valid for. the case of
Mode I loading and plane strain conditions in ail isotropic material.
Thus, for a critical value of GIC there is a corresponding value·of
KIC' where KIC is the fracture toughness.
In order to predict the failure stress, crC, the explicit form
of Eq. (3) .must be determined, KC must be measured experimentally and
the size.of the most severe flaw must be known [6,7]. This field of
fracture mechanics is devoted to developing stress analyses and the
test methodology for fracture toughness determination and flaw
detection.

4
y
x
Mode I y
x
Mode II
x
Modem
Figure Failure modes

5
The applicatiOn of fracture mechanics to .adhesive joint design
is complicated by the fact that the explicit fonn of. Eq~ (3) is
generally not known. · The problem is th.at solutions require analyses
for .the stress distribution at the crack tip and. until recently such
analyses have not been available for a flaw .in an adhesive layer.
Very recently, Wang, Mandell, and McGarry [8] deve],oped a stress
analysis for a crack in an a.dhesive layer and· found a .marked .devia--
tion from the classicaT; linear elastic crack length dependence, i.e. ,
Eq. (3). They note that this analysis indicated the strict use of • I ' . . -
linear elastic fracture me.chanics for joint design is not practical. . ~- - - . .
The problem can be approached in an alternate, less precise
way, if the design analysis is based on t.he st!'ain energy release
rate, Ge, rather than th.e stress irit~nsity factor, KC. The general
expression for Ge is given by [ 6, 7 ,9J
2B aa (5)
where B is ·the material thickness in the vicinity of the crack and·
~; is the change in compliance, C, of the structure with crack
length, a. Since oC/oa is a global property of the specimen, Eq. (5)
·is independent. of the 'crack tip stress distribution. For simple
geometries, analytical solutions exist for Eq. (5).
The explicit fo.rm of Eq. {S) for a double cantilever beam is. ·
[3,5,9-11]
(6)

6
where E is the elastic modulus of the adherend, a is the crack length,
and h is the height of the beam measured normal to the crack tip.
However, if the beams are tapered .and the bracketed term is constant,
then GIC is independent of crack length,
(7)
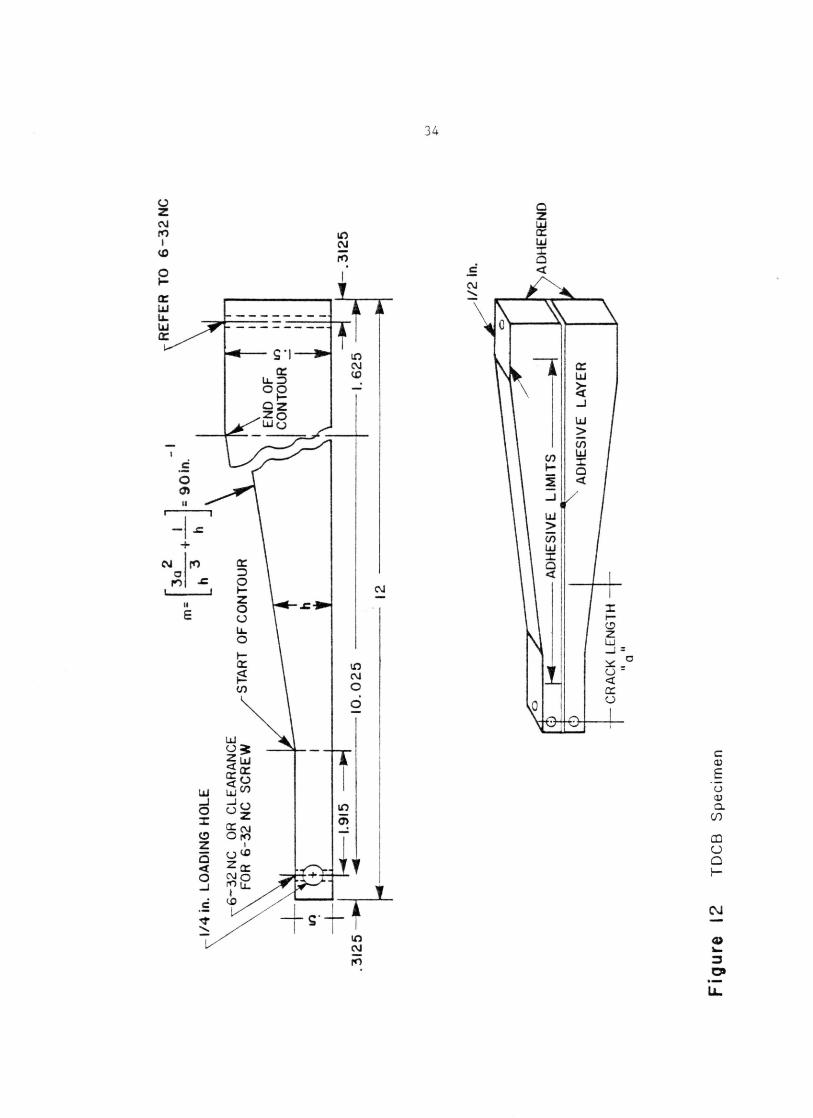
and only PC need be measured. This is the case for the tapered double
cantilever beam (TDCB) fracture toughness specimen.
In this study the TDCB specimen will be used to calculate the
fracture energy of Metlbond 1113-2, a 100% solid modified epoxy film
adhesive [12].
The objectives of this investigation are many faceted. Some
of the more popular test methods [2,3,5,9-11,13-23] a:te presented to
better acquaint the reader with some of the contemporary methods of
testing for fracture strength and fracture toughness. A particular
test method is critical in determining desired adhesive material
properties. Knowing a test method, one must then understand the
limitations of the mathematical model accompanying a specimen. The
derivation of Eq. (7) is, therefore, presented [2-4; 6 ,24] with the
assumptions and limitations of its use. At this point the adhesive
joint should be considered.
The study of adhesive joints can be broken up into three areas:
the mechanical and chemical conditioning and the properties of the
adherend, the change in properties through the thickness and
wettability of the adhesive,. and the many factors affecting bond

7
strength at the interfacial region [l]. Another objective is,
therefore, to present the processes of mechanical and chemical
adhesion in a detailed discussion including many of the factors
affecting bond strength. It has been found that seemingly inconse-
quential changes in adherend preparation processes and the adherent
cure cycle can cause drastic changes in joint strength [l,25]. An
investigation of the test preparation factors affecting joint
strength for Metlbond 1113-2 was felt to be in order to better define
the total test method. Until all factors contributing to a condition
of varied strength between specimens for identical test conditions
can be eliminated, characteristics like rate and time dependence will
be masked by scatter. Once the quality of the joint can be controlled,
an investigation of the rate and time dependence of Metlbond 1113-2
should be conducted. Bulk tensile tests [26, 27] showed that Metlbond
1113-2 exhibited viscoelastic properties. The intent of this investi-
gation was to determine if the rate dependence showed up over a
limited range of rates and if the time dependence could be illustrated
with the TDCB specimen.
The final objective wa.s to use a scanning electron microscope
(SEM) to perform a fractographic investigation of the fractured
surfaces in an attempt to define the mechanisms of failure.

II .. SOME STANDARD TESTS FOR EVALUATING ADHESIVE STRENGTH
AND MODULUS AND.FRACTURE. ENERGY
The purpose of this chapter is to acquaint the reader with some
of the various adhesive test methods. Basically two types of .tests
exist, strength and modulus tests and fracture energy tests. The
first portion of this chapter is· dedicated to briefly describing
some of the avaiiable tests for determining strength and modulus.
The last portion will explain the difference between strength/riioduius
testing and fracture testing before describing various fracture
toughnes·s tests.
Strength. and Modulus Tests
Three basic types ·of strength tests are currently used: tensile .
tests, i;;hear tests and peel tests. A strength t·est is one. in which
a stress-strain response is recorded and a corresponding modulus,
ultimate stress and ultimate strain is obtained. Also located ;in
each of the three groups are tests which have been adaptedas fracture
tests. The mixed-mode fracture test is a type of tensile test, the
single lap shear test has evolved into a fracture test, and thepeel
tests are also fracture tests.[2,3,9,13-20]. So it should be
understood that one test method may b.e used :for both strength and
fracture testing.
8

9
Tensile Tests
Tensile tests are among the most common tests for evaluating
adhesives. This is despite the fact that experienced engineers,
whenever possible, avoid designing adhesive joints so they will be
loaded in Mode I [9]. Some of the more common tensile tests are the
pi test, bar and rod tests, sandwich tests and the cross-lap test
(Fig. 2).
The pi, bar and rod, and sandwich test are all very similar.
The pi test specimen is made up of two round rigid adherends bonded
together and loaded in tension by means of two U-shaped grips which
fit over the annular boss at each end. The bar and rod test,
consisting of either a square or round shaft respectively, are
simply bonded together and loaded in tension by way of pins through
a hole in each end of the specimen. The sandwich test is identical
to the pi test except that instead of bonding the rigid adherends
together a second adherend is bonded between the two end tab
adherends. This second adherend is usually a glass or polymer not
easily adaptable to other test methods. Obviously, the material used
for the end tabs must develop greater bond tensile strength with
the adhesive than that developed between the adhesive and the film.
All four of these tests simply require two flat surfaces to be bonded
together and loaded in tension.
The last tensile test worthy of noting is the cross-lap test.
This specimen was developed to test planar materials such as glass
or wood, but has also been adopted for the study of sandwich and
honeycomb materials. Rectangular specimens are cut from the material

10
I
~~=~ .. ~--ADHESIVE LINE
I I
a. Pi test
r b. Bar a rod tests
ADHESIVE
ADHESIVE
P/2
c . Sandwich test
Figure 2 Tensile tests d~ Cross -I op test
n t.:.:j
A v
P/2

11
to be tested, and the two halves are bonded and loaded as shown in
Fig. 2 [9,13,14].
In all of these tensile tests the only desired data is the
stress-strain relationship.
Shear Tests
Shear tests are very common because samples are simple to
construct and closely duplicate the geometry and service conditions
for many structural adhesives. Four types of tests will be discussed ...
here: the single, double, and symmetric lap shear, and the torsional
shear stress specimen (Fig. 3).
The stress field of the three lap shear specimens is much more
complicated than is indicated by the apparent Mode II tensile loading
scheme. All of the tests exhibit much higher stresses at the ends
of the bonded overlap than the average stress. The single lap
specimen is further complicated by the presence of tensile forces in
the adhesive layer due to eccentric loading conditions. Bending
forces also exist for the double and symmetric lap shear specimens,
but only at high stress levels. Even though the state of stress is
complicated, due to the work that has been conducted on establishing
clear analyses, the shear strength and shear modulus can be readily
calculated from stress-strain data [2,9,13,20].
The last shear test to be mentioned is the torsional shear
stress specimen. This test, as is indicated by its name, is used to
determine shear strength and modulus by torsional loading. With
prope-r sample construction and alignment, the adhesive .is subjected

12
ADHESIVE
p ... ___ ,/
... p
a . Single lap test
ADHESIVE
p ....
ADHESIVE
b. Double fop test
p .. -
_'_' ________ ] ... ... p _______ __,I I -
c. Symmetric test
ADHESIVE
d. Torsiona I test
Figure 3 Shear tests

13
to a more homogeneous stress distribution in this configuration than
with the lap shear specimens. The shear stress T is given
approximately by the expression
Tr T = J
where T is the applied torque, r is the radius to a point, and J is
the polar moment of inertia of the adhesive cross section.
Peel Tests
Peel tests (Fig. 4) have been used for years to compare rela-
tive strengths of adhesives and effects of surface preparations.
These comparisons are normally made by applying a constant rate
loading to the specimen and recording the applied force vs. time.
An average force (or force per unit width), after the specimen has ,
reached a maximum load, is reported as the peel strength [9,13,19].
(8)
The use of peel strength data in structural integrity analysis
is not straightforward. Using some function of the peel stresses
or strains as a failure criterion is not feasible since both the
stresses and strains predicted by linear elastic analyses become
unbounded as the debond line is approached. Therefore, as first
mentioned, peel tests are best suited for relatively ranking adhesive
strengths and comparing various surface preparation techniques
[9,13,19,21].
Fracture Energy Tests
As mentioned earlier, the strength of an adhesive is based on
the maximum load or the maximum load per area or width.

14
p
'
+ p
Figure 4 Peel test

15
Fracture energy is the measure of the energy required to propagate
a crack. In strength test all that is required is the stress-
strain relationship. In fracture energy tests all the mechanisms
of energy consumption, such as viscoelastic and plastic deformations,
must be considered in addition to the load and deflections. Fracture
tests give a quantity which relates the energy required to debond or
fracture a material.
Many types of fracture energy test have been developed. In
this study only the more popular tests. will be discussed. The mixed-
mode, single lap shear, peel, cone, blister, and cantilever beam
fracture energy tests will be presented here.
Mixed-Mode Fracture Energy Test
The mixed-mode test specimen is illustrated in Fig. 5. It is
well known that the fracture energy for an j_sotr6pic material is
lowest in a plane normal to the applied load; in other words, a
crack will propagate normal to the applied load. In the case of
bonded joints a crack cannot always propagate normal to the applied
load but must follow the bond line. Therefore, studies must be
conducted to find the effects of combined Mode I and Mode II
failures. The mixed-mode test was developed to determine the strain
energy release rate for both the opening and in-plane shear modes,
GIC and GIIC respectively [3,5,15-18].
Single Lap Shear Fracture Energy Test
As mentioned earlier (Fig. 2) the single lap shear test is
one of the most common tests.due to its simplicity, and close

16
p
p
Figure 5 Mixed mode test

17
duplication of actual service conditions •. Recently an attempt has
been made to make a fracture mechanics analysis of the lap shear
joint [20].
Detailed analyses [2,9,13,20] have been conducted to calculate
the stresses in the joint and to introduce them into an energy
balance to determine the initiation of adhesive fracture. The first
step of the process is to evaluate the total strain energy stored in
the joint, U. Having obtained U, it is now possible to apply the
Griffith-Irwin energy balance for elastic systems,
-= au (9) aa
where y is the energ)7 required to create a unit area of new fracture a . .
surface due to the total extension of the crack over a length a .•
Peel Fracture Ener&Y Test
Theoretically, the peel specimen (Fig. 4) is a very versatile
specimen for obtaining adhesive fracture energy, since various combi-
nations of Mode I and Mode II loadings can be applied by varying the
peel angle. One of the difficulties in using this specimen has been
in providing accurate stress or energy values as required to convert
critical load to adhesive fracture energy. A second problem area is
in determining the critical load at which debond occurs.
There are particular cases for which energy release rate
analysis of peel specimens can be computed analytically. But, in
each case many simplifying assumptions must be made. The change in
stored energy is then calculated by subtracting the stored energy in

18
the zero curvature portion prior to debond from the stored energy
in the same portion after debond. The work is calculated by the
change in displacement of the load and is a function of the angle of
applied load.
Cone Fracture Energy Tests
One test method which has provided great insight into· adhesive
fracture processes is the cone test (Fig. 6) [19]. For most adhesive
test specimens presently in use, flat surfaces are bonded together.
However, in many practical applications, such as bonding fibers in. a
matrix or crowns to teeth, the mating surfaces are curvilinear. In
addition, many of the adhesive applications that involve Mode III
loading have axisymmetric geometries. Cone tests can be designed
and tested to have various amounts of the three·:·;c:J:.assical loading
modes. For example, a cylinder (0° cone) pulled from a.matrix or
cylindrical hole is mostly a Mode II loading; a Mode I failure is
obtained from a tensile lOading of a button test (90° cone) with a
central flaw; a button test with an initial circumferential debond
at the outer bond·radius loaded in torsion produces nearly a pure
Mode III loading [9,19].
An initial intentional deborid s:j.:mulates a .flaw or crack in
the bond. Calculating the energy stored at various cone angles can
model any possible combination of the three modes of failure
fracture·energy.

(0
-w ....J (!) z <t
w z 0 (.)
~ a w :JO &9 <l
19
a z 0
1JJ >
cc w a (/) w _J :i: <! a ~
I-z
-tn Q) -<lJ c: 0 u

20
Blister Fracture Energy Test
The blister test (Fig. 7) is an outgrowth and modification of
earlier methods proposed by Dannenberg [23] and Maryshev and Salganik
[13]. In its simplest form, it consists of a disk or plate which has
been bonded to a rigid material, except for a central portion of
radius a. When the unbonded region is pressurized, as by the
injection of a compressed fluid, the plate lifts off the substrate
and forms a blister whose radius stays fixed until a critical pressure,
pCR' is reached. At this value the radius of the blister increases,
signifying adhesive failure along the interface.
The elastic strain energy stored in the disk can be calculated
from the input work. Utilizing the energy balance concept, one then
equates the energy decrement to the change in adhesive fracture
energy. In principle, any thickness or diameter of disk and any
debond radius smaller than the disk radius can be used. However,
analytical, closed-form engineering solutions for the displacement
are currently available only for the near limit cases of a disk
using plate theory and the infinite medium, penny-shaped flaw con-
figuration [9,13,19,21-23].
Cantilever Beam Fracture Energy Tests
There are three types of cantilever beam tests, the single
cantilever beam, the double cantilever beam, and the tapered double
cantilever beam (TDCB) fracture energy tests (Fig. 8). From the
standpoint of simplicity both in analysis and from the experimental
point of view, there are certain advantages to the TDCB specimen.

21
z w :E (.) w a. en
w 1-<t .....I a.
a z w a:: w :I: a <! 0 (.!)
a::
a:: w ~ ...J
UJ > en w J: a c::x:
-(/) <l) -.. OJ -"'
CD
r--Q) ii-:J O'
LL

22
ADHESIVE
a. Single cantilever beam
p
p ADHESIVE SPACING SH IMS (optional)
b. Double CB
c. TDCB
Figure 8 Cantilever beam tests

23
This specimen is contoured in such a way that the energy release
rate, GIC' is a function of load only, independent of the crack
length [2,3,5,9-ll,16,18,21]; As discussed in Chapter I, this
constant compliance specimen will be used as the fracture energy
specimen in this investigation of Metlbond 1113...,.2.

III. ANALYTICAL METHODOLOGY FOR THE TDCB
The Strain Energy Release Rate
As was previously mentioned in Chapter I, the strain energy
release rate is a measure of fracture energy. Two slightly different
derivations of the strain energy release rate will be presented for
the TDCB. First, however, it will be shown that the work required to
extend a crack by a unit area, which is the fracture toughness, is
equivalent to the strain energy released by a specimen [2].
Consider a cracked plate of unit thickness (Fig. 9). The plate
is then loaded in a fashion described by Fig. lOa, where P is the
applied load and L is the loa.d deflection. The stored elastic
energy, w1 , related in Fig. lOb, is the area under branch AB of
Fig. lOa. The relation between load and deflection for this specimen
can be written as
P = ML
or
L P/M (10)
where M is the specimen stiffness. If the response of the specimen
is linear elastic over the load range, M will remain constant. If
the specimen response is nonlinear elastic over the load range, M
will change in value. Assuming a linear elastic response, if the
load is removed the specimen will return to its original undeformed
shape.
24

25
p
B
p
Figure 9 Edge cracked plate

p p
p p
p PJ N
CJ
'\ P
ft
Pf t
. Pit
. Pe~J
Pe
B
Pit /1
~ I P
e LI?:~ .
W3Lf
Lf
L
P•Vw'
L
/ JC
e.
Pel
...-
u L
d.
Lf
L c.
-r-
t..e=
b.
A
a.
Fig
ure
10
Plo
t of
the
load
ing
cycl
e an
d th
e w
ork
perf
orm
ed
in
adva
ncin
g a
~rock

27
Now consider a crack extension as described by branch BC in
Fig. lOa. The dimensions of the specimen are controlled so that the
load deflection, Lf, remains constant. This fixed grip crack
extension process will be conducted in such a way the load relaxation
represents a release of stored elastic energy equal to w2 (Fig. lOc).
This change :3ffects the parameters of Eq. (10). The load level
drops from Pf to Pe while the extension remains constant at Lf =Le.
Therefore, the stiffness must decrease from M to M due to the reduc-e
tion in the number of structural elements. This process of elastic
crack extension is defined a.s the progressive rupture of structural
elements at the crack tip.
The load is then removed as described by branch CA in Fig. lOa.
It should be observed that all the strain is recovered when the load
is removed. The area under the branch CA in Fig. lOa is equal to
the stored elastic strain energy, w3 , illustrated in Fig. lOd.
Through the entire cycle, the unrecovered work, w1 - w3 , is
equal to the strain energy released. Thus, the work required for
crack extension is equivalent to the strain energy released. The
same relation can be developed for a fixed load condition as was
demonstrated by Irwin [4].
It should be noted that the stress relaxation in step BC might
have been accomplished by processes involving flow, either plastic
and/or viscoelastic. This process is much different than the
rupture process. If any flow occurs the fundamental basis for linear
elastic fracture mechanics is violated. Assuming now that the branch
BC of Fig. lOa was accomplished by processes involving flow, where

28
the remaining load is removed, -the relaxation will be less than the
original elongation. A permanent set will result with internal
stresses. An illustration of this is shown in Fig. lOe, a case for
which LEFM would be violated.
It has been stated that for a given stress relaxation load drop
in the fixed grip case, or for a given.strain relaxation in the fixed
load case, the strain energy released by flow processes is much
greater than for rupture processes [2]. Thus, plastic deformations
obscure desired results. The criterion for the validity of an experi-
mental fracture toughness determination is that no-appreciable
permanent deformations take place during the test. The much discussed
requirement that crack tip radius must meet certain-maximum specifi-
cations is based on the experience that if the radius exceeds a cer-
tain amount (usually experimentally determined), permanent deformation_
will be excessive [2].
The basis of the.derivation for the strain energy release rate,
Ge, is the work needed to change the crack area by a unit amount,
which may be expressed as the work needed to extend a crack by a
unit amount if the crack area is a function only of the crack length.
An expression for GIC will be reached first by considering
a fixed grip condition [2,6], then by considering a moving grip
condition [6,7].
The two relations for the deformation and work of deformation
as given by Eq. (2) and (3) do not explicitly involve crack dimensions.
Differentiating both equations with respect to the crack area, A,
will give dimensions suitable for Grc· The starting equations are:

and
29
L P/M
W = - 1/2 PL s
(10)
(11)
where W is the energy stored due to the work of elastic deformation. s
After differentiating and dropping the terms involving dL/dA, due to
the fixed grip condition, the following equations are obtained.
dP/dA " ( J. I
-PM~ 'dA
dW /dA = - 1/2 L dP/dA s
Substituting (10) and (12) into
dW /dA s
(13) results in,
l~ 2 'dA
(12)
(13)
(14)
The term dW /dA is the change in elastic energy per unit change in s
crack area, therefore, dWs/dA = Grc· The change in crack area, dA,
is equal to the change in crack length, da, times the plate thickness,
B, or dA = Bda. Therefore,
(15)
where C is the compliance which is defined as the reciprocal of the
stiffness M. Given GIC' the only unknown term in Eq. (15) is the
change in compliance per unit change in crack length.
Now consider the condition of the grips being free to move when
a load P is applied. For a plate of unit thickness the condition
for crack growth is:

or
where
30
d(U - F + W)/da = 0
d(F - U)/da = dW/da
U = stored elastic energy in the plate
'F = work performed by external forces
W = energy for crack formation.
The crack extension force or strain energy release rate is
Ge = d(F - U)/da
(16)
Now consider a cracked plate.of thickness Band load P, Fig. 9.
When the plate is loaded the load-application points .deflect by an
amount a. When the crack increases in size by an amount da the
displacement increases by do. Therefore, the work done by external
force is Pde. It follows that:
Ge = d(F - U)/da = l/B (Pdo/da - dUT/da) (17)
i;.Jhere B is the plate thickness (Note: Eq. (16) is for a plate of
unit thickness) and UT is the total elastic energy in a plate of
thickness B. As long as no crack growth occurs, the displacement a is proportional to the load:
a = CP (18)
where. C is the compliance. The elastic energy then becomes

31
U = 1/2 P8 = 1/2 P2 C T
Substituting Eqs. (18) and (19) into (17),
Ge= l/B[P a(CP)/aa - 3(1/2 P2c)/aa]
G = l/B [P2 ~ + CP dP - .!_ P2 ~ - PC dP l c aa da 2 aa daj
2B aa
(19)
(20)
results in an expression for Ge identical to Eq. (15). Nciw consider
the specific geometry of the DCB specimen.
The compliance of a material is equal to the displacement that
occurs per unit load,
C = 8/P
Therefore, the deflection is the quantity that must be determined.
For a DCB (Fig. 11) the displacement 8 is [24],
3 8 = 8Pa + 8Pa
Eh3B EhB
Therefore, the compliance is,
3 C=~+8a
Eh3B EhB
Thus, the strain energy release rate is,
(21)
(22)
(23)

a.
32
LU > (/) LIJ :I: 0 <t
a.
c: <1)
E (.) Cl) a.
<.n
CD u 0

G _ 4P 3a + 1 . 2 [ 2 l IC - EB2 h3 h
(24)
The modulus of the adherend, thickness, and height: E, B, and h
respectively, are constant for a monolithic DCB of constant thickness
B. In order to calculate GIC the only data needed are the crack
length and load level at incipient fracture. Those data are not
easily acquired, however, due to the fact that the crack tip is hard
to accurately locate. This problem can be avoided through the proper
consideration of the quantity (3a2/h3 + l/h). By setting this
quantity equal to a constant, GIC would be independent of the crack
length a. The geometry associated with making GIC constant for the
double cantilever beam gives rise to the TDCB specimen. The height,
h, of the beam is often machined to give the quantity (3a2/h3 + l/h)
a value of 90 in-l (Fig. 12) [11]. The strain energy release rate
may now be written as
(25)
-1 where m = 90 in • For the TDCB specimen, the only information
required to measure GIC is the load, PC, to propagate the crack.
It should be realized that many PC data points are obtained
from each constant cross head rate test. As the load is increased
to PC the crack will propagate but will arrest when the load is
dropped. As the cross head continues ·its travel the load will
again increase to PC. Crack growth will occur until the load
relaxes. The process will continue for the length of the specimen.
1/4
in.
LOA
DIN
G H
OLE
6-32
NC
OR C
LEA
RAN
CE
FOR
6-32
NC
SC
RE
W
[Ja2
I J
. -I
m= ~
+h
= 90
an.
STAR
T O
F C
ON
TOU
R
~it=
. t
\ .31
2.5~
...
1.915
=-.1
10.0
2.5
t--~~
-~~~~~~~~-
12
r...
AD
HES
IVE
LIM
ITS
...-I
A
DH
ES
IVE
LA
YE
R
CRA
CK L
ENGT
H 11
II
a
Figu
re
12
TD
CB
S
peci
men
RE
FER
TO
6
-32
NC
~.312.5
--1
ADH
EREN
D
w ~

IV. MECHANICAL AND CHEMICAL ADHESION
Bascom and Patrick [l] discuss the topic of mechanical and
chemical adhesion in both an inclusive and compact manner. They
divide the subject matter into three categories: the surface properties
of the adherend, the surface behavior of the adhesive, and the
properties of the adhesive/adherend interface. The succeeding dis-
cussion is organized accordingly and will be limited to the adhesion
of polymer adhesives to metals.
Surface Properties of the Adherend
The surface properties of the metal adherend is the subject
which requires the most extensive investigation in the search for the
ideal bond. Many things must be considered in selecting and preparing
a metal. The kinds and extent of oxide films that form must be
known in determining surface characteristics. The niechanica1 and/or
chemical treatments are pertinent to the mechanical properties of
the base metal at its surface. The roughness of the metals surface
must be considered in understanding how the adhesive will spread.
Further, a surface analysis should be conducted to establish such
things as the composition, structure, chemical bonding of surface
molecules and atoms, and the surface tension of the metal. Each
of these items will now be discussed in greater detail.
To properly understand oxide films there are two main properties
of the films which should be known, the crystalline structure of the
film and its degree of hydration. Abundant information exists on the
35

36
growth and chemical formation of metal oxide films. Contained in
oxide films are physically and chemically adsorbed water and various
contaminants including inorganic salts and organic materials. The
inorganic salt contaminants, because they are usually hydroscopic, may
lead to the adsorption of many monolayers of water even if the salts
-7 2 are present in trace amounts (10 gm.fem ). This adsorbed water
may interfere with the spreading of liquid adhesives. What is more
serious, however, is that water adsorbed by hydroscopic contamination
can collect as micro.droplets of salt solutions and be strongly
alkaline, thus capable of attacking the metal chemically. As for
the adsorbed organic materials, which are so hard to control in
industrial atmospheres, they may adversely effect the wettability of
the adherend. If they exist as more than one molecular layer they
may act as a weak boundary.
Mechanical treatments are known to cause various changes in
the mechanical properties at the surface of metals. One example of
this is machining. Machining a metal causes considerable surface
strain. A permanent strain may exist to a considerable depth and
may be on the order of 5% to 10% at the surface. This situation
is worsened for polished or burnished surfaces. Invariably, any
cutting, working or rolling of the metal leaves it in some state
of strain. This strained region may be cohesively weak and cause
poor bond strength. More importantly, the strain energy at the
surface adds to the susceptibility to corrosive attack by moisture
and so contributes to moisture induced bond failure.

37
Chemical treatments are also known to cause major changes in
mechanical properties. Usually as-received metals are subjected to
a sequence of treatments beginning with washes. to remove gross
contaminants followed by chemical etches and a water rinse. These
treatments have been found to be very important because they remove
organic contamination, loose oxides, and some of .the strained surface
layer. Seemingly inconsequential changes in treatment procedures
qften result in weak bonds or unusual susceptibility to moisture.
One reported example [l] cites that, af~e.r using acid-chromate etch
on aluminum, the final rinse. must be made with tap water rather than
deionized water. This is because the deionized water leaves a thick
weak hydrous aluminum oxide;. bayerite, on the surface, whereas, the
tap water leaves a thin cohesively strong monohydrate.
In addition to surface cleaning .and etching, the metal may
receive further treatment to convert the surface to a corrosion
resistant nonreactive form. Examples are phosphate steels and
anodized aluminums. Bonding to surfaces of these materials has
presented problems; some of which were discussed at a 1968 symposium
on polymeric coatings. Another method of corrosion protection is
by clading an alloy w:ith a more anodic metal. However, bonds to
clad surf aces can be m,ore susceptible to moisture than the bonds to
unclad metal surfaces.
The roughness of the metal surface is an important parameter
in the spreading .of liquid adhesives. The scratches in the surface
will help in moving the. adhesive because of the capillary pressure,
due to the radius of curvature .of the scratches, ''pumping" the

38
liquid along. Therefore, spreading can occur much faster on a
scratched surface than on a perfectly smooth one. It should be kept
in mind that on surfaces such as milled surfaces the pumping process
may have a preferential spreading direction. In actual practice,
however, adhesive resins are forcibly spread onto adherends at rates
that greatly outrun any capillary spreading phenomena. In the case
of semi-solid film adhesives, as they are heated during the cure
cycle, this capillary action may aid in the thorough spreading of the
adhesive.
In recent years extremely sensitive methods of surface analyses
have been developed which,· combined with the more classical methods
of surface examination, make it possible to fully characterize an
adherend surface. Most of these techniques are based on radiation
or particle scattering. In Table 1 the analytical methods are listed
according to the type of information generated. A solid surface
can be fully characterized from its gross roughness down to its
elemental surface composition.
The flow of an adhesive liquid onto the adherend surface is
a wetting-spreading phenomena. There exists a fundamental relation
between the contact angle, 8, and the thermodynamic work of
adhesion, WA,
w = y(l - cos 8) A
where y is the surface tension of the liquid adhesive and 8 is the
(26)
contact angle the liquid makes with the solid. Finally, wettability
measurements can give direct information about the molecular

39
TABLE 1
Methods Used for the Study of Solid Surfaces
Macrostructure Surface topography
Friction measurements Ellipsometry
Molecular Composition and·. Structure
Multiple interference reflection spectroscopy
Raman spectroscopy
Ellipsometry Contact angle measurements
Surface potential measurements
Crystal Structure
X-ray diffraction Low energy electron diffraction, LEED Reflected high energy electron diffraction, RHEED
Elemental Composition Photoemission spectroscopy
Microprobe Ion scattering spectroscopy
Low energy High energy
Ion-probe mass spectrometry Appearance potential spectroscopy

40
structure of organic and inorganic surfaces. The contact angle is
a function of both the adhesive and adherend surface tensions. In
order for the contact angle to be zero, the ideal spreading condition,
the surface tension of the adherend must be greater than that of the
adhesive.
The critical surface tension of a metal or metal oxide surface
is reported to be on the order of hundreds of dynes/cm [l]. Organic ·
polymers have surface tensions of 50 dynes/cm or less. Consequently,
it would be expected that all polymer liquids would exhibit zero
contact angles on metals. However, it should be noted that contamina-
tion by organic materials or an adsorbed water film can reduce the
surface tension of metals to values less than 50 dynes/cm creating
a nonspreading condition.
Surface Behavior of the Adhesive
The general statement is frequently made that the adhesive must
"wet" the adherend. What is meant is that in bringing the adhesive
and adherend together no air is trapped at the interface. Ideally
three criteria must be met. The resin liquid should exhibit a zero
or near zero contact angle, sometime during the bonding process the
resin viscosity should be no more than a few centipoise, and the
rate and manner at which the adhesive and adherend are brought
together should give the resin time to displace the air.
The spreading criterion is usually met for the case of an
organic liquid polymer on a dry metal oxide free of organic
contaminants. Even if the contact angle is zero, surface tension

41
gradients may exist at the spreading front (due to thermal or
concentrated gradients) which may help or hinder spreading depending
on their direction. Here again though, these effects will be over-
shadowed by the much faster forced flow of the adhesive during
fabrication. However, the gradient forces and capillary forces may
play a role in the redistribution of the adhesive after the initial ·
application.
The second criterion that the adhesive have a viscosity of only
a few centipoise is seldom met in practice. Consequently, if the
liquid adhesive is .forced rapidly over the adherend, the liquid at
·the surface cannot keep up with the advancing front so an apparent
dynamic contact angle develops. With the typical spreading velocity
of 10 cm/sec and a surface tension of 30 dynes/cm a dynamic contact
angle of 90° has been observed for most viscosity ranges [l].
In view of this high advancing angle, it is very probable that
air is trapped, especially in surface scratches and pores. What
happens to this air is unknown, but if it is assumed the air is
trapped as a thin air film, capillary forces will tend to gather it
up into sherical shapes. This retraction is a liquid/air displace-
ment process and is subject to effects of roughness and surface
tension gradients on spreading. The importance of these viscous .·
and capillary effects is most evident in bonding with commercial
structural adhesive films, such as Hetlbond 1113-2.
Structural adhesives are often supplied as semi-solid resins
unsupported or supported by organic fibers or glass carrier cloth.
Although they are economical and convenient their application

42
invariably results in trapped air. The sequence of events is
illustrated in Fig. 13. When the film is first placed on the metal,
regions of thin air film are trapped, Fig. 13a. As the resin
softens the air pulls up into bubbles, Fig. l3b, which are displaced
into the resin film, Fig. 13c. These events occur if the resin meets
the wetting· criterion. However, if the wetting criterion is not met
then the air remains at the interface, Fig. 13b. Bascom and Patrick
cite various methods of removing the unwanted air and thus obtaining
higher fracture strength.
Properties of the Adhesive/Adherend Interface
The adhesive/adherend interface is not planar, but rather a
region of multiphase -- some adhesive, some adherend or both, with
properties differing from the bulk adhesive. This would be so even
if the adherend were ideally smooth and chemically homogeneous and
if the adhesive polymer were of a single component because the
molecular configuration of a polymer at the interface is different
than in bulk. The transition from interfacial structure to bulk
structure may extend over several thousand angstroms. The fact is,
that adherend surfaces are never smooth or homogeneous and adhesives
are rarely well defined polymers. These factors have a profound
influence on the properties at the interfacial region. For example,
if an adhesive fills this roughness of the adherend then it might be
considered that the interfacial region is at least as thick as the
depth of the scratches.

43
a. Initial entrapment
b. Partial displacement
Figure 13 Air trapped by film adhesives

44
Chemical composition of the adhesive near the interface is
likely to be different from bulk due to the selective adsorption of
one of the constituents. For example, in amine-cured epoxies, amine
is preferentially adsorbed by glass and metal substrates. Enrichment
' of the interface with amine would cause the resin in this region
to cure differently than in bulk. In addition, any amine left at
the interface could affect the chemistry of stress corrosion. Even
if no preferential adsorption takes place the adherend can still
affect the solidification of the polymer.
Other problems which occur at the interface are the stresses
which occur due to differences in thermal coefficients of expansion,
resin shrinkage accompanying cure, resin crystallization and even
long range orientation of the adhesive molecules. To some extent
relaxation processes in the solid resin may relieve these stresses,
but near the interface the adherend will hinder relaxation by
mechanical and/or chemical bonding constraints. In addition to
resin-thermal effects, interfacial stresses can be induced by surface
roughness.
The last topic of discussion is that of primers and adhesion
promoters. Their function is to protect the adherend from moisture
and other contaminants prior to bonding, increase the adherend
wettability, and/or. improve the interfacial strength. These adhesion
promoters have been shown to improve the moisture resistance of
glass/resin and metal/resin bonds, a major step toward solving the
problem which has been the most serious deterrent to their wide-
spread use. The primers are usually applied to an adherend as a thin

45
polymeric film which the resin can penetrate and presumably interact.
The fact that the adhesive resin and primer or promoter coating can
interdiffuse implies an interfacial layer having properties
considerably different than either of the components separately.
This is probably the key to the mechanism of adherend surface
treating agents.

V. EXPERIMENTAL CONSIDERATIONS
The adhesive investigated in this study was Metlbond 1113-2,
a 100% solid unsupported modified nitrile epoxy film, produced by
Narmco Materials, Inc. of Costa Mesa, California. All tests were
conducted using the tapered double cantilever beam (TDCB) fracture
toughness specimen as shown in Fig. 14. The TDCB specimens used
in this study are commercially available through the Materials
Research Laboratories of Glenwood, Illinois.
Specimen Preparation
As was stated earlier in Chapter IV, the prebond adherend
preparation process must be followed exactly to ensure a good bond.
The surf ace preparation procedure for an aluminum substrate is pro-
vided by Narmco [12]. This is as follows:
1. Remove all inked markings by solvent wiping with clean
rags soaked in methyl ethyl ketone.
2. Rack parts to insure intimate contact with processing
solution on all surfaces.
3. Vapor degrease in trichloroethylene by suspending in the
vapor zone until vapors no longer condense on the surface.
Exceptionally dirty parts may be flushed with clean, hot
trichloroethylene liquid and cooled prior to vapor
degreasing.
4. Degreased metal is then immersed for 20 ± 2 minutes at
150°F to 160°F in_ a solution of the following composition:
46

47
Fig. 14 . TDCB Specimen Being Tested .

48
Distilled or deionized water
Sulfuric acid (sp. gr. 1.84)
Sodium dichromate
30 parts by weight
10 parts by weight
4 parts by weight
(Potassium dichromate was used in place of sodium dichromate
because we were unable to obtain the latter. A correction
should be made in using potassium dichromate for the
change in molecular weight. More than 4 parts by weight
will be needed to get the same amount of -cr2o7 in solution.)
5. Rinse thoroughly by either one or a combination of the
following methods.
Overflow Rinse: Either one or two tanks may be used for
inunersion rinsing provided the pH of the final rinse is
maintained between 5 and 8.5 and uses deionized water.
Spray Rinse: Spray with water maintained at a pH of 5
to 8.5. All surfaces must be thoroughly flooded with
rinse water.
6. Air dry parts by placing in a rack so as to prevent water
retention. Thorough draining is required to prevent water
stains which might weaken subsequent bonds. Drying may
be facilitated by drying in an air circulating oven at
not over 150°F after the water film has air dried from
the surface, - 15 minutes. Do not use compressed air
and/or cloths to dry cleaned surfaces.
After the adherends had thoroughly dried Metlbond 6276 primer
was applied. The primer was allowed to come to room temperature
before being applied in smooth even coats with a fine brush. It is

49
important that the primer be continuously agitated during application.
To cure Metlbond 6726 allow it to air dry at room temperature for 2
hours. It is not imperative that the joints be prepared immediately
as long as the primed surfaces are protected from any form of
contamination. It is suggested that primed surfaces be wrapped in
non-waxed Kraft paper to store [12].
The Metlbond 1113-2 was received in sheets measuring 12 inches
(30.48 cm) square by - O.Oll inches (0.02794 cm) thick. The desired
bond thickness was.~ 0.030 inches (0.0762 cm); therefore, three layers
of adhesive were required. Following the application of the adhesive
teflon tape - 0.002 inches (0.00508 cm) thick was used as a crack
starter. At the instant the crack began to propagate the crack tip
. would jump from the interface to the center of the adhesive. As shown
in Fig. 12 the bond widtlJ. was 0. 5 inches (1. 27 cm). Six glass beads
ranging in diameter from 0.025 to 0.030 inches (0.0635 to 0.0762 cm)
were placed in pairs at three locations along the tapered section of
the TDCB specimen to control the bond thickness with steel shims
0.025 inches thick employed at the ends. After the joints were pre-
pared a loading device, Fig. 15, was applied to the specimen that
could be placed in the oven during cure. The standard cure tempera-
ture of 260°F was used, but the standard cure time was increased 10
minutes to 70 minutes. With this specimen geometry either the
pressure or bond thickness can be controlled. Since bond thickness
was a test variable we chose to control it. The specimens were then
allowed to cool slowly in styrofoam incubators until they reached
room temperature, about 8 hours. Due to the small number of TDCB

50
Fig. 15. Loading Apparatus for Use During Cure.

51
specimens available, after testing the adherends were machined to
remove the fractured adhesive so the specimens could be used again.
Experimental Procedure
All tests were conducted on an Instron testing machine using
constant cross head rates ranging from 0.005 in./min to 2 in./min
(0.0127 cm/min to 5.08 cm/min). The Instron strip chart recorder
was used to record the load arid cross head deflection. The pro-
portional mode was used to drive the chart at a rate of 50 times
the cross head rate. A typical experimental set-up is shown in Fig.
16. The load was introduced through steel grips made specifically
for the TDCB specimen.
One creep test was also conducted to determine if the material
acts viscoelastically in the bonded state. The Instron testing
machine was used with the load cycler set to hold a 500-pound load.
The Instron strip chart recorder was again used to record the load
and cross head deflection. And again the chart was driven in the
proportional mode at 50 times the cross head deflection rate.
All specimens were tested to. failure.
Grc Dependence to the Specimen Preparation Process
The specimen preparation process was described in detail in
the beginning of this chapter. It.was not known prior to testing
how sensitive the strain energy release rate, GIC' would be to the
preparation process. Therefore, before presenting data that might be
subject to scatter caused by preparing the specimens and not the
statistical variations which exist in the adhesive, the specimen

52
Fig . 16. TDCB Test Set-Up.
53
preparation dependence of GIC was investigated. Table 2 will be
instrumental in illustrating the various effects.
Before continuing, the nomenclature of Table 2 should be well
understood. Column one is labeled Specimen No. All of the
specimens used in this study had a number stamped on them. Un-
fortunately we did not have enough specimens to continue experi-
menting without reusing them. Consider specimens 132-1 and 132-5,
both are specimen 132 but the -1 and -5 represents the first and
fifth test conducted respectively. Therefore, specimen 132-1 could
be referred to as test number 1 and specimen 132-5 as test number 5.
Column two is labeled Batch No. Simply, this refers to the specimens
that were cured in the oven at the same time. Only two specimens
would fit in the over). at one time, consequently, each batch number
refers to two specimens. The remaining column headings should be
self-explanatory. The bond thickness is the thickness of the adhesive.
The cure time refers to the amount of time the adhesive was cured
at 260°F. The test rate is the cross head rate. The test duration
is the total length of time the test took from initial application of
the load to failure. And GIC is obviously the strain energy release
rate given by Eq. (25).
Reviewing the adherend preparation procedure, two steps in the
process were felt worthy of investigating, the chromate-acid bath
and the sensitivity of the cleaned metal surfaces to minor contami-
. nation prior to applying the primer.
To this point a close examination of the specimen fracture
surfaces revealed all of the specimens failed cohesively through the

54
TABLE 2
GIC Test Data for Various Specimen Preparation Procedu,res
Bond Thickness Cure Time Tesc Rat:e Test: Grc Spec. Ba.t:ch in (cm) @. 260°F in/min Dur:ation in-lb/in2
No. No. x io-3 ~tin (cm/min) ~!in. (J/m2)
132-la l 8 - 60 o.os (0.12i) 7.04 12.19 (21. 33) (20. 3)
169-3a l 8 - 60 0.02 (O. 0508) i.O 7.42 (12.99)
li8-2a 2 8 - 60 0.05 (0.127) 7.68 11.53 (20.lS)
205-4a 2 8 - 60 o.a5 (a.12 7) 7.28 10.65 (:!.S. 64)
132-5° 3 25-30 - 60 a.as (0.127) a.a8 32. S9 (5i.a3) (63.5'-76.2)
178-6b 3 2S-30 - 6a a.as ca.127) S.i6 25.04 (43.82)
169-ib 4 25-30 - 6a a.as ca.127) la.2a 34.13 (59. i3)
'2.aS-8b 4 25-30 - 60 a.as ca.127) 10.68 33.45 (j8. 54)
60a-9c 5 25-3a 90. o.os (0.127) 11.48 38.64 (67.62)
602-lOc 5 2S-30 90 o.os (0.127) 11. 04 35.28 (61.74)
603-11° 6 25-30 - 60 0.05 (0.12i) 10.04 30.38 (53.17)
613-12° 6 25-30 - 60 0.05 (0.12i) a •o , . J- 27. 75 (48. 56)
623-13d 7 25-30 - 60 o.os (0.127) 3.52 23.04 (40.32)
626-14d 7 25-30 60 o.os (0.127). 3.36 23.54 (41. 20)
6Z4-19e 8. 25-30 70 0.05 (0.127) 11. 32 !..O. ~3· (70.79)
::;12-20= 3 25-30 iO 0.05 ca.127) 11.s 43. 56 (75.23)
613-lSf 9 25-3a 70 I). 05 ca.12n Cl.O 24.44 (4Z.i7)
:l05-16f 9 25-3a ia I). 05 ca.12i) . ?.88 29.'31 (52. li) ~
622-li" la 25-3a iO o. 05 (0.12i) s. 74 21. 68 (3i .94)
628-lSf 10 25-3a ;a a.05 (0.127) S.i2 27.12 (!..;'. 46)
o~oos in. bond thick."less - a.
0.025 - 0.030 in. bond :hickness - b. - ~
a - reco:nmended ?reparacion procedures followed (RP~F)
b - R.?.P.F. c - 90 min .. cure, ochen;ise· -R.?.?.F. j -· shor: cooling ;ieriod, othen;ise R.P.?.?. e - 70 :nin. cure, long cooling ;n~riod·, ochet"T..:ise '-..?.?.:.
;o win. aur.e, long cooli=ig ;ier_iod. .. olC." acihesi·.r~, oc:i.e~..:ise ~-?. ?. : .

55
adhesive with tiny spots of adhesive failures along the outer edges
of the specimen. Intuitively it was felt that if the adherend was
put in the chromate-acid bath at a higher temperature better bonds
should result. In contrast, if the cleaned surfaces were contaminated
prior to the application of primer, poorer bonds should result.
This indeed was the case. Some adherends were chemically trea.ted
in the chromate-acid bath at 100°F higher than is recowmended and a
better.bond occurred resulting in no detectable adhesive failures
along the specimens' edges. The specimens that were contaminated
were done so by touching their surfaces. after thoroughly cleaning
my hands with methyl ethyl ketone, the main constituent of the primer.
Larger than normal adhesive failures were noted at the contaminated
locations. However, no appreciable change in GIC could be obs:erved
between the two types of tests.
The next specimen preparation procedure to be investigated was
the application of the adhesive to the adherend. Two criteria were
considered: the age of the adhesive and the thickness of the adhesive
layer.
According to Narmco specifications Metlbond 1113-2 has a short
life of six months at 40°1!'. or sixty days at 75°F. Specimens 613-15·
through 628-18 were prepared using a sheet of adhesive left out of
the refrigerator for seven days in a room maintained at 72°F.
Specimens 624-19 and 612-20 were prepared using a fresh sheet of
adhesive taken from the.refrigerator the same day. All other known
variables were held constant during the preparation and testing
procedures. The result was the specimens prepared with the "old"

56
adhesive had drastically reduced GIC values. Also the adhesive layer
contained many more trapped air bubbles. A comparison of ''old" and
"new" adhesive (Fig. 17) illustrates the drastic difference.
Adhesive stored at room temperature for substantial periods was
definitely different than that freshly removed from cold storage.
Bascom et al. [3,5,10,11] reported that the strain energy
release rate, GIC' is a function of bond thickness for various
adhesives tested using the TDCB specimen. A typical plot of Bascom's
findings are shown in Fig. 18. A clear bond thickness dependence
can be observed with the maximum GIC occurring at about 0.025 in.
(0.0635 cm). Two adhesive thicknesses were studied in our investiga-
tion, - 0.008 in. (0.02032 cm) and - 0.030 in. (0.0762 cm). The GIC
values for the thicker bonds were approximately three times that of
the thinner bonds, clearly indicating a strong bond thickness
dependence. Again referring to Fig. 18, it can be observed that around
the maximum value for GIC' GIC is relatively stable for the bond
thickness range of 0.015 in to 0.030 in. (0.0381 cm to 0.0762 cm).
For this reason a bond thickness of about 0.030 in (0.0762 cm) was
felt to be in a range that would be less sensitive to thickness
variations which existed between glass beads (all the glass beads
were between 0.025 in and 0.030 in. in diameter).
A note should be made about the TDCB specimens received from
MRL. In testing the specimens with the 8 mils bond thickness, it
was observed that the adhesive thickness varied from about 2 mils
to 8 mils. Correspondingly, the results of the test· (Fig. 19)
reinforced the bond thickness dependence of GIC. The bond line was

57
"Old" Adhesive
"New" Adhesive
Fig. 17. Comparison of "Old" to "New" Adhesive.

(cm
)
.05
.10
.15
.20
.25
.30
.35
25
4.0
29
8°K
(2
5°C
) O
uns
tabl
e pr
opag
atio
n
20
()
sta
ble
prop
agat
ion
3.0
15
(kJ/
m2
)
(in-
lb/in
2)
2.0
10 5
LO
o I
I .
~
o .01
;
2 I
I I
I I
t-o
.04
.06
.08
.1
0 .1
2
Fig
ure
18
Grc
vs
bond
th
ickn
ess
( h) (f
or p
iper
idin
e D
GE
BA
m
odifi
ed
) bo
nd
thic
knes
s ·w
ith
15 %
C
TB
N
at
room
te
mp.
\Jl co

59
the thinnest in the middle of the specimen where PC was also at a
minimum. The interesting discovery was that the TDCB specimens were
not true. The variation in bond thickness for the 8 mils specimens
was due to the TDCB specimens having high spots in the middle of
the adherend. Any future researchers using thes.e specimens should
be aware of this fact. A comparison of the thin bondline specimens
with variable thickness and the thick bondline specimens with more
uniform adhesive thickness. can be observed in Fig. 19 and 20.
The last specimen preparation procedure to be investigated in
an attempt to better define the experimental procedure was how the
cure time and cool down time wouid affect GIC values.
Gillham [25] has reported that the strength of an adhesive is
strongly dependent on the time and temperature of the cure. A plot
of strength vs. time for various temperatures (Fig. 21) indicates
the strength remains relatively constant for short and long cure
times. At an intermediate cure time, however, the strength of the
adhesive is observed to abruptly increase over a relatively short
change in cure time. It was believed that the recommended cure
times and temperatures for Metlbond 1113-2 are somewhere in this
increasing strength transition zone on its cure curve. Two specimens,
600-9 and 602-10, were, therefore, cured for 90 minutes instead of
the recommended 60 minutes. The result was an - 21% increase in
GIC (not including tests 13 and 14 which were prepared with short
cooling periods). All subsequent specimens were cured for 70 minutes
in an attempt to reduce GIC variations due to the curing process.

load
(lb
s)
p ~
.5
(cm
) 1.
0 300-t--~~~~~~~~~-~~~~~~~~~~~~~~~--.. 10
0 I
I \.
.I'
I I
20
0 I
I I I
(kg)
50
10
0- 0 >L
.I
.2
.3
(in.
)
cros
s he
ad
defle
ctio
n
.4
.5
Figu
re
19
Load
vs
elon
gatio
n cu
rve
for
spec
imen
s w
ith v
aria
ble
bond
thi
ckne
ss
()"\
0

500 t p
5
10
(Cm
) 15
20
25
30
20
0
40
0
150
300
(kg
)
load
°'
(lbs)
I-
'
100
20
0
50
100 O
L
2,5
5 (i
n)
7.5
10
12.5
cr
oss
head
def
lect
ion
Figu
re 2
0 Lo
ad v
s el
onga
tion
Gur
ve

>-I-0 (.!)
a:: (.!) 0 -'
62
100°
10 102 103 104
CURE TIME (MINUTES)
Fig. 21. Isotherms: cure of epoxide
resin system (TBA).

63
Since the cure time was found to have a profound effect on GIC
it was felt the cool down period may also be a factor. Tests 13 and
14 were conducted after a shorter cool down period and found to have
reduced GIC values (- 24%). Styrofoam incubators were then fabricated
to allow for a longer cool down period in an attempt to cut down on
experimental scatter.
A bar graph is shown in Fig. 22 summarizing the findings of
this investigation. Each bar is labeled with the conditions under
which the listed tests were conducted. The average GIC value was
calculated from the test indicated in each bar.
Before closing this chapter a few last connnents should be made.
As mentioned earlier, a loading device was developed for use during
the cure cycle. Even though the exact pressure cannot be
controlled when controlling the adhesive thickness, some pressure
must be applied and it should be applied uniformly over the length
of the specimen. The apparatus illustrated in Fig. 15 was found to
do a good job and is very simple to construct. The negative of
the adherend shape was traced onto a piece of wood and then cut out.
1 A rubber strip was placed between the adherend and wood pieces. Two
clamps were then made for each specimen to be used with four springs
in loading each specimen. Good adhesive bonds resulted.
At this point it was felt that uniform adhesive specimens
could be prepared for further testing.

G1c
40
30
in-l
b
in2
20
10
0
- - -
NO
TE
\ st
anda
rd
pre
pa
ratio
n
proc
edur
e fo
llow
ed
for
ever
y sp
ecim
en
exce
pt
liste
d
pro
ced
ure
s
AD
HE
SIV
E
THIC
KN
ES
S
0.0
08
in --
0.0
30
in
0.02
032
cm --
0.0
76
2cm
' ' I
"tJ
....
"tJ
. ~
O
"tJ
N
0 ...
. 0
-Q
) 0
~
~
-~
CD
.,_
I G>
..
Q
Q)
Q.
cu -
a.
0 a.
QJ
Q
. -
0 +
-...
_ D
C
D>
QJD
-
C\I
OI
e>
.· ...
c ---
OC
I>
CD
C
E
c -
-·-
I C4
!::;
c:::
'' CD
-
._ I
'-. <1>
·-
CD
_. ·-
:J
:J
-0
L..
-...
. Io
a
o.c
o0
I 'o
m
oo
._
::io
"'
fl
)O
-"tJ
o IO
m
0
.._
uo
I
-o
O
CO
c
-co
c
0 ut
II
) -
co
= ·-
II)
Ill
Ill
·-
Ill
·-
-...
...
-"tJ
ea
:n
-...
e -E
°'
-e
CJ\
Il
l Il
l 0
II)
c II
) II
) II>
c
Ill
c 0>
0
>.c
«
PO
OO
a>
0
>0
G
>O
o
G>
O
o I-
I-<
I)
....
=
,._
...J
I-I-
CJ)
I-,._
...J
I-
,._
_J
Figu
re 2
2 S
umm
ary
of
G 1 c
de
pend
ence
on
pr
epar
atio
n pr
oced
ures
CJ\
.p-

VI. REDUCTION OF EXPERIMENTAL DATA
As was previously discussed in Chapter III, all that need be
recorded in determining the strain energy release rate, GIC' of an
adhesive using the TDCB specimen is the load to propagate the crack,
4P z c GIC = -2- M
EB (25)
This method is valid provided. the material is linear elastic and no
plastic deformations take place in either the adhesive or adherend.
A typical load-deflection curve is shown in Fig. 20. An
average load value was taken from the peaks of the curve and this
value was used to calculate GIC"
Rate Dependence of Gic
In Table 3 test results from five cross head rates can be
observed. In the last column of the table is the batch number. This
number is slightly different than the one found in Table 2. Two
sheets of adhesive were. used in preparing all of the specimens. From
each sheet eight specimens could be fabricated. Therefore, from each
sheet four batches were made. It should be noted that no two
specimens of the same batch were tested at the same rate. This was
to eliminate any false rate dependency effects due to one batch of
specimens having high or low GIC values.
A plot of the GIC values vs. log (cross head rate), Fig. 23,
results in a linearly increas~ng trend in GIC with increasing cross
65

66
TABLE 3
GIC for Various Cross Head Rates
Grc Average Grc Specimen Test Rate Test Duration in-lb/in2 in-lb/in2 ·Batch
No. in/min (cm/min) min. (J/m2) (J/m2) No.
613.,..31 0.005 (O. 0127) 109.6 36.00 1-3 (63.00) 36.74
624-32 0.005 (O. 0127) 112 37.45 (64.28) 1-4 (65.54)
618-21 0.05 (0.127) 8.4 37.90 1-2 (66.33)
600-22 0.05 (0.12 7) 12.08 42. 77 1-3 (74. 85) 38.56
622-23 0.05 (0.127) 10. 72 33.87 (67.48) 2'-1 (59.27)
603-24 0.05 (0.127) 11. 6 39.69 2-2 (69.46)
605-25 0.5 (1. 27) . 70 45.48 1-1 (79. 59) 42.81
602,..26 0.5 (1. 27) . 75 40.14 (74.92) 1-2 (70.25)
628-27 1. 0 (2.54) .49 47.61 1-1 (83.32) 43.88
626-28 1. 0 (2. 54) . 44 40.14 (76. 79) 2-1 (70.25)
623-29 2.0 (5. 08) .16 40.45 1...;.4 (70. 79) 41. 22
612-30 2.0 (5.08) .29 41.99 (72.14) 2-'-1 (73.48)
132.-33 Creep Test 690 36.00 2-3 (63.00)

50 I
451
Ci)
H :
40
:I
I - er
......
::I N
351
30~
25 .. 10-
Figu
re 2
3
x
10-2
x x
X
aver
age
O
aver
age
6.
bo
tch
10
-1
cros
s he
ad
rate
(i
n/m
in)
Cro
ss
head
ra
te
VS
' G
t c
curv
e
/:!..
A
lao
0 0
><.
x ..
70
r-..... .......
.......
3 ~
°' -..J 6
0
Gae
fo
r ea
c.h
spec
imen
G 1
c fo
r ea
ch r
ate
~50
1-1
test
s
10
-0

68
head rate with one exception. Batch 1-1 specimen data points shown
on Fig. 23 had relatively high values of GIC" The reason for this
is felt to be because they were the first.specimens to be put in the
oven to be cured, therefore, the oven door was open only long enough
to put those specimens in it. For all subsequent batches the oven
door was open longer to remove previously cured specimens before
placing more in the oven. This would allow for more heat loss from
the oven and a different cure for Batch 1-1 specimens. Therefore,
the plot in Fig. 23 is drawn excluding those two data points.
Wang [29] has reported the shape of the TDCB adherend was
designed using a simple one-dimensional beam theory to give an ap-
proximately linear compliance during the course of crack growth. It
has been observed that deformation and fracture are extremely
localized within the thin adhesive layer, which the simple beam
consideration fails to consider. The variation in GIC with crack
length was therefore investigated.
A normalized plot of GIC with crack length is shown in Fig. 24.
The normalized GIC was obtained by dividing the value of GIC at each
crack location by the overall average GIC for each rate. In this
way all specimens, regardless of t.est rate, could be averaged
together. The normalized GIC value is seen to increase slightly
with increasing crack length. These results would suggest that the
TDCB specimen actually is not a linearly increasing compliance
specimen.

(cm
) 7
10
13
16
19
I.I
0 0
'\/
0 ~
1.0~
'\/
'\/
0
8 ~
8 /::;
.
0 ~
'\/
0 /::;
. G
rc
.J '\/
'\/
G
1c
avg.
/::;
. 0
9 (J
\
<&
'°
.81
0 .0
05 in
/min
0 /'.:,.
.05
in/m
in
0.5
in/m
in
? CR
OSS
HE
AD R
ATE
S 0
1.0
in/m
in
'\/ 2
.0 In
/min
.71
. --
3 4
5 6
7 cr
ock
leng
th
(in)
Fig
ure
24
N
orm
aliz
ed
G1c
vs
cr
ack
leng
th

70
Time Dependence of Gtc
The one creep test thatwas conducted was sufficient to conclude
that Metlbond 1113,...2 is time dependent in the bonded state, but not
sufficient to characterize the viscoelastic properties. At the
500-pound (227.27 kg) load the crack propagation rate was calculated
to be O. 00725 in/min (0. 01842 cm/min). The following equation was
used [9],
.
• EB a=U---8 Pc m
(27)
where U is the cross head rate> E is the adherend modulus, B is the
specimen thickness, mis the shape factor, and PC is the applied load
in a creep test. The results of the creep test are located in the
last row of Table 3~

VII. DISCUSSION AND RESULTS
The TDCB fracture toughness specimen was used here to e:xamine
the adhesion and specimen preparation processes and the rate and
time dependence of Metlbond 1113-2. The data obtained for the
sensitivity of GIC to the specimen preparation process and to rate
and time dependence were presented in Chapters V and VI.
Preparatio11, Rateand Till1e Dependence
Figure 22 clearly illustrates the necessity of thoroughly under-
standing the factors affecting bond strength in order to obtain
accurate fracture energy results. Slight variations in the cure
cycle were found to have drastic effects on GIG values. ·Figure 23 .
surtnnarfa.es the cross head rate· dependency of Metlboncl 1113-2. A
trend of exponentially increasing GIC is observed with increasing
cross head rate •. Another very strong indication of rate dependency
can be found in Table 3. If specimens from the same batch are
compared it is observed that the.specimen tested.at the higher rate
had a larger GIC value .. in every case. This comparison ruie~ out any
effects due to cure and provides an accurate comparis.on.
The time dependency of Metlbond 1113..:2 was not investigated
in depth. At this time the only desire was.to demonstrate the·
adhesive acted viscoelastically in the bonded state. Renieri [26] ·
performed creep tests on bulk specimens of this adhesive and found
that loads near ultimate produced. large viscoelastic effects. For
this reason.a load near ultimate for the TDCB specimen was chosen.
71

72
The creep test took 690 minutes to fail at a 500-pound (227.27 kg)
load. A very slow crack propagation rate was calculated, 0.00725
in/min (0.01842 cm/min).
The results of investigating the fractured surfaces will now
be discussed.
Fractography
Examination of the fractured surfaces revealed some interesting
clues as to whether the· fracture process for.our adhesive was brittle
in.nature as is assumed by LEFM. Both macroscopic and microscopic
investigations were performed with varying results.
Initially a visual macroscopic examination of the fractured
surfaces of tests 21-32 indicated that each exhibited similar
characteristics. As may be observed in Fig. 25, a light and dark
region can be discerned. The light region corresponds to the first
portion of each test during stable crack growth. The dark area car--
responds to the later portion of each test when each specimen failed
catastrophically resulting in fast crack growth.
Figure 26 provides a closer look at the transition zone from slow
to fast crack growth for tests 21-30. An interesting observation
can be made. In comparing the apparent roughnesses of the light and
dark regions the light area was rough while the dark area was
relatively smoother. Rough surfaces are generally associated with
ductile fracture and smooth surfaces are generally associated with
brittle fracture. Thus, it would appear that the slow crack growth
of the light region was a result of ductile fracture and fast crack

73
Fig. 25. Fracture Surface: Cross Head Rates Increasing from .005 in/min to 2 in/min from L. to R. The cracks propagated from top to bottom in this photograph.

74
.OS in/min Cross Head Rate Tests
.5 in/min Cross Head Rate Tests
Fig. 26. Fracture Surfaces.

75
1 in/min Cross Head Rate Tests
2 in/min Cross Head Rate Tests
Fig. 26. Cont.

76
growth of the dark region was a result of brittle fracture.
Microscopic investigations were then conducted on three speci-
mens, 600-9, 602-10 and 626-14. All thr~e specimens were tested at
a cross head rate of 0.05 in/min. A scanning electron microscope
(SEM) was used for this investigation.
Specimens with extreme high and low values of GIC were used.
The SEM photographs for both extremes shed no light on the large
variation in GIC values, but they did provide a means for better
understanding the mechanisms of fracture. Figures 27 are three SEM
photographs of specimen 626-14. Figure 27a was taken in the sloW' crack
region, Fig. 27b was taken at the transition from slow to fast crack
region, and Fig. 27c was ta.ken in the fast crack region. The presence
of fiber is obvious in Fig. 27a while Fig. 27c contains almost no
sign of such fiber. In Fig. 27b an abrupt change from fiber to no
fiber can be observed.in going from the top to the bottom of the
photograph. It now seems that a plane or many planes of fiber exist
in the adhesive and that slow crack growth occurs in a plane of fiber.
At a higher magnification another very interesting discovery
was made. Figures 28 are SEM photographs of the slow and fast
propagation regions. A close examination of both photographs indi-
cates that both regions failed in a brittle manner. Fiber can be
easily seen in Fig. 28a while classical brittle fractured surfaces
can be seen in both Figures 28a and b. These photographs suggest
that the entire length of the specimen failed in a brittle manner
with slow crack propagation taking place along a plane of fiber.
Note should be made of the large holes in the fractured surfaces;

77
a. Slow Crack Region b. Transition Region
c. Fast Crack Region
Fig. 27 . Fracture Surfaces at SOX.

78
a. Slow Crack Region
b. Fast Crack Region
Fig. 28. Fracture Surfaces at 200X.

79
they are actually air bubbles in the adhesive.
Figure 29 is a photograph tal<.en of the fibers bridging the gap
between adjacent fractured surfaces. This phenomenon occurred during
each test.
A higher magnification was needed to determine the distribution
of elastomeric particles throu·ghout the adhesive. Figure 30 provides
a good picture of the uniform dispersion of the e.lastomer. The
nitrile rubber was found to be well distributed throughout all parts
of the adhesive investigated.
TDCB'Test Specimen Evaluation
·Wang [29] has· reported that the allowable yield zone in- the
adhesive for an appropriate use of the fracture mechanics concept is
much smaller for' typical adhesive joint systems (on the order of
10-4 inches) than for monolithic materials. Thus, only very brittle
·adhesives with very small scale yielding, at most, of one-tenth of
the adhesive thickness, would qualify for the flaw size limitations
in using the TDCB frac~uretoughness test. For the adhesive joints· in
which gross yielding is -developed over the entire bond line, an
energy release rate can still be measured, but its use in the joint
failure analysis and design would be severely compromised. Employing
this line of thought, two conditions occurred which would imply that
the GIC values obtained from the TDCB specimen for Metlbond 1113-2
may not be acceptable as design values.
Preceeding the crack tip was a zone of stress whitening or
crazing in the adhesive layer. Figure 31 is a series·of photographs

80
Fig. 29. Fiber Presence in the Adhesive.

81
Fig. 30. Fractured Surfaces at 5,000X.

82
Fig. 31. Crack Propagation Sequence.

83
taken of a crack growing. The crazing zone was observ,ed to maintain
a constant length of about O. 53 in (1. 3462 cm) along the entire
length of crack propagation. The author does not feel that this
entire zone is a plastic zone but that a plastic zone is located in
this crazed zone. Due.to the size of the crazed zone it is possible
a plastic zone is present which is much larger than is allowable by
fracture me,chanics standards.
The second condition was that of the plastic defo.rmation of
the adherends. Figure 32 illustrates that after testing and mating
the two fractured surfaces back together, a diffe"):'ence 9{ O. 050 in.
(0.127 cm) .could be·measured between the two ends. This is not to
say plastic deformations of 0.05 in. occurred, but in fact, some
flow processes did occur in the adherends.

84
Fig. 32. Permanent Deformation in a Tested Specimen.

VIII. CONCLUSIONS.AND fUTUR.E CONSIDERATIONS
The objectives of the present investigation were to determin_e
the sensitivity· of an adhesive spec;.,imen to prep~ration procedures,
the rate and time dependence, and the' fracture processes ofMetlbond
1113..:..2 tested with the TDCB specimen. In addition, the appl.icability
of GIC testing with the TPCB ~pecimen for Metlbond 1113:-.? was_ dis-' ' '
cussed. In sunnnary, the followil!g conclusions (!an be made. In preparing the specimens,· two factors wete found to have
' '
significant effects on the GIG of Metlbond 1113;;..2, the time the
adhesive was left out at room temperature and the cure cycle. The
most s_ensitive process in the specimen prep,ar~tion procedure was. that
of the cure cycle; therefore, it is- felt that an investigation similar
to the one. conducted by Gillham [25] should be conducted to better
understand the cure and cooling .. down dependence. After the specimen
preparation was better defined an investigation of the rate and-time
dependence illu.strated a linear rate dependence and that a time
dependence existed for Metlbond 1113-2 in the bonded state at room
temperature. . . . .
At that point art investigation of the fractured adhesive
surfaces were in order to determine the mechanisms of fracture. A
visual inspection yielded that the slow crack propagation was the
result Qf ductile· fracture and fast crack propagation was a result of
brittle fracture. . It was then decided to use a scanning electron
microscope to study the microscopic mechanisms of fracture.
85

86
An interesting conclusion was made;. the entire length of the specimen
appeared to have failed brittlely with.slow crack propagation
occurring in a plane of fiber and fast crack propagation occurring
in a plane containing no fiber. This was the first time it was known
to people at V.P.I. that Metlbond 1113-2 contairted fiber. An EDAX
examination revealed that the fiber was an organic material. A
higher magrtification illustrated the uniform distr.ibution of the
'· nitrile rubber elastomer throughout the adhesive. A comparison of
Metlbond 1113-2 with other high-performa.nce polymers [28], Table 4, ' '
:eveals Metlbond 1113-2 exhibited a much higher GIC value than ~alues
for other polymers. The reason for this high fracture energy is
believed to be because of the good distribution of the nitrile
elastomer and the presence of the, until now unknown, fiber in the.
adhesive .•
The final conclusion made was that the mathematical model
accompanying the TDCB specimen was not suitable for testin·g Metlbond
1113-2. The arms of the adherend deformed plastically 'which violated
the theory. One s.olutiqn .to this would be to use a· lower value of
m, the shape factor. This would result in stiffer adherends. ·
Many questions arose in this investigation that can be
answered only by performing more studies. As metitioned earlie.r, a
cure curve investi.gation'should be performed to find the cure
dependence of the' fracture energy. In conjunction tvith this, a cost
analysis should be Performed to determine if the increased strength
would be worth the added expense for industry. Further testing
should be conducted in order to accurately .compare the mechanical ·
. i - '- -·1 _ ..

87
TABLE 4
Fracture Energy of Matrix Polymers
Polymer GIC in-lb [~] in 2
Narmco 5208 · 0.43 (Q. 076)
Hexcel F-178 0.69 (0.12)
PMR-15 (NASA) 1.14 (0,. 20)
Gulf T-600 1.08 (0.19:)
Ciba - Geigy NCNS 0.43 (0.075)
NRC/Eastman, c10 1.08 ,, (0.19)
. Carborundum, ASTREL 17.31 (3.0) . ~·· ;, . •. '::~··<
Union Carl?ide, RADEL · '11. 42 (2.0).
Union Carbide, UDEL 18.27 (3.-2)'
!CI, P300 3. 71 (0.65)
Upjohn 2080 4.63 (0.81)
DuPont NR150B2 11.99 (2 .1)
Amoco 4000 '19. 41 {3. 4)
Phillips RYTON PPS 1.20 (0. 21)
Metlbond 1113-2 39.00 (6. 83)

88
properties of the bonded adhesive to those obtained in bulk testing
[26,27]. Also, an investigation of the plastic zone size could be
done with further testing in an attempt to model the plastic zone
size as was done by Dugdale. Finally, other types of tests should
be made using various specimens to provide a comparison of GIG values
for Metlbond 1113-2~
The above items would provide for a coherent picture of the
response of a material due to complex interactive effects.

BIBLIOGRAPHY
1. Bascom, W. · D. and Patric.k, R •. L., "The Surface Chemistry of Bonding Metals and. Polymer Adhesives"~· Adhesive Age, Vol. 17,. No. 10, pp. 25-32, 1974.
2. Jemian, W. A. and Ventrice, M. B., "The Fracture Toughness of. Adhesive-Bonded Joints", Journal of· Adhesion, Vol. l; pp. 190~ 207, 1969.
3. Bascom, W~ D~, Cott·ington, R~ L. and Timmons, C. O., "Fracture Reliability of Structural Adhesives", Joµrnal of Applied . Polymer Science: Applied Polymer Symposium 32, pp. 165-188, 1977.
4. Irwin, G. R., "Fracture Mechanics Applied to Adhesive Systems", Treatise on Adhesion and Adhesives, Vol. 1, edited· by R. L. Patrick and Marcel Dekker, Inc., pp. 233-268, 1967.
5. Bascom, W. D., Cottington, R. L. ,,_.and Timmons, c. 0., "Fracture Design Crit¢ria for Structural Adhesive.Bonding-'."'." Promise and Problems", Naval Engineering Journal, pp. 73...:86, August. 1976.
6. Hertzberg, R. W., Deformation and Fractm::e Mechanics of Engineering Materials, John Wiley and Sons·, Inc., New York, 1976.
7. Broek, 0., Elementary Engineering Fracture-Mechanics, Noordhoff International PubliShing, Leyden:, Netherlands, 1974.
8. Wang, S. S., Mandell, J. F. and McGarry,. F. J., "An Analysis of the Crack Tip Stress Field in :OCB Adhesive Fracture Specimens", International Journal of Fracture, Vol. 14, pp. 39-58, 1978.
9. Anderson, G. P., Bennett, S. J., and Devries, K. L., Analysis and_Testingof Adhesive Bonds, Academic Pre~s, Inc., New York, 1977. . . . .
10. Bascom, W. D. and Cottington, R. L., "Effect of Temperature of the A4hesive'Fracture Behavior of an Elastomer-Epoxy Resin", Journal of Adhesion, Vol. 7, pp. 333-346, 1976.
11. Bascom, w. D., Cottingtoi::t, R. L., Jones, R. L. and Peyser, P., "The.Fracture_ of Epoxy- and Elasto!ller-Modified Epoxy.Polymers in Bulk and as Adhesives", Journal of Applied Polymer Science, Vol. 19, pp. 2545-2562, 1975.
12. Product information provided by Narmco Materials, Inc., 600 Victoria Street, Costa Mesa, California 92627.
89

90
13. Malyshev, B. M. and Salganik, R. L., "The Strength of Adhesive Joints Using the· Theory of Cracks 11 , Internati.on:al Journal of
. Fracture, .Vol. 1,. pp. 114-128, 1965.
14. Bascom, W. D., .Gadomski, S. T., Henderson, C~ M. and Jones, R. L., "Fracture Marking on Stress-corroded Epoxy-Aluminum Butt Jointsn, Journal of Adhesion, Vol. 8, pp. 213-222, 1977.
15~ Mulville, D.R., Hurlston, D. L. and Mast, P. W., "Developing Failure Criteria for Adhesive Joints Under Complex Loading", ASME Publication, Paper No. 77-WA/MAT-10, 1977.
16. Bascom, W. D., Jones, R. L. and Timmons, C. O., "Mixed;;..Mode Fracture of Structural Adhesives", Adhesion Science and Technology, Vol. 9.B, pp. 501-511, 1975.
17. Bascom, W. D., Timmons, C. O. and Jones, R. L., ''Apparent Interfacial Fai.lure in Mixed-Mode Adhesive Fracture'', Journal of Materials Science, Vol. 10, pp. 1037-1048, 1975.
18. Jonath, A. D •. , ''Some Novel Approaches to the Study of Adhesive Interface Phenomena and Bond Strength", Paper presented at the Structural Adhesives and Bonding Conference, March 13-15, 1979.
19. Anderson, G •. P. ~ .. Devries, K. L. and Williams, M. L. , "Mixed Mode Stress Field Effects in Adhesive ~racture", International Journal of Fracture;; Vol. 10, pp. 565-583, 1974.
20. Devries; K. L., Williams, M~ L. and Chang, M. D., "Adhesive Fracture of a Lap Shear Joint", Experimental Mechanics, pp. 89.:. 74, March 1974.
. . .
21. · Williams, M. L. , ''The Continuum: Interpretation for Fracture and Adhesives", Journal. of A££_1ied Polymer Science, Vol. 13, pp. 29-40, 1969.
22. Williams, M. L., "The Fracture Threshold for an Adhesive Interlayer", .Journal of Applied Polymer Science, VoL 14, pp. 1121-1126, 1970. .
23. Dannenberg, H., "Measurements of Adhesion by a Blister Method", Journal of Applied Polymer Science, Vol. 5, No. 14, PP· 125-134' "1961.
24. Roark, R. J. and Young, W. C., Formulas for Stress arid Strain, McGraw-Hill, Inc., New York, 1975.
25. Gillham, J. K., "A Semimicro Thermomechanical Technique for Characterizing Polymeric Materials: Torsional Braid Analysis", American Institute of Chemical Engineering Journal, Vol. 20, No. 6, pp. 1066-1079, 197~. .

91
26. Renieri, M. P., "Rate and Time Dependent Behavior of Structural Adhesives", Ph.D. Dissertation, VPI and SU, 1976.
27. Cartner, J. S., "The Nonlinear Viscoelastic Behavior of Adhesives and Chopped Fiber Composites", M.S. Thesis, VPI and SU, 1978.
28. Bascom, w. D., Bitner, J. L., Cottington, R. L. and Henderson, C. M., "Thermomechanical Properties of High-Performance Polymers", High Performance Composites artd Adhesives for V/STOL Aircraft, Third Annual Report, pp. 13,:,,.38 (ed. W. D. Bascom and L. B. Lockhart, Jr.), Naval Research Laboratory, Washington, D.C., 1979.
29. Wang, S. S., "An .Analysis of Tape::r;ed DCB Fracture Toughness Test for Adhesive Joints"; presented at the. Eleventh National Symposium on Fracture Mechanics at VPI&SU, June 12-14, 1978.

The vita has been removed from the scanned document

FACTORS AFFECT!NG THE FRACTUR.E ENERGY
OF A STRUCTURAL ADHESIVE
by
Daniel George O'Connor
(ABSTRACT)
A fracture investigation was conducted on a modified epo:l\.)
adhesive (Metlbond 1113•2). Initially various adhesive fracture
strength and energy tests and the mechanisms of mechanical and
chemical adhesion were discussed. A critical study was then made of
the sensitivity of the strain energy release rate·to specimen prepara-
tion. The rate and time dependence of the adhesive were then
investigated using the TDGB specimen. The fractured surfaces were
also studied using scanning electron microscopy to determine the
mechanisms of failure.