factors affecting consumer patronage in second-order retail markets by
TRANSCRIPT

Factors Affecting Consumer Patronage in Second-Order Retail Markets
A Senior Thesis
Presented in Partial Fulfillment of the Requirements for graduation with distinction in Marketing in the undergraduate colleges
of the Ohio State University
by
Scott C. Frasz
The Ohio State University June, 1996
Project Advisor: Professor Leslie M. Fine, Department of Marketing
Introduction
Literature Review
Store Image
Socio-Economic Situation
Risk
Innovativeness
Model
Methodology
Scales and Measures
Data Collection
Data Analysis
Results
Frequency of Shopping
Goal of Visit
Contents
Who Is Being Shopped For
Frequency of Buying Used Goods
Discussion
Conclusions
Development of Theory
Implications in Practice
Future Research
1
3
3
5
6
8
9
10
10
12
14
15
15
17
18
19
22
22
26
27
29

Exhibits
Questionnaire
Distribution of Respondents (Table 1)
Frequency of Shopping at Play It Again Sports (Table 2)
Goal of Visit (Table 3)
Who is Being Shopped For (Table 4)
Frequency of Buying Used Goods (Table 5)
Dependent Variables Correlation (Table 6)
References
II
31
31
36
38
38
39
39
40
41

of
goods are non-durable are
however,
purchasers
dispose still-useful used 1"."''"''_'':>,
consumers opt to resell
For many decades
flea markets, thrift shops or at
distribution network has begun to
of pre-owned merchandise.
Introduction
produced goods Many
almost immediately by the new owner. Others,
these occasions, the UH~JU"''''''
of the product has been consumed.
store them, give them away, or sell them.
of used goods for the market is created.
has been bought and sold
sales. Now, however, a new
as an important market for the purchase
to create a store image
the
may
is
different from the stereotypes .....,"V ... dC ... ' .... '" stores and other traditional secondhand
stores. stores are oltter'entlalteo
and a more comfortable store
better store locations
sec:ono-()raer retail markets are emerging
in a variety of markets including computer
This thesis has the goal of exploring the
in the patronage of these second-order
been created showing the possible
sports equipment and children's
situations that
a theoretical
level
image of the retail outlet and SOC:lO-·ecc:mC)ffillC "",H."'L1V'H
purchasing or selling
re}l;reSiSlCm analysis of data collected from shoppers at two area sec;ona-c)ra'~r

original model could not be due to a of a u" .. ,..."" sample
of the for analysis, much important was
in research. Regression analysis showed a significant relationship between
a
order
risk
store.
and innovativeness the
o-e:COJnOIIllC variables, however,
of to the seconcl-
not seem to have an important
relationship with store may demonstrate one of a potential
differences between conventional thrift stores and other
class second-order retail shops.
goods and the new
Other were conducted with dependent variables whom
customer was shopping for, what goal of shopper's was and how frequent the
customer purchased used of any These some interesting
and results which are VAI"''',Uk~_Y in the following
This research is very useful in laying a foundation for future explorations this
dlllerellices between second-order outlets and traditional
used goods markets the new markets definitely seem to
aid further exploration of differences and the ways
paper
which consumers
different
2

Literature Review
Some research on traditional nr,,'_[\1l11n,p.( markets. From
studies, have been isolated a consumer's
patronage of a second-order and the purchase of merchandise. These
variables are store socio-economic situation, and risk By measuring
three variables in consumers, it is hoped that a the purchase of
merchandise can
While the purchase explored a the
research in consumer goods is even more scarce. leaves
one little foundation on which to but also an exciting wide to
study. Through research in various consumer motivation and attitude three
~U4"""J"" were selected for this rAe'A''''" on
of variables are common to
eC()nCIIllJIC situation. But, while
variable being '-'VIl:':',,,,,''''''
Store Image
that cllstomers have of a
certainly important to their buying decisions.
exists is not vU'-''''''''''', however, and
and Jeen-Su
of used goods by
model--store
III model,
mode1.
store or a type of store is
that relationship
this relationship is
( both University of Toledo,
attempted to how cllstomers' perception of store's the patronage
3

stores Their primary was to how
three attitude toward store store image and the
of product quality were store
obtained from this research showed a and
the combinations of variables except store to store patronage
results present two interesting dilemmas. is whether the lack of
correlation between store
ilIA"""''''!''', or some other reliability
correlation and even a
Samli, 1985), however,
The second major implication
and store patronage is second-order store
Other research has shown a strong
nPl'." .. ,-n store image and store loyalty (Sirgy
the used product market.
on this research stem from the
correlations involving the general .. LU,LU\.'", u""·"",,, store variable. As rn""n~,r'n
the new retail outlets involved in
thrift stores and other traditional
unsuccessful, then according to
have tried to separate themselves
markets. If these stores have
(1993) study, the consumer's ",,,U'VLUJ.
attitudes towards these traditional pre-owned merchandise outlets will
perception and patronage of
phenomenon comes
that 80% of
"favorable \.llO'!.J\J'ilU,lVlj,,, t,,,,,,.,, .. rl
new second-order retail stores. An important IO()rnote to
study done with Goodwill found
sncmD.ers and all medium had
" and "both nr.n_" hr.nn",,.,,
alike agreed that '-',,<""'-''"''''''' "I>r,rp<,,,,,,t<' a good value"
4

will be a relationship store image
patronage of store.
Socio-Economic Status
The consumer's socio-economic status may also to be an
determinant of nrr.rln.('t choice and store patronage. Previous has shown lower
income consumers tend to shoppers at stores, a used goods
outlet (Yavas and L'd\.<'v"'\.<l1, 1981). The same also showed that married persons were
more apt to used products. to size (although was
not as larger households must spread family income over more people. The
also revealed was the most .rn"" .. rt the decision to
the thrift store. relates back to income and wealth, as those persons with to spend
will to buy items over new
Socio-economic """,er.,." may the UV~'A'H'VI to sell goods that lost
their utility to current owner, but are not completely consumed. The U'vVH,',-" from the
the good may be important to a large, low income family.
H2: factors the sale of goods III the
following manner:
a. family is positively to store patronage
b. family income is negatively to store n'lt,."u,'l
c. of education is related to store patronage
d. number children is positively to store patronage.
5

Risk
A consumer's is a measure how willing or is to
risk involved in any given purchase. risk has described as believed
by the consumer to exist in purchase situation to uncertain negative consequences
as a result of a decision"
perceived risk H"""~~"" intended purchase goals,
\/P'YlP11t (Dowling and 1994)
a purchase,
previously
more likely one is to
avoidance strategies
some form
search, both
under consideration
and pvtpT'T"" to gain more
purchasing small purchase,
cn:iifa.Cle~nz;eo as "trial" or sizes) to
determinants this
knowledge, and level of
risk involved
avoidance.
1) conducting an extensive
UU"",,,"vu about the product
of (often
associated with the
purchase, 3) buying known brands as are often np1r(,p",,,'11 as
being higher due to their success in market .L..u.u".Ic>,1983).
~.~~ .. ~''''' strategy may to purchase used instead of new.
,rnn,.,.,,,f • .,.,t variable in ",,,,,,,,",,,,,'11 the risk involved that
purchase 1973). If purchase is consumer,
or she may to lower that purchasing a expensive pre-owned
good in place
Many
priced new
the product
not so much from a
'llU,ULUlliS the product can
view point, but more from a utility view.
For instance, clothing is an important in the pre-owned market.
Children course are constantly growing, and outgrow clothing toys long
6

they are worn out. As U,,,',-UC>C>\.A.J, earlier, this leads to of
market, but this same occurrence may lead to ... v .......... ,'-' for used
the same Because there is a that full utility
clothing may not be obtained. In words, the child out of the
the clothes been worn out. may this risk by
price that it used new.
pre-owned goods is sporting equipment.
Here too, Many sports such as or skiing are
expensive to equipment same way,
of the fitness is also expensive,
Additionally, many these sporting are also very durable, which often results in
them not fully consumed. For many consumers considering up a new sport or
exercIse risks are COlmpoUl
enjoyment playing
possible that a consumer purchase all
that he or she not enjoy playing it. In
their lack of a
equipment for a new
case of sporting goods,
products are rarely available, but the consumer achieve the same
purchasing lower
H3: There will
used goods when
a positive
the intent to
7
V'"'/5H1:UU'5 a new sport.
",,,,r',,,,"'~'''' risk aversion
goods.
It is highly
and then decide
units of the
reduction by
store

Innovativeness
The operational definition of innovativeness for study has supplied by
Rogers and Shoemaker (1971) as ael.l:ree to which an individual is relatively earlier in
adopting an innovation than other ....... 'uvv. of social """,,,rpTn" When a consumer is
or no experience with product it innovative in hlslher purchases,
is new to hislher social system.
consumer can obtain about
the amount information that a
prior to «''''./I-I"U15 it. this one can that
from the purchase may not be what was expected the consumer, and
thus product loses utility for initial owner the product is used up. is the
hypothesis innovativeness plays an important in the a
good a previous consumer.
H4: will be a relationshlp between innovativeness and store
patronage with an intent to sell.
Model
By combining these hypotheses the following model was constructed.
8

Familv Income ! ~
! Size of Household ! ----.
Education I / !Number of Children!
Risk Aversion
Socio-Economic Situation
Store Image
Innovativeness
Sale of Goods
There are four components to socio-economic situation being tested: family income, size of
household, education, and number of children. Risk aversion, socio-economic status and
store image are the three independent variables affecting the purchase of pre-owned
merchandise. Innovativeness, socio-economic status and store image are the three variables
affecting the sale of used goods.
9

Methodology
Five variables were measured in this study. The four independent variables were
risk aversion, socio-economic indicators, store image, and innovativeness. The
dependent variable in the study was store patronage. This dependent variable can be
broken down into two categories, purchasing used products and selling used product. Of
the four independent variables, it was theorized that two, socio-economic situation and store
image would influence the patronage of both buyers and sells. It was further thought that
risk aversion should influence the purchase of pre-owned goods, while innovativeness
influenced the sale of used goods.
Scales and Measures
For a hypothesis to be tested and a reliable conclusion to be drawn, the variables
included in the hypothesis must be measured reliably. The variables being measured in
this research are well established in the field of consumer behavior. Because of this,
scales already exist to measure many of these variables. The resource used to obtain
many of these scales was Bruner and Hensel's Marketing Scales Handbook (1992).
The consumers' risk aversion was measured in this study using a seven-point
Likert-type summated ratings scale (See questionnaire exhibit, question 9.a. - i.)
developed by P. S. Raju (1980) which he referred to as a measure of Risk Taking. The
scale is comprised of rune statements, some of which were apparently derived from
previous studies measuring risk propensity. The scale was originally used to collect data
10

on 336 homemakers and 105 college students and Raju reported the scale to have of
reliability of .808 and .831 for the two samples, respectively.
A second, separate scale was used to measure the perceived level of financial risk
associated with the purchases (See questionnaire exhibit, question II.a. - c.). The scale
used for this was a seven point, bipolar-response summated rated scale developed by
Terence A. Shimp and William O. Bearden (1982). This scale was originally used to
collect data from three student samples and two non-student samples. The scale was
calculated to have an average alpha value of .79 across the five original samples, and no
specific validity measure was presented.
Store Image was tested using a thirteen-item, seven-point Likert-type scale (See
questionnaire exhibit, question IO.a. - m.) "measuring a consumer's attitude about a
store" (Bruner and Hensel, 1992). The scale was compiled by Bob Wu and Susan
Petroshius (1987), who based the scale items on several previous studies of store image.
A sample of 86 college students, ranking ten different retailers, was used in the study.
The reliability of the scale was reported as a range of alpha values from .77 to .91,
depending on the retailer. A definite measure of validity was not offered by Wu and
Petroshius, however, a pretest was conducted and the scale was reduced from twenty
items to the current thirteen, increasing the alpha coefficient.
A five-item, seven point, Likert-type summated ratings scale was created to
measure a consumer's innovativeness with respect to the trial of new products and brands
(See questionnaire exhibit, question 9.j. - n.). This scale was created by combining two
different scales measuring innovativeness--one was borrowed from a study conducted by
Richard Oliver and William Bearden (1985), and the other was created by William Wells
11

and Douglas Tigert (1971) and used in a number of subsequent studies. Both of these
scales were found in the Marketing Scales Handbook (Bruner and Hensel, 1992).
The socio-economic situation of each of the consumers was measured using six
demographics questions (See questionnaire exhibit, questions 12 to 17). These questions
were intended to gather information on the respondent's age, income, education and
family size.
Finally, the dependent variable, store patronage, was measured using four
questions (see questionnaire exhibit, question 4 to 8). These questions included measures
of the frequency of visits and size of purchases/sales measured by dollar amount. The
important variable of transaction type (purchasing, selling or just looking) was also asked
in the questionnaire (See question 1).
A questionnaire was created from these various scales and questions and was pre
tested on a sample of college students familiar with the Play It Again Sports franchise.
Members of this pretest sample were interviewed about their understanding of the
questions and the ease of filling out the questionnaire. Some small modifications were
made to the wording and the order of the questionnaire as a result of ambiguity and other
problems reported in the pretest.
Data Collection
A questionnaire was compiled from the scales and measures described above (see
questionnaire exhibit). This questionnaire took about 5 minutes to complete and seemed
very self explanatory for the majority of the consumers sampled.
12

The questionnaire was distributed to patrons of Play It Again Sports Stores in
Columbus, Ohio by the researcher and in Mansfield, Ohio by two assistants . The survey
was conducted on site at the store over two Saturdays, one in Columbus and one in
Mansfield. The questionnaire was offered to each potential customer entering the store.
One hundred completed surveys were collected for analysis (approximately 70
from Columbus and 30 from Mansfield). Of these, 40 respondents were male and 59
were female (one respondent did not provide this information). Age of the respondents
was approximately normally distributed with about half under 35 years old and half 35 or
older. Approximately 60% of the respondents intended to buy during this visit while the
rest were either just looking or intended a selling transaction. Just over half of the
respondents were shopping for themselves while the rest were looking for someone else,
most commonly children. The mean household size for the respondents was 3.27 people,
with 4 people being the median. Fifty-four percent of the respondents intended to make a
purchase of $26 or more in a wide variety of sports, the most popular being
basebalUsoftball and in-line skates. (These and other statistical profiles of the
respondents are summarized in table 1).
13

Data Analysis
~~~.L~H analysis was run on the data using a popular Macintosh packaged
..... " .. , __ , software. The
and ':>V\,'V'-'vvVIl'J'
variables for analysis were aversion, store
status (education, 11 I"V I U'" , of children of
household). These variables were run the dependent variable frequency of
patronage at Play It Again Sports by people purchasing used equipment.
~ aversion + ~ store + ~
children + ~ size of household + e ~
nf"''',rr\p + ~ number of
U.VlllU.~l'-' to purchase of
test the model for patronage of people selling equipment, a regression model was
designed substituting for risk "'''~'''''·,''n
~ Innovativeness + ~ store image + ~ education + ~ income + ~ of
children + ~ household + e = ~ of patronage to
14

Results
The original hypotheses were intended to test the effects of the independent
variables of risk aversion, innovativeness, store image and socio-economic indicators on
store patronage with respect to the purchase or the sale of goods. Unfortunately, the
number of people intending to make a sale of used goods was too small to analyze
effectively. This precludes the possibility of testing this original hypothesis. However,
despite not being able to test this hypotheses, there are still some interesting findings
worth reporting.
Frequency of Shopping
Although the full hypothesis could not be tested, this model attempts to test the
customer's overall store patronage without regard to the transaction being made. In
essence, this model compresses the two dependent variables into one. This does not
separate buying from selling, but it still provides important information about the types of
people who shop at Play It Again Sports often and some of their motivations for shopping
there. Later, the goal of the customer will also be tested, which separates customers
intending to make a purchase from those seeking some other transaction.
In the frequency regression, shoppers were placed into three categories based on
their responses to the question of how often they visited any Play It Again Sports store.
These three categories were first visit, infrequent (one or two times a year) and frequent
(more than once a year). Thirty-two percent of shoppers reported that they had never
before visited a Play It Again Sports store, 27% of shoppers reported that they visit the
15
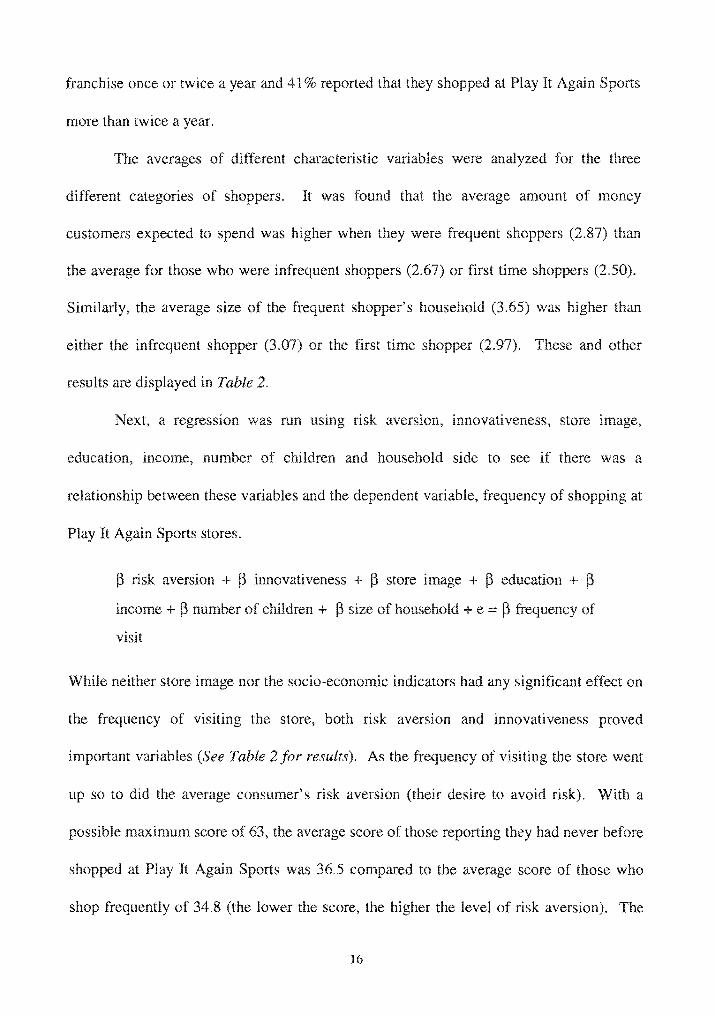
franchise once or a and % reported that It Again Sports
more than twice a
The averages of cl1tterent characteristic were for the three
It was found that amount of money categories
customers expected to was higher when they were frequent shoppers (2.87) than
the average for those who were infrequent shoppers (2.67) or shoppers (2.50).
was higher than
and other
Similarly, the average shopper's household
the infrequent shopper (3.07) or the first time shopper
<VC> ..... H0 are displayed in Table
a regression was run
income, number of
aversion, innovativeness, store
relationship between these variables and
Play It Again Sports stores.
household side to see
dependent variable, frequency
was a
at
~ risk aversion + ~ .,...,...'"'"<.,, + ~ store + ~ education + ~
,,!',..,.rnA + ~ number of household + e = ~ frequency
While
the
important
store nor the socio-economic
visiting the store, both risk
Table 2 for results).
up so to
possible
shopped at
shop frequently
vp.r~op consumer's risk aversion
the average score
was 36.5 compared to
(the lower the score, the higher
16
had any significant effect on
innovativeness proved
of visiting the store went
to risk). With a
they had never before
score of those who
of risk aversion). The

regression
that
showed an F Ratio of 3.80 with a p-value of 0.056. The '~"'.'~C'0'~'H
is related to the frequency of shopping at Play It Sports
this
Innovati veness showed a significant effect on the frequency of shopping at
It Sports stores. As frequency shopping so did the level
innovativeness ,."' .... ,,,,.1"<''"' by the subjects. With a maximum potential rating of the
score those who shop Play It Sports infrequently was 20.2 compared
with those who frequently measuring at 22.0. The regression further
calculated an F Ratio of and a of 0.021 forthis
Goal of Visit
Another model .~"~.~~ to the of the cm;rorner"s visit.
indicated their expected transactions from the four categories supplied--purchase
equipment, new used equipment, just looking. four
am;aCl[lOIlS were
categories are now being H.".''''H.A' to as
current visit to Play It Again sports.
on visit,
customer
These
other. These two
the customer with respect to
percent of the shoppers surveyed
42% intended some other transaction.
were calculated for goal the
shoppers intending to make a
purchase (4.03) was lower than mean "''''''''LA,'''''' of shoppers some other goal (4.36).
intending to make a purchase on average scored .64 on innovativeness
17

scale--slightly higher than the average score of 20.44 for other
a more complete list of averages).
(See Table 3
After viewing the averages, a model was run to possible
relationship the goal the shopper a variety H'~J'-'IJ'''''ll'U'''!H variables.
P aversion + P innovativeness + P store + P education + P income + P number of children + P size of household + e = P of visit
The calculation showed no significant relationship a customer's
and or risk aversion, level of innovativeness, or sO(;IQ--eCOnCJI situation. There
was, however, a relationship with image of the store (See table 3).
Customers intending to an rating of 65.51 their image
of Play It Again Sports store. AnT' ... ,." intending some other transaction, however,
gave rank of 68.00, two and a points higher. analysis
further revealed that was a marginally significant relationship between the of
shopper and or her of store, an F Ratio of and a
0.099.
Who Is Being Shopped
Here differences customers are examined with respect to who they are shopping
The customers sampled were split two shopping for
made of sample customers shopping for someone (primarily children
or spouse) totaled 48% the sample. amount customers shopping
expected to spend (3.06) was higher than the amount reported by
customers shopping for someone (2.30). Additionally, the average household
18

for themselves (2.87) was
household of customers shopping others (3.72).
one ,"prCAn smaller than the average
Table 4 for a condensed display
of the of these and variables).
regression was then created to test the relationship npl~Ul?·pn a customer's
characteristics attitudes and whom or she is shopping.
~ aversion + ~ innovativeness + ~ store image + ~ education + ~
income + ~ of children + ~ size of household + e = ~ who is
being shopped for
analysis showed no significant relationship between who the customer was
shopping for and aversion, innovativeness or store was also no
relationship respect to household or BLvVBL....,. was, a
relationship between two independent variables--education and number of children--and for
whom customer is shopping Table 4).
A consumer making a purchase someone other than himself or herself is more
likely to a education. regression analysis showed an F of
2.29 and a p-value of 0.070 for this correlation. Similarly, a customer making a purchase
someone is more likely to have more children than someone making a purchase
himself or herself. In this case, the analysis showed an F Ratio and a p-
0.078.
Frequency of Buying Used Goods
The rlp,",pn.rlplnt variable in this study was the frequency with which
customers purchased any type used goods. sample was broken into three categories,
19

the first were those customers who reported they never purchased pre-owned merchandise.
Eighteen percent of the respondents responded this way. The seconded category contained
50% of the respondents and consisted of the people who purchased used merchandise
infrequently (once or twice a year). The final category contained the frequent purchasers, or
those who reported that they bought pre-owned goods more than twice a year. This
category constituted the remaining 32% of the sample.
Averages for different consumer variables and in these three categories are reported
in Table 5. Some of the more interesting results include income, which averages lowest
among those persons reporting that they never buy used merchandise. Also, the average
amount that customers expect to spend on their purchases today is lowest (2.39) among
those who frequently purchase used goods and highest (3.00) among those who never
purchase pre-owned merchandise.
before.
Again, a regression model was created usmg the same dependent variables as
~ risk aversion + ~ innovativeness + ~ store image + ~ education + ~
income + ~ number of children + ~ size of household + e = ~ frequency
of purchasing used goods
The regression analysis of this equation shows one significant relationship with the size of
the consumer's household (See Table 5). A consumer with a larger number of people in his
or her household is likely to purchase used goods more frequently than a consumer with a
smaller household. Comparing the average household size reported, consumers who never
purchase used goods averaged 2.56 members while shoppers who purchased pre-owned
goods frequently had average households of 3.50 members. Furthermore, regression
20
analysis shows a relationship between
4.15 and a p-value 0.046. demonstrates a
of used goods of a consumer's household.
21
two with an F Ratio
between the

Discussion
The finding presented above raise a number of questions. This section will attempt
to explore these questions and help explain why the customers of second-order retail stores
behave as they do. This exploration should help guide future research and help lead to the
development of theories associated with a consumer's behavior in the second-order retail
market. It should also hopefully help provide some implications for practitioners dealing in
the used goods market.
Conclusions
In analyzing the relationship of different variables to the frequency of shopping Play
It Again Sports, two significant effects were found. The first was the relationship between a
consumer's risk aversion and the frequency of visits. It was found that the more risk a
customer perceived, the more often they tended to shop at Play It Again Sports. This
supports the discussion of prior research in similar fields. It seems reasonable that
consumers see the lower cost of the used merchandise and the lower commitment, knowing
that it is possible to sell the products back in the future, as a way for the customer to avoid
the perceived risk. Purchasing used goods allows for a lower commitment to the purchase
and thus lowers the perceived risk.
The second significant relationship found in the regression analysis of the frequency
of shopping at Play It Again Sports was with innovativeness. This variable was originally
conceived as a factor involved only in the sale of used goods, however, it proved significant
in the analysis of the overall frequency of visits. A consumer with a higher level of
22

innovativeness is more likely to shop at Play It Again Sports more often. This seems
difficult to explain on its own, but when combined with the results of the risk aversion
correlation, a feasible explanation begins to emerge.
It seems that the most frequent shoppers of Play It Again Sports prefer to be
innovative in their purchases, but they also consider these purchases as risky. Thus they see
the purchase of used goods as a way to be innovative and explore new products without the
commitment and risk associated with the purchase of higher price new merchandise. For
example, a consumer may be innovative in wanting to try a new sport, but he or she is still
leery of the risk involved in pursuing this innovative purchase. Without a clear
understanding of how much he or she will enjoy the new sport, the perceived risk by the
consumer is high. The purchase of used merchandise allows the consumer to try the new
sport and determine the benefits of it while still avoiding much of the risk associated with
trying something unfamiliar. In this way, risk aversion and innovativeness work together in
prompting the consumer to explore the used goods market.
Although store image did not prove to have a significant relationship with the
frequency of visiting Play It Again Sports, it should not be completely discarded as an
unimportant component of why consumers shop second-order retail outlets. Shoppers
across all three of the frequency categories seemed to give high marks on store image.
This could show that a good store image is important not only for keeping frequent
patrons, but also for getting customers through the door for the first time. This may be
especially important in the second-order retail market as the industry tries to separate
itself from traditional thrift stores.
23
Store image did emerge in a significant relationship with the consumers' goal of
their visit. Those intending to make some transaction other than a purchase tended to
have a higher opinion of the store's image than their counterparts who intended to make a
purchase. This relationship begins to make sense when one remembers that 88% of the
people falling into the non-purchase category indicated that they were at the store just to
look. The combination of these two results may lead to the explanation that those people
who were just looking enjoy the store and its atmosphere so much that they visit it even
when they do not need to make a purchase. These non-purchasers simply enjoy shopping
at Play It Again Sports as a form of recreation.
The demographic variables also did not relate to shopping frequency as the theory
predicted. Much of this theory was derived from previous work done in traditional used
goods markets. In these markets socio-economic situation was important in the purchase
of used goods. The lack of a significant relationship between socio-economic indicators
and the frequency of visiting Play It Again Sports may demonstrate a significant
difference between this new second-order retail outlet and traditional used goods outlets.
It may be true that by successfully portraying an improved store image, Play It Again
Sports has been successful in attracting many non-traditional used goods customers.
They attract customers who desire used goods because of personality variables like risk
aversion and innovativeness rather than customers that are forced into the used goods
market by an inability to afford new merchandise.
Despite the lack of a significant relationship between socio-economic situation
and frequency of visit, the relationship between demographic information and the
purchase of used merchandise did begin to show in the tests of frequency of buying used
24

goods who is being shopped for. the frequency buying
showed a significant relationship. As households became
goods, household
frequency
purchasing used also fits theories the relationship socio-
economic status to the purchase of used goods. The household must spread
limited H'~''-''''~ over more people and thus gets
way which consumers this type household can
Purchasing
more for money.
is one
Who shopper was buying for had a significant relationship with the number
the consumer's and the consumer's education. Not surprising,
consumers with more children were more likely to be purchasing someone than
themselves. This only makes sense especially when combined with the that
of people shopping someone other than themselves were shopping their children.
Much harder to adequately explain is the relationship between the consumer's level
who or she is shopping Those consumers with education
were more likely to be shopping for someone other than themselves. may at least
explained by recent American beginning with "baby boom"
"yuppie" delaying a family until after completing education.
portion of the explanation may lie in the trend of more women gaining educational
In cases, women are still primarily responsible shopping for
children other "Av.lUU"" family. Sixty of people surveyed were women
and increasing tendency this to attain a higher education may help explain
relationship between consumer's education and who the purchase is being
for.
available.
are of course only two possible explanations, and there many more
25
playa In understanding a Overall, personality
patronage of Play It Again stores and quite possibly retail
for used
and
stores. While this centered on It Again and the
equipment in sporting goods industry, it seems practical to broaden this
apply some of the findings in this research to other similar second-order stores. It
also seems possible while this focused on two personality
<>,,,'r,,,,'nn and innovativeness--it seems that other personality variables may
be rnnnrt<>nt in understanding and predicting customer patronage in second-order
market.
Development of
This can aid in development theory second-order retail
three ways. it shows is an variable
second-order retail market behavior. the research hints at
links between
reduction
in sports or fashion and markets as a risk
finally, the role
versus buying for others seems to an important variable which has not yet been
explored in literature.
While innovativeness was a unexplored personality variable in the used
market in past, demonstrates influence on frequency
shopping in second-order market. Innovativeness was conceived this
study as relating only to sale of After however, it was found
factor was related to purchase of merchandise second-order
26
industry. Possible explanations for this occurrence were discussed earlier, but what is
most important to understand now is that a relationship does exist. Perhaps future
research will help explain why and how exactly this factor fits into the puzzle.
Risk aversion was included in the original model and was later seen to be a
relevant factor in understanding the patronage of second-order retail outlets. A theory
may be developed that as trends in sports and fashion are changing at an accelerating
speed, an interest in second-order retail markets is increasing as consumers search for
ways to reduce risk. This link between trends in various industries and consumers'
responses to these trends of reducing risk through second order markets may be important
in predicting changes in other industries. Industries showing similar trends as may also
present a promising environment for the second-order retail industry.
Finally the role of buying for one's self versus buying for other creates differences
in a customer's behaviors that have before gone unexplored in the used goods market.
Differences in demographics between customers shopping for themselves and customers
shopping for others were discovered in this research. These demographic differences may
prove important in developing theories on who participates in this market and for what
reasons.
Implications in Practice
The findings in this research are not limited to academic theories, but can also
have be valuable to practitioners in the second-order retail industry. The information
obtained may be valuable in areas such as advertising, understanding the importance of
store image and adapting the changes in customer demographics.
27

This research has shown that, at least in the used sports equipment market, both
the family and the individual consumer are important customers. Fifty-four percent of the
customers sampled were shopping for themselves while 46% were shopping for someone
else, generally a member of their family. This near even split of the two types of
shoppers demonstrates the importance of both of these segments. In practice this should
translate into a multi-segment target market with promotions and advertisements aimed at
both the individual and at the family.
Store image was also discussed as an important variable in a customer's
acceptance of and willingness to shop at a second-order retail outlet. Store image is
import both to draw in first time customers and to maintain customers who have already
visited the store. It is clear that the propagation of a good store image must be a high
priority in the marketing strategy for second-order retail outlets. These stores seem to
have done well up to this point at differentiating themselves from the traditional thrift
store. This is demonstrated partially by the different demographics of customers they
attract compared to thrift stores and flea markets . The market's success with store image
is also partially demonstrated by the relationship of high store image among those
customer just looking, or spending their leisure time in the store. It is important that Play
It Again Sports and other second-order retail shops maintain a consistent image of a
quality retailer with good selections and knowledgeable employees, but inexpensive
products. These factors combine to give the customer a good value on dependable
products. This allows consumers to reduce the risk associated with new products by
purchasing quality used products in a pleasant environment without the commitment
associated with the purchase of expensive new products.
28

practitioners must recognize and to adjust to changing
demographics of their customers. These are experiencing a growing customer
as singles or who formerly bought for will buy for children
in the existing customers will an important base future for
C>",,,JU'-' 'JA '-'VA retail
Future Research
While this has contributed to the understanding of customers in the
second-order industry, more area must be explored. study was
and in many ways has as many questions as it has answered.
of this section is to help provide suggestions directions for research
into the customers of the 0'""-'''"'' .... retail market.
should be to consumers who used
study was intended to explore behavior, but was unable to do so. Thus this is
still a unexplored research. jJ""al~"''' primary consumers are the source
the industry it is important to "'"."."..",.. more about
consumers including their motivations selling pre-owned merchandise. will help
and practitioners
industry.
better the issues supply in the
Another topic for future is the exploration of risk and innovativeness in
second-order retail sporting goods Some of
markets may AU .. 'U,' .... v children's personal computers, and automobiles. It is
important to out whether relating to aversion and innovativeness are
29
to
sectors
A
which
Do consumers in an second-order
and what are some traits only to
future research is a search for other personality variables
"v~'vu.u order markets more attractive. Risk """' .. e",,n
innovativeness were demonstrated to be important factors influencing a consumer's
patronage of
worthwhile to
effects on
market.
Although a
to increase
aversion and innovativeness
make shopping in the seCOWJ
the importance of other T'.lr·H~lr"
industry. Given this, it would certainly
personality variables that might have similarly important
to
still
or sell used goods in the second-order
to
to be completed, this study has helped
second-order retail markets. Risk
important personality variables which
more attractive. It has also introduced
customer is buying. Future research
should focus on how factors what are important for
understanding consumer behavior in this growing market.
30

Questionnaire
This survey is being conducted as part of research for a thesis being done by an Undergraduate student at The Ohio State University. Its purpose is to better understand why customers buy and sell sports equipment. Please answer all the following questions as truthfully as possible. Your response is completely anonymous.
1. Which of the following transactions to you plan on making today at Play It Again Sports?
o Purchase used equipment
o Purchase new equipment
o Sell used equipment
o Just looking
2. Who are you buying or selling the equipment for?
o Myself
DMy spouse
o My child or children o Other __________________ _
3. Which sport best describes the equipment you are buying or selling?
o Baseball / Softball 0 Hockey
o Basketball
o Exercise equipment
o Football
OOoif
o Inline Skates
o Soccer
o Tennis
o Other ----------
4. How much do you expect to spend on your purchase today?
0$0 to $10.99 0 $51 to $100
0$11 to $25 .99
0$26 to $50.99
o more than $100
5. How much do you expect to receive from your sale?
0$0 to $10.99 0 $51 to $100
0$11 to $25.99
0$26 to $50.99
o more than $100
31

6. How often do you a
DTills is
D 1- 2
D 3 - 6 times a
How often do you
D This is my
D 1 - 2 times a
D 3 - 6 times a
8. How often do you buy
DNever
D 1 - 2 times a year
3 - 6 times a
It Again Sports store?
Once a month
Once a week
D More than once a
store?
Once a month
Once a week
More than once a week
any type?
Once a week
More than once a week
respond to the following greem.ent with each statement.
by the number which
lam person who would try once. 7 6 5 4
When I to a restaurant, I feel it is to dishes I am familiar with. 7 6 5 4
cautious in trying new/different 7 6 5 4
date or dinner, trying a new or
7 6 5 4
I would with a brand I usually than try something I am not very sure 7 6 5 4
32
to your
3 2 1
3 2 1
3 2 1
3 2 1
3 2 1

Strongly Strongly Agree Disagree
I eat out, I items the restaurant serves,
even if I am not sure I would 7 6 5 4 3 2 1
I never buy something I don't know about at the risk of a 7 6 5 4 3 2 1
appliances, I will buy well brands. 7 6 5 4 3 2 1
taking chances in brands just to some
in my purchases. 7 6 5 4 3 2 1
to buy new and different 7 6 5 4 3 2 1
I am usually among the first to try new 7 6 5 4 3 2 1
I don't to take chances. 7 6 5 4 3 2 1
I 7 6 5 4 3 2 1
When I see a new brand on the shelf I often buy it to see what it is like. 7 6 5 4 3 2 1
33

Strongly Strongly Agree Disagree
store has good 7 6 5 4 3 2 1
store's clerks are well 7 6 5 4 3 2
store has knowledgeable clerks. 7 6 5 4 3 2 1
an unlimited 7 6 5 4 3 2 1
helpful sales 7 6 5 4 3 2 1
store attracts upper-class customers. 7 6 5 4 3 2 1
an attractive layout. 7 6 5 4 3 2
store is prestigious. 7 6 5 4 3 2
The store informative advertising. 7 6 5 4 3 2 1
to shop in. 7 6 5 4 3 2 1
11. your answer to the following your feeling.
'"''''"""HL'' by placing a 'X' on the which
Given would you
Substantial
"',","OJ",", investment you say purchasing
1 2 3 4 5
involved with purchasing would be involved with purchasing
Risk 1 2 3 4 5
34
6
purchase of would be?
Very risky 7
equipment today, how much newest models and styles?
6 7 Very little risk

How risky do you feel it would be for you to purchase sports equipment?
Not risky at all
12. I am ...
o Male
13. Into which
Under 18
18 to
o to 34
2
do you
3 4 5
Female
35 to 44
45 to 54
o or Over
6 7
14. How many people are in your household (include yourself)?
I 4
02 5
3 6 or more
Very risky
15. Please indicate how many children you have in the following age groups:
__ 0 to 3 years old
__ 4 to 7 years old
__ 8 to 11 years old
16. What is your level education?
12 to 15 years old
_~~_ 16 to 18 years old
Some High School College Graduate
School Graduate Professional or Graduate level education
College or School
17. Which category best describes your yearly household income?
$0 to $15,000 $45,001 to $60,000
$15,001 to $30,000
$30,001 to $45,000
$60,001 to $75,000
Over $75,000
18. Please provide your home zip code: ___________ _
35

36

Table 1 cont.
Education High School 22 22% Some College 17 17% College Grad. 36 36% Professional 24 24%
Household Income Under $30,000 12 12% $30 - $45,000 18 18% $45 - $60,000 31 32% $60 - $75,000 12 12% Over $75,000 24 25%
37

Table 2
Frequency of Shopping at Play It Again Sports
Characteristic First Visit Infrequent Frequent F Ratio p-value Number 32 27 41 Risk A version 36.50 33.96 34.85 3.80 0.056 Innovati veness 20.91 20.19 22.00 5.64 0.021 Store Image 63.81 68.00 67.06 0.24 0.625 Household Size 2.97 3.07 3.65 0.00 0.998 Education 3.50 3.78 3.48 0.37 0.829 Income 3.61 4.26 4.54 1.95 0.113 Number of Children 1.25 1.22 1.18 0.25 0.620
Table 3
Goal of Visit
Characteristic Purchase Other F Ratio p-value Number 58 42 Risk A version 35.47 34.63 0.05 0.819 Innovativeness 21.64 20.44 0.30 0.588 Store Image 65.51 68.00 2.80 0.099 Household Size 3.28 3.27 0.97 0.433 Education 3.55 3.59 1.94 0.116 Income 4.03 4.36 1.09 0.301 Number of Children 1.31 1.46 0.88 0.352
38

Table 4
Who Is Being Shopped For
Characteristic Self Other F Ratio p-value Number
19 0.02 0.904 Innovativeness 21. 80 20.43 0.04 1 Store 65.62 67.71 1.19 0.279 Household 2.87 0.61 0.435 Education 3.48 2.29 0.070 Income 4.16 0.65 0.631 Number Children 1.00
Table 5
Frequency of Buying Used Goods
Characteristic Never Infrequent Frequent F Ratio Number 18 50 32 Risk aversion 1 0.11 0.739 Innovativeness 20.38 21.52 0.01 0.904
65.27 66.93 0.01 Household Size 2.56 3.39 4.15 0.046 Education 0.98 Income 3.71 4.13 0.46 0.767 Number of 1.00 1.43 1.50 1.30 0.258
39

6
Goal Who Freq. Used $ Spend
Dependent Variables Correlation
Goal Who For Freq. Used 1.00 -0.25 -0.01 0.31
1.00 0.04 -0.14 0.04 1.00 0.18
1 14 0.l8 1.00 0.12 -0.28 -0.29 -0.17
40
$ 0.12
-0.17 1.00

References
V«',H~'''. James "Perceived and a Model vlOn2, p 184-190.
" Journal of Marketing Research.
Bloch, "The Product Enthusiast: Implications for Marketing " Journal of Marketing. v3n3, p 51
Gordon II and Paul J. Marketing Handbook: A Compilation of Muti-Item Measures. Chicago Illinois: 1992.
Darley, William K. Lim, Jeen-Su. "Store-Choice Behavior for Pre-Owned Merchandise." Journal of Business Research. v27nl, p 1.
Dowling, Rand Richard. "A of Perceived Risk and Intended Risk -handling " Journal of Consumer Research. 1994, 1 , P 119-1
Gabbott, Mark. Role of Product Cues in European Journal of Marketing. ] 991,
in Second-Hand Markets." p 38-50.
Hirschman, Elizabeth "Innovativeness, Novelty Seeking, and Consumer Creativity." of Consumer 1980, p 283-295.
Influences of Inherent Risk Information Acquisition on "'L"';o:..,-,'"." Journal of the Academy of Marketing
Oliver, Richard L. Bearden, William O. in of Reasoned Action: Moderating Influence " Journal of Consumer Research. 1985, p 324-340.
O'Reilly, Lynn, Rucker, Margaret, Rhond, Gorang, Marge and Susan. Relationship of Psychological and Situational Variables to of a
Marketing " of the of Marketing "",nYu""
p 53-76.
Raju, P.S. "Optimum Stimulation Its relationship to Exploratory Behavior." Journal Consumer
Everett M. Shoemaker, Floyd Communication of Innovations. New York: The Press. 1 1.
41
Shimp, and Bearden, William O. "Warranty and Other Extrinsic Cue Effects on Consumers' Risk " Journal of Consumer 1982, v9, p38-46.
Sirgy, M. SarnJi, A. Path Analytic Model of Loyalty Involving Self-Concept, Store Image, Geographic Loyalty, and Socioeconomic
" Journal of the Academy of Marketing Science. 1985, v13n3, p 1.
Minakshi. "A Model Stochastic UV'-""U1F," Marketing 1994, v13n3, p 274-297.
Venkatraman, Meera and Linda Cognitive Sensory Innovativess." Journal of Business Research. 1990, v20n4, p
Wells, William D. Tigert, Douglas. "Activities, Interests, and Opinions." Journal Advertising Research. 1971, vll, p
Wheatley, John J. and Chiu, John Respondent Characteristics on
Research. 1977, v14, p 181 86.
Effects of Price , Store Image, and Product Quality." Journal of Marketing
Wu, Bob T.W. Petroshius, M. halo Journal of the Academy of Marketing Science.
Ugur and Riecken, "Heavy, Medium, Light and Nonshoppers of a used Merchandise Outlet." Journal of Business Research. 1981, v9, p 243-253.
42