factors affecting academic … affecting academic performance of undergraduate students at uganda...
TRANSCRIPT

FACTORS AFFECTING ACADEMIC PERFORMANCE OF UNDERGRADUATE
STUDENTS AT UGANDA CHRISTIAN UNIVERSITY
BY
KYOSHABA MARTHA
BBA (UCU)
2005/HD04/4262U
DISSERTATION SUBMITTED TO GRADUATE SCHOOL IN PARTIAL
FUFILMENT OF THE REQUIREMENTS FOR THE AWARD OF
THE DEGREE OF MASTER OF ARTS IN EDUCATIONAL
MANAGEMENT OF MAKERERE UNIVERSITY
DECEMBER 2009

1
DECLARATION
I, Martha Kyoshaba, hereby declare that, this dissertation is my original work and has never
been presented to any university or institution for any academic award.
Sign:…………………………………………………………..
Martha Kyoshaba
Date:…………………………………………………………..

2
APPROVAL
This dissertation has been written under our supervision and has been submitted for the award
of the degree of Master of Arts in Educational Management with our approval as supervisors.
……………………………………………………………….
Dr. James L. Nkata
Date:…………………………………………………………
……………………………………………………………….
Dr. F. E. K. Bakkabulindi
Date:…………………………………………………………

3
DEDICATION
This dissertation is dedicated to my late mother, Mrs. Petrid K Majara who always wanted
me to be a teacher, my husband Jacobs who encouraged me to strive on and my little girls,
Isabel and Christabel whom I want to follow in my footsteps.
4
ACKNOWLEDGEMENT
I would like to thank the following people who in many ways contributed to this piece of
work.
I am indebted to my supervisor, Dr. James L. Nkata for his patience, inspiration and
encouragement. I admired the way in which he explained very difficult concepts in very
simple ways. I would like to thank Dr. Beatrice Ssekabembe who led me through the first
stages of my research work when I had no experience at all. Words cannot express how
grateful I am to Dr. F.E.K Bakkabulindi whose invaluable knowledge helped me to put this
piece of work together, he guided me all through, read through my work and encouraged me
not to give up. I am so grateful to my work supervisor, the Rev. Can Dr. Alex Kagume who
encouraged me to go back to school and for allowing me to take time off work to study. I
thank him and the management of Uganda Christian University who sponsored my studies at
Makerere University. I also thank my colleagues at work, Sylvia, Annette and Justine who
always stood in for me when I went to meet my supervisor and Godfrey who helped to collect
the filled questionnaires from the respondents. I cannot forget to thank my group mates Lydia
and Esther, we always encouraged one another to keep on keeping on.
I thank you all very much.

5
TABLE OF CONTENTS
Declaration … … … … … … … … … … i
Approval … … … … … … … … … … ii
Dedication … … … … … … … … … … iii
Acknowledgement … … … … … … … … … iv
Table of Contents … … … … … … … … … v
List of Tables … … … … … … … … … … vi
List of Figures … … … … … … … … … … viii
Abstract … … … … … … … … … … xi
CHAPTER ONE: INTRODUCTION … … … ... … 1
1.0 Introduction … … … … … … … … … 1
1.1 Background … … … … … … … … … 1
1.2 Statement of the problem … … … … … … … 5
1.3 Purpose … … … … … … … … … 6
1.4 Specific objectives … … … … … … … … 6
1.5 Questions … … … … … … … … … 6
1.6 Hypotheses … … … … … … … … … 7
1.7 Scope … … … … … … … … … 7
1.8 Significance .... .... … … … … … … … 7
CHAPTER TWO: LITERATURE REVIEW … … … … 9
2.0 Introduction … … … … … … … … … 9
2.1 Theoretical review … … … … … … … … 9
6
2.2 Conceptual framework … … … … … … … 10
2.3 Related literature … … … … … … … … 14
CHAPTER THREE: METHODOLOGY … … … … 27
3.0 Introduction … … … … … … … … 27
3.1 Research Design … … … … … … … … 27
3.2 Population … … … … … … … … … … 27
3.3 Sample size and Sampling techniques …. … … … … …… 27
3.4 Research instruments … … … … … … … 28
3.5 Validity of instruments … … … … … … … 28
3.6 Reliability of instruments … … … … … … … 29
3.7 Procedure … … … … … … … … … … 29
3.8 Data Analysis … … … … … … … … … 30
3.9 Ethical Consideration … … … … … … … … … … … … … … … … … … 30
CHAPTER FOUR: PRESENTATION ANALYSIS AND INTERPRETATION
OF DATA … … … … … … 31
4.0 Introduction… … … … … … … … … … 31
4.1 Background of the respondents… … … … … … … 31
4.2 Description of the dependent variable… … … … … … 34
4.3 Verification of Hypotheses … … … … … … … 39
7
CHAPTER FOUR: DISCUSSION, CONCLUSIONS AND
RECOMMENDATIONS … … … … 50
5.0 Introduction… … … … … … … … … …. 50
5.1 Discussion of findings … … … … … … … … 50
5.2 Conclusions… … … … … … … … … … 58
5.3 Recommendations … … … … … … … ... 58
5.4 Areas of further research … … … … … … … 60
REFERENCES … … … … … … … … 61
APPENDICES ... ... ... ... ... ... ... ... 67
Appendix A : Questionnaire … … … … … … … 67
Appendix B : Reliability Analysis … … … … … … 72
Appendix C: UCU students’ enrolment analysis 2006/2007 … … 73
Appendix D: Pearson product moment correlation between former school
background and academic performance … … … 76
Appendix E: Letter of authorization from Dean, School of Education
to carry out the research … … … … … 77

8
LIST OF TABLES
Table 1: Admission points and academic performance of some students
who graduated in 2007 … … … … … … … 4
Table 2: Respondents by gender … … … … … … … … … 31
Table 3: Respondents according to age… … … … … … … … … 32
Table 4: Respondents according to faculty of study … … … … 33
Table 5: Respondents according to the year of study… … … … 34
Table 6 : Level of academic performance as perceived by the students… … ... 35
Table 7: Arithmetic mean and standard deviation of academic performance … 36
Table 8: Summary of t-test results for the relationship between gender and
academic performance … … … … … ... … 36
Table 9: Summary of the descriptive statistics and ANOVA results for the
relationship between age and academic Performance… … …… … … 37
Table 10: Summary of the descriptive statistics and ANOVA results for the
Relationship between faculty of study and academic performance … 38
Table 11:Summary of the descriptive statistics and ANOVA results for the
Relationship between year of study and academic performance . … … 39
Table 12: Level of academic performance as perceived by
the respondents … … … … ... ... ... ... 40
Table13: Summary of the Pearson Product Moment Correlation analysis
for the relationship between A’ level admission points and
academic performance .... ... ... ... ... ... 41
9
Table 14: Summary of the Pearson Product Moment Correlation
analysis for the relationship between diploma admission points
and academic performance ... ... ... ... ... 42
Table 15: Summary of the Pearson Product Moment Correlation analysis for the
relationship between mature age admission points and academic
performance … … … … … … … … 43
Table 16 : Summary of the Pearson Product Moment Correlation analysis
for the relationship between other performance in other examinations
and academic performance .… … … … … 44
Table 17: Parents’ social economic status as perceived by the respondents ... … 45
Table 18: Arithmetic mean and standard deviation of social economic status… 46
Table 19: Summary of the Pearson product moment correlation analysis for the
relationship between parents’ social economic status and academic
performance … ... … … … … … 46
Table 20: Former school background as perceived by the respondents … ... 47
Table 21: Arithmetic mean and Standard deviation of Former School
Background … ... … … … … … … 48
Table 22: Summary of the Pearson product moment correlation analysis for the
relationship between former school background and academic
performance … ... … … … … … 49

10
LIST OF FIGURES
Fig 1: Conceptual framework of the factors affecting academic performance… 11

11
ABSTRACT
This study was designed to investigate the factors affecting academic performance of
undergraduate students of Uganda Christian University (UCU). Emphasis was put on
trying to establish the relationship between admission points, parents’ social
economic status, former school background and academic performance of
undergraduate students at Uganda Christian University. The study employed the use
of correlation design to establish the nature of the relationships. The validity and
reliability of research instruments was established and data was collected from 340
respondents selected from all the six faculties of Uganda Christian University using
the simple random sampling method. To analyze the data, the Pearson product
moment correlation statistical tool was used with the aim of establishing the
relationship between students’ admission points, parents’ social economic status,
former school background and academic performance of undergraduate students at
Uganda Christian University. This formed the basis of the detailed analysis and
conclusions and recommendations.
The findings revealed the existence of a significant relationship between students’ A’
level and Diploma admission points and academic performance, but there was no
relationship between mature age points and academic performance. The findings also
revealed that there was a significant relationship between parents’ social economic
status and academic performance and a significant relationship between former school
background and academic performance. On the basis of the findings, the researcher
made the following conclusions; A’ level and diploma admission points are the most
objective way to select just a few students from a multitude of applicants for the

12
limited spaces available at universities in Uganda. Parents’ social economic status is
important because parents provide high levels of psychological support for their
children through environments that encourage the development of skills necessary for
success at school. That location, ownership and academic and financial status of
schools do count on making a school what it is and in turn influencing the academic
performance of its students because they set the parameters of a students’ learning
experience. The researcher also confirmed the system’s theory input output model.
On the basis of the conclusions made, the researcher recommended that; Uganda
Christian University maintains its selection criteria of using previous academic
performance as a measure of admitting students for undergraduate programs.
However mature age students could be given supplementary year or probation year to
test their competency in addition to the entrance exam. The university should improve
the student support system such that students from low social economic backgrounds
are identified and assisted through offering scholarships. This study identified the
need to investigate and analyze the mature age and international students’ recipe for
success in higher education with the intention of developing some of these aspects for
inclusion in all student selections.
13
CHAPTER ONE
INTRODUCTION
1.0 Introduction
This Chapter contains the background, purpose, objectives, questions, hypotheses and
significance of the study.
1.1 Background
Academic performance is affected by a number of factors including admission points,
social economic status and school background. Geiser and Santelices (2007), Acato
(2006), and Swart (1999) all argue that admission points which are a reflection of the
previous performance influence future academic performance. The Universities
Admission Center (2006) reports that tertiary institutions in Austria have found that a
selection rank based on a student’s overall academic achievement is the best single
predictor of tertiary success for most tertiary courses. The researcher agrees with the
scholars that admission points affect academic performance at university and that is
why according to the Uganda Universities and Other Tertiary Institutions Act (2001),
the basis for entry to university is admission points which are derived from A’ level
points, Diploma points and Mature age points.
According to Graetz (1995), one’s educational success depends very strongly on
social economic status of the parents. Considine and Zappala (2002) argue that
families where the parents are advantaged socially, educationally and economically
foster a high level of achievement in their children. The researcher agrees with
14
Considine and Zappala (2002) because students from high social economic
backgrounds are well exposed to scholastic materials, which aid their intelligence.
Sentamu (2003), Kwesiga (2002) and Portes and Macleod (1996) as cited in
Considine and Zappala (2002) all argue that the type of school a child attends
influences academic achievement. According to Minnesota measures (2007), a report
on higher education performance, which was produced by the University of
Minnesota, the most reliable predictor of student success in college is the academic
preparation of students in high school.
The researcher adapted the Systems theory input-output model advanced by Ludwig
Von Bertalanffy in the early 1950s. This theory, according to Koontz and Weirich
(1988) postulates that an organized enterprise does not exist in a vacuum but is
dependant on its external environment thus the enterprise receives inputs, transforms
them and exports the out put to the environment. In this study the university admits
students (inputs) and then transforms them through teaching and learning which is
reflected by the students’ academic performance (output).
Academic performance according to the Cambridge University Reporter (2003) is
frequently defined in terms of examination performance. In this study academic
performance was characterized by performance in tests, in course work and
performance in examinations of undergraduate students. According to the UCU
prospectus, admission points are weights attached to the applicant’s past academic
records (UCU, nd ) and according to the Uganda Universities and Other Tertiary
Institutions act (2001) there are three main entry schemes to higher education in
Uganda, the direct entry (A’ level), the mature age entry scheme and diploma entry
15
scheme. The admission points for this study were characterized by direct entry
scheme (A’ level), diploma entry scheme and mature age scheme. Durden & Ellis (as
cited in Staffolani and Bratti, 2002) observed that measures of prior educational
performance are the most important determinants of student performance. This
implies that the higher the previous performance, the better the students will perform
academically.
Social Economic Status (SES) according to Considine and Zappala (2002) is a
person’s overall social position to which attainments in both the social and economic
domain contribute. They add that social economic status is determined by an
individual’s achievements in, education, employment, occupational status and
income. In this study social economic status (SES) was characterized by family
income, parental education and parental occupation. Graetz (1995) argues that
children from high social economic status families perform much better at school
compared to children from low SES families.
Schools according to Sentamu (2003) are social institutions in which groups of
individuals are brought together to share educational experiences and such
interactions may breed positive or negative influences on learners. In this study,
school background was characterized by location of school (urban or rural), school
ownership (public or private schools), school academic status and school financial
standing.
Records in the office of the Deputy Vice Chancellor for Academic Affairs show that
Uganda Christian University (UCU) has a merit-based system of admissions; it admits
16
students following the minimum requirements as provided for by the Uganda
Universities and Other Tertiary Institution’s Act (2001). UCU prospectus, nd. It is
believed that most of the students admitted are from medium and high social
economic backgrounds because UCU is a private university where students pay their
fees and majority of the students are either self sponsored or paid for by their parents.
These students are from various school backgrounds. The students’ academic
performance is assessed by use of tests, assignments and examinations. Much as it is
normal for students in an educational institution to perform well and others poorly,
even after receiving the same services, the researcher is curious to know what makes
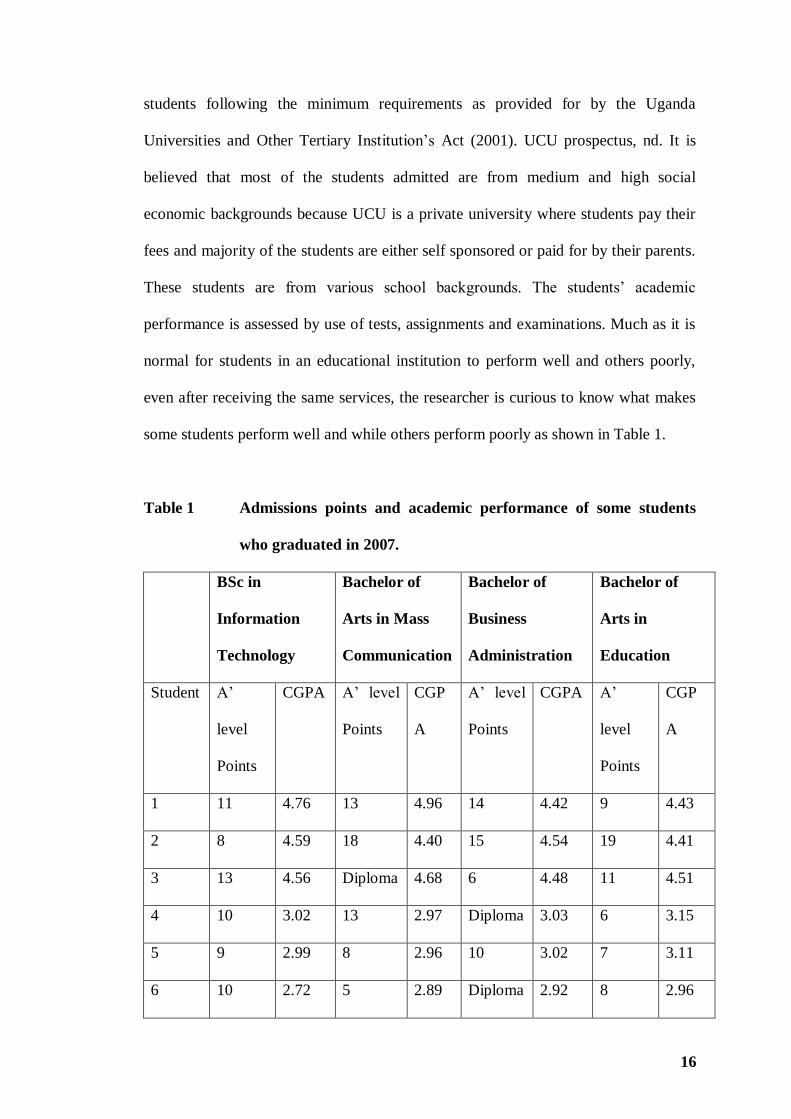
some students perform well and while others perform poorly as shown in Table 1.
Table 1 Admissions points and academic performance of some students
who graduated in 2007.
BSc in
Information
Technology
Bachelor of
Arts in Mass
Communication
Bachelor of
Business
Administration
Bachelor of
Arts in
Education
Student A’
level
Points
CGPA A’ level
Points
CGP
A
A’ level
Points
CGPA A’
level
Points
CGP
A
1 11 4.76 13 4.96 14 4.42 9 4.43
2 8 4.59 18 4.40 15 4.54 19 4.41
3 13 4.56 Diploma 4.68 6 4.48 11 4.51
4 10 3.02 13 2.97 Diploma 3.03 6 3.15
5 9 2.99 8 2.96 10 3.02 7 3.11
6 10 2.72 5 2.89 Diploma 2.92 8 2.96
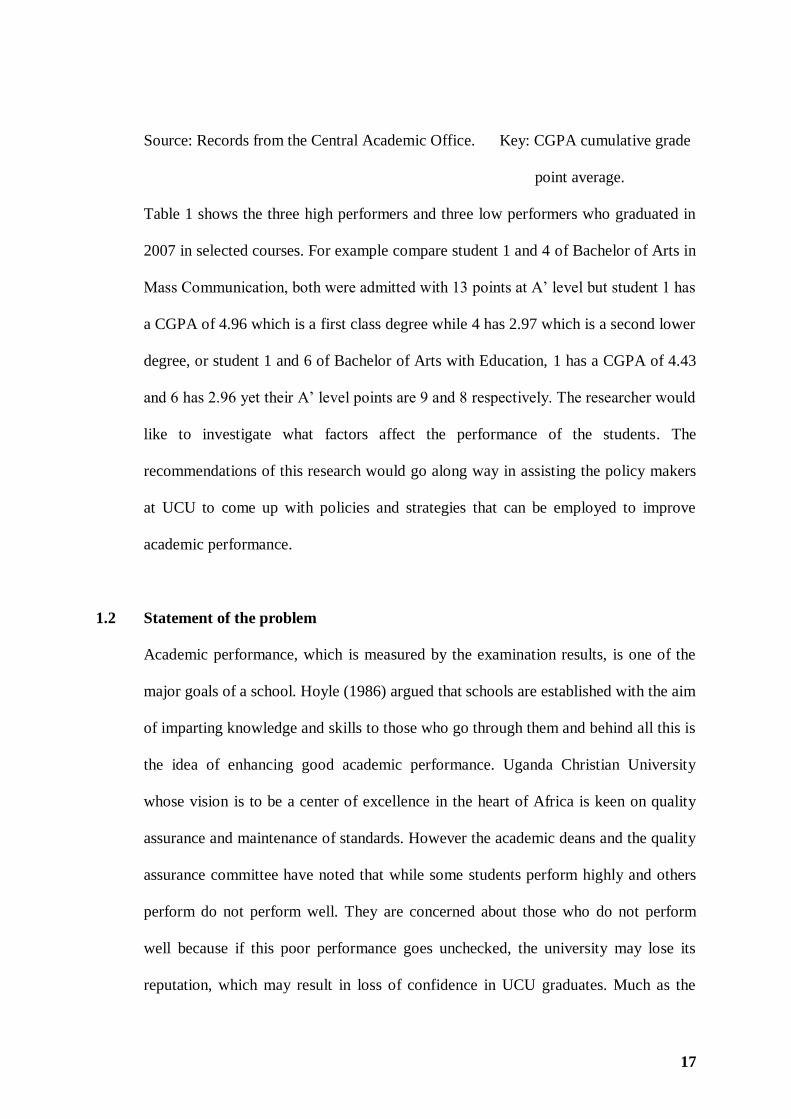
17
Source: Records from the Central Academic Office. Key: CGPA cumulative grade
point average.
Table 1 shows the three high performers and three low performers who graduated in
2007 in selected courses. For example compare student 1 and 4 of Bachelor of Arts in
Mass Communication, both were admitted with 13 points at A’ level but student 1 has
a CGPA of 4.96 which is a first class degree while 4 has 2.97 which is a second lower
degree, or student 1 and 6 of Bachelor of Arts with Education, 1 has a CGPA of 4.43
and 6 has 2.96 yet their A’ level points are 9 and 8 respectively. The researcher would
like to investigate what factors affect the performance of the students. The
recommendations of this research would go along way in assisting the policy makers
at UCU to come up with policies and strategies that can be employed to improve
academic performance.
1.2 Statement of the problem
Academic performance, which is measured by the examination results, is one of the
major goals of a school. Hoyle (1986) argued that schools are established with the aim
of imparting knowledge and skills to those who go through them and behind all this is
the idea of enhancing good academic performance. Uganda Christian University
whose vision is to be a center of excellence in the heart of Africa is keen on quality
assurance and maintenance of standards. However the academic deans and the quality
assurance committee have noted that while some students perform highly and others
perform do not perform well. They are concerned about those who do not perform
well because if this poor performance goes unchecked, the university may lose its
reputation, which may result in loss of confidence in UCU graduates. Much as the

18
situation described here causes concern, it is not yet known why some students fail to
attain the standards expected of them. There is lack of sufficient research in the case
of UCU as to what factors affect academic performance of the students. The
researcher would therefore like to establish the factors affecting academic
performance of undergraduate students of Uganda Christian University with specific
reference to admission points, social economic status and school background.
1.3 Purpose
To find out if factors like admission points, parents’ social economic status and
former school background affect academic performance of undergraduate students at
Uganda Christian University.
1.4 Specific objectives
i) To establish the relationship between students’ admission points and academic
performance of undergraduate students.
ii) To establish the relationship between parents’ social economic status and academic
performance of undergraduate students.
iii) To establish the relationship between students’ former school background and
academic performance of undergraduate students.
1.5 Research Questions
i) What is the relationship between students’ admission points and academic
performance of undergraduate students?
ii) What is the relationship between parents’ social economic status and academic
performance of undergraduate students?
19
iii) What is the relationship between students’ former school background and academic
performance of undergraduate students?
1.6 Research Hypotheses
i) There is a positive relationship between students’ admission points and academic
performance of undergraduate students.
ii) There is a positive relationship between parents’ social economic status and academic
performance of undergraduate students.
iii) There is a positive relationship between students’ former school background and
academic performance of undergraduate students.
1.7 Scope
The study was conducted at Uganda Christian University in Mukono, Uganda, using
correlation design and a sample of first year, second and final year students selected
from all the six faculties at UCU. The content scope covered factors such as
admission points, socio-economic status and school background which affect
academic performance of undergraduate students. The study covered the period of
academic year 2006/2007 and 2007/2008.
1.8 Significance
A lot of research has been done on factors affecting academic performance of college
students but there is scarce information about academic performance of students at
Uganda Christian University. The study will enable the researcher to make
recommendations to Uganda Christian University policy makers especially those in

20
the Quality Assurance unit, the Central Academic office and the Ministry of
Education and Sports on what policies and strategies can be employed to improve
academic performance in institutions of higher learning. The findings will help the
University Admission’s Board to review its methods of admitting students in order to
improve academic performance. The report will also be a source of reference for other
researchers intending to study academic performance of Uganda Christian University
students.
21
CHAPTER TWO
LITERATURE REVIEW
2.0 Introduction
This Chapter contains the theoretical review, conceptual framework and the review of
related literature.
2.1 Theoretical Review
The theory adapted for this study was derived from the System’s theory input-output
model developed by Ludwig Von Bertalanffy in 1956. The theory, according to
Koontz and Weihrich, (1988) postulates that an organized enterprise does not exist in
a vacuum; it is dependant on its environment in which it is established. They add that
the inputs from the environment are received by the organization, which then
transforms them into outputs. As adapted in this study, the students (Inputs) are
admitted into the university, with different admission points, from different social
economic backgrounds and are from various school backgrounds, when they get into
the university system, the management of the university transforms them through the
process of teaching and learning and the students output is seen through their
academic performance.
Robbins (1980) argued that organizations were increasingly described as absorbers,
processors and generators and that the organizational system could be envisioned as
made up of several interdependent factors. System advocates, according to Robbins
(1980) have recognized that a change in any factor within the organization has an
impact on all other organizational or subsystem components. Thus the inputs, the
processors and the generators should function well in order to achieve the desired
22
outcome. Saleemi (1997) in agreement with Robbins (1980) argued that all systems
must work in harmony in order to achieve the overall goals. According to the input-
output model, it is assumed that the students with high admission points, high social
economic background and good school background will perform well if the university
facilities are good, the lecturers and the management of the university is good which
may not always be the case and this is the shortcoming of this theory. According to
Oso and Onen (2005), the interrelationships among parts of a system have to be
understood by all parties involved. This theory requires a shared vision so that all
people in the university have an idea of what they are trying to achieve from all
parties involved, a task that is not easy to achieve.
2.2 Conceptual Framework
This section proposes a conceptual framework within which the concept, academic
performance is treated in this work. It is arrived at basing on the System’s theory
Input-Output model advanced by Ludwig Von Bertalanffy in 1956. The selection of
the model is based on the belief that, the quality of input invariably affects quality of
output in this case academic performance (Acato 2006)
23
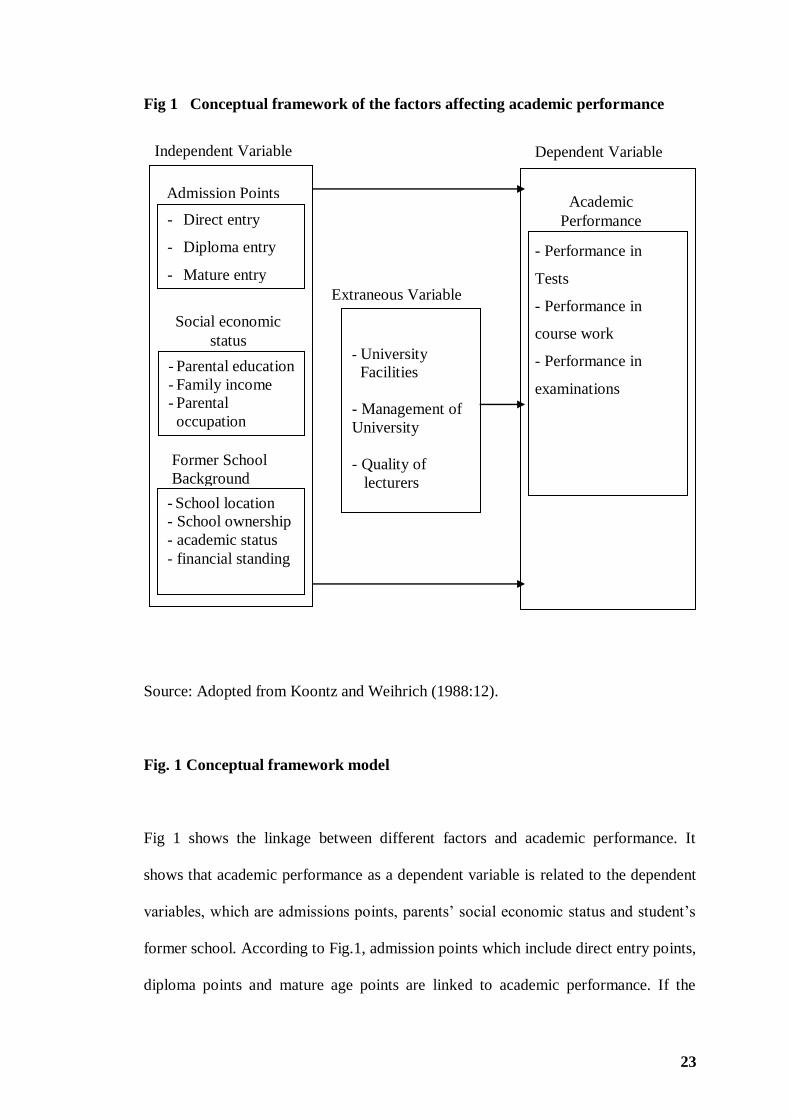
Fig 1 Conceptual framework of the factors affecting academic performance
Source: Adopted from Koontz and Weihrich (1988:12).
Fig. 1 Conceptual framework model
Fig 1 shows the linkage between different factors and academic performance. It
shows that academic performance as a dependent variable is related to the dependent
variables, which are admissions points, parents’ social economic status and student’s
former school. According to Fig.1, admission points which include direct entry points,
diploma points and mature age points are linked to academic performance. If the
- University
Facilities
- Management of
University
- Quality of
lecturers
Admission Points
- Direct entry
- Diploma entry
- Mature entry
- Parental education
- Family income
- Parental
occupation
- School location
- School ownership
- academic status
- financial standing
Social economic
status
Former School
Background
- Performance in
Tests
- Performance in
course work
- Performance in
examinations
Dependent Variable Independent Variable
Extraneous Variable
Academic
Performance

24
admission points are high, then the academic performance is likely to be high and if
admission points are low, then academic performance may be low. This argument is
supported by Geiser and Santelics (2007), Staffolani and Bratti (2002), and McDonald
et al (2001) whose studies showed that previous performance affects future
performance.
Parents’ social economic status, which was conceptualized as parents’ education,
parents’ income and parents’ occupation, is linked to academic performance. The
figure shows that academic performance is dependent on parents’ social economic
status. That is students from high social economic backgrounds will perform better
than their counter parts from low social economic backgrounds as discussed. This is
supported by Dills (2006) and Owens (1999). It is also in line with Hansen and
Mastekaasa (2006) who argued that according to the cultural capital theory one could
expect students from families who are closest to the academic culture to have greatest
success.
The third dependent variable is former school background, which was conceptualized
as location of the former school (urban or rural); ownership of former school (public
or private) academic status of the former school and financial status of the former
school is linked to academic performance of students. That is the type of school a
student attends is likely to contribute to their academic performance of the student in
future. Students from high-class schools are likely to perform well due to the fact that
they attended those schools. An argument supported by Considine and Zappala (2002)
Kwesiga (2002) and Sentamu (2003).
25
The researcher also identified some extraneous variables, which may affect academic
performance, these include, the university management, facilities and the quality of
lectures among many. These variables are part of the input and process explained in
the Ludwig’s Input-Output model. They play a role in bringing out the output, which
is academic performance. If these variables are not controlled, they may interfere with
the results of the study. The researcher controlled the effect of the extraneous
variables by randomly selecting students because randomization according to Amin
(2005) is one of the ways to attempt to control many extraneous variables at the same
time. The researcher randomly selected the subjects as seen in section 3.4 of chapter
three.

26
2.3 Related literature
This section is divided into three subsections. The first section reviews related
literature on the concept of admission points as related to academic performance,
followed by the subsection which reviews literature on the concept of parents’ social
economic status and its relationship to academic performance. The final subsection
reviews literature on the concept of students’ former school background and academic
performance.
2.3.1 Admission points and academic performance
Accepted wisdom suggests that applicants with higher results in their entry
qualifications should perform better at degree level. One wonders if this wisdom is
scientifically proven. The last decade has seen an increase in literature relating to
predictors of academic performance with much debate on whether conventional
measures of academic achievement are the best determinants of future performance at
university. In Uganda today, the main admission criteria to universities is prior
performance either at A’ level, at Diploma or at Mature age examinations
(Universities and Tertiary Institutions Act, 2001). This, according to the literature
reviewed is being practiced worldwide, admission boards else where in the world use
prior academic performance to select students for admission. For example in the
United States, Minnesota measures (2007), in the United Kingdom, Waller and Foy
(1987), in South Africa, Swart (1999) and in Kuwait, Mohammad and Almaheed
(1988) among many. Several countries use these standards of admission because
according to Staffolani and Bratti, (2002), measures of prior educational performance
are the most important determinants of student performance an argument supported
by The Universities Admission Centre (2006) report in which it is stated that tertiary

27
institutions in Austria have found that a selection rank based on a student’s overall
academic achievement is the best single predictor of tertiary success for most tertiary
courses.
In their study on validity of high school grades in predicting student success beyond
the freshman year Geiser and Santelices (2007), found that high school grade point
average is consistently the best predictor of college grades. They cite Geiser and
Studley (2003) who sampled 80,000 students admitted to the University of California
and tracked 4 year college outcomes including cumulative grade point average and
graduation in order to examine the relative contribution of high school record in
predicting longer term college performance, and their key findings were that high
school grades were the strongest in predicting four year college outcomes for all
academic disciplines. A view similar to that of Geiser and Santelics (2007) was held
by Anderson, Benjamin and Fuss (1994) who carried out a study on the determinants
of success in university and found out that students who performed well in high
school also performed better in college. Geiser and Santelics (2007) and Anderson,
Benjamin and Fuss (1994) all from the United States found evidence to suggest that
high school grades were without doubt the best predictors of academic performance.
However these studies were based on a sample of students whose system of education
has four years of secondary school (O’level), which is totally different from Uganda’s
system, which has six years of secondary level, and this may not be applicable to
Uganda. In addition, Waller and Foy (1987) showed in their study that O’levels were
an inferior predictor of success at University. The researcher found it useful to
compare the results with countries that have the same system of education as that of

28
Uganda for the results of such studies provide a more uniform and valid yardstick of
assessing and comparing student ability and achievement. For example a study on the
British school system which is almost similar to the Uganda system of education,
Waller and Foy (1987) carried out an investigative study of British school
examinations as a predictor of university performance in pharmacy, they used the
Pearson product moment correlation using the SPSS to analyze their data and in their
conclusion stated that pre-university performance is significantly correlated with
undergraduate performance.
Findings similar to those made by Waller and Foy (1987) were confirmed by
Mohammad and Almaheed (1988) whose study on evaluation of traditional
admissions standards in predicting Kuwait students’ academic performance revealed
that secondary school scores proved to be instrumental in predicting university
performance. The period in which the studies of Mohammad and Almaheed (1988)
and Waller and Foy (1988) were done in the early 1980’s therefore most of the
literature they cited was for the 1960s and 70s which is now obsolete, however the
researcher found their research methodology quite relevant and their use of the
statistical package of social science research.
However Huw, Reddy and Talcott (2006) disagree with the view that academic
performance is determined by prior academic performance. In their study on the
relationship between previous academic performance and subsequent success at
university, found that subjects studied at A’ level and grades obtained did not predict
academic performance at university. They cite Pearson and Johnson (1994) who
demonstrated that there was an overall mark association of only 0.28 between A’ level

29
grades and degree performance. A view held by the Academic Admission Council of
Oregon State University (2003); in their study on undergraduate admissions who
found that traditional measures of academic potential such as high school Grade Point
Average (GPA) scores at best explain only 30% of the variation in first year at college
GPA. It should be noted that even if these studies do not agree with the previous
scholars who found that prior performance affects future performance, they do
acknowledge that admission points are related to academic performance at university
but to a very small extent. Thus confirming McDonald, Newton, Whetton and
Benefield (2001) and Staffolani and Bratti (2002) who demonstrated that A’ level
scores still out perform any other single measure of cognitive aptitude in predicting
success at university.
Another form of entry to university is through diploma and mature age entry,
surprisingly for a subject of such importance, few studies have been reported linking
other forms of entry to academic performance. Ringland and Pearson (2003) carried
out a study on the differences between diploma entrants and direct A’ level entrants
and how each category performed. They sampled 608 respondents of which 154 were
diploma entrants, and found that there were no significant differences between groups
in terms of academic performance and concluded that performance of one prior to
university affected performance at university. The findings of Ringland and Pearson
(2003) are supported by Wheeler (2006) whose results in the study on success of non-
traditional students in an undergraduate program showed that there was no difference
in performance of non-traditional entrants and traditional entrants as long as both
categories had performed well at their previous qualifications.

30
Mpofu (1997) investigated academic performance on mature students in higher
education and argued that mature age is a second chance scheme for those who could
not obtain the necessary formal qualification for university, however before these
people are finally admitted to university, they must have proven record of capability
for this level of study as demonstrated by their level of performance in a set
examination by the university. Mpofu (1997) concluded that these students perform as
well as the regular students admitted under the direct entry scheme. A view similar to
that of Mpofu (1997) was held by Parameswaran (1991) whose study compared
academic success of mature students and traditional students and Richardson (1994)
who investigated academic performance of mature age students in higher education
and concluded that mature students perform as successfully as direct entry students.
However Parameswaran (1991) attributed this performance not just to grade but also
to age, saying that mature age students are older than direct entry student. The
scholars cited have proven in their studies that prior academic performance, which, in
this study is measured by admission points, is related to academic performance in the
university. Even the scholars who did not agree with that belief admitted that prior
performance is related to future performance but to a small extent. These studies have
led the researcher to hypothesize that there is a relationship between admission points
and academic performance of undergraduate students.
2.3.2 Social economic status and academic performance
Social economic status is most commonly determined by combining parents’
educational level, occupational status and income level (Jeynes, 2002; McMillan &
Western, 2000). In most of the studies done on academic performance of students, it
is not surprising that social economic status is one of the major factors studied while

31
predicting academic performance. Hansen and Mastekaasa (2003), argue that
according to the cultural capital theory one could expect students from families who
are closest to the academic culture to have greatest success. It is believed that low
social economic status negatively affects academic achievement because low social
economic status prevents access to vital resources and creates additional stress at
home. (Eamon 2005; Jeynes, 2002). Graetz (1995) carried out a study on social
economic status in education research and policy found that social economic
background remains one of the major sources of educational inequality and adds that
one’s educational success depends very strongly on the social economic status of
one’s parents. Considine and Zappala (2002) agree with Graetz (1995), in their study
on the influence of social and economic disadvantage in the academic performance of
school students in Australia found that families where the parents are advantaged
socially, educationally and economically foster a higher level of achievement in their
children. They also found that these parents provide higher levels of psychological
support for their children through environments that encourage the development of
skills necessary for success at school.
On the contrary Pedrosa R.H, Norberto W.D, Rafael P.M,Cibele Y.A and Benilton
S.C (2006) in their study on educational and social economic background of
undergraduates and academic performance at a Brazilian university, found that
students coming from disadvantaged socioeconomic and educational homes perform
relatively better than those coming from higher socioeconomic and educational strata.
They called this phenomenal educational resilience. This could be true considering
that different countries have different parameters of categorizing social economic
status. What a developed country categorizes as low social economic status may be
32
different from the definition of low social economic status of a developing country.
Additionally students do not form a homogenous group and one measure of social
economic disadvantage may not suit all sub groups equally.
Combs (1985) argued that in virtually all nations, children of parents high on the
educational, occupation and social scale have far better chance of getting into good
secondary schools and from there into the best colleges and universities than equally
bright children of ordinary workers or farmers. Combs (1985) adds that the findings
of many empirical studies suggest that children whose parents are at the bottom of the
social economic hierarchy are not as inclined to seek or gain access to available
educational facilities as the children with families are located at the middle or top of
the hierarchy. Dills (2006) had a similar view with Combs (1985) when she found that
students from the bottom quartile consistently perform below students from the top
quartile of socioeconomic status. Another similar view was held by Hansen and
Mastekaasa (2006), when they studied the impact of class origin on grades among all
first year students and higher level graduates in Norwegian universities. Their analysis
showed that students originating in classes that score high with respect to cultural
capital tend to receive the highest grades.
McMillan and Westor (2002) argued that social economic status is comprised of three
major dimensions: education, occupation and income and therefore in developing
indicators appropriate for high education context, researchers should study each
dimension of social economic status separately. They add that education, occupation
and income are moderately correlated therefore it is inappropriate to treat them
interchangeably in the higher education context. An argument similar to Considine

33
and Zappala (2002) who argued that the social and the economic components of the
socio-economic status equation may have distinct and separate influences on
educational outcomes. The researcher therefore reviewed literature on each of the
components of social economic status in relation to academic performance.
Family income, according to Escarce (2003) has a profound influence on the
educational opportunities available to adolescents and on their chances of educational
success. Escarce (2003) adds that due to residential stratification and segregation,
low-income students usually attend schools with lower funding levels, have reduced
achievement motivation and much higher risk of educational failure. When compared
with their more affluent counterparts, low-income adolescents receive lower grades,
earn lower scores on standardized test and are much more likely to drop out of school.
Escarce (2003) is in agreement with Combs (1985) and Sentamu (2003) who argued
that social class determines what school a child will attend and whether the child will
pass the examinations. Considine & Zappala (2002) found that children from families
with low income are more likely to exhibit the following patterns in terms of
educational outcomes; have lower levels of literacy, innumeracy and comprehension,
lower retention rates, exhibit higher levels of problematic school behavior, are more
likely to have difficulties with their studies and display negative attitudes to school.
King & Bellow (1989) used parents’ occupation as a proxy for income to examine the
relationship between income and achievement and found that children of farmers had
fewer years of schooling than children of parents with white-collar jobs. They also
determined that the schooling levels of both parents had a positive and statistically
significant effect on the educational attainment of Peruvian children. They argue that

34
how much education a child’s parents have is probably the most important factor in
determining the child’s educational opportunities. They observe that the higher the
attainment for parents, then the greater their aspirations for children.
Owens (1999) in her study exploring beliefs about academic achievement studied the
relationship between parent and guardian educational attainment to academic
achievement and concluded that the educational attainment of parent or guardian does
have a relationship with academic achievement of their children, she argued that the
higher the parent or guardian’s educational achievement, the higher the academic
achievement similar to what King & Bellow (1989) had said. Sentamu (2003) argued
that rural families and urban families where both parents were illiterate or had
inadequate education do not seem to consider home study for their children a priority
and that illiterate families will not foster a study culture in their children since the
parents themselves did not attend school or the education they received was
inadequate to create this awareness in them. These differences in home literacy
activities are likely to be reflected in school achievement.
According to the literature cited it can be seen that social economic status is related to
academic performance, whether one studies social economic status as a whole or with
distinct dimensions, there is considerable support to hypothesize that parents’ social
economic status affects academic performance of students. (Jeynes 2002; Eamon
2005; Greatz 1995; Considine & Zappala 2002; Hansen & Mastekaasa 2003) Students
who come from low social economic backgrounds earn lower examination scores
compared to their counter parts from high social economic backgrounds (Eamon
2005).

35
2.3.3 Former school background and academic performance
Students’ educational outcome and academic success is greatly influenced by the
type of school which they attend. The school one attends is the institutional
environment that sets the parameters of a students’ learning experience. Depending on
the environment, a school can either open or close the doors that lead to academic
achievement. According to Considine and Zappala (2002) the type of school a child
attends influences educational outcomes. Considine and Zappala (2002) cite Sparkles
(1999) whose study in Britain shows that schools have an independent effect on
student attainment and that school effect is likely to operate through variation in
quality and attitudes, so teachers in disadvantaged schools often hold low expectations
of their students which compound the low expectations the students have, hence
leading to poor performance by the students. Kwesiga (2002) agrees that school has
an effect on the academic performance of students but argued that school facilities
determine the quality of the school, which in turn influences the achievements, and
attainment of its pupils. Sentamu (2003) argues that schools influence learning in the
way content is organized and in the teaching, learning and assessment procedures. All
these scholars agree in principle that schools do affect academic performance of
students.
Felder, Mohr, Dietz and Ward (1994) carried out a study on the differences between
students from 55 rural students and 65 urban students, in their study, differences in
academic performance were observed with the urban students doing better on almost
every measure investigated. The urban students outperformed rural students and they
continued to perform better in chemical engineering courses in subsequent semesters.
They concluded that urban students enjoy greater success than rural students. They
36
also found that in every measure of scholastic aptitude examined, urban students
surpassed rural students. The conclusion of Felder, Mohr, Dietz and Ward (1994), is
confirmed by Tremblay, Ross and Berthelot (2001) in their study on factors affecting
grade three student performances in Ontario. They found that students’ performance
was higher in urban schools than in rural schools.
A similar view is held by Kolcic (2006) in his study on academic performance and
scientific involvement of final year medical students coming from urban and rural
backgrounds. Kolcic (2006) concludes that students from urban backgrounds had
significantly better academic and research indicators than those from rural and remote
backgrounds. He added that more than half the students from rural backgrounds fail at
least one year of study. Cheers, (1990) as cited in Considine and Zappala (2002)
argued that students from non-metropolitan areas are more likely to have lower
educational outcomes in terms of academic performance and retention rates than
students from metropolitan areas and adds that inequity exits with regard to the
quality of the education rural students receive often as a result of costs, restricted and
limited subject choice; low levels of family income support and educational facilities
within their school. The results of Lee and McIntire (2001) are contrary to Kolcic
(2006) and Considine and Zappala (2002). The former argue that there is no
significant difference between the performance of students from rural schools and
from urban schools. In their study on interstate variations in rural student achievement
and schooling conditions, they observed that given that many rural students are poor
and attend schools where instructional resources and course offerings are limited, the
level of their academic performance relative to their non-rural counterparts is

37
encouraging. They found that in some states rural students scored higher than their
non-rural counterparts.
Some researchers have held the view that school ownership and funding does indeed
have an effect on performance of the student. Crosne, Johnson and Elder (2004) found
that school ownership (that is schools owned by private individuals and those owned
by the government) is an important structural component of the school. Private
schools, they argue, tend to have both better funding and small sizes than public
schools. They found that additional funding of private schools leads to better
academic performance and more access to resources such as computers, which have
been shown to enhance academic achievement. Sampson (2004) also noted that
private schools have alternate sources of funding, higher level of discipline, and are
very selective and this is why they tend to have higher academic performance than
students from public schools. Considine and Zappala (2002) concluded in their study
on school background that students from independent private schools were more
likely to achieve higher end of school scores. Crosne, Johnson and Elder (2004),
Sampson (2004) and Considine and Zappala (2002) share a similar view and that is;
private schools are more likely to have a greater number of students from high SES
families, select students with stronger abilities and have greater financial resources. In
their conclusions, they maintained that the type of school affects the academic
performance of students. Their views are summarized by Miller and Birch (2007), in
their study on the influence of high school attended on university performance who
argued that outcome at university differs according to the type of high school
attended. The studies cited led the researcher to hypothesize that the student’s school
background is positively related to academic performance of undergraduate students.

38
Conclusion
In conclusion therefore, the review of literature has provided a backing for the
research hypothesis made in chapter 1 sec 1.6. That there is a relationship between
admission points and academic performance of undergraduate students, that parents’
social economic status is related to academic performance and that school background
is related to academic performance of the student. The researcher would therefore like
to go ahead and statistically prove the relationship between these three variables,
admission points, parents’ social economic status and school background and
academic performance with reference to Uganda Christian University.
39
CHAPTER THREE
METHODOLOGY
3.0 Introduction
This Chapter outlines the manner in which the study was conducted. The key
components are the research design, population, sample size and sampling technique,
research instruments, validity and reliability, procedure and data analysis.
3.1 Research design
The study was conducted using the correlation research design because the study was
intended to investigate the relationship between admission points, parents’ social
economic status, school background and academic performance. According to
Fraenkel and Wallen (1996), correlation research describes an existing relationship
between variables. The study took the quantitative approach because it was based on
variables measured with numbers and analyzed with statistical procedures.
3.2 Population
The UCU Enrolment Analysis report 2006/2007 showed the number of undergraduate
students at 5306 (Appendix C). Therefore the target population consisted of 5306
students of UCU. The respondents in this study were under graduate students because
the study was about academic performance of undergraduate students of UCU.
3.3 Sample size and Sampling technique
The sample consisted of 357 undergraduate students selected from 5306 students of
UCU. The 357 respondents were selected from the faculties of Business &
Administration, Education and Arts, Social Sciences, Science and Technology, Law

40
and Theology. However only 340 questionnaires were correctly filled and returned.
The number of 357 respondents was chosen basing on the sampling table guide for
sample size decisions provided by Krejcie and Morgan (1970) to estimate the sample
size. This study employed simple random sampling and purposive sampling
techniques. Simple random sampling was used in order to avoid bias and to ensure
that each undergraduate student had an equal chance of being selected. According to
Amin (2005) randomization is effective in creating equivalent representative groups
that are essentially the same on all relevant variables thought of by the researcher.
Purposive sampling was used in selecting respondents because the researcher wanted
to study the performance of only undergraduate students.
3.4 Research instruments
All the respondents filled in questionnaires. The researcher used the questionnaires
because the population was literate and large and time for collecting data was limited.
The researcher developed closed- ended questions because they are easy to fill, save
time and keep the respondents focused on the subject. The questionnaire was divided
into sections delineating personal information, questions about the independent
variable and the dependant variable. Questionnaires were used because they are the
main method of data collection (Sarantakos, 1997).
3.5 Validity of Research instruments
Validity of the questionnaire was obtained by presenting it to at least two professional
people, including the researcher’s supervisor because according to Amin (2005)
content and construct validity is determined by expert judgment. The validity of the
questionnaire was calculated by using the Content Validity Index formulae and it gave
41
a figure of 0.7. Kathuri and Palls (1993) argue that instruments with validity confident
of at least 0.7 are accepted as valid in research.
3.6 Reliability of Research Instruments
Reliability of the instruments was obtained by using the test- retest reliability.
Fraenkel and Wallen (1996) argue that for most educational research, stability of
scores over a period of two months is usually viewed as sufficient evidence of test-
retest reliability. Therefore the researcher pre-tested and retested the instruments on a
small number of undergraduate students in an interval of two months. The researcher
computed the reliability for multi-item opinion questions using SPSS computer soft
ware. The items were tested using Cronbach Alpha and it gave a reliability figure of
0.79 (Appendix B), which is above the recommended reliability of 0.7 (Kaplan and
Saccuz, 1993)
3.7 Procedure
The researcher obtained a letter of introduction from the Dean, School of Education,
Makerere University, to conduct research at UCU. A letter of permission to carry out
the research was obtained from the deputy vice chancellor (academic affairs) at UCU
in order for the researcher to carry out the study. The researcher obtained documents
such as students’ lists and numbers and records on admission and academic
performance from the central academic office. The researcher administered the
questionnaires with the help of a research assistant to 357 respondents. This data was
collected in the year 2008 using questionnaires, and documentary analysis.

42
3.8 Data Analysis
Data from questionnaires was compiled, sorted, edited, classified and coded into a
coding sheet and analyzed using a computerized data analysis package known as
Statistical Package for Social Science 13.0. The Pearson product-moment correlation
coefficient (r) was used to compute the relationship between admission points,
parents’ social economic status, school background and academic performance. The
researcher also used the t-Test to find out how academic performance varied with
gender.
3.9 Ethical Consideration
Students’ admission points and academic performance are property of the university.
The researcher therefore sought permission from the deputy vice chancellor of
academic affairs to conduct the research. (See section 3.8). The researcher also
assured respondents that the study was strictly academic and that utmost
confidentiality would be observed (see Appendix A). The data used in this study was
anonymously coded and cannot therefore be traced back to individual students.

43
CHAPTER FOUR
PRESENTATION, ANALYSIS AND INTERPRETATION OF DATA
4.0 Introduction
This chapter contains the description of the respondents’ background, the dependent
variable and the verification of hypotheses.
4.1 Background of the respondents
This Section shows the background of the respondents, according to gender, age,
faculty of study and year of study as per section A of the questionnaire (Appendix A)
4.1.1 Respondents by gender
Table 2 shows the distribution of respondents by gender:
Table 2 Respondents by gender
Gender Frequency Percent
Male 182 53.5
Female 158 46.5
Total 340 100.0
Table 2 illustrates that out of the total of 340 respondents, the male students had the
highest representation of about 54% and the female respondents had less than 47%.
This was because the male respondents were more cooperative then their female
counterparts.
44
4.1.2 Respondents by Age
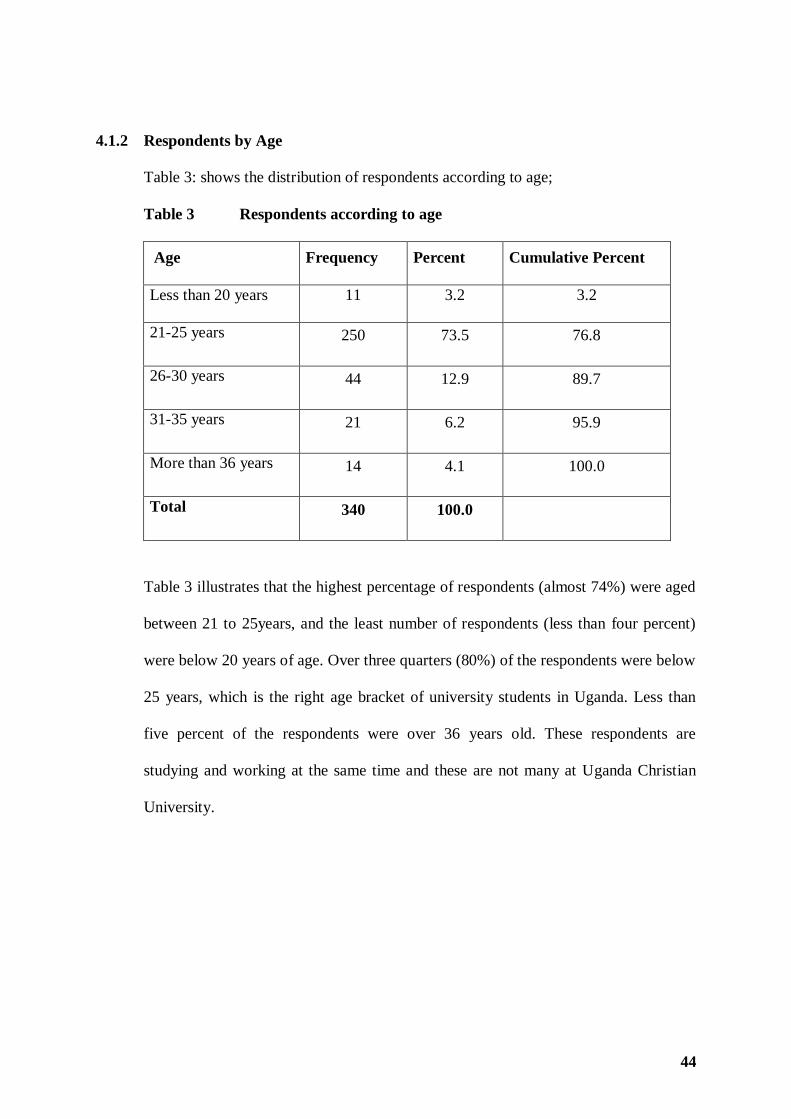
Table 3: shows the distribution of respondents according to age;
Table 3 Respondents according to age
Age Frequency Percent Cumulative Percent
Less than 20 years 11 3.2 3.2
21-25 years 250 73.5 76.8
26-30 years 44 12.9 89.7
31-35 years 21 6.2 95.9
More than 36 years 14 4.1 100.0
Total 340 100.0
Table 3 illustrates that the highest percentage of respondents (almost 74%) were aged
between 21 to 25years, and the least number of respondents (less than four percent)
were below 20 years of age. Over three quarters (80%) of the respondents were below
25 years, which is the right age bracket of university students in Uganda. Less than
five percent of the respondents were over 36 years old. These respondents are
studying and working at the same time and these are not many at Uganda Christian
University.

45
4.1.3 Respondents by Faculty
Table 4: shows respondents according to faculty of study;
Table 4 Respondents according to faculty of study
Faculty Frequency Percent
Business & Administration 90 26.5
Education & Arts 30 8.8
Law 76 22.4
Science & Technology 16 4.7
Social Sciences 84 24.7
Theology 44 12.9
Total 340 100.0
Table 4 illustrates that the highest percentage of respondents came from the Faculty of
Business and Administration (almost 27%) followed by Social Sciences with a
percentage of about 25% and the least number of respondents (less than five percent)
were from the Faculty of Science and Technology. This is because the Faculties of
Business and Administration and Social Sciences have the largest numbers of students
enrolled in the university and the Faculties of Science and Technology and Theology
have low numbers (Appendix C).

46
4.1.4 Respondents according to year of study
Table 5: shows respondents according to the year of study;
Table 5 Respondents according to year of study
Year Frequency Percent Cumulative Percent
1 99 29.1 29.1
2 84 24.7 53.8
3 134 39.4 93.2
4 23 6.8 100.0
Total 340 100.0
Table 5 illustrates that the highest percentage of respondents were third year students
(over 39%) and the least number of respondents were the fourth year students who
were almost 7% of the respondents. This is because UCU has only one program
which takes four years and that is the bachelor of laws the rest go up to three years.
That is why over 93% of the respondents are third year and below.
4.2 Description of the dependent variable (DV)
This Section describes the dependent variable (Academic performance). In this study,
academic performance was conceptualized to mean, grades obtained in tests, in course
work and in examination (Cambridge University Reporter, 2003). The dependent
variable was addressed in Section E of the questionnaire using five questions
(Appendix A) of likert scale ranging from one used to represent poor performance to
three used to represent good performance. The respondents were meant to rate
themselves according academic performance. Table 6 shows descriptive statistics

47
showing the frequency, mean and standard deviation for the respective questions in
the dependent variable in Section E of the questionnaire in decreasing order;
Table 6 Level of academic performance as perceived by the students
Academic Performance Frequency Mean
Std.
Deviation
Academic performance in take-home course
work
340 2.40 .569
Academic performance in optional courses 340 2.35 .573
Academic performance in core/compulsory
courses
340 2.32 .548
Academic performance in previous semester
examination
340 2.26 .548
Academic performance in Mid-term tests 340 2.21 .530
Total 340
Table 6 illustrates that students perform highest in take-home course work and lowest
in mid-term tests. On the whole, considering the means reflected, the students rated
themselves as performing fairly well.
Since personal variables are said to have an effect on academic performance, the
researcher considered it important to relate background variables to the dependent
variable academic performance. For purposes of testing whether background of
respondents affected academic performance, all items in Section E of the
questionnaire (Appendix A) for the dependent variable (academic performance) were
48
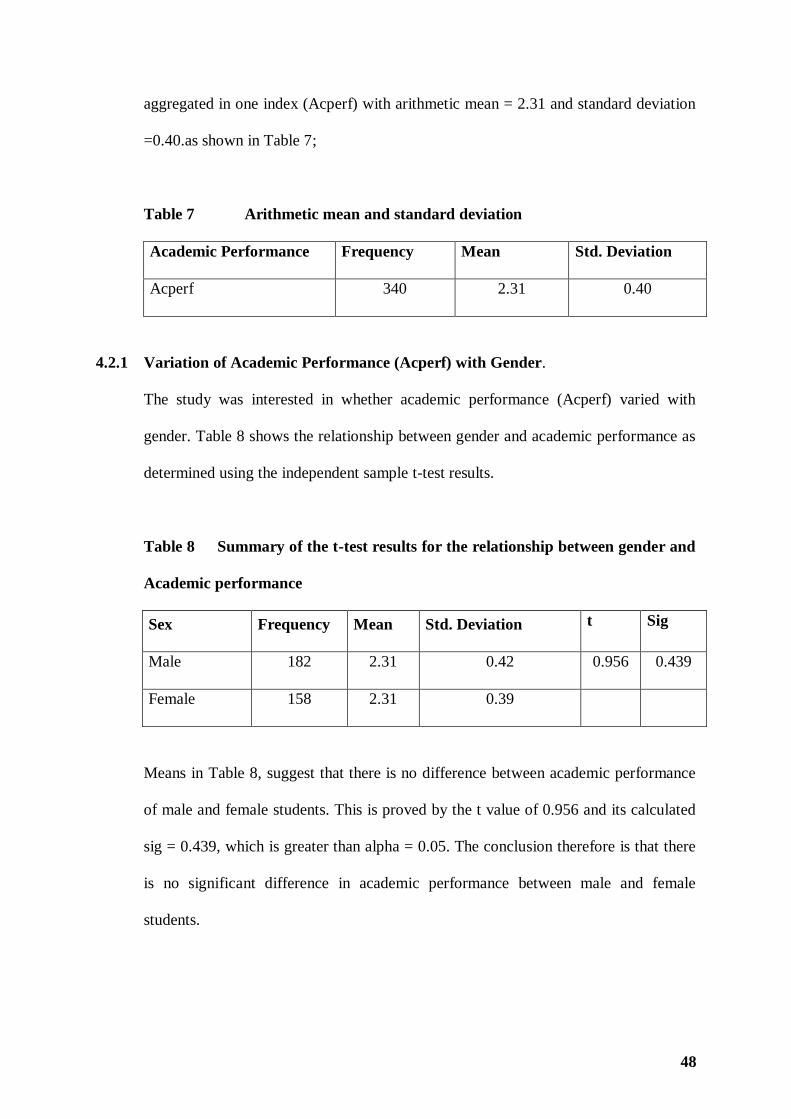
aggregated in one index (Acperf) with arithmetic mean = 2.31 and standard deviation
=0.40.as shown in Table 7;
Table 7 Arithmetic mean and standard deviation
Academic Performance Frequency Mean Std. Deviation
Acperf 340 2.31 0.40
4.2.1 Variation of Academic Performance (Acperf) with Gender.
The study was interested in whether academic performance (Acperf) varied with
gender. Table 8 shows the relationship between gender and academic performance as
determined using the independent sample t-test results.
Table 8 Summary of the t-test results for the relationship between gender and
Academic performance
Sex Frequency Mean Std. Deviation t Sig
Male 182 2.31 0.42 0.956 0.439
Female 158 2.31 0.39
Means in Table 8, suggest that there is no difference between academic performance
of male and female students. This is proved by the t value of 0.956 and its calculated
sig = 0.439, which is greater than alpha = 0.05. The conclusion therefore is that there
is no significant difference in academic performance between male and female
students.

49
4.2.2 Variation with Age
The relationship between age and academic performance (Acperf) was determined
using ANOVA. Table 9 shows a summary of the relationship between age and
academic performance using ANOVA.
Table 9 Summary of the descriptive statistics and ANOVA results for the
relationship between age and academic performance (Acperf)
Age Frequency Mean Std. Deviation F Sig
Less than 20 years 11 2.15 0.49 1.89 0.111
21-25 years 250 2.34 0.37
26-30 years 44 2.23 0.42
31-35 years 21 2.24 0.56
More than 36 years 14 2.17 0.476
Overall 340 2.31 0.40
Means in Table 9, suggest that different age groups scored slightly differently on
academic performance with age 21 – 25 years scoring highest and less than 20 years
scoring lowest. To confirm whether the differences were significant we consider the F
value 1.89, whose significance value of 0.111 is greater than alpha = 0.05. The
conclusion therefore is that there is no significant relationship between age and
academic performance.

50
4.2.3 Variation with Faculty of study
The study was interested in whether academic performance (Acperf) varied with
faculty of study. Table 10 shows a summary of the descriptive statistics and ANOVA
results on how Academic performance varied with Faculty;
Table 10 Summary of the descriptive statistics and ANOVA results for the
relationship between faculty of study and academic performance
(Acperf)
Faculty of Study Frequency Mean
Std.
Deviation
F Sig
Business & Administration 90 2.50 0.41 7.700 0.000
Education & Arts 30 2.34 0.31
Law 76 2.31 0.36
Science & Technology 16 2.20 0.37
Social Sciences 84 2.19 0.30
Theology 44 2.16 0.54
Overall 340 2.31 0.40
Means in Table 10, suggest that different faculties scored differently on academic
performance with the Faculty of Business and Administration scoring highest and the
School of Theology scoring lowest. To confirm whether the differences were
significant we consider the F value 7.700, whose significance value of 0.000 is less
than alpha = 0.05. The conclusion therefore is that there is a significant relationship
between faculty of study and academic performance.
51
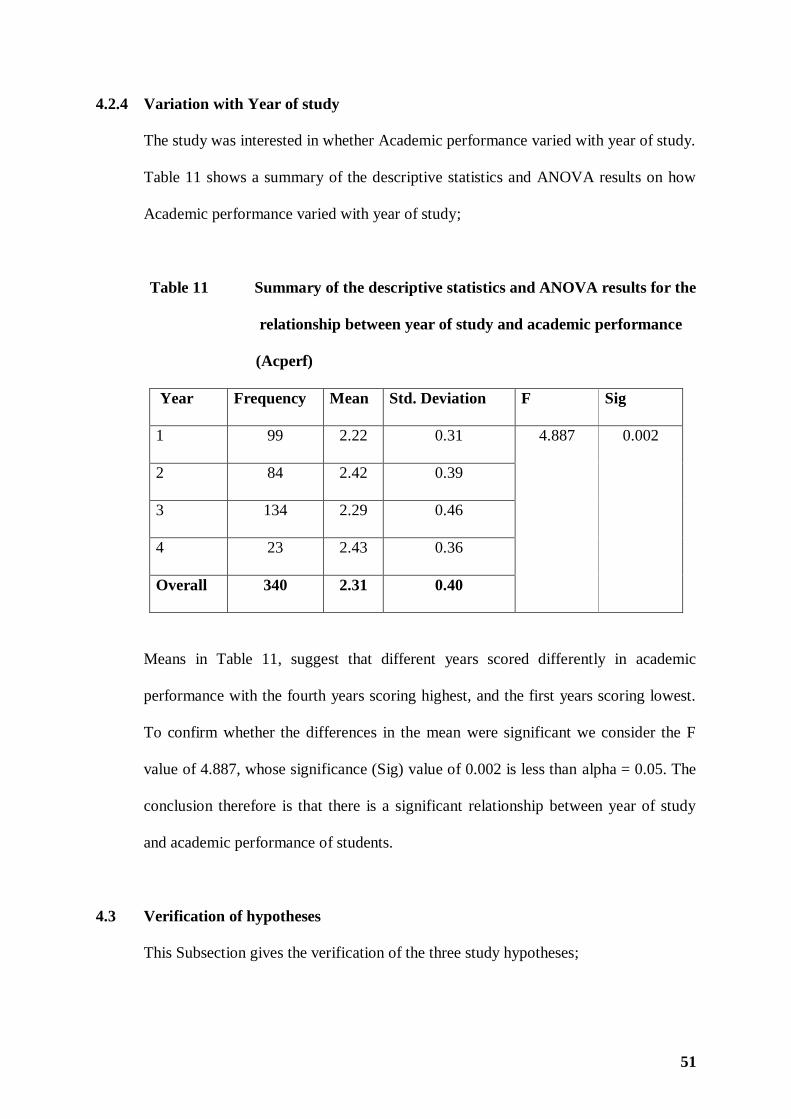
4.2.4 Variation with Year of study
The study was interested in whether Academic performance varied with year of study.
Table 11 shows a summary of the descriptive statistics and ANOVA results on how
Academic performance varied with year of study;
Table 11 Summary of the descriptive statistics and ANOVA results for the
relationship between year of study and academic performance
(Acperf)
Year Frequency Mean Std. Deviation F Sig
1 99 2.22 0.31 4.887 0.002
2 84 2.42 0.39
3 134 2.29 0.46
4 23 2.43 0.36
Overall 340 2.31 0.40
Means in Table 11, suggest that different years scored differently in academic
performance with the fourth years scoring highest, and the first years scoring lowest.
To confirm whether the differences in the mean were significant we consider the F
value of 4.887, whose significance (Sig) value of 0.002 is less than alpha = 0.05. The
conclusion therefore is that there is a significant relationship between year of study
and academic performance of students.
4.3 Verification of hypotheses
This Subsection gives the verification of the three study hypotheses;

52
4.3.1 Hypothesis One: Admission points and academic performance
The hypothesis was stated; “There is a positive relationship between admission points
and academic performance of undergraduate students.” To test this hypothesis, the
researcher asked respondents to rate their level of passing with reference to their
admission points conceptualized as direct entry, diploma entry, mature age entry and
entry through other examinations sat by international students. The rating was
according to likert scale with one representing poor performance, two representing
fair performance and three representing good performance. A summary of the
descriptive statistics of respondents’ rating their level of performance as per their
admission points was given in Table 12 in decreasing order of means.
Table 12 Level of academic performance at admission as perceived by
the respondents
Performance on entry Frequency Mean Std. Deviation
Performance in Other exams
(International students)
6 2.50 0.55
Performance at A’ level 276 2.38 0.54
Performance at Diploma 42 2.36 0.53
Performance at Mature Age Exams 15 2.07 0.26
The means in Table 12, suggest that the respondents who sat other examinations
(these were mainly international students from Kenya, Sudan and Tanzania) scored
highest followed by the direct entrants (A’ level). The respondents who sat the mature
age exams scored lowest. On the whole the means suggest that the respondents’
admission points were fair.

53
For purposes of testing hypothesis One, all four items were aggregated into one index
(Admpts). Unfortunately the variable Admpts had missing values because of the fact
that respondents ticked one of the four options (question 6a, 6b, 6c and 6d)(Appendix
A) hence aggregation failed. The dependent variable academic performance (Acperf)
was then related to each of the four questions (6a, 6b, 6c and 6d) separately.
Table 13 Summary of the Pearson Product Moment correlation analysis for
the relationship between A’ level admission points and academic
performance
Academic
performance
Performance at A’
level
Academic
performance
Pearson
Correlation
1 .351(**)
Sig. (2-tailed) .000
Frequency 340 276
Performance at
A’ level
Pearson
Correlation
.351(**) 1
Sig. (2-tailed) .000
Frequency 276 276
** Correlation is significant at the 0.01 level (2-tailed).
According to Table 13, the Pearson product moment correlation index obtained on the
performance in A’ level points is r = 0.351. It is positive with significance or p-value
= 0.000 which is less than alpha = 0.01 implying that A’ level admission points were
significantly related to academic performance.

54
Table 14 Summary of the Pearson Product Moment correlation analysis for
the relationship between Diploma admission points and academic
performance
Academic
performance
Performance at
Diploma
Academic
performance
Pearson Correlation
1 .463(**)
Sig. (2-tailed) .002
Frequency 340 42
Performance at
Diploma
Pearson Correlation
.463(**) 1
Sig. (2-tailed) .002
Frequency 42 42
** Correlation is significant at the 0.01 level (2-tailed).
According to Table 14, the Pearson product moment correlation index obtained on the
performance in Diploma points is r = 0.463. It is positive with significance or p-value
= 0.000 which is less than alpha = 0.01 implying that diploma admission points were
significantly related to academic performance.

55
Table 15 Summary of the Pearson Product Moment correlation analysis for
the relationship between mature age admission points and
academic performance
Academic
performance
Performance at
Mature Age Exams
Academic
performance
Pearson
Correlation
1 .180
Sig. (2-tailed) .521
Frequency 340 15
Performance at
Mature Age Exams
Pearson
Correlation
.180 1
Sig. (2-tailed) .521
Frequency 15 15
Table 15, illustrates that the Pearson product moment correlation index obtained on
the performance in Mature age exams is r = 0.180 with significance or p-value =
0.521 which is greater than alpha = 0.01 implying that mature age admission points
were not significantly related to academic performance.

56
Table 16 Summary of the Pearson Product Moment correlation analysis for
the relationship between other examinations and academic
performance
Academic
performance
Performance in
international exams
Academic
performance
Pearson
Correlation
1 -.802
Sig. (2-tailed) .055
Frequency 340 6
Performance in
other exams
Pearson
Correlation
-.802 1
Sig. (2-tailed) .055
Frequency 6 6
Table 16 illustrates that the Pearson product moment correlation index obtained on the
performance in other examinations is r = - 0.802 which is negative with significance
or p-value = 0.06 which is greater than alpha = 0.05. This implies that academic
performance is not significantly related to performance in international
examinations.
4.3.2 Hypothesis Two: Social economic status and academic performance
The hypothesis was stated; “There is a positive relationship between Social economic
status and academic performance of undergraduate students.” To test this hypothesis,
the researcher asked respondents to rate the level of their parents’ social economic
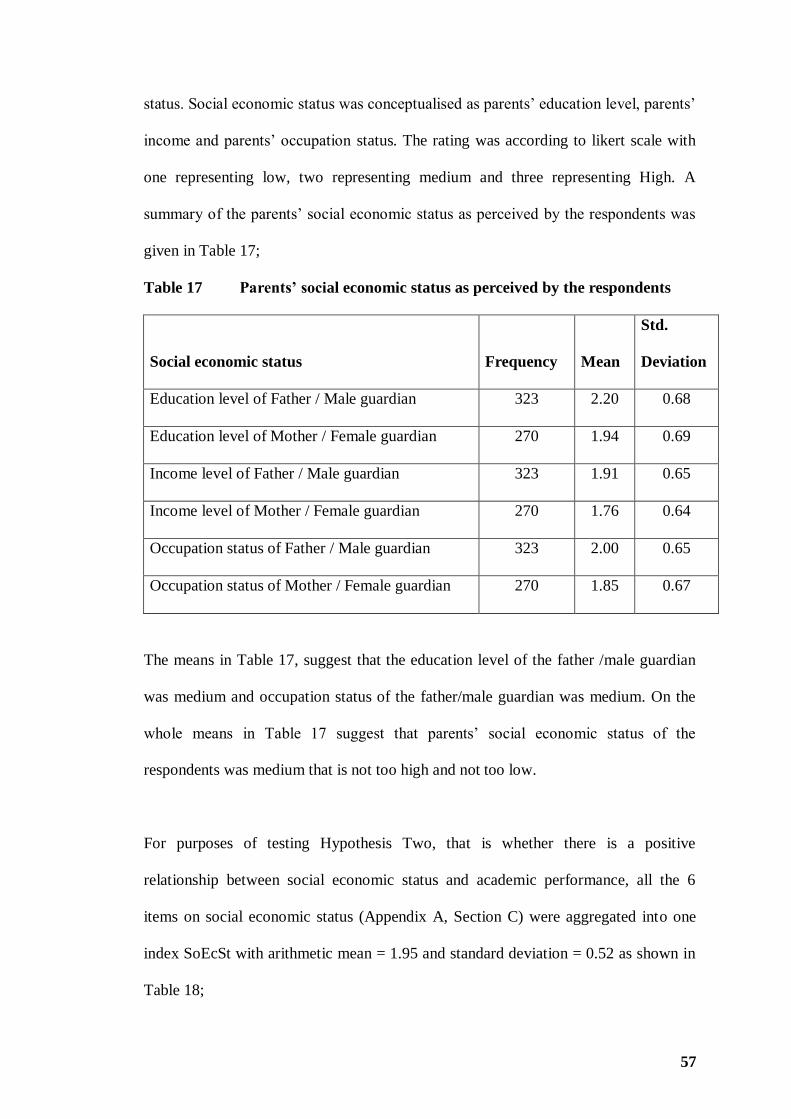
57
status. Social economic status was conceptualised as parents’ education level, parents’
income and parents’ occupation status. The rating was according to likert scale with
one representing low, two representing medium and three representing High. A
summary of the parents’ social economic status as perceived by the respondents was
given in Table 17;
Table 17 Parents’ social economic status as perceived by the respondents
Social economic status Frequency Mean
Std.
Deviation
Education level of Father / Male guardian 323 2.20 0.68
Education level of Mother / Female guardian 270 1.94 0.69
Income level of Father / Male guardian 323 1.91 0.65
Income level of Mother / Female guardian 270 1.76 0.64
Occupation status of Father / Male guardian 323 2.00 0.65
Occupation status of Mother / Female guardian 270 1.85 0.67
The means in Table 17, suggest that the education level of the father /male guardian
was medium and occupation status of the father/male guardian was medium. On the
whole means in Table 17 suggest that parents’ social economic status of the
respondents was medium that is not too high and not too low.
For purposes of testing Hypothesis Two, that is whether there is a positive
relationship between social economic status and academic performance, all the 6
items on social economic status (Appendix A, Section C) were aggregated into one
index SoEcSt with arithmetic mean = 1.95 and standard deviation = 0.52 as shown in
Table 18;

58
Table 18 Arithmetic mean and standard deviation of social economic status
(SoEcSt)
Frequency Mean Std. Deviation
253 1.95 0.52
The index for Academic performance (Acperf) was already calculated with arithmetic
mean = 2.31 and standard deviation = 0.40 in section 4.2. To correlate the two indices,
the Pearson product moment coefficient was used;
Table 19 Summary of the Pearson Product Moment correlation analysis for
the relationship between parents’ social economic status (SoEcSt)
and academic performance (Acperf)
Acperf SoEcSt
Acperf Pearson Correlation 1 .167(**)
Sig. (2-tailed) .008
N 340 253
SoEcSt Pearson Correlation .167(**) 1
Sig. (2-tailed) .008
N 253 253
** Correlation is significant at the 0.01 level (2-tailed).
Table 19, illustrates that the Pearson product moment correlation index obtained is
positive at r = 0.167. The significance or p-value = 0.008 which is less than
predetermined alpha=0.01 or even alpha = 0.05. This result indicates that there is a
significant relationship between parents’ social economic status and academic

59
performance. Thus confirming the research hypothesis that there is a positive
relationship between parents’ social economic status and academic performance of
undergraduate students.
4.3.3 Hypothesis Three: Former school background and academic performance
The hypothesis was stated; “There is a positive relationship between former school
background and academic performance of undergraduate students.” To test this
hypothesis, the researcher asked respondents to rate the level of their former schools
in terms of; urban setting, government owned, financial status of school and academic
status. The rating was according to likert scale with one representing strongly disagree
to four representing strongly agree. A summary of the descriptive statistics of former
school background as perceived by the respondents was given in Table 20 in
decreasing order of means.
Table 20 Former school background as perceived by the respondents
Former school background Frequency Mean
Std.
Deviation
Former school was of high academic status 340 3.04 0.80
Former school was of high financial standing 340 2.77 0.91
Former school located in Urban setting 340 2.71 0.96
Former school was government owned 340 2.51 1.11
According to the means in Table 20, the respondents indicated that their former
schools were of high academic status and were of high financial standing. The results
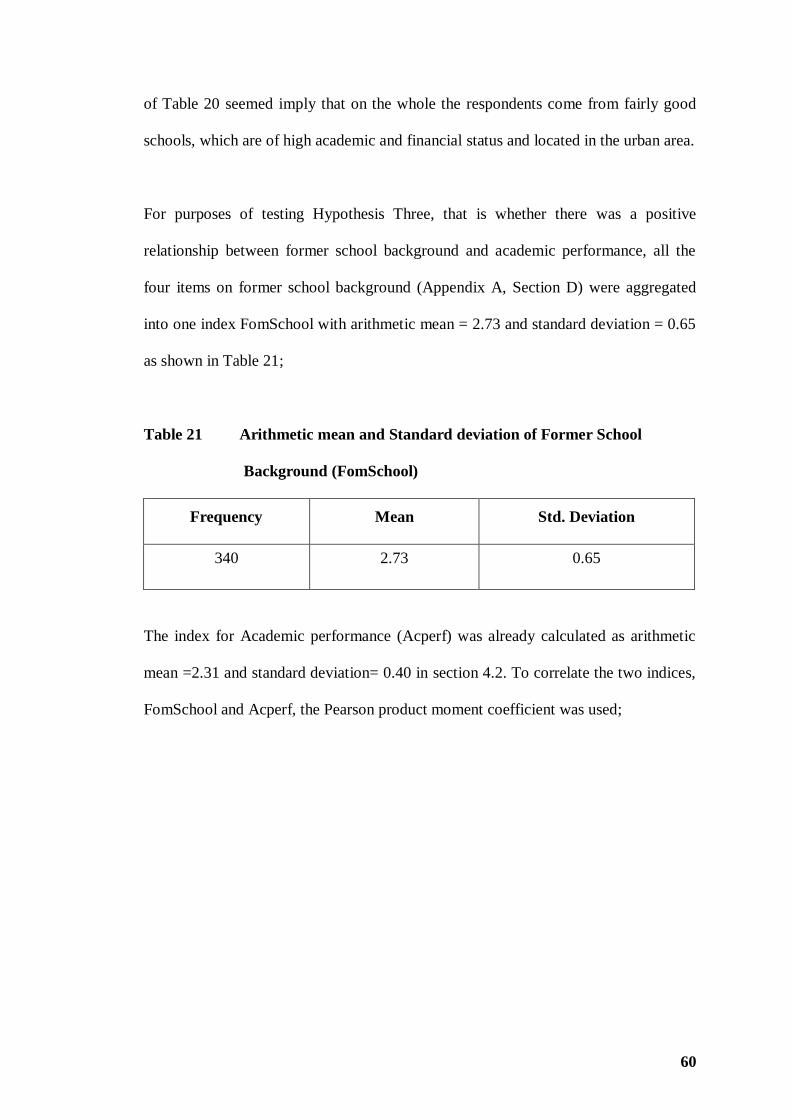
60
of Table 20 seemed imply that on the whole the respondents come from fairly good
schools, which are of high academic and financial status and located in the urban area.
For purposes of testing Hypothesis Three, that is whether there was a positive
relationship between former school background and academic performance, all the
four items on former school background (Appendix A, Section D) were aggregated
into one index FomSchool with arithmetic mean = 2.73 and standard deviation = 0.65
as shown in Table 21;
Table 21 Arithmetic mean and Standard deviation of Former School
Background (FomSchool)
Frequency Mean Std. Deviation
340 2.73 0.65
The index for Academic performance (Acperf) was already calculated as arithmetic
mean =2.31 and standard deviation= 0.40 in section 4.2. To correlate the two indices,
FomSchool and Acperf, the Pearson product moment coefficient was used;

61
Table 22 Summary of the Pearson Product Moment correlation analysis for
the relationship between former school background (FomSchool)
and academic performance (Acperf)
Acperf FomSchool
Acperf Pearson Correlation 1 .285(**)
Sig. (2-tailed) .000
N 340 340
FomSchool Pearson Correlation .285(**) 1
Sig. (2-tailed) .000
N 340 340
** Correlation was significant at the 0.01 level (2-tailed).
Table 22 illustrates that the Pearson’s Correlation r = 0.285 computed for former
school background (FomSchool) and academic performance (Acperf) was positive
with significance or p-value = 0.000 which is less than Alpha=0.01 or even
alpha=0.05. This result indicates that there is a significant relationship between
former school background and academic performance. Thus confirming the research
hypothesis that there is a positive relationship between former school background and
academic performance.
.

62
CHAPTER FIVE
DISCUSSION, CONCLUSIONS AND RECOMMENDATIONS
5.0 Introduction
This chapter discusses the findings of the study as presented in chapter four. It also
presents the conclusions arising from the study and recommendations, which could
improve academic performance in Uganda Christian University.
5.1 Discussion of findings
Objective one: Admission points and academic performance
The first hypothesis stated,” There is a positive relationship between admission points
and academic performance of undergraduate students. The researcher tried to
aggregate all four items of admission points, A’ level points, diploma points, mature
age points and other international exam points into one index so as to test the variable
admission points to academic performance but the aggregation failed. Therefore each
of the four items, A’ level points, Diploma points, Mature age points and other
international exam points were related to academic performance as shown in Tables
13,14, 15 and 16.
The Pearson Product Moment Correlation was used to determine the relationship
between A’ level points and academic performance, the Pearson product moment
correlation index r gave a significance or p-value of 0.000 which is less than alpha =
0.01 as shown in Table 13. The results revealed that A’ level points are significantly
related to academic performance of undergraduate students. The Pearson product
moment correlation index r of diploma and academic performance gave a significance
or p-value of 0.001, which is less than alpha = 0.05 as shown in Table 14, implying

63
that the diploma admission points influence academic performance. The Pearson
product moment correlation index r of mature age and academic performance gave a
significance or p-value of 0.52 which is greater than alpha 0.05 as shown in Table 15
implying that there is no relationship between mature age admission points and
academic performance of undergraduate students at UCU. The Pearson product
moment correlation index r of other international examination points and academic
performance gave a significance or p-value of 0.06 which is greater than alpha 0.05 as
shown in Table 16 implying that there is no relationship between international
examination points and academic performance of undergraduate students at UCU.
These findings revealed that both A’ level admission points and diploma admission
points are significantly related to academic performance. The findings indicate that
students with high A’ level admission points and diploma admission points perform
well at university and those with low points perform poorly. The findings of this study
are consistent with a number of scholars including; Staffolani and Bratti, (2002),
McDonald, Newton, Whetton and Benefield (2001), Mohammad and Almaheed
(1988) Waller and Foy (1987) and who all demonstrated that measures of prior
educational performance are the most important determinants of student success in
college and university. The researcher noted that the studies by Geiser and Santelics
(2007), Anderson, Benjamin and Fuss (1994) and Waller and Foy (1987) and
Mohammad and Almaheed (1988) were all correlative studies and they had similar
conclusions and so was this study.
This result may be explained by Geiser and Santelices (2007), who argued that high
school grades or admission points reflect a students’ cumulative performance over a

64
period of years and that is why they are consistently the best predictor of college
success. A result confirmed by Anderson, Benjamin and Fuss (1994) who found that
students who performed well in high school also performed better in college. Geiser
and Santelices (2007) argued that as a selection criteria, emphasis on high school
grades focuses on the mastery of specific skills and knowledge required for college-
level work. In addition, the results could also owe to the fact that, that students who
had previously performed well continue to do so because they have a strong potential
to easily catch up with university work and they are motivated to do so (Durr, 1997).
The results of this study are not in line with Huw, Reddy and Talcott (2006) who
found that grades obtained at A’ level obtained did not predict academic performance
at university and the Academic Admission Council of Oregon State University (2003)
who found that traditional measures of academic potential at best explain only 30% of
the variation in first year at college GPA. The results in this study about diploma
points being significantly related to academic performance are in line with Ringland
and Pearson (2003), Wheeler (2006) and Richardson (1994) whose study on non-
traditional entrants, (diploma holders) showed that non-traditional entrants performed
as well as traditional entrants (A’ level) as long as they had performed well at their
previous qualifications. The performance of non-traditional entrants was attributed to
age (Parameswaran, 1991) and to life experience. (Staffolani and Bratti, 2002)
According to the findings of this study, mature age points and international exam
points are not related to academic performance of undergraduate students at UCU.
The researcher is of the view that the small size of this group of mature students and
international students may prevent meaningful comparisons because out of 340
respondents only 15 were mature age and 6 were international students may have

65
been too small to attain statistical significance. However the findings about mature
age may be explained by Geizer and Santelices (2007) who argued that standardized
admission tests reflect the student’s performance in a single three hours sitting and
this makes it difficult to determine future performance after a student has been
examined only three hours. This is supported by Cushing and McGarvey (2004) and
Durr (1997) who both found that standardized entrance examination tests do not
predict performance at university. Mohammad and Almaheed (1988) explain that
international students may differ in performance from resident students because they
differ in academic behavior. The researcher is of the opinion that it could be because
the systems of education are different and that students have to adjust to a new and
different system of education. However this is a recommended area for further
research.
Objective Two: Social economic status and academic performance
The second hypothesis stated,” parents’ social economic status is positively related to
academic performance of undergraduate students at UCU. The study measured the
items of social economic status and academic performance and the Pearson product
moment correlation coefficient r gave a significance or p-value of 0.008, which is less
than alpha 0.05 as shown in Table 19. This study revealed that parents’ social
economic status is significantly related to academic performance of undergraduate
students. The findings indicate that the higher a parents’ social economic status, the
higher the academic performance of the student.
The results of this study may be explained by Considine and Zappala (2002) who
found that families where the parents are advantaged socially, educationally and

66
economically foster a higher level of achievement in their children. They also found
that these parents provide higher levels of psychological support for their children
through environments that encourage the development of skills necessary for success
at school. The results are also consistent with Hansen and Mastekaasa (2003), who
argue that according to the cultural capital theory one could expect students from
families who are closest to the academic culture to have greatest success. The results
of this study owe to the fact that, low social economic status negatively affects
academic achievement because low social economic status prevents access to vital
resources and creates additional stress at home. (Hansen and Mastekaasa, 2003). The
results are not in agreement with Pedrosa, et al (2006) who found that students
coming from disadvantaged socio-economic and educational homes perform
relatively better than those coming from higher socio-economic and educational
strata.
The findings of this study confirmed the findings of Combs (1985) who concluded
that, in virtually all nations, children of parents high on the educational, occupation
and social scale have far better chance of getting into good secondary schools and
from there into the best colleges and universities than equally bright children of
ordinary workers or farmers. Combs (1985) adds that the findings of many empirical
studies suggest that children whose parents are at the bottom of the social economic
hierarchy are not as inclined to seek or gain access to available educational facilities
as the children with families located at the middle or top of the hierarchy. In Uganda
the trend is the same, children from middle and high social economic backgrounds
join the first world schools for example, Namagunga, Gayaza, Budo and Kisubi
67
among others and are able to gain access to university and they continue to perform
well.
The researcher believes that the findings are valid because Uganda Christian
University is a private university, which requires its students to pay fees by a set date.
Students from middle or high social economic background are able to abide by this
requirement and settle down to study whereas those from poor socio-economic
backgrounds may not find the fees easily so they spend time moving up and down
raising the fees and this may affect their performance at university. More so according
to Table 17, the respondents rated the education level of their father/male guardians as
good and that the occupation status was also good, the income level column also
showed that these respondents are from fairly good social economic backgrounds.
This could be the reason why they are able to afford private higher education. Other
studies with similar findings are Dills (2006) who found that students from the bottom
quartile consistently perform below students from the top quartile of socio-economic
status and Hansen and Mastekaasa (2003), whose analysis showed that students
originating in classes that score high with respect to cultural capital tend to receive the
highest grades.
Objective Three: Former school background and academic performance
The third hypothesis was stated; “There is a positive relationship between former
school background and academic performance of undergraduate students. The study
measured the items of former school background and academic performance and the
Pearson product moment correlation coefficient index r gave a significance or p-value
= 0.000 which is less than Alpha=0.01 hence indicating a significant relationship

68
between former school background and academic performance as shown in Table 19.
This study revealed that there is a significant relationship between former school
background and academic performance. This indicates that the type of school the
student attended affects students’ academic performance at Uganda Christian
University.
The findings of this study are consonant with the results of Portes and Macleod,
(1996) cited in Considine and Zappala (2002) who found that the type of school a
child attends influences educational outcomes. Kwesiga (2002) and Sentamu (2003)
also reported that the school a child attends affects academic performance. The
results of this study confirm what was reported by Minnesota measures (2007), that
the most reliable predictor of student success in college is the academic preparation of
students in high school. This could owe to the fact that schools have an independent
effect on student attainment and that school effect is likely to operate through
variation in quality and attitudes, so teachers at disadvantaged schools often hold low
expectations of their students which compound the low expectations the students
have, hence leading to poor performance by the students. (Sparkles (1999) as cited by
Considine and Zappala 2002) .The results are also in line with Kwesiga’s (2002)
argument that school has an effect on the academic performance of students but
argued that school facilities determine the quality of the school, which in turn
influences the achievements, and attainment of its pupils. Sentamu (2003) also agrees
that the type of school one attend affects academic performance because schools
influence learning in the way content is organized and in the teaching, learning and
assessment procedures. All these scholars agree in principle that schools do affect
academic performance of students.
69
The researcher compared the different variables of former school background to
academic performance just to find out if indeed all the variables do influence
academic performance of students. The results using Pearson product moment
correlation showed that the location of the school yielded a p-value of 0.02 less than
0.05, showing a significant relationship (Appendix D), a result consistent with Felder,
Mohr, Dietz and Ward (1994) findings that urban students enjoy greater success than
rural student, a result also supported by Tremblay, Ross and Berthelot (2001), Kolcic
(2006) and Considine and Zappala (2002). On the other hand the findings of this
study disagree with Lee and McIntire (2001) and Hobbs (2001) whose findings
revealed that there is no significant difference between performance of rural students
and urban students. Ownership yielded a p-value of 0.03, financial status yielded a p-
value of 0.00 values less than alpha = 0.05 implying that they both influence academic
performance. According to the studies cited, ownership (public or private) and
financial status (funding) were lamped together. The findings of this study disagree
with Sampson (2004) and Sutton and Galloway (2000) who found that there is no
difference between the academic performance of private and public schools.
Academic status of the former school yielded a p-value of .000 less than 0.05
implying that the academic status of the former school affects the academic
performance of students. The researcher has observed that schools with renowned
academic standing in Uganda for example Budo, Gayaza, Namagunga, Kisubi, and
Nabisunsa among others foster into their students a culture of discipline and a reading
culture, so that a student with that kind of school background is able to perform well
at university.

70
5.2 Conclusions
The following conclusions drawn as a result of the research work carried out in the
area of academic performance of undergraduate students at Uganda Christian
University reflect both the theoretical and practical lessons, which can be drawn from
the study.
Objective one: Admission points and academic performance
The researcher confirmed the research hypothesis one, that there is a positive
relationship between admission points obtained at A’ level and Diploma level and
academic performance of undergraduate students and that there is no relationship
between mature age points and academic performance of undergraduate students.
Objective two: Social economic status and academic performance.
The researcher confirmed the research hypothesis two, that there is a positive
relationship between parents’ social economic status and academic performance of
undergraduate students.
Objective three: Former school background and academic performance
The researcher confirmed the research hypothesis three, that there is a positive
relationship between former school background and academic performance of
undergraduate students.

71
5.3 Recommendations
Basing on the study findings and the conclusions, the researcher derived the following
recommendations:
Objective one: Admission points and academic performance
Uganda Christian University should maintain it selection criteria of using previous
performance at A’ level and Diploma as a measure of admitting students for
undergraduate programs.
Mature age students continue to be given an entrance exam but since it is not enough
to determine the students’ academic performance, they should be given a
supplementary year or probation year to test their competency and if they excel, then
they move on to join the regular program.
Uganda Christian University should maintain the practice of giving some
international applicants admission to a pre-university year to bring them on board to
Uganda’s education system.
Objective Two: Parents’ social economic status and academic performance
The UCU admissions committee should not only focus on academic performance of
applicants but also on the parents’ social economic status. The university could also
devise means of paying special attention to students from low social economic
backgrounds. For example the university could improve the student support system
such that students from low social economic backgrounds are identified and assisted
with financial aid or even a student loan scheme could be developed.

72
Objective Three: Former school background and academic performance
Former school background is important in determining academic performance;
therefore the university should keep data of where their students come from and could
try to develop a link with the schools where their most disciplined and excelling
students come from so that more students are admitted from these schools.
5.4 Areas of Further research
This study has identified the need to investigate and analyze the mature age and
international students’ recipe for success in higher education with the intention of
developing some of these aspects for inclusion in all student selections
In order to better understand the systems’ theory input-output model, there’s need to
investigate the role management and staffing play in academic performance of
students in Higher institutions of learning.

73
REFERENCES
Acato, Y. (2006, February 21). Quality assurance vital. New vision, university guide
2006/2007.
Anderson, G, Benjamin, D, & Fuss, M. (1994). Determinants of success in university
introductory economics courses. Journal of Economic Education, (spring), 25
Admission Council of Oregon State University (2003). Undergraduate admissions
policy proposal. Retrieved November 23, 2006 from
http://eepm.orst.edu/dept/senate/committees/aac/agen/reports/20030115.html
Amin, M. E (2005). Social Science research: conception, methodology and analysis.
Kampala: Makerere University Press.
Cambridge University Reporter. (2003). Indicators of academic performance.
Retrieved on August 8, 2007 from http://www.admin.cam.ac.uk/reporter/2002-
3/weekly/5913/
Combs, H. P (1985). The world crisis in education: the view from the eighties. New
York: Oxford press
Considine, G. & Zappala, G. (2002). Influence of social land economic disadvantage
in the academic performance of school students in Australia. Journal of Sociology, 38, 129-
148. Retrieved on August 16, 2007 from http://jos.sagepub.com
Crosnoe, R., Monica, K. J and Glen, H .E .Jr. (2004). School size and the
interpersonal side of education: An example of Race/Ethnicity and organizational context.
Social Science Quarterly, 85(5)
Cushing, J. M & McGarvey, G.M. (2004). Sample selection models of academic
performance. Retrieved on December 12, 2006 from http://ei.oxfordjournals.org/
cgi/content/abstract/42/2/319 12/12/2006 .
74
Dills, K.A. (2006). Trends in the relationship between socioeconomic status and
academic achievement. Retrieved on September 30, 2008 from
http://papers.ssrn.com/sol3/papers.cfm?abstract_id=886110
Durr, J.C. (1997). Factors affecting student performance in principles of
macroeconomics. Retrieved on December 12, 2006 from http:/www.elon.edu/ipe/durr.pdf
Eamon, M.K (2005). Social demographic, school, neighborhood, and parenting
influences on academic achievement of Latino young adolescents. Journal of Youth and
Adolescence, 34(2), 163-175.
Escarce, J. J (2003). Socioeconomic status and the fates of adolescents. Retrieved on
September 27 2007 from http://www.pubmedcentral.nih.gov/articlerender.fcgi?artid
Felder, M. R, Mohr, H. P, Dietz, J.E and Ward, B.L. (1994). A longitudinal study of
engineering student performance and retention: Differences between students from rural and
urban backgrounds. Journal of Engineering Education, 83(3) 209-217.
Fraenkel, J.R & Wallen, N.E (1988). How to design and evaluate research in
education. McGraw-Hill, INC. New York.
Geiser, S and Santelices, V. M. (2007). Validity of high school grades in predicting
student success beyond the freshman year. Retrieved on February 8, 2008 from
http://cshe.berkeley.edu/publications/docs/ROPS.GEISER_SAT_6.12.07.pdf
Graetz, B. (1995). Socioeconomic Status in Education Research and Policy. In
Ainley, J, Graetz, B., Long, M. and Batten, M. (Eds). Social economic Status and School
Education. Canberra: DEET/ACER.
Hobbs, H. (2001). Urban vs. Rural schools. What test data really tells us? Valley
Press Media NY. Retrieved on August 16, 2007 from
http://www.bulldognews.net/urban_v_rural.html

75
Hansen, N.M and Mastekaasa, A. (2006). Social origins and academic performance at
university. Oxford University press. Retrieved on September 30, 2008 from
http://esr.oxfordjournals.org/cgi/content/abstract/22/3/277
Hoyle, E. (1986). Policies of School Management, Suffolk. The press ltd.
Huws, N, Reddy, P and Talcott, J. (2006). Predicting university success in
psychology: Are subject-specific skills important? Retrieved on July 4, 2008 from
http://www.aston.ac.uk/downloads/ihs/peelea/huw2006p.pdf
Jeynes, William H. (2002). Examining the effects of parental absence on the academic
achievement of adolescents: the challenge of controlling for family income. Journal of family
and Economic Issues 23(2)
Kathuri, N. J, and Palls, A. D. (1993). Introduction to educational research. Egerton
University Education Book series.
Kaplan, R. M and Saccuzz, D.P. (1993) Building a test, psychological testing:
principle, applications and issues. California: Brooks/Cole
King, E.M & Bellow, R. (1989). Gains in the Education of Peruvian women, 1940-
1980. Policy research working paper. World Bank, Washington D.C.
Kolcic I, O, P (2006). Academic performance and scientific involvement of final year
medical students coming from urban and rural backgrounds. Andrija Stampar School of
Public Health, Medical School, University of Zagreb, Croatia. http://rrh.deakin.edu.au/
Koontz, H & Weihrich, H .(1988). Management. McGraw-Hill, INC. New York
Krejce, R.V & Morgan, D.W. (1970). Determining sample size for research activities:
Educational and Psychological Measurement, 30. State: Publisher
Kwesiga, C.J. (2002). Women’s access to higher education in Africa: Uganda’s
experience. Kampala: Fountain publishers Ltd.
76
Lee, J and McIntire, W. (2001) Interstate variation in the mathematics achievement of
rural and non-rural students. Journal of Research in rural education, 16(3)
McDonald, A.S,Newton,P.E,Whetton,Cand Benefield, P.(2001). Aptitude testing for
university entrance: a literature review. National foundation for educational research.
McMillan, J and Western ,J. (2000). Measurement of Social-Economic Status of
Australian Higher Education Students. Higher Education, Vol.39, No. 2. Springer.
Miller, W.P and Birch, R.E. (2007). The influence of type of high school attended on
university performance. Retrieved on December 3, 2008 from
http://www3.interscience.wiley.com/journal/118538313
Minnesota Measures (2007) Report on higher education performance. Retrieved on
May 24,2008 from www.opencongress.org/bill/110.s/642/show-139k
Mohammad,Y.H.S and Alhameed,M.A (1988). An evaluation of traditional admission
standards in predicting Kuwait University students’ academic performance. Higher education
Vol.17, No.2. Kluwer Academic Publishers,Dordrecht Netherlands.
Mpofu,T.S.(1997). Mature age entry scheme; survey of policies, practices and
performances of universities in Southern Africa. Retrieved on July 4, 2008 from
http://www.adeanet.org/wgnfe/publications/mpofu.html
National Council for Higher Education, (2006).Quality Assurance Framework for
Uganda Universities (No 7): Author.
Oso, W.Y & Onen, D. (2005). A general guide to writing research proposal and
report. A handbook for beginning researchers. Options press and publishers.
Owen , V. (1999): Exploring beliefs about academic performance achievement. The
Uganda Education Journal. Vol. 2: pp. 57 New Vision
77
Richardson, J.T.E.(1994). Mature students in higher education: academic performance
and intellectual ability. Higher Education 28. Kluwer Academic Publishers. The
Netherlands.
Ringland, C and Pearson, S.A. (2003). Graduate entry to medical school: Testing
some assumptions. Faculty of Medicine and Health sciences, University of Newcastle,
Australia.
Robins, P.S. (1980). The Administrative process. Prentice Hall Inc.Englewood Cliffs,
New Jersey.
Paraeswaran, M. (1991). A comparison of the academic success of mature age and
traditional entrants at the Victorian College of Agriculture and Horticulture –Dookie
Campus. Retrieved on July 3, 2008 from: www.aair.org.au/jir/1991papers/param.pdf
Pedrosa, et al (2006). Educational and social economic background of undergraduates
and academic performance: consequences for affirmative action programs at a Brazilian
research university. Retrieved on September 9, 2007. from:
http://www.comvest.unicamp.br/paals/artigo2.pdf
Sampson, D. (2004). Academic performance, mental health and school factors.
Retrieved on July 3, 2008 from
writing.byu.edu/honors_program/honors_150/contest/2004/sampsondonald.pdf-
Saleemi,N.A.(1997). Systems theory, analysis and design simplified. N.A Saleemi
publishers: Nairobi
Sarantakos, S. (1997). Social research. New York: Palgrave Publishers Ltd.
Sentamu, N.P.(2003). School’s influence of learning: A case of upper primary schools
in Kampala & Wakiso Districts. Uganda Education Journal , 4.
Staffolani, S & Bratti, M. (2002). Student time allocation and education production
functions. http:// ideas.repec.org/p/wpa/wuwphe/0207001.html - 16k

78
Sutton,J.P and Galloway,R.S.(2000). College success of students from three high
schools settings. Journal of Research and Development in Education. Vol 33(3). Athens,
Georgia
Swart, A. (1999). Evaluation of the assessment strategy for admission at Pretoria
University. Retrieved on February 14, 2007
http://hagar.up.ac.za/catts/learner/andres/assess.html 2/14/2007
Universities and Other Tertiary Institutions Act (2001). Kampala. Uganda
Tremblay, S, Nancy, R and Berthelot, J. M (2001). Factors affecting grade 3 student
performance in Ontarion: A multilevel analysis. Education Quarterly review. Vol 7,no.4
Universities Admissions Center, Universities Admission Index (2006) Retrieved on
February 14, 2007 from http://www.uac.edu.au/admin/uai.html.
Uganda Christian University prospectus. 2006-2008.
Waller, D.M and Foy, J. M.(1987). Using British school examinations as a predictor
of university performance in pharmacy course: A correlative study. Higher Education , Vol
16, No.6, Retrieved on July 4, 2008 from http://www.jstor.org/stable/3446847
Wheeler, N (2001).Success of non-traditional students in an undergraduate
occupational therapy programme. Occupational Therapy International,8 (2), Whurr
publishers.

79
Appendix A
Questionnaire
Factors affecting academic performance of undergraduate students of Uganda
Christian University.
Dear Respondent,
The researcher is carrying out a study whose main objective is to establish whether there is a
relationship between admission points, social economic status, school background, and
academic performance of undergraduate students at Uganda Christian University. You have
been selected as one of the respondents for the study and the information you will give will
be treated with utmost confidentiality and used purely for academic purposes. The findings
and recommendations from this study are likely to benefit Uganda Christian University in
areas such admission of students and teaching and learning. Kindly please spare some of
your valuable time to answer these questions.
Thank you.
Yours Sincerely
Martha Kyoshaba
Master of Arts in Educational Management
Makerere University

80
Please tick or fill in as appropriate.
SECTION A: BACKGROUND INFORMATION
1. Sex:
Male
Female
2. Age:
Less than 20 yrs
21 – 25 yrs
26 – 30 yrs
31 – 35 yrs
More than 36 yrs
3. Faculty of study:
Business and
Administration
Education and Arts
Law
Science & Technology
Social Sciences
Theology

81
4. Year of Study:
Year 1
2
3
4
SECTION B: ADMISSION POINTS
5. What was your entry category into Uganda Christian University?
5 a A’ level
5 b Diploma
5 c Mature Age
5 d Other (State)
6. Rate your level of performance as per your entry route (Tick one Option)
(A’ level, Good is 19 points and above, Fair is 13 -18 and Poor is below 12 points
Diploma, Good is First Class, Fair is Second Class and poor is Pass)
Poor Fair Good
6 a A’ level
6 b Diploma
6 c Mature Age
6 d Other (State)

82
SECTION C: SOCIAL ECONOMIC STATUS
7. How would you rate the education level of your parents/guardian?
(High is Degree and above, Medium is Diploma, Low is Certificate and below)
Low Medium High
7 a Father/ Male guardian
7 b Mother/Female guardian
8. Please rate the income level of your parents/guardian
(High is 1,000,000/= and above, Medium is 500,000-900,000/- and low is below
500000/-)
Low Medium High
8 a Father/ Male guardian
8 b Mother/Female guardian
9. Please rate the status of your parents/guardian in terms of occupation.
(High is white collar job, Medium is blue collar job and Low is peasant)
Low Medium High
9 a Father/ Male guardian
9 b Mother/Female guardian
SECTION D: PAST SCHOOL BACKGROUND
10. To what extent do you agree to the following statements about your former school?
(Where former school means A’ level school or former tertiary institution or equivalent)

83
Strongly
Disagree
Disagree Agree Strongly
Agree
10 a My former school was
located in an urban setting
10 b My former school was
government owned
10 c My former school was of
high financial standing
10 d My former school had a
high academic status
SECTION E: ACADEMIC PERFORMANCE
11. With reference to the variables mentioned in the table below, how would you rate
your academic performance at Uganda Christian University.
Poor Fair Good
11 a In Mid-term tests
11 b In Take-home course works
11 c In your previous semesters
examinations
11 d In core/compulsory courses
11 e In optional courses
Thank you for taking time to fill this questionnaire.

84
Appendix B
RELIABILTY ANALYSIS – CRONBACH ALPHA
For Multi- item opinion questions
Reliability Statistics for question on parents’ social economic status
Cronbach's
Alpha
N of
Items
.871 6
Reliability Statistics for question on former school background
Cronbach's
Alpha
N of
Items
.612 4
Reliability Statistics for question academic performance
Cronbach's
Alpha
N of
Items
.778 5
Reliability Statistics for all multi item opinion questions
Cro
nbach's
Alpha
N of
Items
.793 15
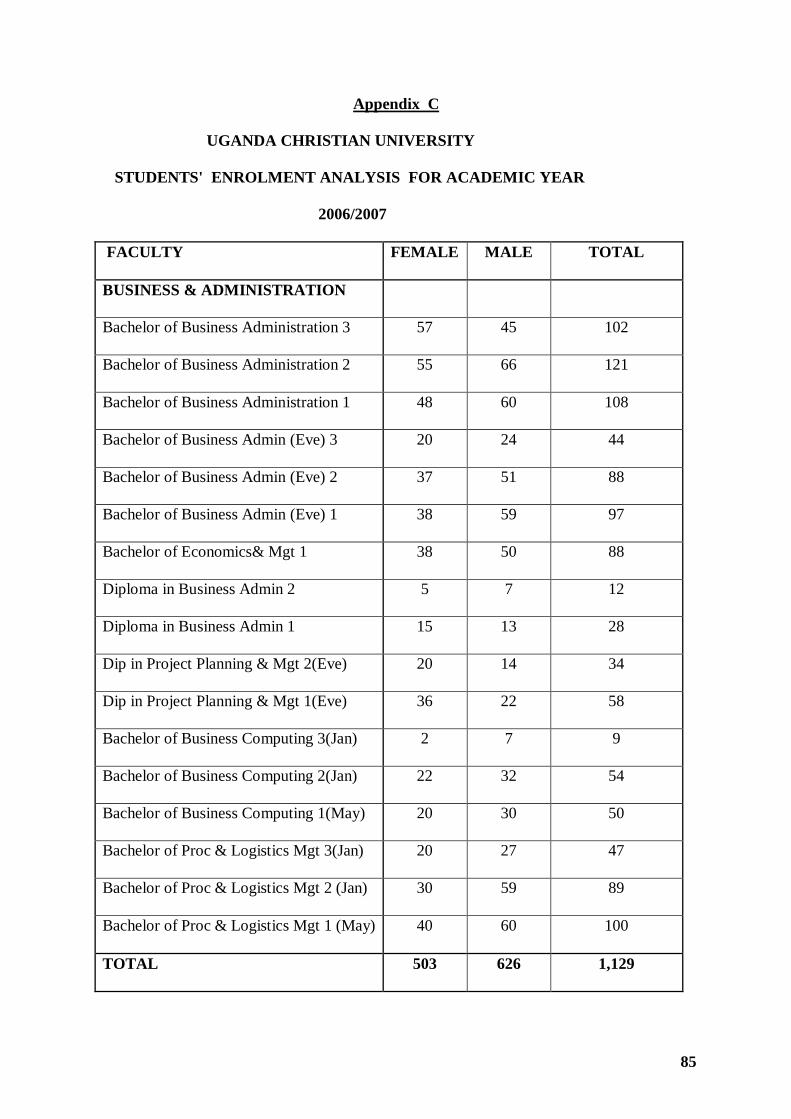
85
Appendix C
UGANDA CHRISTIAN UNIVERSITY
STUDENTS' ENROLMENT ANALYSIS FOR ACADEMIC YEAR
2006/2007
FACULTY FEMALE MALE TOTAL
BUSINESS & ADMINISTRATION
Bachelor of Business Administration 3 57 45 102
Bachelor of Business Administration 2 55 66 121
Bachelor of Business Administration 1 48 60 108
Bachelor of Business Admin (Eve) 3 20 24 44
Bachelor of Business Admin (Eve) 2 37 51 88
Bachelor of Business Admin (Eve) 1 38 59 97
Bachelor of Economics& Mgt 1 38 50 88
Diploma in Business Admin 2 5 7 12
Diploma in Business Admin 1 15 13 28
Dip in Project Planning & Mgt 2(Eve) 20 14 34
Dip in Project Planning & Mgt 1(Eve) 36 22 58
Bachelor of Business Computing 3(Jan) 2 7 9
Bachelor of Business Computing 2(Jan) 22 32 54
Bachelor of Business Computing 1(May) 20 30 50
Bachelor of Proc & Logistics Mgt 3(Jan) 20 27 47
Bachelor of Proc & Logistics Mgt 2 (Jan) 30 59 89
Bachelor of Proc & Logistics Mgt 1 (May) 40 60 100
TOTAL 503 626 1,129
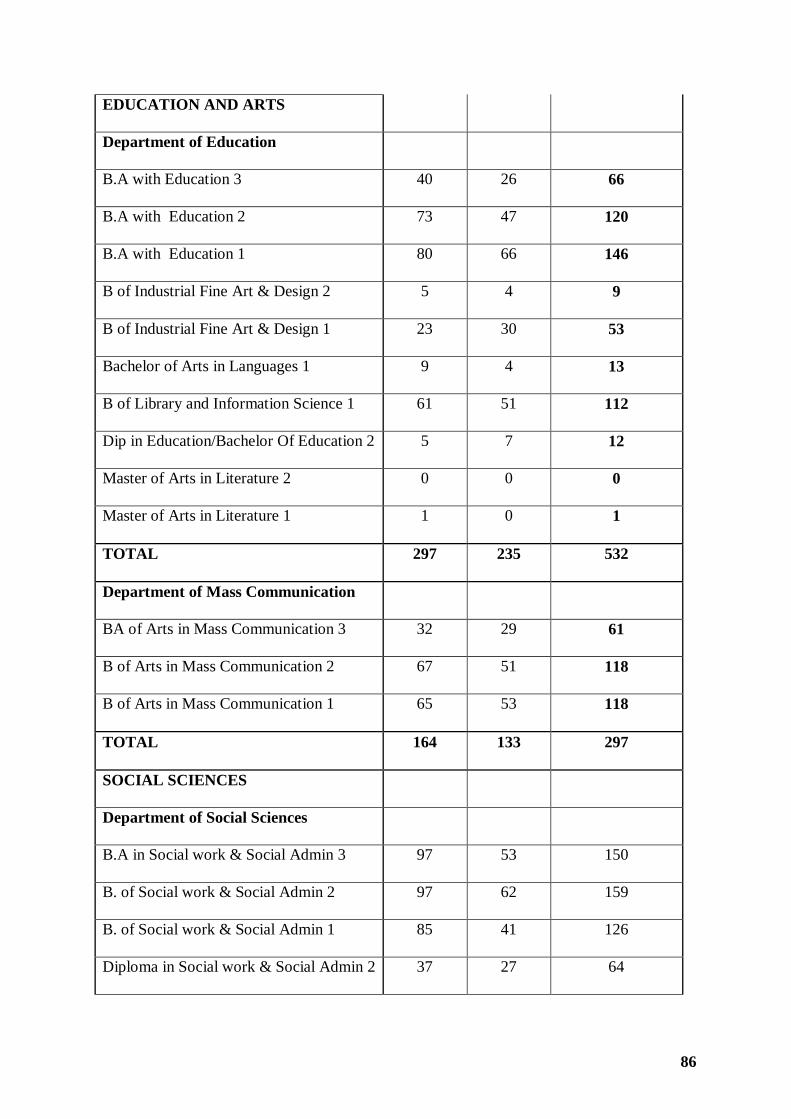
86
EDUCATION AND ARTS
Department of Education
B.A with Education 3 40 26 66
B.A with Education 2 73 47 120
B.A with Education 1 80 66 146
B of Industrial Fine Art & Design 2 5 4 9
B of Industrial Fine Art & Design 1 23 30 53
Bachelor of Arts in Languages 1 9 4 13
B of Library and Information Science 1 61 51 112
Dip in Education/Bachelor Of Education 2 5 7 12
Master of Arts in Literature 2 0 0 0
Master of Arts in Literature 1 1 0 1
TOTAL 297 235 532
Department of Mass Communication
BA of Arts in Mass Communication 3 32 29 61
B of Arts in Mass Communication 2 67 51 118
B of Arts in Mass Communication 1 65 53 118
TOTAL 164 133 297
SOCIAL SCIENCES
Department of Social Sciences
B.A in Social work & Social Admin 3 97 53 150
B. of Social work & Social Admin 2 97 62 159
B. of Social work & Social Admin 1 85 41 126
Diploma in Social work & Social Admin 2 37 27 64

87
Diploma in Social work & Social Admin 1 20 24 44
B of Social Work & Social Admin 3(Jan) 41 39 80
B of Social Work & Social Admin 2(Jan) 52 58 110
B of Social Work & Social Admin 1(Jan) 69 58 127
D in social Work & Social Admin 2 (Jan) 29 14 43
D in social Work & Social Admin 1 (Jan) 23 12 35
Bachelor of Development Studies 3 61 40 101
Bachelor of Development Studies 2 83 47 130
Bachelor of Development Studies 1 66 46 112
Bachelor of Development Studies 3 (Jan) 8 15 23
Bachelor of Development Studies 2 (Jan) 54 53 107
Bachelor of Development Studies 1 (Jan) 54 71 125
B of Public Administration & Mgt 1 56 60 116
TOTAL 932 720 1,652
SCIENCE & TECHNOLOGY
Bachelor of Science in Information Tech 3 22 29 51
Bachelor of Science in Information Tech 2 40 77 117
Bachelor of Science in Information Tech 1 30 73 103
Diploma in Entrepreneurship & IT 2 12 13 25
Diploma in Entrepreneurship & IT 1 15 29 44
Bachelor of Nursing Science 2 12 2 14
Bachelor of Nursing Science 1 9 1 10
TOTAL 140 224 364
LAW
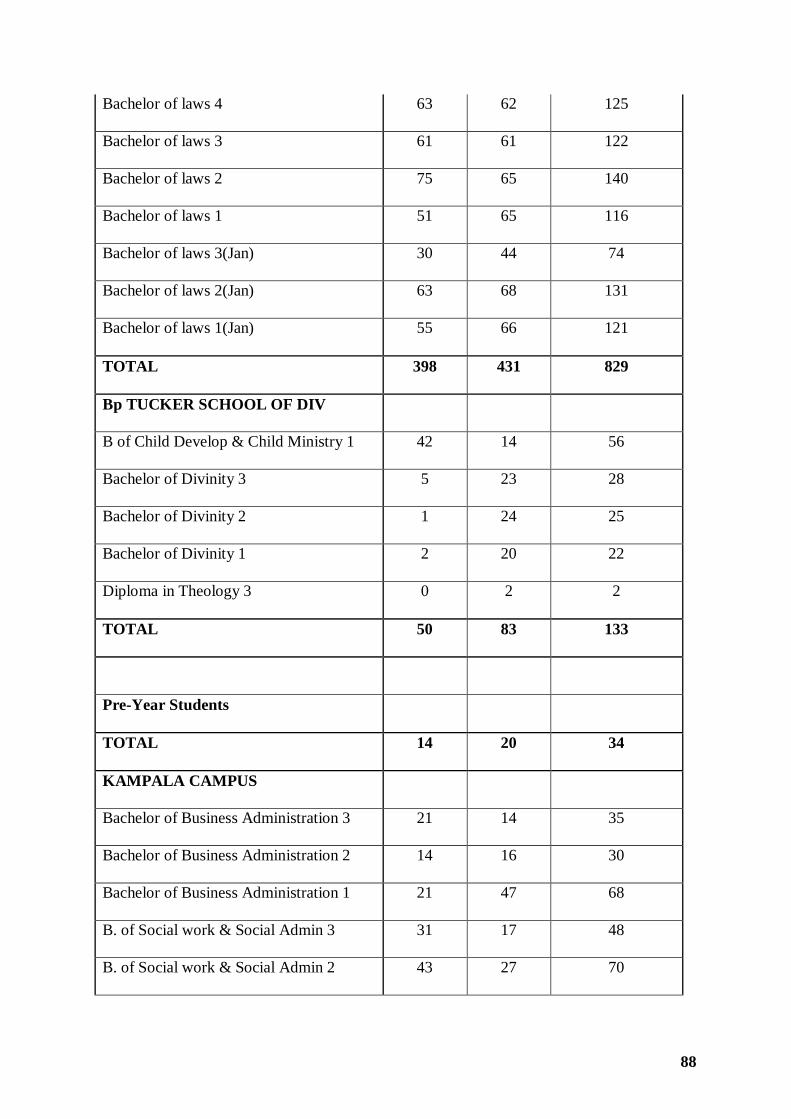
88
Bachelor of laws 4 63 62 125
Bachelor of laws 3 61 61 122
Bachelor of laws 2 75 65 140
Bachelor of laws 1 51 65 116
Bachelor of laws 3(Jan) 30 44 74
Bachelor of laws 2(Jan) 63 68 131
Bachelor of laws 1(Jan) 55 66 121
TOTAL 398 431 829
Bp TUCKER SCHOOL OF DIV
B of Child Develop & Child Ministry 1 42 14 56
Bachelor of Divinity 3 5 23 28
Bachelor of Divinity 2 1 24 25
Bachelor of Divinity 1 2 20 22
Diploma in Theology 3 0 2 2
TOTAL 50 83 133
Pre-Year Students
TOTAL 14 20 34
KAMPALA CAMPUS
Bachelor of Business Administration 3 21 14 35
Bachelor of Business Administration 2 14 16 30
Bachelor of Business Administration 1 21 47 68
B. of Social work & Social Admin 3 31 17 48
B. of Social work & Social Admin 2 43 27 70

89
B. of Social work & Social Admin 1 53 32 85
TOTAL 183 153 336
TOTAL OF FULL TIME
UNDERGRADUATE STUDENTS 2,681 2,625 5,306

90
Appendix D
Pearson Product Moment Correlation between Former school background (FomSchool)
and Academic performance (Acperf)
Acperf
Former school
located in Urban
setting
Pearson
Correlation .164(**)
Sig. (2-tailed) .002
N 340
Former school was
government owned
Pearson
Correlation
.118(*)
Sig. (2-tailed) .030
N 340
Former school was
of high financial
standing
Pearson
Correlation .268(**)
Sig. (2-tailed) .000
N 340
Former school was
of high academic
status
Pearson
Correlation .256(**)
Sig. (2-tailed) .000
N 340

91
Acperf Pearson
Correlation
1
Sig. (2-tailed)
N 340
** Correlation is significant at the 0.01 level (2-tailed).
* Correlation is significant at the 0.05 level (2-tailed).