factors affecting the performance of pupils · pdf filefactors affecting the performance of...
TRANSCRIPT

FACTORS AFFECTING THE PERFORMANCE OF PUPILS
IN PRIMARY SCHOOLS IN PAIDHA TOWN COUNCIL
ACHOMBO CHRISTINE NYIPIR
2006/HD04/5101U
DISSERTATION SUBMITTED TO GRADUATE SCHOOL IN
PARTIAL FULFILMENT OF REQUIREMENTS FOR THE
AWARD OFTHE DEGREE OF MASTERS OF ARTS
IN EDUCATIONAL MANAGEMENT
OF MAKERERE UNIVERSITY
APRIL 2010

i
DECLARATION
I, Achombo Christine Nyipir, declare that, the dissertation is my
original work and has never been submitted to any University or
Institution for any award.
Sign: ……………………………………………………
ACHOMBO CHRISTINE NYIPIR
Date: ……………………………….
ii
APPROVAL
This dissertation has been written under our supervision and has
been submitted for the award of the degree of Masters of Arts in
Educational Management and Administration with our approval as
University Supervisors.
……………………………………………….
Dr. David Onen
Date: ……………………………………….
……………………………………………….
Dr. Fredrick Edward K. Bakkabulindi
Date: ……………………………………….

iii
DEDICATION
I dedicate this work to my dear husband, Mr. Nyipir Gabriel, my
daughters and sons who endeavoured lots of vexation and discomfort
while I was away to write this dissertation.

iv
ACKNOWLEDGEMENT
Above all, the Almighty God receives the highest appreciation and
acknowledgement for sparing my life and for providing me with
sufficient energy, time and wisdom to write up this dissertation. I do
recognize all their contributions, which have enabled this study attain
its current shape.
On a special note, my heartfelt appreciations go to my supervisors: Dr.
David Onen, my lecturer in Educational Policy and Planning,
Implication for Human Resource Development and Utilization,
Methodologies of Educational Planning and Cost Analysis and
Financial Resources Planning and Dr. Fredrick Edward K.
Bakkabulindi, my Lecturer in (1) Introduction to Educational
Research, (2) Educational Measurement and Evaluation, for their
fatherly and untiring close supervisions they accorded this work
despite their busy schedules; from topic selection, research proposal
development, to its current form. In a similar vain, I am indebted to
Dr. B. Ezati, Dr. Mugimu and Dr. Sentongo. I say thank you very
much for sparing time to read through the draft of the proposal and
your suggestions which added value to this study.
I extend my gratitude and respect to Makerere University
Administration, Dr. J.L. Nkata, the Head of East African Institute of
Higher Education Studies and Development.

v
I similarly thank Fr. John Bosco Ssebwalunnyo who lectured me
together with Dr. J.L. Nkata in Financial Management. Special thanks
go to Professor J.C.S. Musaazi, Dr. Maria Kaguhangire – Barifaijo –
the Coordinator Postgraduate Programmes and Dr. E.S. Kasenene –
Deputy Coordinator Graduate Programmes in the East African
Institute of Higher Education Studies and Development for their
inspirational stand and encouragement in the pursuit of this study. I
also extend my honest and sincere gratitude to my secretaries; Miss
Maureen Nantongo, Madam Monica Kairamibwa, Bena Khulubya and
Rosemary all of Makerere University who assisted me by typing the
work. God should reward you abundantly.
Special thanks to the office of the District Education Officer – Nebbi
for granting me study leave. I must not fail to thank the office of the
Local Council Three – Paidha Town Council and all the Headteachers –
Paidha Town Council who gave me time and permission to carry out
data collection. I also thank them for their cooperation. Special thanks
go to all respondents for being flexible in giving me enough
information. I also thank all the teachers of Paidha Town Council
Schools, for their cooperation during my data collection. I wish to
express my utmost appreciation to my course-mates, particularly with
the 2006/2008 sets, for wise words of encouragement, which enabled
me to carry on during difficult moments of the course. I do recognize
your moral, spiritual and intellectual support. Thank you very much.

vi
I fully acknowledge the patience, tolerance and understanding of my
family members, Mr. Nyipir Gabriel Nyipir (husband); Arnold and
Humphrey (sons), Collate, Gertrude, Verdine, Fortunate, Sylvia,
Mildred, Jane and Divine (daughters). These people had to put up with
my absence and a seeming lack of due attention during the duration
of my course. I heartly thank them.

vii
TABLE OF CONTENTS
Page
Declaration … … … … … … … … … i
Approval … … … … … … … … … ii
Dedication … … … … … … … … … iii
Acknowledgement … … … … … … … iv
Table of contents … … … … … … … vii
List of tables … … … … … … … … x
List of figures … … … … … … … … xii
Abstract … … … … … … … … xiii
CHAPTER ONE: INTRODUCTION … … … … … 1
1.0 Introduction … … … … … … … … 1
1.1 Background … … … … … … … … 1
1.2 Problem statement … … … … … … … 11
1.3 Purpose … … … … … … … … 12
1.4 Objectives … … … … … … … 12
1.5 Research questions … … … … … … … 12
1.6 Hypotheses … … … … … … … … 13
1.7 Scope … … … … … … … … 13
1.8 Significance … … … … … … … … 14
CHAPTER TWO: LITERATURE REVIEW … … … … 16
2.0 Introduction … … … … … … … … 16
2.1 Theoretical Review … … … … … … … 16

viii
2.2 Conceptual Framework … … … … … … 18
2.3 Related Literature … … … … … … … 19
CHAPTER THREE: METHODOLOGY … … … … 26
3.0 Introduction … … … … … … … … 26
3.1 Design … … … … … … … … 26
3.2 Population … … … … … … … … 26
3.3 Sample and sampling techniques … …. … … 28
3.4 Data collection methods … … … … … … 29
3.5 Instruments … … … … … … … … 30
3.6 Validity … … … … … … … … … 31
3.7 Reliability … … … … … … … … 32
3.8 Procedure … … … … … … … … 33
3.9 Data analysis … … … … … … … … 34
CHAPTER FOUR: DATA PRESENTATION, ANALYSIS AND
INTERPRETATION… … … … … 36
4.0 Introduction … … … … … … … … 36
4.1 Background information on respondents … … … 36
4.2 Description of the dependent variable: Pupils … … 40
4.3 Variation of dependent variable with background variables 44
4.4 Verification of hypothesis … … … … … … 49
ix
CHAPTER FIVE: DISCUSSION, CONCLUSIONS AND
RECOMMENDATIONS … … … … 60
5.0 Introduction … ... … … … … … … 60
5.1 Discussion …. … … … … … … 60
5.2 Conclusion ... … … … … … … 62
5.3 Recommendations ... … … … … … 62
5.4 Areas for further research … … … … … … 62
REFERENCES … … … … … … … … 63
Appendix A: Self-administered questionnaires … … … 67
Appendix B: Interview guide for primary school headteachers … 70
Appendix C: Interview guide for parents … … … … 72
Appendix D: Interview guide for primary teachers … … 74
Appendix E: Nominal group discussions for parents … … 76
Appendix F: Introductory Letter

x
LIST OF TABLES
Table 1: Primary schools past results in Paidha town council from
2004 – 2007 … … … … … … … 7
Table 2: Number of pupils of P.6 and P.7 in the study … … 27
Table 3: Study sample from the eight primary schools … 28
Table 4.1: Respondents by sex … … … … … 36
Table 4.2: Respondents by age … … … … … 37
Table 4.3: Respondents by class … … … … … 38
Table 4.4: Respondents by school … … … … … 39
Table 4.5: Respondents by responsibility … … … … 40
Table 4.6: Descriptive statistics on academic performance … 41
Table 4.7: Descriptive statistics on academic performance index 42
Table 4.8: Descriptive statistics on performance in co-curricular
activities … … … … … … … 43
Table 4.9: Descriptive statistics on performance in co-curricular
activities index … … … … … … 43
Table 4.10: Descriptive statistics on overall pupils’ performance
index … … … … … … … … 44
Table 4.11: Descriptive statistics and t-test results on how pupils’
performance varied with sex … … … … 44
Table 4.12: Descriptive statistics and ANOVA results in how pupils’
performance varied with age … … … … 45
Table 4.13: Descriptive statistics and t-test results on how pupils’
performance varied with class … … … … 46

xi
Table 4.14: Descriptive statistics and ANOVA results in how pupils’
performance varied with school … … … … 47
Table 4.15: Descriptive statistics ANOVA results in how pupils’
performance varied with responsibility at school … 48
Table 4.16: Descriptive statistics on level of education of
parents … … … … … … … 49
Table 4.17: Descriptive statistics on parents’ level of education
index … … … … … … … … 50
Table 4.18: Pearson Product Moment Correlation for level
of education of parents and pupils’ performance … 51
Table 4.19: Descriptive statistics on level of family income … 53
Table 4.20: Descriptive statistics on parents’ level of income
index … … … … … … … … 54
Table 4.21: Pearson Product Moment Correlation for level of family
income of parents and pupils’ performance … … 55
Table 4.22: Descriptive statistics on level of parents’ marital
status … … … … … … … … 57
Table 4.23: Descriptive statistics on parents’ marital status
index … … … … … … … … 57
Table 4.24: Pearson Product Moment Correlation for level of parents’
marital status and pupils’ performance … 58

xii
LIST OF FIGURES
Figure 2.1 Framework relating the variables in the study … 18
xiii
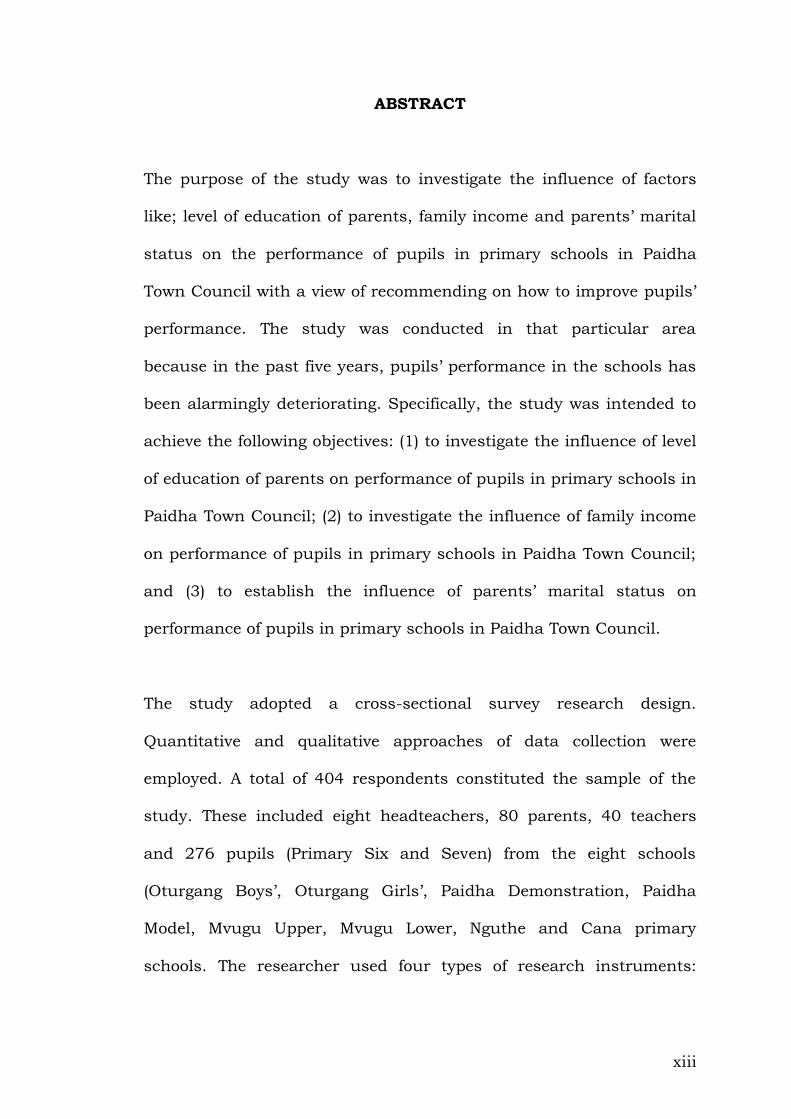
ABSTRACT
The purpose of the study was to investigate the influence of factors
like; level of education of parents, family income and parents’ marital
status on the performance of pupils in primary schools in Paidha
Town Council with a view of recommending on how to improve pupils’
performance. The study was conducted in that particular area
because in the past five years, pupils’ performance in the schools has
been alarmingly deteriorating. Specifically, the study was intended to
achieve the following objectives: (1) to investigate the influence of level
of education of parents on performance of pupils in primary schools in
Paidha Town Council; (2) to investigate the influence of family income
on performance of pupils in primary schools in Paidha Town Council;
and (3) to establish the influence of parents’ marital status on
performance of pupils in primary schools in Paidha Town Council.
The study adopted a cross-sectional survey research design.
Quantitative and qualitative approaches of data collection were
employed. A total of 404 respondents constituted the sample of the
study. These included eight headteachers, 80 parents, 40 teachers
and 276 pupils (Primary Six and Seven) from the eight schools
(Oturgang Boys’, Oturgang Girls’, Paidha Demonstration, Paidha
Model, Mvugu Upper, Mvugu Lower, Nguthe and Cana primary
schools. The researcher used four types of research instruments:
xiv
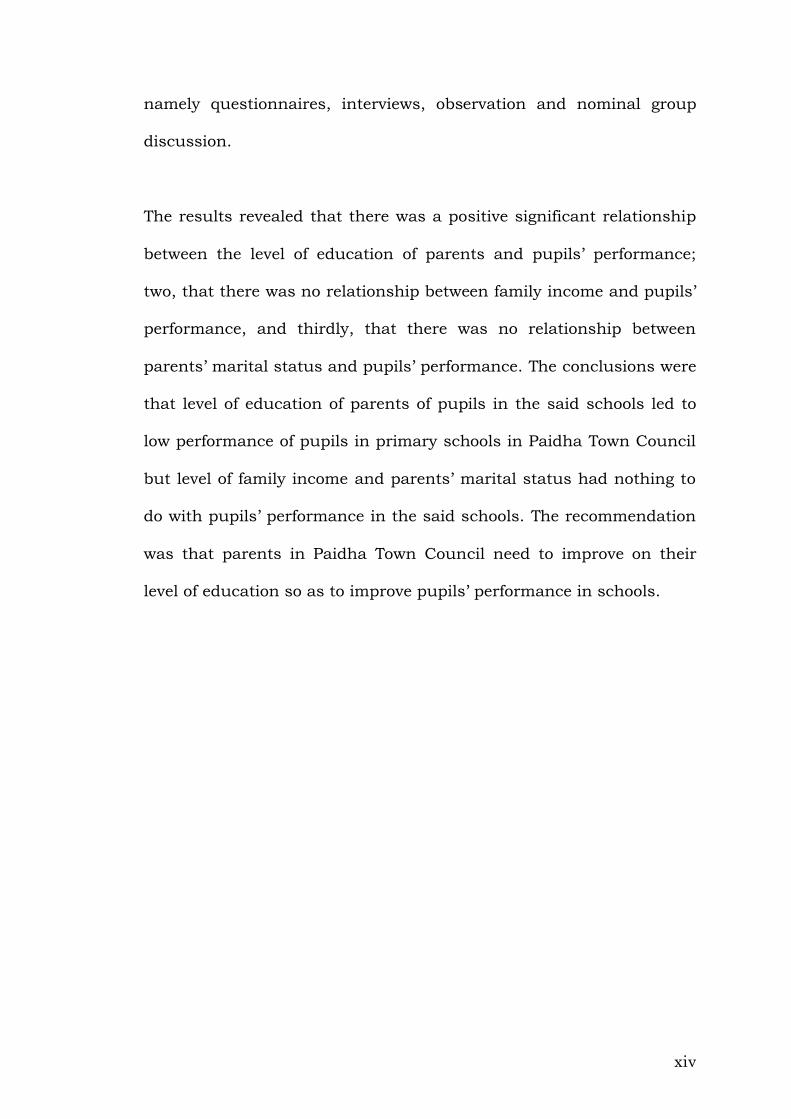
namely questionnaires, interviews, observation and nominal group
discussion.
The results revealed that there was a positive significant relationship
between the level of education of parents and pupils’ performance;
two, that there was no relationship between family income and pupils’
performance, and thirdly, that there was no relationship between
parents’ marital status and pupils’ performance. The conclusions were
that level of education of parents of pupils in the said schools led to
low performance of pupils in primary schools in Paidha Town Council
but level of family income and parents’ marital status had nothing to
do with pupils’ performance in the said schools. The recommendation
was that parents in Paidha Town Council need to improve on their
level of education so as to improve pupils’ performance in schools.

1
CHAPTER ONE
INTRODUCTION
1.0 Introduction
This Chapter presents the background, problem statement, purpose
specific objectives, research questions, hypotheses scope and the
significance of the study.
1.1 Background
The background of the study was broken into four perspectives
namely; the historical, theoretical, conceptual and contextual
dimensions.
1.1.1 Historical Perspective
The issue of pupils’ performance at schools has been of concern ever
since modern education was introduced. Many countries have come to
realize that pupils are the heart of educational process and that
without good performance, all innovations in education are doomed to
failure. There is a wide dissatisfaction with the current situation of
schooling in many countries and parents come in for the share of the
blame. This is because majority of parents involve their children in
garden and other domestic work. This makes pupils have limited time
with their teachers and no time for revision, therefore, affecting their
performance.
2
The Uganda Primary School Curriculum (1999) clearly spells out what
Primary Education is. It also spells out the broad aims and objectives
of Primary Education. The Curriculum in both Volume One and
Volume Two was designed to address the National Aim of Education
as specifically stated in the Government White Paper on the Education
Policy Review Commission Report (1992). Therefore, all school efforts
should be aimed at high quality pupils’ learning. Parents as active
stakeholders in schools should ensure that they are cooperative,
participate fully in school activities, provide children with essential
needs, check pupils’ work, encourage and enforce good behaviour
among pupils and to consult with school authorities to foster good
performance of their children.
Similarly, Kundu and Tutoo (2000) believed, that home background is
the most significant primary factor which influences and shapes
children’s attitudes, personality and behaviour patterns that lead to
good performance at schools. A study conducted by Mugisha (1991) in
some selected schools in Kampala District on causes of pupils’ poor
performance revealed that attitudes of children and their home
background positively or negatively influence their performance in
schools. He further pointed out that the home and the school should
be accepted as partners to improve pupils’ performance. Despite the
above studies, none had been done in Paidha Town Council primary
schools to find out about pupils’ poor performance. It is the hope of
the researcher that pupils’ performance in Paidha should be very good
3
due to its conducive geographical background. Skinner (1945) advised
that for proper learning to take place, learning experiences should be
guided and appropriately controlled. This means, the environment or
the circumstances under which learning occur should be supportive
and conducive enough for effective learning and achievement.
1.1.2 Theoretical Perspective
Theoretically, according to Maicibi (2005:169), a good environment
should be provided by the home if our children in school must learn, if
the school administration must be successful and if the school must
develop. Maani (1990) observes that pupils’ success at schools is
closely related to their home backgrounds. These include; level of
education of parents, family income, parents’ marital status, and
attitudes of parents towards education of their children and the
children’s attitudes and the quality of learners admitted in school.
Could this be true with the case of parents and pupils of Paidha Town
Council schools in Nebbi District, North-western Uganda? No study
has been done in Paidha Town on the same therefore it has left a gap
to investigate the cause of low performance of pupils in the said area
of study.
According to Skinner (1945) “Learning Theory” achievement vary
among individuals due to several reasons. Level of performance and
aspirations of pupils depend on factors linked to the level of education
of parents, family income and marital status of parents. The theory
4
further emphasizes the importance of motivation, involvement in
learning by learners and involvement of parents in supporting their
children’s education. According to Obanya and Ezewu (1988), the
higher the status of a family, the more likely it motivates its children
to learn and perform better. Skinner (1945) advised that for proper
learning to take place, learning experience should be guided and
appropriately be controlled. This means, the environment or the
circumstances under which learning occurs should be supportive and
conducive enough for effective learning and achievement.
1.1.3 Conceptual Perspective
Pupil’s performance, defined as, the ability of pupils to do something
(Oxford Advanced Learners Dictionary, 1994) while academic
performance refers to the quality and quantity of knowledge, skills
techniques and positive attitudes, behaviour and philosophy that
learners achieve or acquire (Ferguson, 1990). This ability is evaluated
by the marks and grades that the pupils attain in a test or
examination which is done at the end of a topic, school term, year or
education cycle. The scores and grades that each pupil obtains
measure the degree of achievement. The quality of the grade and the
number of candidates who pass in various grades determine the level
of academic performance in a given class or institution in a given
period in a particular examination, be it internal or public (Ferguson,
1990).
5
1.1.4 Contextual Perspective
Paidha Town Council has eight primary schools: seven government-
aided and one private school (District Education office, Nebbi, 2008).
In all, the schools have a population of 10,002 pupils and 156
teachers almost all of whom are native people of Nebbi (District
Education Office, 2008). In the past five years, pupils’ performance in
the schools has been deteriorating. While a few pupils excel in their
examination, the majority of the pupils perform poorly. For instance,
in 2003, only 25% of the entire Primary Leaving Examination (PLE)
candidates got Division One. In 2004 again, only 30 candidates
obtained Division One. Last year 2007, only 40 candidates managed
to get Division One (District Education Office, 2008). In all these
years, failure rates have been on the increase. Other than pupils’
performance in examinations, there have been persistent complaints
from teachers about the commitment and the participation of the
pupils of Paidha Town Council primary schools in their education.
According to District Education
Currently, Paidha Town Council has 49 administrative units
composing of four wards (Central, Oturgang, Dwonga and Umua) and
45 villages. There are seven government aided schools namely:
Oturgang Boys, Oturgang Girls, Paidha Demonstration, Mvugu Upper,
Mvugu Lower, Nguthe and Cana primary schools and one privately
owned school called Paidha Model Primary School. Of the existing
secondary schools one is community owned called Paidha Secondary

6
School and another privately owned called Charity College. There are
also nursery schools namely: St. Bakhita, Country Side, Faredu,
Triget and Our Lady of Charity nursery schools. Despite this, pupils’
performance in primary schools has been persistently and alarmingly
low over the years as illustrated in Tale 1. The low performance has
caused worries and concern to many stakeholders in the study area.
This is the reason for investigating the said factors.
Paidha Town Council is located 22 kilometres west of Nebbi Town on
Democratic of Congo border. It covers a total land area of 29 square
kilometers and is bordered on the south by Democratic Republic of
Congo and east, west and north by Paidha Sub-county. The Town
Council has hilly relief and has pleasant climate with a mean annual
temperature of 22.8oC and an annual rainfall of 1437mm. The soils
composed mainly of loamy, sandy and clay textures classified as the
most fertile and productive soils within the tropic. The Town Council
is a source of food for the district and other neighbouring districts like
Arua, Gulu, Masindi and Koboko due to plentiful food crops. Majority
of the people practice subsistence agriculture which accounts for more
than 80% of the revenue income which the Town Council rely on.
Table 1 below shows the performance of the eight Primary Schools in
Paidha Town Council from 2004 – 2007.
7
Table 1: Primary Schools past results in Paidha Town Council
from 2004 – 2007 (End of Year Results)
Year School
Oturgang
Boys’
Primary 7 Primary 6
D1 D2 D3 D4 DX DU D1 D2 D3 D4 DX DU
2004 14 36 0 1 4 0 10 49 56 7 5 5
2005 10 42 2 0 1 0 11 52 42 14 4 3
2006 28 15 0 0 0 0 6 64 25 38 8 12
2007 14 28 0 0 0 0 3 28 47 58 6 26
Total 66 121 2 1 5 0 30 193 170 117 23 46
Year School
Mvugu Lower
Primary 7 Primary 6
D1 D2 D3 D4 DX DU D1 D2 D3 D4 DX DU
2004 1 25 12 11 2 7 2 20 8 20 2 10
2005 0 17 22 7 10 5 6 13 4 22 0 13
2006 1 25 23 15 8 6 0 4 1 8 2 29
2007 2 29 18 5 7 6 2 8 5 34 2 38
Total 4 96 75 38 27 24 10 45 18 84 6 90
Year School
Mvugu Upper
Primary 7 Primary 6
D1 D2 D3 D4 DX DU D1 D2 D3 D4 DX DU
2004 0 11 13 11 1 12 2 10 15 30 10 28
2005 0 10 16 15 9 12 0 24 14 29 31 25
2006 0 25 15 6 6 4 1 24 14 40 10 16
2007 0 14 14 7 6 8 2 26 16 20 24 14
Total 0 60 58 39 22 36 5 84 59 119 75 83
8
Year School
Paidha
Demonstration
Primary 7 Primary 6
D1 D2 D3 D4 DX DU D1 D2 D3 D4 DX DU
2004 6 63 9 7 4 3 4 28 25 15 0 14
2005 0 57 19 16 3 2 2 24 23 29 6 2
2006 1 60 12 5 4 1 1 14 24 48 0 32
2007 1 42 6 0 0 0 1 12 15 50 0 0
Total 8 222 46 28 11 6 8 78 87 142 6 48
Year School
Paidha Model
Primary 7 Primary 6
D1 D2 D3 D4 DX DU D1 D2 D3 D4 DX DU
2004 14 18 0 0 1 0 20 36 2 7 0 1
2005 16 29 5 7 1 0 16 29 5 7 0 1
2006 5 35 2 0 1 0 16 28 39 14 1 12
2007 22 25 0 0 1 0 2 16 25 19 0 12
Total 57 107 7 7 4 0 54 109 71 47 1 26
Year School
Oturgang Girls
Primary 7 Primary 6
D1 D2 D3 D4 DX DU D1 D2 D3 D4 DX DU
2004 0 22 4 2 0 1 3 14 15 25 7 9
2005 0 22 9 0 0 4 2 15 9 34 1 10
2006 2 26 1 1 0 1 1 20 10 18 6 7
2007 1 30 5 2 0 3 3 18 11 17 8 6
Total 3 100 19 5 0 9 9 67 45 94 22 32

9
Year School
Nguthe
Primary 7 Primary 6
D1 D2 D3 D4 DX DU D1 D2 D3 D4 DX DU
2004 0 7 20 15 3 8 0 8 10 20 6 8
2005 0 5 23 14 2 5 0 6 21 10 3 8
2006 0 4 20 9 1 7 0 5 22 15 2 10
2007 0 6 27 10 2 6 0 4 13 18 5 12
Total 0 22 90 48 8 26 0 23 66 63 16 38
Year School
Cana Primary School
Primary 6
D1 D2 D3 D4 DX DU
2004 0 2 26 10 6 8
2005 0 0 34 9 4 19
2006 0 3 30 11 11 7
2007 0 0 5 38 13 10
Total 0 5 95 68 34 44
Source: Headteachers’ Records: Physical visits to headteachers’
offices.
The above table shows that over the period of decade, Oturgang Boys’
qualified 66 Primary Seven in Division 1, 131 Division 2 and two in
Division 3. While Primary Six who qualified were: Division 1 = 30,
Division 2 – 193 and 71 got Division 3. Paidha Model qualified 57
Primary Seven pupils in Division 1, 87 were in Division 2 and seven in
Division 3, the rest were in Division 4 and Division U. While Primary
Six were: 54 Division 1, 109 Division 2 and 71 Division the rest were

10
also in Division 4 and Division U. The total number of pupils who
qualified from all the eight primary schools were: Primary Seven
pupils who got Division One in the whole schools were 138, Division
two were 728 and Division Three were 374, the rest were in Division 4
and U. Primary Six who got Division 1 from the eight schools were
115, 529 Division Two and 762 Division Three. The table further
shows that Oturgang Boys came first performance followed by Paidha
Model primary School and then Paidha Demonstration was third.
Generally performance was not very good.
Home-based factors refer to the instilled, adopted or cultural-oriented
attitude, which is characteristic of a family, clan or an ethnic group
setting (Ezewu, 1988). In this study the factor to consider as those
affecting the performance of pupils at schools include: parents’ level of
education, level of family income and marital status of parents. It is
not clear as to whether these have influence on pupils’ performance in
the primary schools in Paidha Town Council – Nebbi District. Many
variables could explain why pupils’ performance in the said area is
low, as the statistic shows. These could be affected by, among other
factors, the quality of the pupils admitted into the primary schools
(Primary Seven classes), administration, availability of resources
(inputs) like classrooms, library, science laboratory and equipments,
funds available, the performance of teachers, the teachers perception
of the pupils, the attitudes of the pupils, maturation and teachers
instructional performance. Teachers’ instructional performance here

11
refers to teachers management of time (Shalaway, 2001), student
behaviour (Farrant, 1980), instructional presentation (Gagne, 1985)
and monitoring of pupils’ performance (Ryan, 1998).
1.2 Problem Statement
The purpose of primary education is to develop quality of life of the
learners so that they can properly serve the society according to their
roles and responsibilities as good citizens. To achieve the aim and
improve pupils’ performance in primary schools, Primary Teachers’
Colleges are to prepare high quality and sufficient teachers to provide
quality education in primary schools (Ballon and Podgursky, 1997).
The learning process must be guided and controlled; and the learning
environment must be conducive and supportive (Skinner, 1945). In
other words, learners need to be motivated by their parents in
whatever they do. Given this role, Government has deliberately made
effort to improve on infrastructure and other educational inputs.
Despite this, pupils’ performance has been persistently and alarmingly
low in Paidha Town Council schools over the years as illustrated in
Table 1. The low academic achievement of pupils is a cause of worries
and concern to many stakeholders in the Town Council and other
parts of Nebbi District as it is likely to impact on implementation and
achievement of Universal Primary Education.
However, to-date, learners’ level of performance in Paidha Town
Council schools is very low. The study therefore specifically focused on
12
the elements of: Level of education of parents, level of family income
and parents’ marital status and pupils’ performance in the said area.
It was believed by the researcher that if this scenario persists, it
means that most of the pupils in primary schools in Paidha Town
Council would fail to progress in their education and their future
would be blighted due to low levels of education.
1.3 Purpose
The purpose of this study was to investigate the influence of home-
based factors on the performance of pupils in primary schools of
Paidha Town Council with a view of improving pupils’ performance.
1.4 Objectives
The main objectives of this study were:
1. To investigate the influence of level of education of parents on
performance of pupils in Paidha Town Council primary schools.
2. To investigate the influence of family income on performance of
pupils in Paidha Town Council primary schools.
3. To establish the influence of parents marital status on
performance of pupils in Paidha Town Council primary schools.
1.5 Research Questions
This research sought answers to the following questions:
1. To what extent does level of education of parents influence
performance of pupils in Paidha Town Council primary schools?

13
2. To what extent does family income influence performance of
pupils in Paidha Town Council primary schools?
3. To what extent does parents’ marital status influence
performance of pupils in Paidha Town Council primary schools?
1.6 Hypotheses
The study aimed at testing the following hypotheses:
1. Level of education of parents has positive influence on the
performance of pupils in primary schools in Paidha Town
Council.
2. Level of family income has positive influence on the performance
of pupils in primary schools in Paidha Town Council.
3. Parents’ marital status has positive influence on the
performance of pupils in primary schools in Paidha Town
Council.
1.7 Scope
Geographically, the study was conducted in Paidha Town Council,
Nebbi District, North-western Uganda. The study area has eight
primary schools, one of which is private and the rest of the seven are
government-aided. The boundary of the study was focused on aspects
of home-based factors, which among others included level of
education of parents, level of family income and parents’ marital
status. The outcomes of these factors were explored through pupils’
performance as exhibited in academic results, overall school
14
performance in Primary Leaving Examinations. The respondents in
the study were pupils, teachers, headteachers and parents
respectively. The main respondents were the pupils.
1.8 Significance
It was anticipated that the findings and recommendations of this
study would go a long way in generating the much needed information
that would be used by various stakeholders in education to improve
on the quality of education of their children. Through this study, the
assessment results could be guideposts that would help both parents
and pupils identify their areas of strength and weaknesses and make
necessary adjustments to fill the gaps in their roles. The assessment
would also help pupils think of their own learning and redirect their
efforts where necessary and in appropriate direction of needs.
The study would help parents, educational managers and
administrators, teachers, Ministry of Education and Sports officials
and politicians see, recognize and appreciate the need for motivation
and motivate their subordinates and children for an improved
performance. The study would also furnish policy makers, Ministry of
Education and Sports, and politicians with information on parents’
roles and their implications on pupils’ performance; hence giving them
a leeway to formulation of better policies regarding parents’ roles
within the education systems, based on researched information. It
was also hoped to improve level of parents’ status for an improved
15
performance. Lastly, the study was expected to add to the existing
body of knowledge and act as a stepping-stone for later researchers in
similar studies. It would also help future researchers who have the
quest for improving education for all the learners in primary schools
in the said area and Uganda at large.
16
CHAPTER TWO
LITERATURE REVIEW
2.0 Introduction
This chapter examines both theoretical and conceptual frameworks.
The chapter also contains the review of related literature.
2.1 Theoretical Review
The status of a family can have an influence on the performance of its
children as observed by Obanya and Ezewu (1988) that the higher the
status of a family the more likely it motivates its children to learn and
perform better. They looked at this status in three ways: Level of
education of parents, level of family income and parents’ marital
status. They defined education as acquisition of knowledge, skills and
attitudes from parents to children. Nabbumba (1994) reports that
pupils’ performance and aspirations, is linked to level of education of
their parents.
Heyman (1980) emphasized the importance of family income that
children born and reared from wealthier families do better in all
aspects of life and have high moral reasoning and good performance.
Sentamu (2003) reports that family incomes gives direction of what
kind of schools the child will attend. She defined income as money
received over a certain period of time, which can be through payment

17
for work or returns on investment. She defines family income as the
state at which a family receives money over a certain period of time.
According to Oxford Advanced Learners’ Dictionary (1994) marital
status refers to the state of being together as a husband and a wife.
The state has both positive and negative influence on pupils’
performance. For example, in a polygamous family pupils’
performance is negatively influenced by low family income because big
number of children over burden the parents. Where parents are
separated children become targets of mistreatments by their
stepmother, hence, they do not perform well in schools. While those
who have stable marriages collectively exercise control over their
children’s behaviour, children receive enough adult attention, love,
sympathy, guidance, security and they are well supported that
motivate them to perform better in schools.

18
2.2 Conceptual Framework
Figure 2.1 provides a framework relating the variables in the study.
+
+
+
Key: + Means positive
Figure 2.1 Conceptual framework relating home-based factors to
pupil’s performance.
Source: Likert response scale
Level of education of parents
Father 1. None 2. Primary 3. Secondary 4. Above secondary Mother 1. None 2. Primary 3. Secondary 4. Above secondary
Guardian 1. None 2. Primary 3. Secondary 4. Above secondary
Level of family income
Father 1. Low 2. Middle 3. High
Mother 1. Low 2. Middle 3. High
Guardian 1. Low 2. Middle 3. High
Academic performance
- Daily class work
- Weekly tests
- End of term examinations
- End of year examinations
Co-curricular activities
- Games and Sports
- Music, dance and drama
- Club (Youth Farmers Association
- Young Christian Society
- Debating)
Extraneous variables
- Administration
- Availability of resources
- Attitudes of pupils
- Teachers’ performance
Level of family income
Father 1. Low 2. Middle 3. High
Mother 1. Low 2. Middle 3. High
Guardian 1. Low 2. Middle 3. High
Parents’ marital status
Father 1. Divorced 2. Widowed 3. Single 4. Married
Mother 1. Divorced 2. Widowed 3. Single 4. Married
Guardian 1. Divorced 2. Widowed 3. Single 4. Married
19
The framework in Figure 2.1 suggests that the independent variable is
conceptualized as three factors, namely: level of education of parents,
level of family income and marital status of parents, which is the
dependent variable, “Pupils’ performance is conceptualized as
academic performance, which refers to the quality and quantity of
knowledge, skills and positive attitudes, behaviour and philosophy
that students acquire (Ferguson 1990). This includes daily class work,
weekly tests, and of term examinations and end of year examinations.
The dependent variable is also conceptualized as co-curricular
activities which involve games and sports, music dance and drama,
different clubs like young farmers association, young Christian society
and debating.
2.3 Related Literature
This section reviews literature related to the respective specific
objectives in this research.
2.3.1 Level of education of parents and pupils’ performance at
school
Many scholars defined education differently; with Odaet and Bbuye
(1997) defining it as a process whereby some human being directs and
guides the growth and development of some human being towards
some end or goal in life. It deals with preparing the right type of
environment for the individuals to allow them physically, mentally and

20
spiritually so as to develop harmoniously within themselves and
together with their fellow human beings. Level of education of parents
is the degree to which parents have acquired some knowledge, skills,
attitudes and values of informal and formal education. The study
conducted by Prewittz in Kenya on parents’ education showed that
parents’ level of education is very crucial for the performance of their
children because educated parents send their children to school early,
in most cases at the age of five to six. Ezewu (1998) pointed out that
children who join primary schools at early age also complete their
primary education early.
Ezewu (1988) found that educated parents provide adequate learning
materials for their children, which stimulate them to learn and
perform better in all subjects. These parents are concerned over their
children’s education/performance, which sometimes makes them
coach their children themselves or appoint part-time teachers for
them. They send their children to the best nursery and primary
schools which serves as sure gateways to secondary and university
education which in turn leads to higher educational qualification to
occupy higher positions in societies. Owen (1999) in her study
exploring beliefs about academic achievement studied the relationship
between parents’ educational attainment and found that the
educational attainment of parents have a relationship with
educational achievement of their children.

21
According to Sentamu (2003), the educational attainment of parents
determines the kind of schools to which their children go to. Such
schools are near in kind to the ones their parents attended. This tends
to lay a foundation for better performance of their children while at
school. Considine and Zappala (2002) in their study in Australia on
the influence of education disadvantages in the academic performance
of school found that families where parents are educated foster a
higher level of achievement in their children because of providing
psychological support for their children. Combs (1985) found that
virtually all nations, children of high parents on education have far
better chances of getting into better secondary schools and
universities than equally bright children of ordinary workers or
farmers. In other words, the highly educated parents tend to provide a
more conducive learning environment that propels their children to go
to schools and succeed.
Maani (1990) and Mugisha (1991) who both attempted to analyze the
relationship between children’s performance at school and the level of
their parents’ education established that the more educated the
parents are, the better the children’s performance at school. Mugisha
actually did his study on the primary school pupils in Kampala
(Uganda) which also belongs to the same education system like in
Paidha Town Council. According to Nabbumba (1988), parents’ level of
education influences pupils’ performance in the sense that educated
parents value education and they tend to encourage their own

22
children to value and actively engage in receiving education. In a
study conducted in Kenya by Obanya and Ezewu (1988) it was found
that the higher the levels of education of parents, the more likely it
motivates children to learn and perform better. Kundu and Tuto
(2000) found that home background has a significant influence on the
achievement of children at school because educated parents tend to
offer more psychological, social and financial support to their children,
thus giving them the opportunity to excel in their studies.
2.3.2 Level of family income and pupils’ performance at primary
schools
Income means money received over a certain period of time, which can
be through payment for work or returns on investments while family
income can be referred to the state at which a family receives money
over a certain period of time (Oxford Advanced Learners’ Dictionary
1994). In this study, level of family income includes money received by
father, mother and Guardian. According to Farrant (1980), children
from poor home background usually suffer from serious diseases that
lead to their poor performance at schools. In such homes parents are
attempted to encourage their children for early marriages which affect
their performance. While families with high financial background tend
to support their children’s education and encourage the importance of
education rather than encouraging them for marriages. Heyman
(1980) emphasized the importance of family income on pupils’
performance that children born and reared from wealthier homes do
23
better in many aspects of life and have high moral reasoning and
better performance compared to children who come from poor home
background who face a lot of problems in their education.
In a study conducted by Sentamu in Mukono District in 2003 on the
influence of family income on pupils’ performance at school, it was
found that family income was the determinant of the kind of a school
a child attends. This was in congruence with what Combs (1985) had
established in several countries that children from high parents’
occupation have far better opportunities of getting into better
secondary schools and university than equally bright children of
ordinary workers or farmers. The researcher is in total agreement with
this assertion because in Uganda, it is generally the children of the
rich who flock to the academically better performing schools. Family
income, according to Escarce (2003) has positive influence on the
education opportunities available to adolescence and on their chances
of educational success. This is because richer parents are able to take
their children to high-cost schools that generally tend to perform
academically better.
2.3.3 Parents Marital Status and pupils’ performance at school
Marital status refers to the state of being together as a husband and a
wife (Oxford Advanced Learners’ Dictionary 1994). This state has both
positive and negative effects on pupils’ performance at school,
depending on the organization of each family member. Kasirye

24
(1995:11) observed that polygamous and extended families where
income I low influence pupils’ performance in a sense that big
numbered of children over burden the parents, therefore, they fail to
support their children’s education adequately. He further observed
that in homes where parents are quarrelsome, children are neglected
hence affects their performance both in school and at home. The fact
that no study has been carried out in the said schools has left a gap
for the researcher to investigate the effect of marital status of parents
on the performance of the pupils.
Baron and others (1991), Mbuti (1969) and Malaga (1981) pointed out
that marriage is a bond that unites two families, two clans, even more,
a bond that introduces families into another. One the full contract of
marriage is broken it creates a great scar in the community and it is
likely to be traumatic for the couple’s children. According to
Hethengton (1979) as cited by Laura (1989), divorced parents exercise
less control over their children. Medrich et al 1982 as cited by Laura
(1989), further said, children from single parent families receive less
adult attention, affection, love, sympathy, guidance and security and
they are emotionally disturbed. Bhati (1998) stressed that there is a
link between parents’ marital status and pupils’ performance. For
instance lack of cordial understanding in a family causes instability,
lack of control in children’s behaviour also influence performance.

25
According to Gentlement and Markowitz (1974) they looked at
separation of parents as a destructive event in a family, which affects
performance in all aspects of life. United States Census Bureau
(1988), Michael and Sheila (1989) found that level of parents’ marital
status actually influences pupils’ performance at school. But in
Paidha Town Council primary schools no study has been conducted
on the said problem to find out whether it has its effects on the
performance of pupils. Penny (2001) found that parents’ marital
status actually has effects on pupils’ performance. She emphasized
that children living with their stepmothers are targets of misdirected
emotion and mistreatments while children from stable families tend to
perform far better in schools.

26
CHAPTER THREE
METHODOLOGY
3.0 Introduction
This chapter presents the study design, study population, sample and
sampling techniques, data collection methods, instruments, validity,
reliability, procedure and finally data analysis techniques.
3.1 Design
The researcher used a cross-sectional survey design because the
study intended to pick only some representative sample elements of
the cross-section of the population. The study was cross-sectional
because it was conducted across participants over a short period of
time and it did not necessitate the researcher to make follow-ups of
the participants. The survey was also preferred because it allowed the
researcher get detailed inspection of the influence of home-based
factors on the performance of pupils in primary schools in Paidha
Town Council. Quantitative and qualitative approaches were adopted.
The former enhanced the understanding of the meaning of numbers,
while the latter later gave precise and testable expression to
qualitative ideas.
3.2 Population
The study was conducted in all the eight primary schools namely:
Oturgang Boys, Oturgang Girls, Paidha Demonstration, Paidha Model,

27
Mvugu Upper, Mvugu Lower, Nguthe and Cana primary schools. The
study population composed of eight headteachers, 156 teachers, 567
parents and 1429 pupils of primary six and seven. The total
population was 2,160 (headteachers’ records) physical visit to the
headteachers’ offices.
Table 2: Number of pupils of Primary Six and Seven in the study
Schools
Otu
rgang B
oys
Otu
rgang G
irls
Paid
ha
Dem
onstr
ati
on
Paid
ha M
odel
Mvugu U
pper
Mvugu L
ow
er
Nguth
e
Pri
mary
School
Cana
Pri
mary
School
Tota
l
Primary Six 120 124 112 188 134 96 64 58 896
Primary
Seven
58 60 98 66 67 79 55 50 533
Total 178 184 210 254 201 175 119 108 1429
Source: Headteachers’ records, physical visit to headteachers’ offices.

28
3.3 Sample and Sampling Techniques
Table 3: Study sample size from the eight primary schools
Category of
Population
Parent
Population
Sample
Population
Sampling Technique
Headteachers 8 8 Purposive Sampling
Teachers 156 40 Purposive Sampling
Pupils 1429 276 Purposive Sampling
Parents 567 80 Purposive Sampling
Grand Total 2160 404 Purposive Sampling
Note: R.V. Krejcie and D.W. Morgan (1970) Determining Sample Size
for Research Activities Educational and Psychological
Measurement, 30, 608, Sage Publishers.
Purposive sampling technique was used to select headteachers and
teachers because they were few and were the experts in the education
industry (Amia 2005). The total number of headteachers and teachers
was 164. Parents and pupils were also purposively selected because
the researcher believed that they were the right people who could give
the right information about the pupils and parents. The researcher
had in mind that they had information she required (Amia, 2005:142).
From the population of eight headteachers, 156 teachers, 1429 pupils
and 567 parents that made up the total of 2,160 from eight primary
schools only 404 respondents were sampled to reduce cost, time and
effort. The sampling was done in such a way that different categories

29
of respondents were represented in the sample. The sample was large
enough to enable generalization of results.
3.4 Data Collection Methods
Questionnaires, survey interviews, non participation observation and
nominal group discussion were the methods used to collect data from
the respondents. Questionnaires were preferred because of number of
respondents, cost and the nature of the topic which had both
quantitative and qualitative data (Kothari, 2004) self-administered
were also preferred because they were easy to fill by the participants.
They kept the respondents on the subject, they were respectively
objective and were fairly easy to make frequent counts and it was the
easiest means of reaching respondents and obtaining desired
information in the limited time available. Interviews were used as they
allowed pursuance of in-depth information around the topic; they
were also used as follow-ups to certain respondents to confirm pupils’
performance in classes and past results. Nominal group discussion
was preferred because it helped the researcher to come up with agreed
position and conclusions with respect to the influence of the said
home-based factors on pupils’ performance in primary schools in
Paidha Town Council.

30
3.5 Instruments
The researcher used four types of instruments. These included:
questionnaires, interviews, non-participation observation and nominal
group discussion.
3.5.1 Questionnaires
The researcher used a set of self-administered questionnaires directed
toward pupils (Primary Six and Seven). The respective self-
administered questionnaires started with a main title, followed by
introductory letter and had sections. Section One consisted of the
background, Section Two was on independent variables in the study
while Section Three consisted of items about the dependent variables.
Self-administered questionnaires were preferred because of the
number of respondents, costs and the nature of the topic, which had
to do with both quantitative and qualitative data (Katheri, 2004). The
questionnaires were constructed to obtain information on level of
education of parents, level of family income and parents’ marital
status, which formed the independent variables and pupils’
performance (the dependent variables). Data were analyzed and were
coded using a five-point Likert response scale.
3.5.2 Interviews
At least eight headteachers, 40 teachers and 80 parents were
interviewed to provide information on the impact of home-based
factors on the performance of pupils in primary schools in Paidha

31
Town Council. Interviews were preferred because they allowed
pursuance of in-depth information around the topic and were useful
as follow-ups to certain respondents and to further investigate their
responses and serve the purpose of triangulation (Amia 2005).
3.5.3 Non-participation Observation
The researcher carried out observation of lessons in each primary
school and assessed pupils’ performance in daily class work. Relevant
school records like, Primary Leaving Examination results, end of term
results and end of year results were also consulted and thoroughly
observed to obtain information on pupils’ performance.
3.5.4 Nominal Group Discussion
This was used to obtain information from 20 parents as a group who
helped the researcher come up with agreed position and conclusions
with respect to the influence of level of parents’ education, level of
family income and parents’ marital status on pupils’ performance in
primary schools in Paidha Town Council. The researcher intended
that the finding be in agreement with that of the group (Amia 2005).
3.6 Validity
Accuracy of information was ensured by the use of relevant
instruments. The questionnaires were subjected to the scrutiny of the
supervisors and their recommendations were used to finally formulate
instruments that had the ability to obtain the expected relevant data.
32
Headteachers, teachers and parents were interviewed to obtain data
on how level of education of parents, level of family income and
parents’ marital status influence pupils’ performance in schools in
Paidha Town Council. A group of parents were engaged in nominal
group discussion and some relevant documents were consulted to
obtain information on pupils’ performance. After designing the
questionnaires, they were subjected to rating and Content Validity
Index (CVI) were computed using the following formula:
Average of CVI = No of items rated valid
All items in the questionnaires
The CVI for the questionnaires for pupils was 7.06
2.4 which was
equal to 0.7 the recommended validity (Amia 2005). Hence, the
questionnaires were considered valid for data collection.
3.7 Reliability
The questionnaires were pre-tested in two selected schools
(Jupumwocho and Cana) outside Paidha Town Council that ensured
reliability. The sample was 268. It helped to ensure consistency and
dependability of the research instruments and their ability to tap data
that answered to the objectives of the study. Raw data from the
instruments were subjected to a reliability analysis from which
Cronbach’s co-efficient alpha was systematically and consistently
computed using the following formula
33
2
21
1t
i
SD
SD
k
k
k = the number of items in the questionnaires.
2
iSD = the summation, variance for individual items in the
questionnaires.
2
tSD = the variance for all summoned items in the questionnaires.
The reliability for the questionnaires for pupils was 8.06
8.4 , which
was greater than 0.7 the recommended reliability (Amin, 2005).
Hence, the questionnaires were considered reliable for data collection.
3.8 Procedure
The researcher obtained an introductory letter from Dean, School of
Education, Makerere University. On arrival to the District, she sought
for permission from the District Education Office, office of Local
Council Three (LC 3) and the headteachers of primary schools to
collect data in schools. Self-administered questionnaires were then
administered to the pupils by headteachers and completed
anonymously. Headteachers, teachers and parents were interviewed
and completed well. Nominal group discussion was done peacefully,
lessons were observed and relevant documents were obtained from
schools. The raw data obtained were then arranged into a format from
which some meaningful conclusions were drawn.
34
3.9 Data Analysis
The researcher analyzed the qualitative data collected using
structured closed ended items in the questionnaires for each objective
and coded using a five-point Likert response scale. They were
subjected to frequencies and percentages, which helped to show the
distribution of respondents on each of the independent and dependent
variable. Raw data were analyzed using descriptive statistics and
Pearson Product Moment Correlation. Correlation was used to test the
hypotheses in order to determine the influence of home-based factors
on pupils’ performance. ANOVA was used to test the influence of the
combined independent variable components on the dependent
variable. Rank order was performed to determine the relative influence
and significance of each component of the independent variable on the
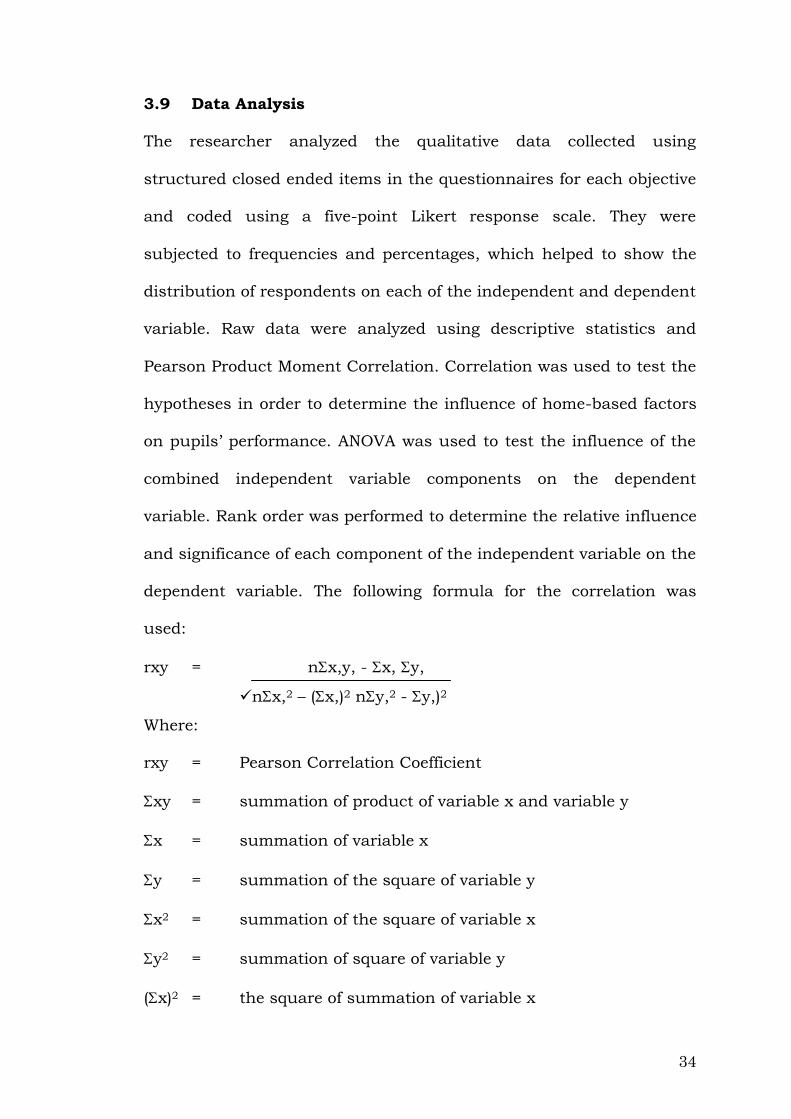
dependent variable. The following formula for the correlation was
used:
rxy = nx,y, - x, y,
nx,2 – (x,)2 ny,2 - y,)2
Where:
rxy = Pearson Correlation Coefficient
xy = summation of product of variable x and variable y
x = summation of variable x
y = summation of the square of variable y
x2 = summation of the square of variable x
y2 = summation of square of variable y
(x)2 = the square of summation of variable x

35
(y)2 = the square of summation of variable y
n = number of subjects in the study.
The qualitative data collected through interviews, non-participation
observation and nominal group discussion were categorized, cleaned,
interpreted and analyzed under their respective themes. This was
used to triangulate and support findings obtained through
quantitative data analysis. The analysis steps were systematically and
consistently done for each one of the three hypothesis, from
hypothesis one to three.

36
CHAPTER FOUR
DATA PRESENTATION, ANALYSIS AND INTERPRETATION
4.0 Introduction
This chapter contains the description of the respondents’ background,
the dependent variable and the verification of hypotheses.
4.1 Background information on respondents
General information comprised data on the sex of the respondents,
age, class, school and responsibilities at school as per Section A of the
questionnaire (Appendix A).
4.1.1 Respondents by sex
Table 4.1 shows the distribution of respondents by sex.
Table 4.1: Respondents by sex
Sex Frequency Percentage
Male 146 52.9
Female 130 47.1
Total 276 100.0
Table 4.1 illustrates that out of the total of 276 respondents, the male
students had the highest representation of about 53% and the female
had 47%. Actually, according to the District Education Officer Nebbi
(2007) female pupils slightly outnumber the male pupils. The highest

37
number of male respondents would mean that there might have been
some form of bias in the selection of respondents by the researcher or
the boys were more cooperative.
4.1.2 Respondents by age
Table 4.2 shows the distribution of respondents according to age:
Table 4.2: Respondents by age
Age Frequency Percentage Cumulative
Percentage
Below 13 years 67 24.3 24.3
13 – 14 years 111 40.2 64.5
Above 14 years 98 35.5 100.0
Total 276 100.0
Table 4.2 illustrates that the highest percentage of respondents, 40%
were aged between 13 – 14 years. About 36% of the respondents were
aged above 14 years and the least number of respondents (less than
21%) were below 13 years meaning that respondents between 13 – 14
age groups are more honest than those of 13 years and above 14 years
old, or children between 13 – 14 years are more knowledgeable than
those above 14 and those below 13 years old or they might be more
cooperative.

38
4.1.3 Respondents by class
Table 4.3: The distribution of respondents according to class
Class Frequency Percentage
Primary Six 134 48.6
Primary Seven 142 51.4
Total 276 100.0
Table 4.3 illustrates that the highest percentage of respondents came
from Primary Seven (over 51%) followed by Primary Six pupils (about
49%). This could be that primary Seven were more cooperative than
Primary Six, or they were more knowledgeable in answering the
questions than Primary Six pupils.
4.1.3 Respondents according to school
Table 4.4 shows the distribution of respondents according to school.
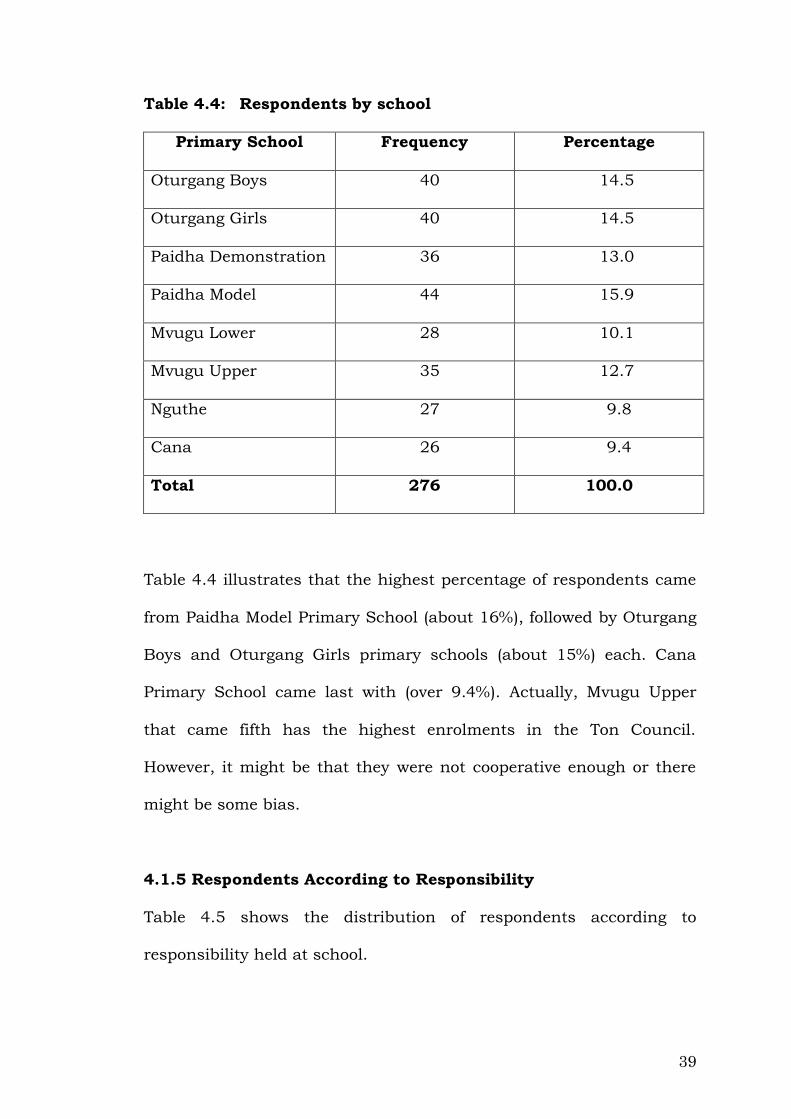
39
Table 4.4: Respondents by school
Primary School Frequency Percentage
Oturgang Boys 40 14.5
Oturgang Girls 40 14.5
Paidha Demonstration 36 13.0
Paidha Model 44 15.9
Mvugu Lower 28 10.1
Mvugu Upper 35 12.7
Nguthe 27 9.8
Cana 26 9.4
Total 276 100.0
Table 4.4 illustrates that the highest percentage of respondents came
from Paidha Model Primary School (about 16%), followed by Oturgang
Boys and Oturgang Girls primary schools (about 15%) each. Cana
Primary School came last with (over 9.4%). Actually, Mvugu Upper
that came fifth has the highest enrolments in the Ton Council.
However, it might be that they were not cooperative enough or there
might be some bias.
4.1.5 Respondents According to Responsibility
Table 4.5 shows the distribution of respondents according to
responsibility held at school.

40
Table 4.5: Respondents by Responsibility
Responsibility Frequency Percentage
Prefect 54 19.6
Class Monitor 30 10.9
Club Official 78 28.3
None 113 40.9
Total 276 100.0
Table 4.5 shows that the highest percentage of respondents were
those pupils who did not hold any responsibility in school activities
(41%), while the least percentage of respondents were the Class
Monitors (with almost 11%). The respondents have little interest in
holding responsibilities in schools for the reasons known by
themselves.
4.2 Description of the dependent variable: pupils’ performance
This Section describes the dependent variable (pupils’ performance),
which in this study was conceptualized to mean academic
performance and performance in co-curricular activities respectively.
4.21 Academic performance
In this study, academic performance was conceptualized in terms of
four questions prompting each respondent to do self-rating in terms of
performance in daily class work, weekly tests, end of term and end of
year examinations. The scale used had a one representing “poor”, two
41
representing “fair”, three representing “good” and four representing
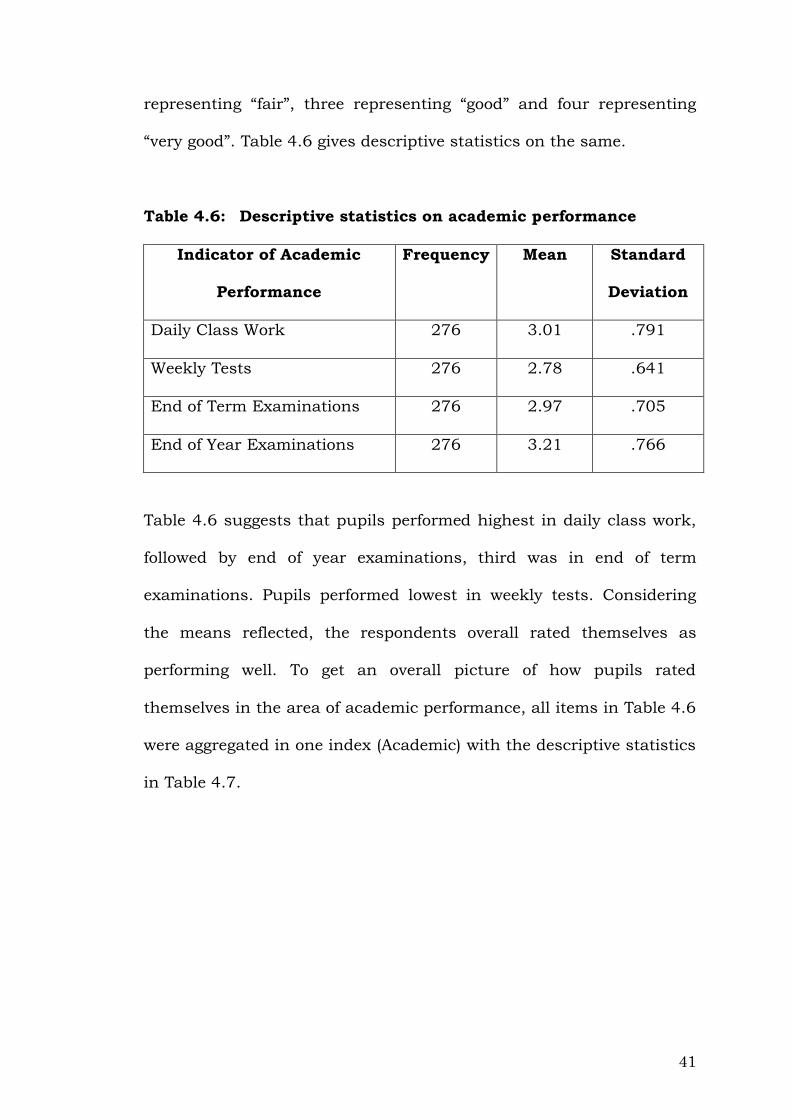
“very good”. Table 4.6 gives descriptive statistics on the same.
Table 4.6: Descriptive statistics on academic performance
Indicator of Academic
Performance
Frequency Mean Standard
Deviation
Daily Class Work 276 3.01 .791
Weekly Tests 276 2.78 .641
End of Term Examinations 276 2.97 .705
End of Year Examinations 276 3.21 .766
Table 4.6 suggests that pupils performed highest in daily class work,
followed by end of year examinations, third was in end of term
examinations. Pupils performed lowest in weekly tests. Considering
the means reflected, the respondents overall rated themselves as
performing well. To get an overall picture of how pupils rated
themselves in the area of academic performance, all items in Table 4.6
were aggregated in one index (Academic) with the descriptive statistics
in Table 4.7.

42
Table 4.7: Descriptive statistics on academic performance index
Mean Median Range Standard
Deviation
Total 3.00 2.5 .57
To get an overall picture of how pupils rated themselves in terms of
performance, the two indices Academic (from Table 4.6) and Co-
curricular (from Table 4.8) were aggregated into one index,
performance with the descriptive statistics as in Table 4.8.
4.2.2 Performance in co-curricular activities
In this study, performance in co-curricular activities was
conceptualized in terms of five questions prompting each respondent-
pupil to do self-rating in terms of performance in games and sports;
music, dance and drama; Young Farmers’ Association; Young
Christian Society and Debating Club. Table 4.7 shows descriptive
statistics resulting there from.
43
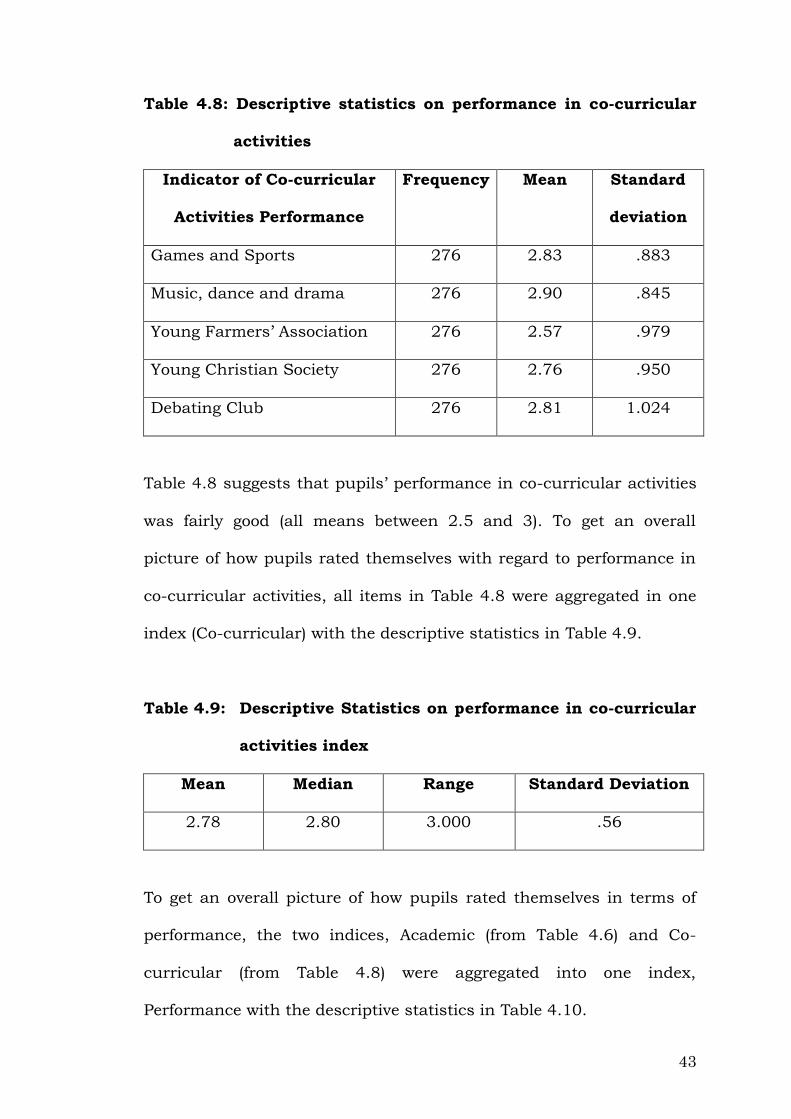
Table 4.8: Descriptive statistics on performance in co-curricular
activities
Indicator of Co-curricular
Activities Performance
Frequency Mean Standard
deviation
Games and Sports 276 2.83 .883
Music, dance and drama 276 2.90 .845
Young Farmers’ Association 276 2.57 .979
Young Christian Society 276 2.76 .950
Debating Club 276 2.81 1.024
Table 4.8 suggests that pupils’ performance in co-curricular activities
was fairly good (all means between 2.5 and 3). To get an overall
picture of how pupils rated themselves with regard to performance in
co-curricular activities, all items in Table 4.8 were aggregated in one
index (Co-curricular) with the descriptive statistics in Table 4.9.
Table 4.9: Descriptive Statistics on performance in co-curricular
activities index
Mean Median Range Standard Deviation
2.78 2.80 3.000 .56
To get an overall picture of how pupils rated themselves in terms of
performance, the two indices, Academic (from Table 4.6) and Co-
curricular (from Table 4.8) were aggregated into one index,
Performance with the descriptive statistics in Table 4.10.

44
Table 4.10: Descriptive statistics on overall pupils’ performance
Mean Median Range Standard Deviation
2.88 2.93 2.28 .48
To get an overall picture of how pupils rated themselves in terms of
performance, the two indices, Pupils’ Performance (from Table 4.7)
and Co-curricular (from Table 4.8) were aggregated into one index,
Performance with the descriptive statistics in Table 4.10.
4.3 Variation of dependent variable with background variables
This Section deals with how the dependent variable (pupils’
performance) varies with sex, age, class, school and responsibility at
school respectively.
4.3.1 Variation of pupils’ performance with sex
The study was interested in whether pupils’ performance varied with
sex. Table 4.1 shows pertinent descriptive statistics and T-test results.
Table 4.11: Descriptive statistics and T-test results on how
pupils’ performance varied with sex
Sex Frequency Mean Standard
Deviation
T-test Significant
Male 146 2.95 0.46 2.325 .021
Female 130 2.81 0.50
45
Means in Table 4.11 suggest that males were better than females at
pupils’ performance. This is supported by t-value of 2.325 and its
calculated significant value of 0.021 (less than a = 0.05). So the
conclusion was that there was significant difference in pupils’
performance with males beating female pupils at the five-percent level
of significance.
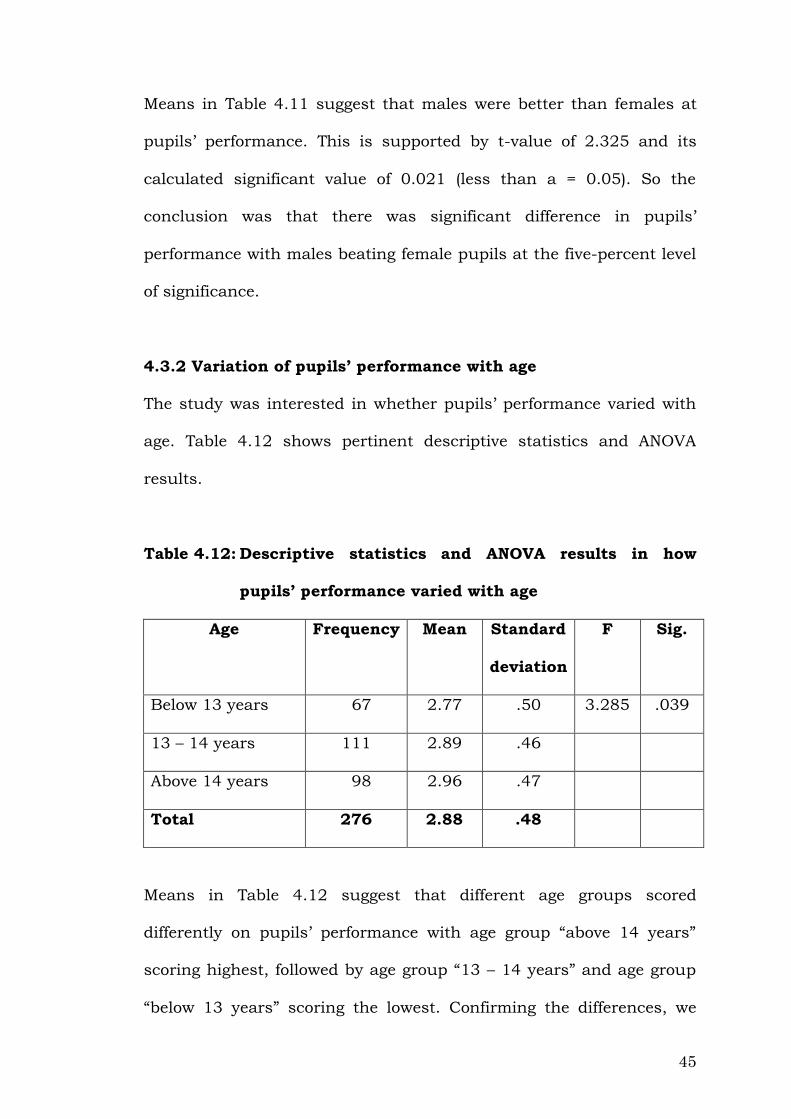
4.3.2 Variation of pupils’ performance with age
The study was interested in whether pupils’ performance varied with
age. Table 4.12 shows pertinent descriptive statistics and ANOVA
results.
Table 4.12: Descriptive statistics and ANOVA results in how
pupils’ performance varied with age
Age Frequency Mean Standard
deviation
F Sig.
Below 13 years 67 2.77 .50 3.285 .039
13 – 14 years 111 2.89 .46
Above 14 years 98 2.96 .47
Total 276 2.88 .48
Means in Table 4.12 suggest that different age groups scored
differently on pupils’ performance with age group “above 14 years”
scoring highest, followed by age group “13 – 14 years” and age group
“below 13 years” scoring the lowest. Confirming the differences, we

46
consider the F-value of 3.285 with its significant value of 0.039 which
is less than alpha 0.05, leading to the conclusion that there were
significant differences in pupils’ performance by age at the five-percent
level of significance.
4.3.3 Variation of pupils’ performance with class
The study was interested in whether pupils’ performance varied with
class. Table 4.13 shows descriptive statistics and T-test results there
of.
Table 4.13: Descriptive statistics and T-test results on how pupils’
performance varied with class
Age Frequency Mean Standard
deviation
F Sig.
Below 13 years 67 2.77 .50 3.285 .039
13 – 14 years 111 2.89 .46
Means in Table 4.13 suggest that Primary Seven were better than
Primary Six at performance in class. This is supported by the t-value
of -3.77 and its calculated sig value .000 which is less than 0.01.
hence the conclusion is that Primary Seven were significantly better at
performance than primary Six at the one-percent level of significance.
47
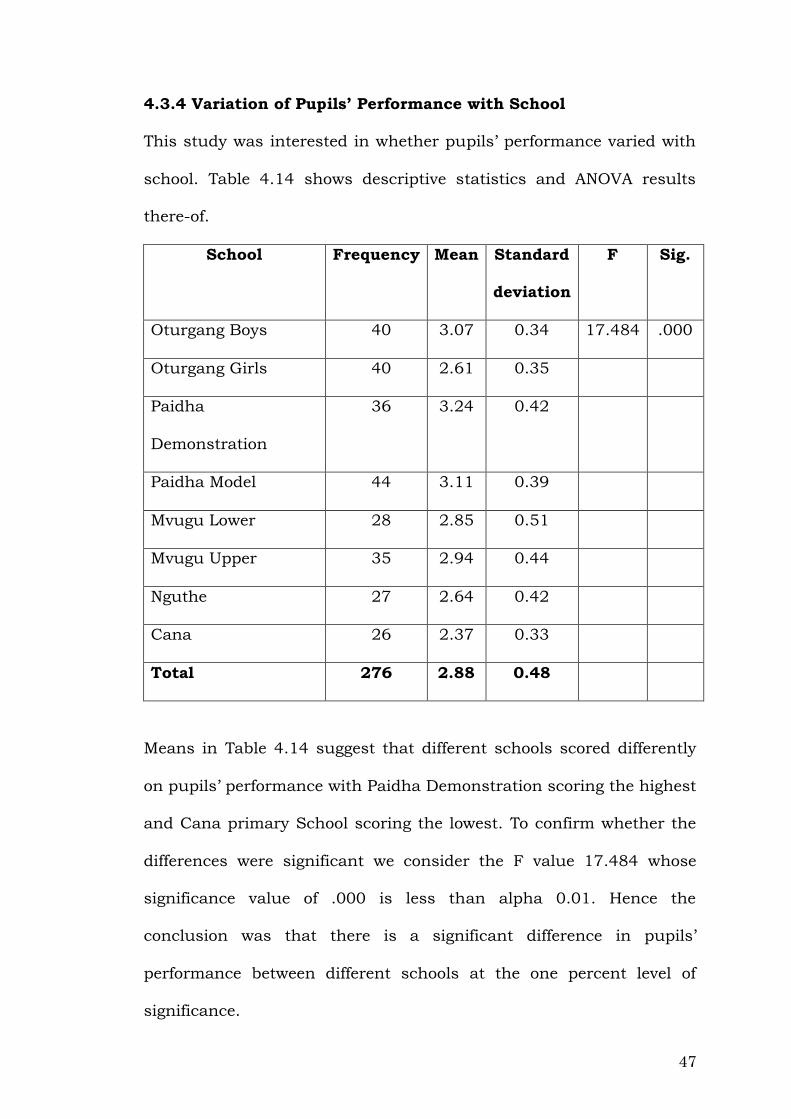
4.3.4 Variation of Pupils’ Performance with School
This study was interested in whether pupils’ performance varied with
school. Table 4.14 shows descriptive statistics and ANOVA results
there-of.
School Frequency Mean Standard
deviation
F Sig.
Oturgang Boys 40 3.07 0.34 17.484 .000
Oturgang Girls 40 2.61 0.35
Paidha
Demonstration
36 3.24 0.42
Paidha Model 44 3.11 0.39
Mvugu Lower 28 2.85 0.51
Mvugu Upper 35 2.94 0.44
Nguthe 27 2.64 0.42
Cana 26 2.37 0.33
Total 276 2.88 0.48
Means in Table 4.14 suggest that different schools scored differently
on pupils’ performance with Paidha Demonstration scoring the highest
and Cana primary School scoring the lowest. To confirm whether the
differences were significant we consider the F value 17.484 whose
significance value of .000 is less than alpha 0.01. Hence the
conclusion was that there is a significant difference in pupils’
performance between different schools at the one percent level of
significance.

48
4.3.5 Variation of pupils’ performance with responsibility at
school
This study was interested in whether pupils’ performance varied with
responsibility. Table 4.15 shows pertinent statistics and NOVA
results.
Table 4.15: Descriptive statistics ANOVA results in how pupils’
performance varied with responsibility at school
Responsibility Frequency Mean Standard
deviation
F Sig.
Prefect 54 3.04 0.40 3.895 .004
Class Monitors 30 2.75 0.48
Club official 78 2.96 0.43
None 113 2.79 0.52
Total 276 2.88 0.48
Means in Table 4:15 suggest that respondents with different
responsibilities scored differently with prefects scoring highest while
class monitors scoring lowest. To confirm whether the differences in
the mean were significant we consider the F-value of 3.815, whose
significance value of 0.004 is less than alpha = 0.01. therefore, the
conclusion was that responsibilities at school significantly influences
pupils’ performance in schools at the one percent level of significance.

49
4.4 Verification of Hypotheses
This section gives the verification of the three study hypotheses.
4.4.1 Hypothesis One
The hypothesis stated that level of education of parents has positive
influence on pupils’ performance in primary schools in Paidha Town
Council. To test this hypothesis, the researcher asked the respondents
(pupils) to rate the level of education of their parents accordingly,
conceptualized as: father, mother and Guardian, using a Likert scale
where one represented “none” (no education); two presenting
“Primary”; three representing “Secondary” and four representing
“Above secondary”. Descriptive statistics on respondents’ rating on the
same is given in Table 4.16.
Table 4:16: Descriptive statistics on level of education of parents
Level of education of: Frequency Mean Standard
deviation
Father 276 2.67 .829
Mother 276 2.21 .767
Guardian 276 2.50 .833
Means in Table 4.16 suggest that education level of parents were
between Primary and Secondary levels (means about 2.5). Table 4.16
further illustrates that pupils rated the education levels of their
fathers to be highest followed by those of their Guardian, trailed by

50
those of their mothers. To get an overall picture of how pupils rated
the level of their parents’ education, all items in Table 4.16 were
aggregated into one index (Parented) with descriptive statistics as
shown in Table 4.17.
Table 4.17: Descriptive statistics on parents’ level of education
index
Mean Median Range Standard
deviation
2.46 2.33 3.00 .61
To test whether level of parents’ education has influence on pupils’
performance, the two numerical indices (Parented and Performance)
were correlated using Pearson’s correlation co-efficient as illustrated
in Table 4.18.

51
Table 4.18: Pearson Product Moment Correlation for level of
education of parents and pupils’ performance
Pupils’
performance
Parents’
education
Performance Pearson correlation 1 .349**
Sig. (2-tailed) .000
Frequency 276 276
Parents’
education
Pearson correlation .349** 1
Sig. (2-tailed) .000
Frequency 276 276
** Correlation is significant at the 0.01 level (2-tailed).
According to Table 4.18, the Pearson correlation index obtained is r =
.349. Being positive it suggested positive correlation, that is, that
pupils’ performance rose with parents’ education. Its significance or p-
value = .000 which was less than alpha = 0.01 implies that pupils’
performance was significantly positively influenced by parents’ level of
education at the one percent level of significance.
All the headteachers of primary schools of Paidha Town Council and
some 80 parents were interviewed on how low level of education on
parents affected pupils’ performance. Schools reported that the
majority of the parents of children in their schools are primary school
leavers who are not very concerned about the performance of their
children in schools. They reported that these parents send their
52
children late to schools at the age of eight or nine years instead of six.
Such parents do not follow up their children in schools to check on
their performance and they do not adequately provide enough support
for the teaching and learning of their children. In fact, all
headteachers remarked that many parents of children in their schools
have resorted to excessive drinking of alcohol instead of focusing on
education of their children.
One headteacher reported that majority of the parents of pupils in
Paidha Town Council are not concerned about the education of their
children, especially the education of the girls. She revealed that most
of the parents encourage their girls to be engaged in income
generating activities and early marriages that has resulted into a
number of dropouts from schools. She expressed concern about the
girls who listen to their mothers and stay at home to help them with
domestic work.
One of the headteachers also commented that lack of education of
these parents is not only seen in the way they handle their children’s
performance in schools but it has also resulted into poor relationship
among parents and teachers because parents are not concerned even
about the discipline of their children; instead they blame the teachers
who try to discipline children in schools. Almost all the headteachers
reported that generally performance and discipline have become
problems in all the primary schools in Paidha Town Council. They

53
proposed for serious sensitization of parents if performance in these
schools is to improve. Nominal group discussion results confirmed the
quantitative and interview results that majority of parents in Paidha
attained Primary education (50 percent), 26 percent attained
Secondary education, 18 percent attained Tertiary education and
those who did not attend schools are 6 percent (own finding).
4.4.2 Hypothesis Two
The hypothesis was to the effect that “level of family income has
positive influence on the performance of pupils in primary schools in
Paidha Town Council.” To test this hypothesis the researcher asked
the respondents (pupils) to rate the level of income of their parents
accordingly. Parents were conceptualized as father, mother and
Guardian, whose level of income was scaled using a Likert scale where
one represented “low”; two representing “middle” and three
representing “high”. Descriptive statistics on respondents’ rating on
the same is given in Table 4.19.
Table 4.19; Descriptive statistics on level of family income
Family income of: Frequency Mean Standard
deviation
Father 276 1.84 .575
Mother 276 1.53 .542
Guardian 276 1.40 1.526
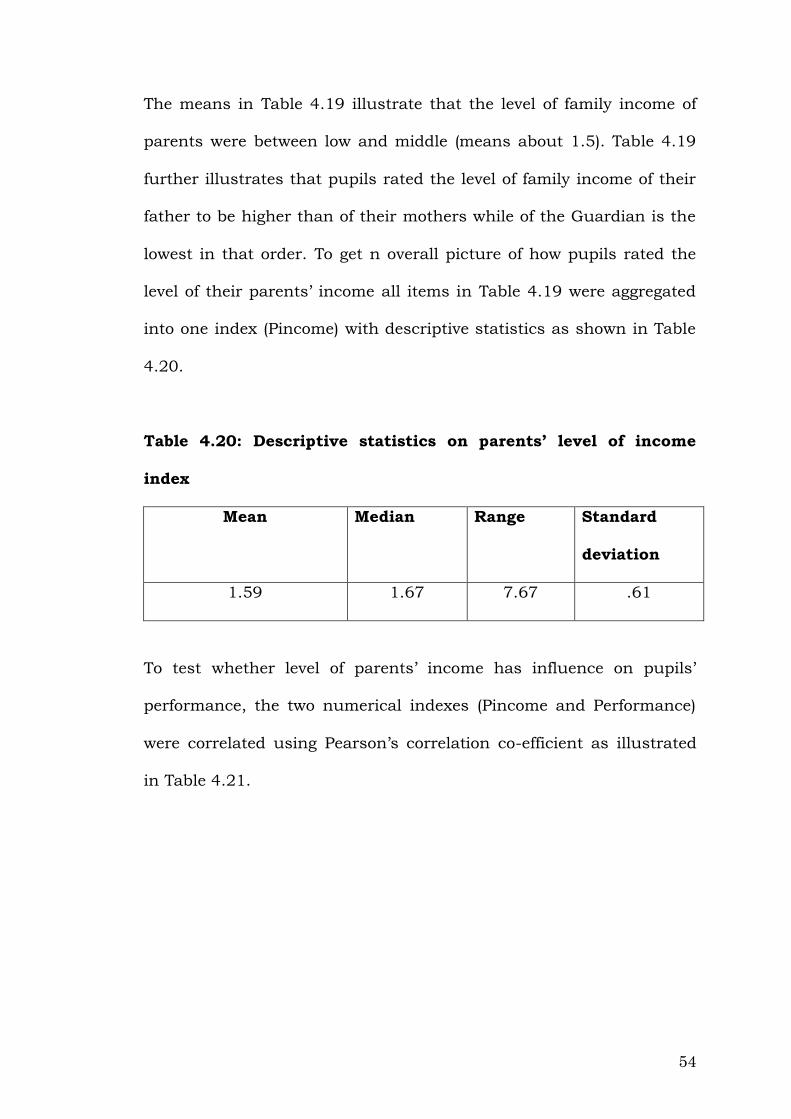
54
The means in Table 4.19 illustrate that the level of family income of
parents were between low and middle (means about 1.5). Table 4.19
further illustrates that pupils rated the level of family income of their
father to be higher than of their mothers while of the Guardian is the
lowest in that order. To get n overall picture of how pupils rated the
level of their parents’ income all items in Table 4.19 were aggregated
into one index (Pincome) with descriptive statistics as shown in Table
4.20.
Table 4.20: Descriptive statistics on parents’ level of income
index
Mean Median Range Standard
deviation
1.59 1.67 7.67 .61
To test whether level of parents’ income has influence on pupils’
performance, the two numerical indexes (Pincome and Performance)
were correlated using Pearson’s correlation co-efficient as illustrated
in Table 4.21.
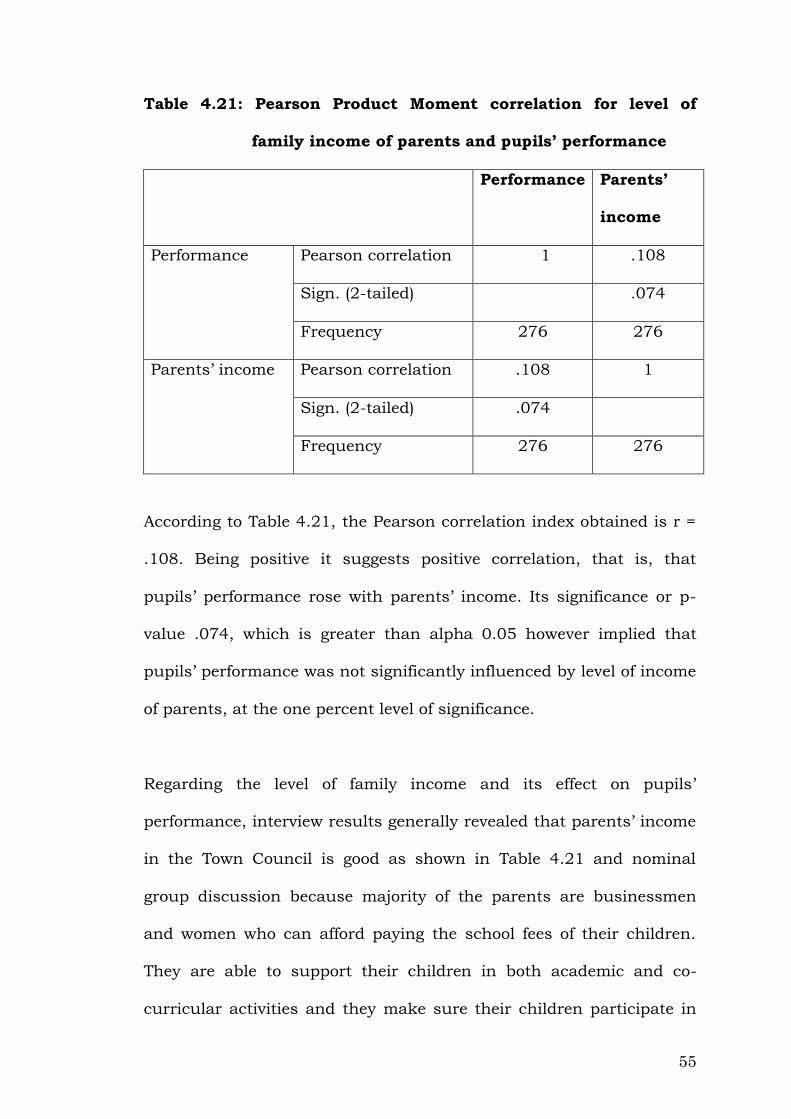
55
Table 4.21: Pearson Product Moment correlation for level of
family income of parents and pupils’ performance
Performance Parents’
income
Performance Pearson correlation 1 .108
Sign. (2-tailed) .074
Frequency 276 276
Parents’ income Pearson correlation .108 1
Sign. (2-tailed) .074
Frequency 276 276
According to Table 4.21, the Pearson correlation index obtained is r =
.108. Being positive it suggests positive correlation, that is, that
pupils’ performance rose with parents’ income. Its significance or p-
value .074, which is greater than alpha 0.05 however implied that
pupils’ performance was not significantly influenced by level of income
of parents, at the one percent level of significance.
Regarding the level of family income and its effect on pupils’
performance, interview results generally revealed that parents’ income
in the Town Council is good as shown in Table 4.21 and nominal
group discussion because majority of the parents are businessmen
and women who can afford paying the school fees of their children.
They are able to support their children in both academic and co-
curricular activities and they make sure their children participate in
56
all the curricular activities held at schools. One headteacher observed
that the majority of the parents are able to afford scholastic materials.
He added that parents are supportive and are able to provide basic
needs for their children.
Another headteacher reported that family income is not the factor
accounting for the differences in pupils’ performance in Paidha Town
Council. In fact two headteachers and six teachers commented that
pupils in primary schools in Paidha Town Council perform poorly in
schools not because of poor financial status of their parents but it is
because the children themselves are lazy, they involve themselves in
petty trade which result into their poor performance. They emphasized
that parents are financially okay only that some of them have resorted
to drunkardness instead of paying their children in schools. Nominal
group discussion results reported it clearly that majority of parents in
the study area get the highest income from coffee sales that make
them provide sufficient support for the education of their children.
4.4.3 Hypothesis Three
The hypothesis was stated “parents’ marital status has positive
influence on performance of pupils in primary schools in Paidha Town
Council.” To test this hypothesis, the researcher asked the
respondents (pupils) to rat the level of their parents’ marital status
accordingly. Parents were conceptualized as: father, mother and
Guardian and marital status was scaled using a Likert scale where

57
one represented “Divorced”; two represented “Widowed”; three
represented “Single”; and four represented “Married”. Descriptive
statistics on respondents’ rating on the same is given in Table 4.22.
Table 4.22: Descriptive statistics on level of parents’ marital
status
Marital status of: Frequency Mean Standard deviation
Father 276 2.22 .711
Mother 276 2.45 2.618
Guardian 276 1.50 .746
The means in Table 4.22 suggest that the level of parents’ marital
status parents were between single and married (means between 1.5
and 2.5). To get an overall picture of how pupils rated the level of their
parents’ marital status all items in Table 4.22 were aggregated into
one index (parents’ marital status) with descriptive statistics as shown
in Table 4.23.
Table 4.23: Descriptive statistics on parents’ marital status index
Mean Median Range Standard deviation
2.00 1.67 3.00 .49
To test whether parents’ marital status has positive influence on
pupils’ performance, the two numerical indexes (parents’ marital
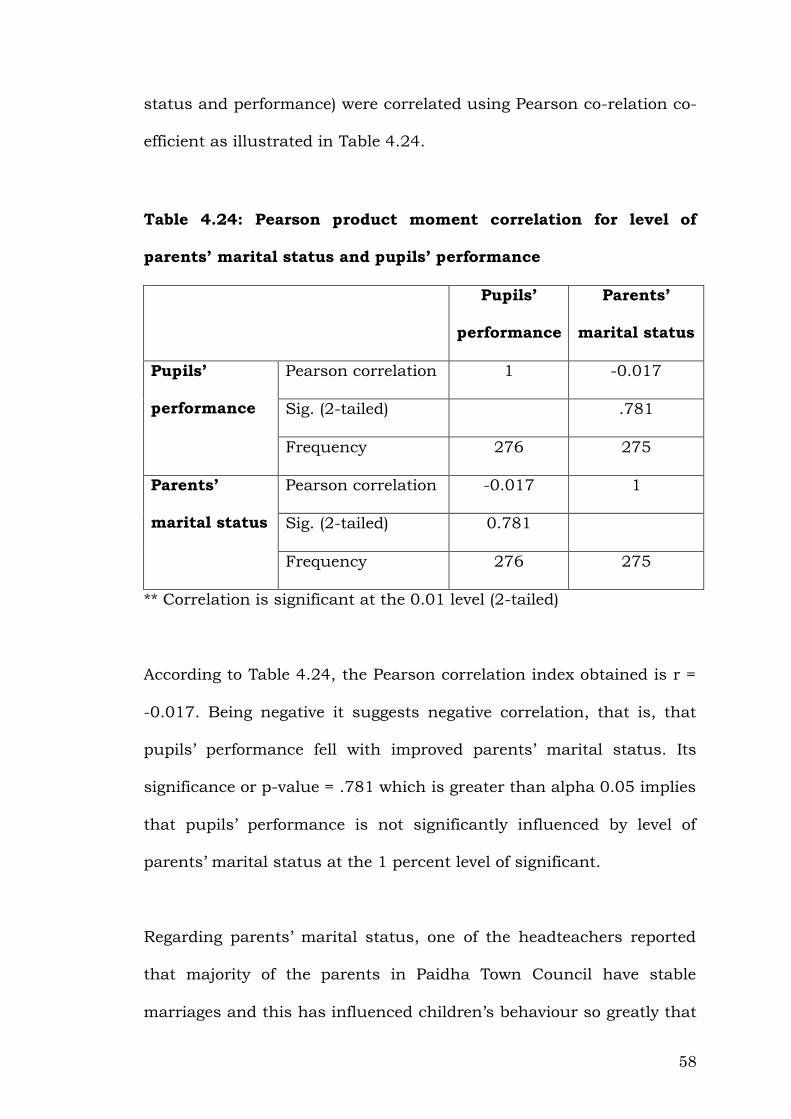
58
status and performance) were correlated using Pearson co-relation co-
efficient as illustrated in Table 4.24.
Table 4.24: Pearson product moment correlation for level of
parents’ marital status and pupils’ performance
Pupils’
performance
Parents’
marital status
Pupils’
performance
Pearson correlation 1 -0.017
Sig. (2-tailed) .781
Frequency 276 275
Parents’
marital status
Pearson correlation -0.017 1
Sig. (2-tailed) 0.781
Frequency 276 275
** Correlation is significant at the 0.01 level (2-tailed)
According to Table 4.24, the Pearson correlation index obtained is r =
-0.017. Being negative it suggests negative correlation, that is, that
pupils’ performance fell with improved parents’ marital status. Its
significance or p-value = .781 which is greater than alpha 0.05 implies
that pupils’ performance is not significantly influenced by level of
parents’ marital status at the 1 percent level of significant.
Regarding parents’ marital status, one of the headteachers reported
that majority of the parents in Paidha Town Council have stable
marriages and this has influenced children’s behaviour so greatly that

59
it has encouraged majority of the pupils to be God-fearing. In fact,
some headteachers and teachers revealed that parents who are stable
in their marriages are prompt in school fees and their children
perform far better than children from single and divorce families. One
headteacher and four teachers reported that majority of parents who
are stable in their marriages are the parents who regularly visit
schools to check on their children’s performance; they give guidance
and counseling to enhance good discipline and behaviour in schools.
They emphasized that poor performance in the Town Council schools
is the result of negative attitudes children have towards education
because most of them engage themselves in income generating
activities instead of attending schools. They concluded that parents’
marital status had nothing to do with pupils’ performance in schools;
that, the reason for poor performance of children in Paidha Town
Council can be due to other factors that need to be investigated in
future so as to improve pupils’ performance in the schools.
Nominal group discussion results with the Chairman Local Council
Three and ten Council officials who are also parents reveal that
majority of parents in the Town Council are Christians who are stable
in their marriages. That poor performance of pupils in schools is due
to too much involvement in income generating activities within the
town, laziness of children and poor attitudes they have towards
education. Therefore, the results confirmed the quantitative result of
Table 4.24.

60
CHAPTER FIVE
DISCUSSION, CONCLUSIONS AND RECOMMENDATIONS
5.0 Introduction
This Chapter presents the discussion, conclusions, recommendations
and areas for further research. The first Section demonstrates
discussion according to the objectives and hypotheses of the study;
the second Section advances conclusions drawn from the discussion.
The third Section gives recommendations drawn from the conclusions.
The fourth Section puts forward possible areas for further research.
5.1 Discussion
5.1.1 Level of Education of Parents and Pupils
The first objective of this study was to investigate the influence of level
of education of parents on pupils’ performance in primary schools in
Paidha Town Council. The parents’ level of education was looked at in
term of highest level of education which was divided into: No
education, primary education, secondary education and above
secondary education. The hypothesis was accepted indicating that
level of education of parents had positive influence on pupils’
performance in primary schools in Paidha Town Council. The positive
relationship meant that improvement in parents’ level of education, for
instance, led to improvement in pupils’ performance in primary
schools.

61
1.1.2 Level of family income and pupils’ performance at school
The second objective was to investigate the influence of level of family
income on pupils’ performance in primary schools in Paidha Town
Council. The second hypothesis which stated level of family income
has positive influence on pupils performance was rejected implying
that pupils’ performance was not significantly influenced by level of
income of parents. This finding contradicted with that of Farrant
(1998) that family income actually influence pupils’ performance in
schools. This could be to the fact that most parents in the study area
generally have equal income. They are equally poor or rich, thus the
difference in the pupils’ performance cannot be attributed to the
difference in the level of income of parents.
1.1.3 Parents’ Marital Status and Pupils’ Performance
The third objective was to establish the influence of parents’ marital
status on pupils’ performance in primary schools in Paidha Town
Council. The data collected from questionnaires, interviews and
nominal group discussion revealed that there was no significant
relationship between level of parents’ marital status and pupils’
performance in the said schools. This finding contradicted with that of
Sheila (1989) and Peny (2001) which found that level of parents’
marital status actually influence pupils’ performance at schools. This
therefore, implied that the difference in performance of pupils in the
said area cannot be attributed to the difference in the level of parents’
marital status.

62
5.2 Conclusions
Based on the findings and discussions, the following conclusions were
drawn:
First, level of education of parents led to low performance of pupils in
primary schools in Paidha Town Council.
Secondly, level of income of parents had nothing to do with pupils’
performance in primary schools in Paidha Town Council.
Thirdly, parents’ marital status had no significant influence on pupils’
performance in primary schools in Paidha Town Council.
5.3 Recommendations
There is need to improve on level of education of parents in Paidha
Town Council so as to improve pupils’ performance in schools.
5.4 Recommended Areas for Further Research
The results of this research revealed that family income and parents’
marital status did not have any effect on pupils’ performance in
Paidha Town Council schools. Therefore, more research should be
done on the followings:
1. Effect of petty trades on pupils’ performance in Paidha Town
Council primary schools.
2. Parents’ participation towards improvement of pupils’
performance in Paidha Town Council schools.
63
REFERENCES
Amin, M. E. (2005). Social Science Research: Conception,
Methodology and Analysis. Kampala: Makerere University Printery.
Baron, B. M. (1991). Social Psychology. Tom Holt, Rinehart and
Winston Inc. Saunder College.
Bhati, K. K. (1998). Principle of Education. New Delhi: Kalyani
Publishers.
Cohen, M.W McLaughlin & J.E. Talbert (Eds) pp. 1 – 10 San
Francisco: Josscy-Bass Publishers.
Considine, G. & Zappala, G. (2002). Influence of Social and
Economic Disadvantage in the Academic Performance of School
Students in Australia, Page 38, 129 – 148.
Coombs, H. P. (1985). World Crisis in Education: View from the
Eighties. New York: Oxford Press.
Creswell, J. W. (1994). Research Design: Qualitative and
Quantitative Approaches. London: Sage Publications.
District Education Office, Nebbi (2008).
Escarce, J. J. (2003). Socio-economic Status and the Fates of
Adolescents. Retrieved on September 27, 2007 from
http://www.pubmedcentral.nib.gov/article.fcgartid.
Ezewu, E. (1988). Sociology of Education. London: Longman
Group Ltd.
Farrant, J. S. (1980). Principles and Practice of Education.
Longman Group, UK Ltd.

64
Ferguson, R. F. (1990). Racial Patterns on How School and
Teacher Quality Affect Achievement and Earnings. Dallas: Meadows
Foundation.
Gagne, J. F. (1985). Understanding Teaching in Context.
Teaching for Understanding Challenges for Policy and Practice. D.K.
Gentlement & Markowitz, J. (1974). The Courage of Divorce.
New York: Simon and Schuster.
Heyman, S. P. (1980). Students Learning in Uganda. Textbook
available and other factors. Comparative Education Review, 24.2.
Isingoma & Pifua (1995). Headteachers Training Series Module
1 Educational Management. Ministry of Education and Sports,
Kampala, Uganda.
Kasirye, B. (1995 January). Youth Plead: Give Us a Chance,
Leadership. Kampala: Marianum press 1 (3447), 11-13.
Kothari, C.R. (2004). Research Methodology, Methods and
Techniques. New Delhi: New Afe International (P) Ltd. Publishers.
Krejcie, R.V. & Morgan, D.W. (1970). Determining Sample Size
for Research Activities: Educational and Psychological Measurement.
Sage Publications.
Kundu, C.L. & Tutoo, D.N. (2000). Educational Psychology. New
Delhi: Sterling Publishers PVT Ltd.
Laura, E. B. (1989). Child Development (4th Ed.).
Massachusetts.
Maani (1990). Factors Affecting Academic Performance.
Unpublished dissertation, Makerere University, Kampala, Uganda.

65
Maicibi, N. A. (2005). Pertinent issues in Management: Human
Resource and Educational Management. Net Media Publishers Ltd.
Mbiti, J. S. (1969). African Religion and Philosophy. Nairobi,
Kampala, Dar-es-Salaam: East African Education Publishers.
Michael, C. & Sheila, R. C. (1989). The Development of Children.
San Diego; University of California.
Mugisha, B. A. (1991). An investigation into the Causes of Poor
Performance in Business Studies Subjects in Selected institutions in
Kampala District. Unpublished dissertation, Makerere University
Kampala, Uganda.
Muhael, C. & Sheila, R. C. (1989). Development of Children. San
Diego: University of California.
Mulago, G. C. M. (1981). Traditional African Marriage and
Christian Marriage. Kampala: Uganda, St. Paul.
Nabbumba, R. (1994). Socio-economic Factors Affecting
Technology Adoption by Coffee Farmer in Mukono District.
Unpublished M.Sc. thesis, Makerere University, Kampala, Uganda.
Nebbi District Records (2004-2008).
Odaet, C.F. & Bbuye, J.R. (1997). Comparative Education.
Foundations of Education Institute of Adult and Continuing
Education Department of Distance Education, Makerere University.
Owen, V. (1999). Exploring Beliefs about Academic Performance
Achievement. The Uganda Education Journal Vol.2, 57, New Vision.
Oxford Advanced Learners’ Dictionary (1994). Longman Group
UK Ltd.
66
Penny, M. (2001). Understanding Children’s Challenging
Behaviour, Why Try to Influence or Change Behaviour for a Variety of
Purposes. United Kingdom, nelson.
Robbins, P. S. (2003). Organizational Behaviour. New Delhi:
Prentice Hall.
Ryan, G. (1998). The Impact of Subject Matter on Curricular
Activity. An analysis on five academic subjects American educational
Research Journal, 32(2), 227 – 249.
Salaway, P. L. (2001). Class Size and Student Achievement:
Research-based Policy Alternative. Educational Evaluation and Policy
Analysis, 12(2), 213 – 227.
Sarantakos, S. (1997). Social Research. New York: Palgrave
Publishers Ltd.
Sentamu, N. P. (2003). School Influence of Learning: A Case of
Upper Primary Schools in Kampala and Wakiso Districts. Uganda
Education Journal, 4.
Skinner, C. E. (Ed.) (1945). Educational Psychology (Rev. Ed.).
New York: Prentice Hall Inc.
Ssekamwa, J. C. & Lugumba, S. M. E. (1973). History of
Education in East Africa (19000 – 1973). Kampala.
Uganda Government/World Bank. Coffee Marketing Technical
Study Working Group No. 9, Kampala March 1987.
Uganda Population Census Report (1991), NEMA (1988).
United States Census Bureau (1988).
67
APPENDIX A
SELF-ADMINISTERED QUESTIONNAIRE FOR PRIMARY SIX AND
SEVEN PUPILS ON FACTORS AFFECTING THE PERFORMANCE
OF PUPILS IN PRIMARY SCHOOLS IN PAIDHA TOWN COUNCIL
Dear respondent,
The purpose of this study is to investigate the influence of home-based
factors on the performance of pupils in primary schools in Paidha
Town Council. As a pupil, you have been selected to participate in the
research by completing the questionnaire as per the instruction at the
beginning of a given section. You are kindly requested to freely fill in
the questionnaire. All your responses will be kept confidential and for
academic purpose only. Please endeavour to fill the questionnaire
within one week and return it to the researcher.
Thank you.
Yours sincerely,
Achombo Christine Nyipir
Researcher.

68
Section A: Background Information
Please help us classify your responses by supplying appropriate facts
about yourself as the case may be. Tick your appropriate choice in
boxes provided.
1. Sex 1. Male 2. Female
2. Age: 1. Below 13 years 2. 13 – 14 years 3. Above14 years.
3. Your Class: 1. Primary Six 2. Primary Seven.
4. Your School: ……………………………………………………………………
Responsibility held at school 1. Prefect 2. Class Monitor
3. Club Official 4. None
Section B: Independent Variable: Home-based Factors
For the following sub-sections, use the rating scale below to supply
appropriate facts about your parents’ status. Tick on the digit that
gives the most objective and accurate rating.
Sub-section B.1: Level of Education of Parents
1.1 Father: 1. None 2. Primary 3. Secondary
4. Above secondary
1.2 Mother: 1. None 2. Primary 3. Secondary
4. Above secondary
1.3 Guardian: 1. None 2. Primary 3. Secondary
4. Above secondary
Sub-section B.2: Level of Family Income
2.1 Father: 1. Low 2. Middle 3. High

69
2.2 Mother: 1. Low 2. Middle 3. High
2.3 Guardian: 1. Low 2. Middle 3. High
Section B.3: Parents’ Marital Status
3.1 Father: 1. Divorced 2. Widowed 3. Single 4. Married
3.2 Mother: 1. Divorced 2. Widowed 3. Single 4. Married
3.1 Guardian: 1. Divorced 2. Widowed 3. Single 4. Married
Section C: Dependent Variable; Pupils’ Performance
Please tick () the number of the correct response that you feel is
appropriate about your performance. Use the rating scale provided.
Sub-section C.1: Academic Performance
1.1 Daily class work: 1. Poor 2. Fair 3. Good 4. Very good
1.2 Weekly tests: 1. Poor 2. Fair 3. Good 4. Very good
1.3 End of term examinations: 1. Poor 2. Fair 3. Good 4. Very good
1.4 End of year examinations: 1. Poor 2. Fair 3. Good 4. Very good
Sub-section C.2: Co-curricular Activities
2.1 Games and Sports: 1. Poor 2. Fair 3. Good 4. Very good
2.2 Music, Dance and Drama: 1. Poor 2. Fair 3. Good 4. Very good
2.3 Young Farmers’ Association:1. Poor 2. Fair 3. Good 4. Very good
2.4 Young Christians Society: 1. Poor 2. Fair 3. Good 4. Very good
2.5 debating Club: 1. Poor 2. Fair 3. Good 4. Very good
Thank you for your cooperation.
70
APPENDIX B
INTERVIEW GUIDE FOR PRIMARY SCHOOL HEADTEACHER ON
FACTORS AFFECTING THE PERFORMANCE OF PUPILS IN
PRIMARY SCHOOLS IN PAIDHA TOWN COUNCIL
Section A: Background Information
1. Years of working experience as a headteacher ………………………….
2. Years of service in the current school ……………………………………..
Section B.1: Level of education of parents
3. What is your opinion about the level of education of the majority of
the parents of this school? ……………………………………….…………..
……………………………………………………………………………………….
Section B.2: Level of income of parents
4. What is your opinion about the level of income of the majority of the
parents of this school? …………………………………………………………
……………………………………………………………………………………….
Section B.3: Parents’ Marital Status
6. Comment on the marital status of the majority of the parents of this
school. ……………………………………………………………………………..
7. What influence does the marital status of the parents have on the
performance of the pupils in your school? ………………………………..
……………………………………………………………………………………….

71
Section C.1: Academic Performance
8. What is your view about the academic performance of the pupils in
your school? ……………………………………………………………………...
……………………………………………………………………………………….
9. What do you think are some of the factors that have led to the
current state of pupils’ performance in your school? ………………….
………………………………………………………………………………………
Section C.2: Co-curricular Activities
10. Give comment the co-curricular activities in your school.
………………………………………………………………………………………
………………………………………………………………………………………
………………………………………………………………………………………
11. What should parents do to improve on the pupils’ performance in
your school?
(i) …………………………………………………………………..………………
(ii) …………………………………………………………………….……………
(iii) …………………………………………………………………………………
Thank you for your cooperation.
72
APPENDIX C
INTERVIEW GUIDE FOR PARENTS OF PUPILS IN PRIMARY
SCHOOLS ON FACTORS AFFECTING THE PERFORMANCE OF
PUPILS IN PRIMARY SCHOOLS IN PAIDHA TOWN COUNCIL
Section A: Background Information
1. What is your occupation? ……………………………………………….……
Section B.1: Level of Education
2. What is your highest level of education? …………………………………
Section B.2: Level of Family Income
3. What major economic activities do you usually carry out?
(i) …………………………………………………………………..………………
(ii) …………………………………………………………………….……………
(iii) …………………………………………………………………………………
4. How do you describe your income level? ………………………………….
………………………………………………………………………………………
5. How does your income level compare with that of other parents in
the neighbourhood? …………………………………………………………..
6. How do you support the education of your children? …………..……..
………………………………………………………………………………………
Section B.3: Marital Status
7. What is your marital status: 1. Single 2. Married
3. Divorced 4. Widowed
8. Do you stay together wit your wife(s) and children? If no, why?
………………………………………………………………………………………

73
9. Who do you think is responsible for the improvement of pupils’
performance in primary school? Give reasons ………………………….
………………………………………………………………………………………
10. What do you think are some of the major problems that hinder
pupils’ performance in primary schools? …………………………………
………………………………………………………………………………………
Section C.1: Academic Performance
11. What is your view about the academic performance of pupils in
this schools? ……………………………………………………………………
………………………………………………………………………………………
12. What should parents do to improve on the academic performance
of their children? ……………………………………………………………..
………………………………………………………………………………………
Section C.2: Co-curricular Activities
13. Comment on the co-curricular activities of the school
………………………………………………………………………………………
………………………………………………………………………………………
14. What contributions should parents make to improve the co-
curricular activities in this school?
(i) ………………………………………………………………..…………………
(ii) …………………………………………………………………….……………
(iii) …………………………………………………………………………………
Thank you for your cooperation.

74
APPENDIX D
INTERVIEW GUIDE FOR PRIMARY TEACHERS ON FACTORS
AFFECTING THE PERFORMANCE OF PUPILS IN PRIMARY
SCHOOLS IN PAIDHA TOWN COUNCIL
Section A: Background information
1. Your age ……………………………….…………………………………………
2. Your gender: ……………………………………………………………..………
3. Name of your school ……………………………………………………….…..
4. Years of service in the current school ……………………………………..
Section B.1: Level of education of parents
5. What is your view about the level of education of the majority of the
parents of this school?
6. Mention some ways by which the level of education of parents of
this school affect the performance of pupils in this school.
Section B.2: Level of family income
7. What is your opinion about the level of income of the majority of the
parents of this school?
8. To what extent do parents of this school support the education of
their children?
75
Section B.3: Parents’ marital status
9. Comment on the marital status of the majority of parents of this
school.
10. What influence does the marital status of parents have on the
performance of the pupils in your school?
Section C.1: Academic performance
11. What is your view about the performance of pupils in your school?
12. What do you think are some of the factors that have led to the
current state of pupils’ performance in your school?
Section C.2: Co-curricular activities
13. Give comment on the co-curricular activities in your school.
14. What should parents do to improve on pupils’ performance in your
school?
(i) …………………………………………………………………………….
(ii) …………………………………………………………………………….
(iii) …………………………………………………………………………….
Thank you for your cooperation.

76
APPENDIX E
NOMINAL GROUP DISCUSSION GUIDE FOR PARENTS ON
FACTORS AFFECTING THE PERFOMANCE OF PUPILS IN PAIDHA
TOWN COUNCIL PRIMARY SCHOOLS
Section A: Background information
1. What is your occupation?
Section B.1: Level of education of parents
2. What is your highest level of education?
Section B.2: Level of family income
3. What major economic activities do you carry out?
(iv) …………………………………………………………………………….
(v) …………………………………………………………………………….
(vi) …………………………………………………………………………….
4. What are some of the problems that affect your economic activities?
5. How do you describe your income level?
(i) Low (ii) Middle (iii) High
Section B.3
6. What is your marital status?
(i) Divorced (ii) Widowed (iii) Single (iv) Married

77
7. Do you stay together with your family members? If no, why?
8. What do you think can happen to children when parents stay
separately with their family members?
Section C.1: Academic performance
9. What is your view about the performance of pupils in primary
schools in Paidha Town Council?
10 What are some of the major problems that hinder pupils’
performance in schools?
11. What should parents do to minimize some of the problems?
Section c.2: Co-curricular activities
12. Comment on the co-curricular activities of primary schools in
Paidha Town Council?
13. What contributions should parents make to improve the co-
curricular activities in these schools?
(i) …………………………………………………………………………….
(ii) …………………………………………………………………………….
(iii) …………………………………………………………………………….
Thank you for your cooperation.