factorial validity running head - ghent university · factorial validity and measurement invariance...
TRANSCRIPT

Factorial Validity
1
Running head: FACTORIAL VALIDITY AND METRIC INVARIANCE TAS-20
Factorial Validity and Measurement Invariance of the 20-item Toronto Alexithymia Scale in
Clinical and Non-clinical Samples
Reitske Meganck, Stijn Vanheule, and Mattias Desmet
Ghent University
Ghent, Belgium
Correspondence concerning this article should be addressed to Reitske Meganck, Ghent
University, Faculty of Psychology and Educational Sciences, Department of Psychoanalysis
and Clinical Consulting, H. Dunantlaan 2, B-9000 Ghent, Belgium. Tel: (0032)(0)9/2646355.
E-mail: [email protected]

Factorial Validity
2
Abstract
The most widely used instrument to measure alexithymia is the 20-item Toronto Alexithymia
Scale (TAS-20). However different factor structures have been found in different languages.
This study tests 6 published factor models and metric invariance across clinical and non-
clinical samples. It is also investigated whether there is a method effect of the negatively
keyed items. Second order models with alexithymia as a higher-order factor are tested.
Confirmatory factor analyses showed that the original factor model with 3 factors – difficulty
identifying feelings; difficulty describing feelings and externally oriented thinking – is the
best fitting model. Partial measurement invariance across samples was illustrated, but needs
further study. A weakness of the model is the low internal consistency of the 3rd
factor. As
models with a method factor had a better fit, future reconsideration of the negatively
formulated items seems necessary. No evidence was found for the second order models.
Keywords: Alexithymia, factorial validity, 20-item Toronto Alexithymia Scale, measurement
invariance

Factorial Validity
3
Factorial Validity and Measurement Invariance of the 20-item Toronto Alexithymia Scale in
Clinical and Non-clinical Samples
The construct of alexithymia, first coined by Sifneos (1973), reflects difficulties in
affective self-regulation and includes four characteristics: (1) difficulty identifying feelings
and distinguishing between feelings and the bodily sensations of emotional arousal, (2)
difficulty describing feelings to other people, (3) constricted imaginal processes, and (4) a
stimulus-bound, externally orientated style. The concept of alexithymia originated within
psychoanalysis but wider scientific interest has since been established. Variables that have
been related to alexithymia range from neighbouring concepts like mentalization to multiple
biological markers (Taylor, Bagby, & Parker, 1997). The widened interest in alexithymia is
also illustrated by the growing body of research that no longer exclusively focuses on
psychosomatic illness, but on a broad range of somatic and psychological problems as well
(Taylor et al., 1997); hence the need for psychometric instruments that are valid in different
types of populations.
The most widely used instrument to measure alexithymia is the 20-item Toronto
Alexithymia Scale (Bagby, Parker, & Taylor, 1994; Bagby, Taylor, & Parker, 1994). The
TAS-20 has been cross-validated in different languages, for example Italian (Bressi et al.,
1996), Finnish (Joukamaa et al., 2001), Japanese (Komaki et al., 2003), Hindi (Pandey,
Mandal, Taylor, & Parker, 1996), German (Parker, Bagby, Taylor, Endler, & Smithz, 1993),
and Swedish (Simonsson-Sarnecki et al., 2000; for a review see: Taylor, Bagby, & Parker,
2003); and in different populations, like community populations (Parker, Taylor, & Bagby,
2003), clinical versus non-clinical populations (Loas et al., 2001), and different cultures
(Parker, Shaughnessy, Wood, Majeski, & Eastabrook, 2005). Bagby, Parker, et al. (1994)
originally proposed a three-factor structure with factor 1: difficulty identifying feelings (DIF),
factor 2: difficulty describing feelings (DDF), and factor 3: externally oriented thinking

Factorial Validity
4
(EOT). This factor solution has often but not consistently been replicated. Some studies found
that the first two factors collapsed into one single factor (Erni, Lotscher, & Modestin, 1997;
Kooiman, Spinhoven, & Trijsburg, 2002; Loas, Otmani, Verrier, Fremaux, & Marchand,
1996). Others found that the last factor (EOT) decomposed into two factors: “pragmatic
thinking” (PR) and “lack of subjective significance or importance of emotions” (IM)
(Haviland & Reise, 1996; Ritz & Kannapin, 2000).
Some remarks can be made with regard to these findings. First, different statistical
techniques are used in the different studies, like principal components analysis, confirmatory
factor analysis and item response theory, which makes them hard to compare. Since the
investigation of the underlying dimensional structure of the TAS-20 is no longer in an
exploratory stage, confirmatory factor analysis (CFA) is assumed to be the most appropriate
technique (Taylor et al., 2003). However, also with CFA, attention should be paid to certain
issues. With CFA choices have to be made concerning estimation method, fit indices and cut-
off criteria, and these choices may influence results and consequently interpretations of those
results. Often no attention is paid to the distributional features of the data, even when
univariate and multivariate normality assumptions are violated. There are also problems with
fit indices. Frequently indices like the GFI and AGFI are used, even though they are criticized
in statistical literature for their dependence on sample size, for example (Hu & Bentler, 1998).
These problems will be taken into account in the present study.
Second, most problems with the factor structure of the TAS-20 arise with non-English
versions of the questionnaire. Consequently the underlying structure of the instrument in other
languages and other cultures needs to be investigated carefully. It is argued that alexithymia
may be a culture-bound construct that reflects the emphasis of Western psychotherapy on
introspection and reflection (see Taylor et al., 2003). This implies that cultural differences
may be found in Eastern societies, but if differences are found between the Dutch TAS-20 and

Factorial Validity
5
other Western-European countries, we expect them to be due to translation issues (or
differences in language use) rather than real cultural differences. Studies on the Dutch version
of the TAS-20 show diverging results. De Gucht, Fontaine, and Fischler (2004) found a three-
factor structure, however they used principal components analysis (PCA) and a replication of
their result with CFA is therefore necessary. Kooiman et al. (2002) on the other hand found a
two-factor model, also using PCA, and proposed to leave out four items because of low factor
loadings. Again, their findings should be confirmed. A firm knowledge of the underlying
dimensions of the TAS-20 used in Belgian or Dutch-speaking populations is important to
guide interpretations of scale scores in further research. Furthermore, in non-English versions
of the TAS-20 problems often arise with (some of) the negatively keyed items (indicated by
low factor loadings). It would be useful therefore to formally test the possibility of a method
effect by adding a method factor to the models for these items.
A third remark is that most studies that use CFA only test one or two models, while it appears
useful and necessary to compare the originally proposed three-factor model with the multiple
solutions found by other researchers. The study by Müller, Bühner, and Ellgring (2003) is an
important exception with respect to this strategy. The authors tested five models, namely a
one factor model, a two factor model with DIF and DDF forming one factor, a three factor
model with DIF and DDF as one factor, but with EOT split into two factors (pragmatic
thinking (PR) and lack of subjective significance or importance of emotions (IM)), and finally
a newly created four-factor model which provided the best fit to the data. As this model had
never been tested before replication of their findings is important.
Our final remark points to a more general shortcoming in all studies on the factor
structure of the TAS-20 we are aware of, namely that the invariance of the factor structure
across different groups has hardly ever been examined. Often research is restricted to one
population, where an examination of this issue is not possible (Parker et al., 1993; Simonsson-

Factorial Validity
6
Sarnecki et al., 2000). When clinical and non-clinical populations are studied within the same
study, different factor solutions are frequently found for the two groups (Haviland & Reise,
1996; Müller et al., 2003), or the invariance of the solution is not explicitly tested (Bagby,
Parker, et al., 1994; Loas et al., 2001). We suggest that if scale score differences across
groups are to be compared, researchers should examine whether different groups of subjects
interpret the TAS-20 items in similar ways by examining metric invariance of the factor
solution.
In this paper we will provide a comparative assessment of different TAS-20 factor
models in clinical and non-clinical samples. We start from the work of Müller et al. (2003)
who tested five different factor models in a clinical and a community sample. Their clinical
sample consisted of 204 patients (59.3% women; mean age = 47.1 years) from a hospital for
psychosomatic disorders and from a clinic for substance abuse. Consequently, this clinical
sample cannot be considered representative for the general psychiatric population. Their non-
clinical sample consisted of 224 adults (58.5% women; mean age = 41.5 years) who were
office workers as well as skilled workers. This sample appears to be representative for the
general population. The authors mention the moderate sample sizes and the advanced age of
both samples as limitations for the study.
The models were judged using the RMSEA (<.06) and the SRMR (<.11) as cut-off
criteria (Müller et al., 2003). However the cut-off of .11 for the SRMR seems too loose, since
all their models actually meet this criterion and moreover in statistical literature the cut-off
guidelines for the SRMR are more stringent (Hu & Bentler, 1999).
Next to the five models tested by Müller et al. (2003), we will also test the 16-item
model for the Dutch TAS-20 proposed by Kooiman et al. (2002). After selecting the best
fitting model, metric invariance across groups of this factor solution will be investigated.

Factorial Validity
7
Additionally we will test the possibility of a method effect of the negatively keyed items
by adding a method factor to the model(s) described above which provide good fit to the data.
Finally, since it is assumed that the subscales of the TAS-20 are dimensions of the
overarching alexithymia construct, we will also test second-order models for the multiple
factor models with alexithymia as the general underlying higher order factor. Also these
models will be tested in clinical and non-clinical samples.
Method
Subjects
The clinical sample consisted of 404 outpatients (70% women) of mental health care
centres in Belgium. All participants were provided with written information on the study and
gave informed consent. Mean age was 38.4 years (SD = 10.6). The most frequent axis I DSM-
IV diagnoses were mood disorders (44%), anxiety disorders (15%), adjustment disorders
(4%), somatoform disorders (4%), substance-related disorders (3%), eating disorders (2%),
and other conditions that may be a focus of clinical attention (11%). Of all participants 74%
received a diagnosis on axis II. Borderline PD (12%), PD Not Otherwise Specified (12%) and
Dependent PD (9%) were the most frequently occurring diagnosis.
The non-clinical sample consisted of 157 university (psychology) students (84.7%
women). Mean age was 20.73 years (SD = 2.53). They completed the TAS-20 after giving
informed consent.
Measures
The Dutch translation of the TAS-20 was administered to each sample (Kooiman et al.,
2002). This scale was obtained by means of a translation and back translation procedure and
the final version was established in consultation with Bagby, one of the original authors of the
instrument. Each item is scored on a five-point Likert scale, with five items negatively keyed.
Total scores range from 20 to 100, with higher scores indicating greater alexithymia.
Factorial Validity
8
Statistical Analysis
Factorial validity of the TAS-20 was tested using CFA of covariance matrices by means
of Lisrel 8.7 (Maximum Likelihood Estimation) (Jöreskog & Sörbom, 1993). Most variables
had significant skewness and kurtosis and thus the assumption of multivariate normality was
violated. Consequently the asymptotic covariance matrices were computed and robust
maximum likelihood estimation was used. The factors were allowed to correlate each time
and correlations between error terms were not permitted. In evaluating the model fit the
following indices were considered: the Comparative Fit Index (CFI), the Standardized Root
Mean Square Residual (SRMR), and the Root Mean Square Error of Approximation
(RMSEA) (Browne & Cudeck, 1993; Jöreskog & Sörbom, 1993; Marsh, Hau, & Wen, 2004).
The following criteria were used as standards of acceptable fit: CFI > .90; SRMR < .09 and
RMSEA < .06; higher boundary of RMSEA 90% confidence interval < .08 (Browne &
Cudeck, 1993; Jöreskog & Sörbom, 1993; Marsh, et al., 2004). The Satorra-Bentler χ²
statistic, which controls for non-normality of the variables, was reported in order to examine
differences in model fits. (This statistic is not used to evaluate single models because it is
highly dependent on sample size.) Also the Akaike Information Criterion (ACI) was reported
and used to compare non-nested models. The AIC gives advantage to more parsimonious
models (more degrees of freedom) and in comparing models the model with the lowest AIC is
considered best (Tanaka, 1993).
Measurement invariance was tested starting from the CFI (Chueng & Rensvold, 2002).
The hypothesis of invariance was accepted if the difference in CFI between a hypothetical
model (H1), in which all factor-loading parameters are equal across groups, and an
unconstrained multi-group model (H0), was smaller than or equal to .01. If the hypothesis of
metric invariance cannot be confirmed, a series of tests will be performed in order to locate
items responsible for overall noninvariance (Byrne, Shavelson, & Muthén, 1989).

Factorial Validity
9
Tested Models
Six different models were compared: (a) a one-factor model where it is assumed that all
items reflect one underlying construct, namely alexithymia (see Figure 1); (b) a two-factor
model with DIF and DDF forming one factor (items 1, 2, 3, 4, 6, 7, 9, 11, 12, 13, 14, 17) and
EOT as the second factor (items 5, 8, 10, 15, 16, 18, 19, 20) (Erni et al., 1997; Haviland &
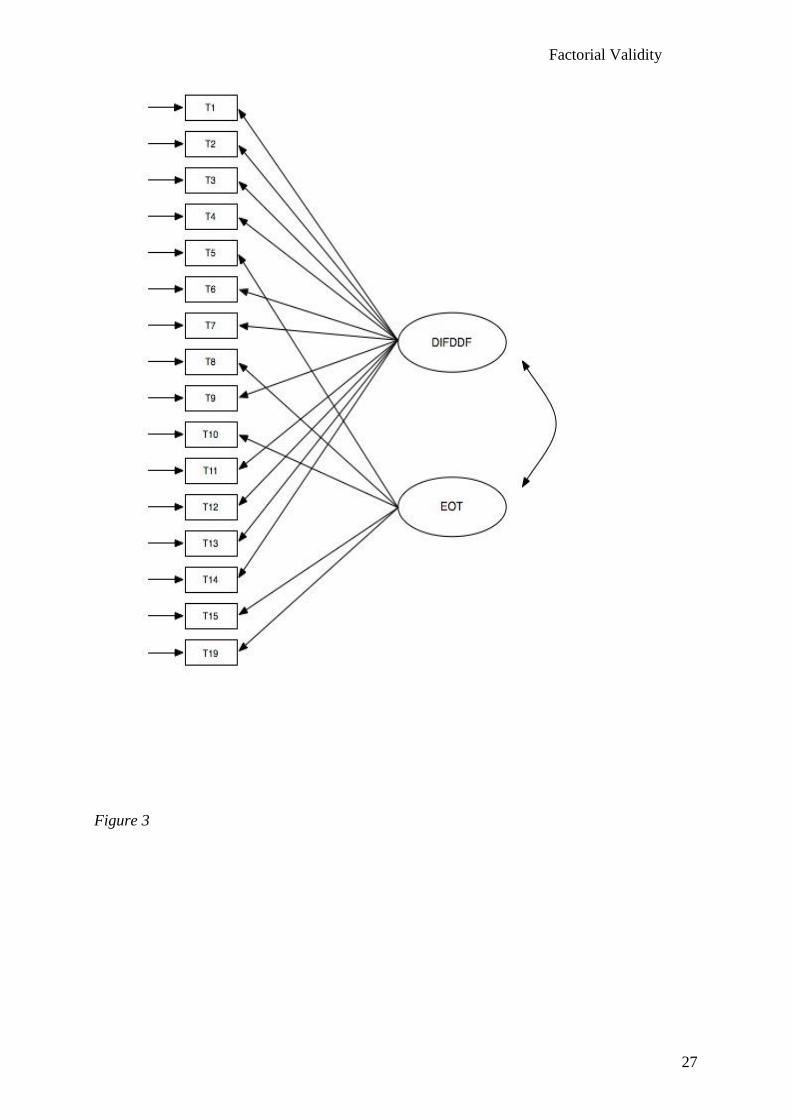
Reise, 1996; Loas et al., 1996) (see Figure 2); (c) a two-factor model with 16 items as
proposed by Kooiman et al. (2002) with DIF and DDF forming again one factor (items 1, 2, 3,
4, 6, 7, 9, 11, 12, 13, 14) and EOT as the second factor (items 5, 8, 10, 15, 19) (see Figure 3);
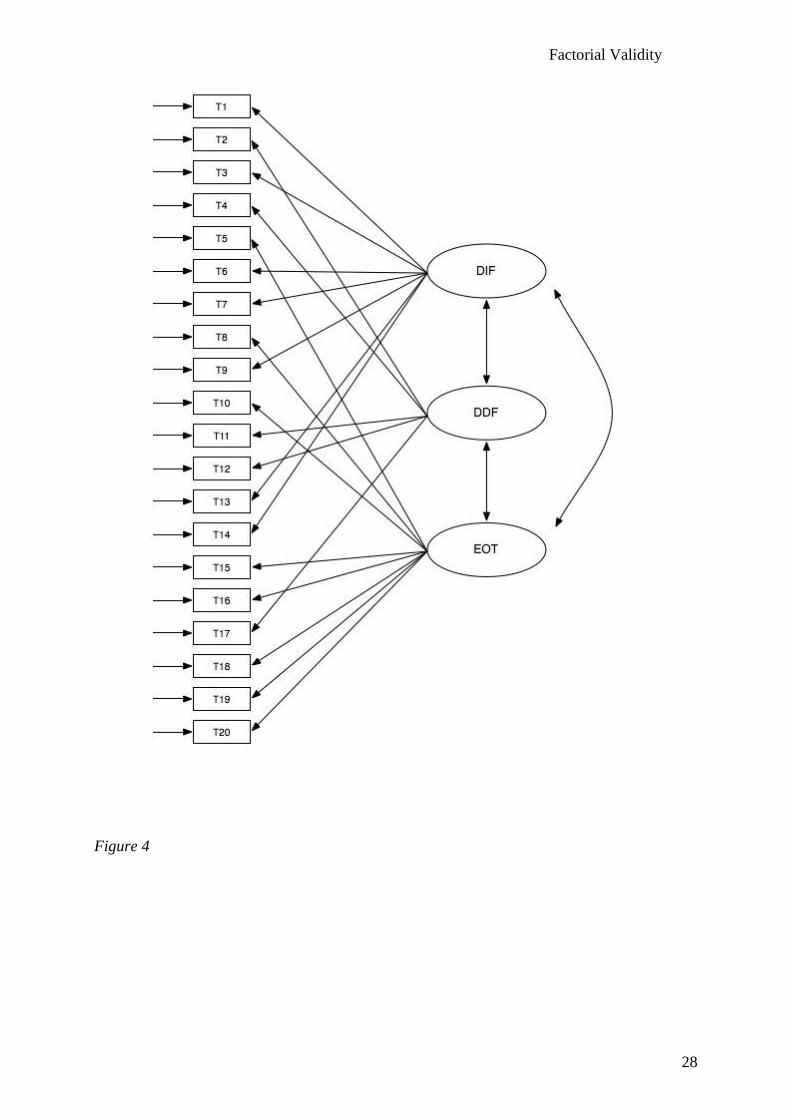
(d) the model as proposed by Bagby and colleagues (Bagby, Parker, et al., 1994), with three
factors: DIF (items 1, 3, 6, 7, 9, 13, 14), DDF (items 2, 4, 11, 12, 17), and EOT (items 5, 8,
10, 15, 16, 18, 19, 20) (see Figure 4); (e) a three-factor solution, but with DIF and DDF as one
factor and EOT split into two factors: “pragmatic thinking” (PR, items 5, 8, 20) and “lack of
subjective significance or importance of emotions” (IM, items 10, 15, 16, 18, 19) (Ritz &
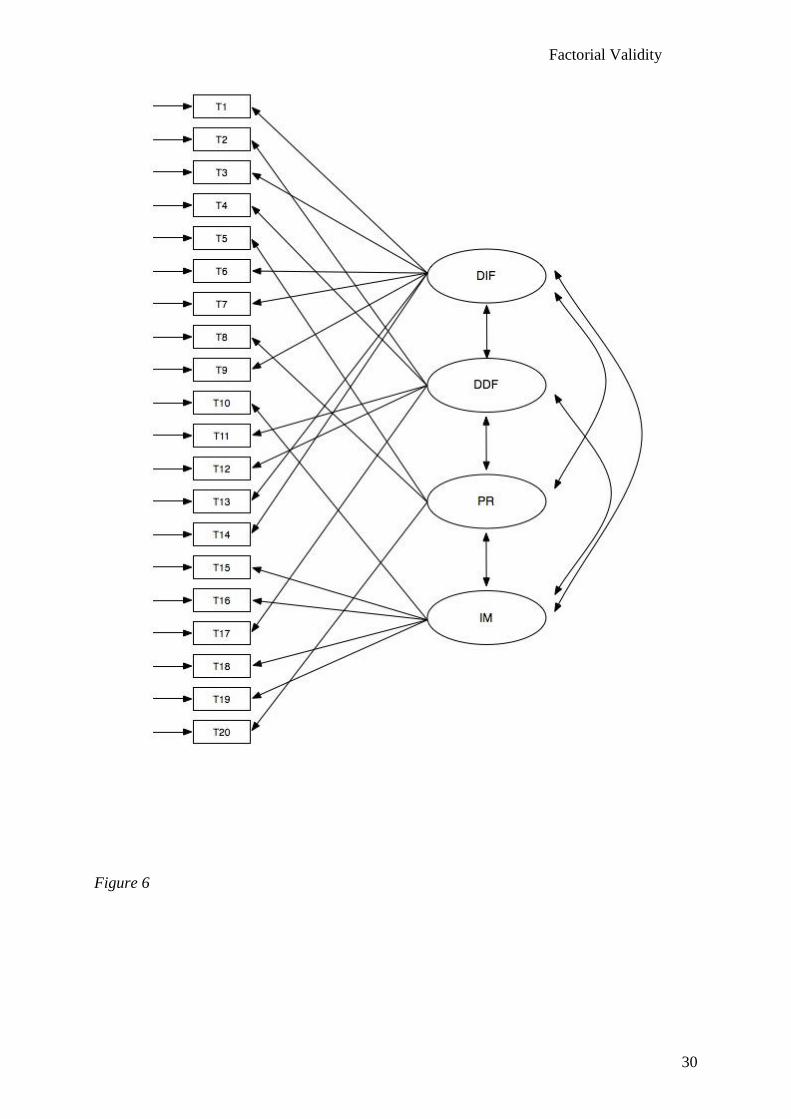
Kannapin, 2000) (see Figure 5); (f) and a model with four factors (DIF, DDF, PR, IM) as was
found by Müller and associates (Müller et al., 2003) (see Figure 6).
Next, for those models described above that provide good fit to the data a model will be
tested with an additional method factor upon which the negatively keyed items load (items 4,
5, 10, 18, 19).
Finally, for the models (d), (e), and (f) a second-order model will be tested, with the
general alexithymia concept as a higher order factor. Normally four first-order factors are
considered necessary to statistically test the fit of one hypothesized second-order factor
because the second-order portion of the model has to be overidentified to be properly tested
for fit (Chen, Sousa, & West, 2005). However, for the three first-order factor models we gain
one additional degree of freedom by specifying an equality constraint between two residuals
Factorial Validity
10
of the first-order factors (Byrne, 2005). As an example, model (d) with a second order factor
‘alexithymia’ is presented in Figure 7.
-Insert Figures 1-7 about here-
Results
First we will look at the six basic first order models (a, b, c, d, e, f). The fit indices for
these models are presented in Table 1. The one-factor model (a) showed a bad fit in both
samples on all fit indices (except for the SRMR in the clinical sample). Also the two-factor
model with 20 items (b) did not fit the data in either sample. Both the RMSEA and the CFI
indicate bad fit, only the SRMR-value is below the cut-off value. The same holds for
Kooiman’s two-factor model with 16 items (c). Model (d) on the other hand shows acceptable
fit at most levels. Only for the RMSEA the values are slightly too high, however the upper
boundary of the 90% confidence interval is below .08. The three-factor model (e) again shows
no acceptable fit on all criteria in either sample, except for the SRMR. Finally the four-factor
model (f) shows comparable fit to model (d). Consequently in both samples models (d) and (f)
have the best fit. Based on our fit criteria both models have acceptable fit at most levels,
except for the somewhat high RMSEA-values. The Lisrel estimates of all factor loadings in
both models (except for item 18 in the student sample) proved to be significant (p < .05). The
standardized estimates are presented in Table 2 and the correlations between the latent factors
in Table 3.
-Insert Tables 1-3 about here-
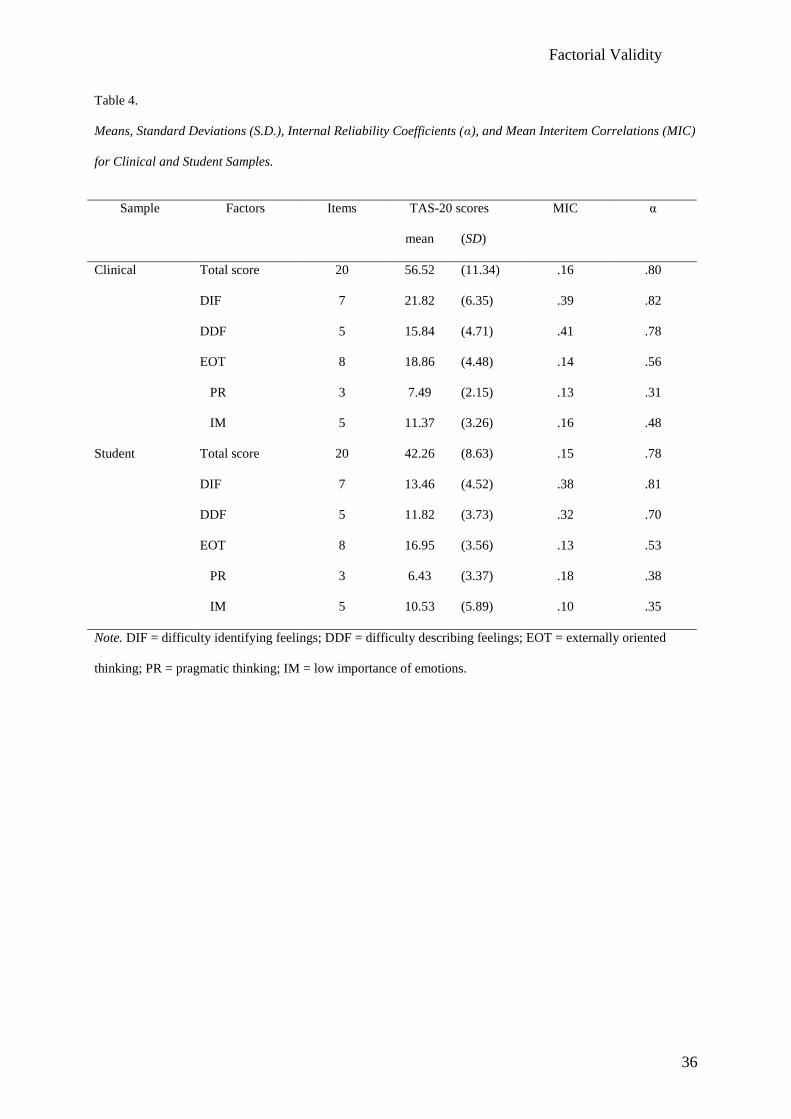
Means, mean inter-item correlations, and internal consistency coefficients of models (d)
and (f) are presented in Table 4. The total TAS-20 score and the factors DIF and DDF prove
to have acceptable internal consistency. The EOT-factor, and its subfactors PR and IM,
however, show low α-coefficients, which is problematic for both models (d) and (f).

Factorial Validity
11
To further test whether model (f) adds in value in relation to model (d) we compared
both models by means of a Satorra-Bentler corrected χ²-differences test. Model (f) showed no
significant differences compared to model (d) in either sample (clinical sample: χ²-difference
= 1.83, df = 3, p = .61; student sample: χ²-difference = .09, df = 3, p = .99). Based on this test
no model can be preferred. However, the high correlations between IM and PR (clinical
sample: r = .79; student sample: r = .98 (Table 3)) indicate that both factors should be
combined. Based on this finding as well as for reasons of parsimony (which is also reflected
in the lower AIC values for the (d) models), we prefer model (d) over model (f).
Subsequently we tested metric invariance of the three-factor solution (d) across the two
samples. We observed that CFI H0 = .906 and CFI H1 = .919. The difference between both
values was larger than .01, which indicates that measurement invariance cannot be assumed.
Consequently we ran a series of 20 tests to locate the items that caused overall absence of
invariance. In these tests we each time allowed one TAS-20 item to have different factor
loadings across samples while all other items were held invariant. Only when item 19 was
allowed to have different factor loadings across samples the CFI-difference became smaller
than .01 (CFI H0 = .91).
Since both models (d) and (f) had acceptable fit, we next tested these models with an
additional method factor for the negatively keyed items. In both samples these models with a
method factor showed an improvement over the same model without the method factor and
this on all fit indices (see Table 5). Also the AIC – which favours more parsimonious models
– was consistently lower in the models with a method factor.
Finally, for models (d), (e), and (f) a second-order model was tested. All fit indices (see
Table 6) indicated a worse fit for the models with a second order factor, except for model (e)
where they have equal values. Also the AIC indicates a worse fit for the second-order models
– even though these models have more degrees of freedom – except for model (e) where
Factorial Validity
12
there is a slightly better AIC value for the second-order model, but the difference is
negligible.
-Insert Tables 4-6 about here-
Discussion
In this study we first tested six basic first-order factor models for the TAS-20 by means
of CFA based on clinical and non-clinical data. The one-factor model provided bad fit and so
did all of the two factor models. Consequently we found no evidence for the model proposed
by Kooiman et al. (2002) for the Dutch TAS-20. Since CFA is a more appropriate method to
investigate factorial validity when there are clear hypotheses, we consider our findings to be
more informative.
Two models did provide good fit to the data and these were the original three-factor
model DIF-DDF-EOT (Bagby, Parker, et al., 1994) and the four-factor model DIF-DDF-PR-
IM (Müller et al., 2003). Based on a χ²- differences test the fit of the two models were not
significantly different. However, correlations between factors IM and PR, in the four-factor
model where high suggesting that collapsing the two would be plausible. Consequently, and
for reasons of parsimony, we select the three-factor model, originally formulated by Bagby
and colleagues as the optimal solution, which has been demonstrated in a number of studies
(for a review see: Taylor et al., 2003).
When we compare our results with those of Müller et al. (2003), a number of differences
can be seen. First, the two-factor model (b) did not provide acceptable fit in either of our
samples, whereas Müller and colleagues found an acceptable fit in the clinical sample.
Second, we could not replicate their finding that the four-factor solution provides a
significantly better fit than the original three-factor model (although this three-factor model
also provided a good fit in the clinical sample of Müller et al.). Third, Müller and colleagues
could not find any good fitting model for the non-clinical sample, whereas we found
Factorial Validity
13
comparable results for both samples. These differences are not due to different cut-off criteria,
because changing these norms would not imply different conclusions. In comparing models
however, our use of the Satorra-Bentler corrected χ², which is more robust for violations of
normality assumptions, might be more informative than the regular χ² used in Müllers study.
However their data did not really violate normality assumptions, so these different χ²’s should
not cause substantially different conclusions. This is therefore not an explanation for the
differing results.
Possible explanations for the failure to replicate the findings of Müller et al. (2003) are
to be found in the sample characteristics and the different language versions of the TAS-20
used for the research. First, our clinical sample was predominantly female, consisted of
outpatients instead of inpatients, and was more heterogeneous than the sample of Müller and
colleagues which was recruited in a hospital for psychosomatic disorders and substance abuse.
The major differences however exist between the non-clinical samples. Our sample was a
student sample, mostly young women, while the sample of Müller et al. was more
representative for the general population. Consequently the results for the non-clinical groups
are hard to compare and more research in the general population is indicated. Second, Müller
and colleagues used the German version of the TAS-20, while we used the Dutch version.
Research with the German TAS-20 shows that four-factor structures have often been found
(Franz, Schneider, Schafer, Schmitz, & Zweyer, 2001; Müller et al., 2003; Ritz & Kannapin,
2000), which may indicate differences at the level of language and/or culture. The correlations
between IM and PR are higher in our sample than in the samples of Müller et al. (2003), and
particularly for the non-clinical sample (clinical sample: r = .70; non-clinical sample: r = .22).
This somewhat clarifies why the four-factor model was significantly different from the three
factor model in the German study. It is hard to make further statements about the relations
between the two components of the EOT factor since a four-factor solution is hardly studied
Factorial Validity
14
in other languages. Recently, Gignac, Palmer, and Stough (in press) did study a model where
EOT was split into PR and IM, but this was in a nested model design with 5 factors that
consists of a general alexithymia factor as well as the DIF, DDF and EOT (PR-IM) factors.
and cAs a consequence of including the general alexithymie factoronsequently their results
are difficult to compare with ours or with Müller and colleagues (2003). The correlation of .41
Gignac et al. (in press) report between IM and PR however does indicate that further research
into the possible existence of two substantially different facets in the EOT-factor is warranted.
Based on our study with a Dutch population the original three factor solution was plausible,
thus indicating that the Dutch translated TAS-20 measures the same constructs as the English
version and that the translation is adequate.
Since we found that the three-factor solution provided an acceptable fit in both samples,
testing metric invariance of the factor solution was the logical next step. Initially the
hypothesis of metric invariance could not be confirmed. However, we found that this was
only due to item 19. Byrne et al. (1989) suggest that since complete metric invariance is
difficult to satisfy, partial invariance – with only a small proportion of the items being
noninvariant – may be enough to meaningfully compare scores across different groups. In this
light, our results suggest that substantive interpretations across different groups are plausible.
It is nonetheless important to further investigate metric invariance of the TAS-20 factor
structure across other groups – also across cultures – and to identify items that may be
interpreted differently by different groups. A possible explanation for the difference between
groups for item 19 lies in its explicit referral to personal problems, which may have another
connotation for students than for patients since the latter precisely search help for personal
problems.
Even though our results indicate that the three-factor structure can be found in the Dutch
TAS-20, like many other researchers who use English and non-English versions of the TAS-
Factorial Validity
15
20, we found a problem with the internal consistency of the EOT-factor. Considering it is so
widespread, this problem seems to be more due to characteristics of the instrument itself
rather than to translation adequacy and needs future attention. Possible directions are revision
of the negatively formulated items, which seem to be problematic in several studies (see also
Taylor et al., 2003), and revision of the items which repeatedly showed lower factor loadings
(Müller et al., 2003; Bressi et al., 1996; Pandey et al., 1996; Simonsson, Sarnecki et al.,
2000).
Because of the possible influence of the negatively keyed items, we also tested first-
order models with an additional method factor to explicitly test whether there is a method
effect induced by these items. All these models provided better fit than the models without a
method factor. This raises questions about the use of negatively formulated items in
questionnaires. If the method itself appears to have such an influence on the answers, maybe
revision of these items should be considered. However, we agree with Gignac and colleagues
(in press) that the existence of a method factor does not preclude the existence of a
substantive EOT-factor.
Finally, we found no evidence for the assumed general alexithymia factor underlying the
first-order factors. This is surprising given the theoretical view. However, when we look at the
correlations between the first-order factors, we consistently see a very low correlation
between DIF and EOT (or split into PR and IM). In model (e) the second-order model showed
about equal fit than the first-order model. This is probably due to the fact that DIF and DDF
are collapsed and the items of DDF cause a substantial correlation with PR and IM. However,
this model with DIF and DDF as one factor and EOT split into PR and IM did not show a
good fit in the first place, so it is not useful to continue investigating this model. Gignac et al.
(in press) did not find support for a hierarchic model with alexithymia as second order factor
either. However, based on the very strict cut-off norms of Hu and Bentler (1999) they also

Factorial Validity
16
rejected the three factor model. As an alternative they defend the use of nested models, but
theoretical bases for this technique seem questionable. In these models with general and
narrow first order factors, all items are supposed to load on the general alexithymia factor, but
the factors (DIF, DDF, EOT (PR-IM)) that theoretically are considered dimensions of
alexithymia are not considered to mediate these associations. This implies that other variance
of the items is considered to be explained by general alexithymia than the variance explained
by the alexithymia-dimensions. This leads also to the question which grounds are used to
consider this general first order factor as alexithymia. It might for example also be
hypothesized a negative affectivity factor, since negative affectivity is considered to influence
answers on the TAS-20 (Lumley, 2000). So, maybe the nested models technique is
statistically correct, it leaves us without a frame of reference to interpret results (for example:
how should we interpret a DIF-score separated from alexithymia?) and thus appears clinically
not useful. So we agree with Bagby, Taylor, Quilty, and Parker (in press) that these authors do
not offer theoretical (nor empirical) grounds to defend this strategy.
The fact that a second-order factor for the two plausible models (d, e) appears not likely
from our results, however does challenge the theory on alexithymia. It appears that it cannot
simply be assumed that DIF and DDF on the one side and EOT (or PR and IM) on the other
side are dimensions of one underlying construct. However, rather than immediately question
the theory, it is also possible that this is due to measurement problems. Often self-report
measures for a concept like alexithymia have been criticized. First, it is argued that it is
paradoxical to ask people to judge a capacity they may lack (Waller & Scheidt, 2004).
Second, answers on the TAS-20 are greatly influenced by negative affectivity (Lumley, 2000)
and this influence is larger for the DIF and DDF subscales than for the EOT subscale.
Consequently one can wonder what we measure by means of the TAS-20, and especially with
the DIF and DDF subscales. Future research should aim at including non-self-report methods

Factorial Validity
17
to measure alexithymia to clear out the dimensionality of the concept. The recently developed
Toronto Structured Interview for Alexithymia (Bagby, Taylor, Parker, & Dickens, 2006)
seems a valuable instrument to include in research on this issue. First, it provides an
alternative for the self-report measures and thus overcomes its reported weaknesses. Second,
it is based on the same alexithymia definition as the TAS-20, but it also includes questions
that measure reduced fantasy and imaginal thinking (IMP), an aspect of alexihtymia that was
removed from the TAS since it showed to be difficult to measure reliably by means of a self-
report scale (Bagby, Parker, Taylor, 1994). Preliminary research indeed showed four factors
(facet scales: DIF, DDF, EOT, IMP) and two higher order domain scales (affect awareness:
DIF + DDF; operative thinking: EOT + IMP) (Bagby et al., 2006); however further research
is necessary to confirm these results. In sum, studies including this instrument could solve
problems with self-report measures and help clarify the issue of dimensionality of the
alexithymia concept. In general we agree with the authors of the TAS-20 that alexithymia
should be measured using multiple methods.
There were some limitations to the present study. First, our student sample was
somewhat small, which may affect the generalizability of our results for this group. This
group is also rather homogeneous concerning age and social profile and consequently cannot
be considered a good representative of the general population. Next, the greater number of
women in both samples may pose limitations on the validity of these results for men.
However in the clinical sample we believe the number of men was large enough to result in
valid information. Also concerning the bad fit of the second-order models (and the low
correlations between DIF and DDF), influence of sample characteristics cannot be excluded.
Further research which includes different factor models, investigates the possibility of a
method factor and considers second-order models in clinical and non-clinical samples is thus
indicated.

Factorial Validity
18

Factorial Validity
19
References
Bagby, R.M., Parker, J.D.A., & Taylor, G.J. (1994). The twenty-item Toronto Alexithymia
Scale – I. Item selection and cross-validation of the factor structure. Journal of
Psychosomatic Research, 38, 23-32.
Bagby, R.M., Taylor, G.J., & Parker, J.D.A. (1994). The twenty-item Toronto Alexithymia
Scale – II. Convergent, discriminant, and concurrent validity. Journal of Psychosomatic
Research, 38, 33-40.
Bagby, R.M., Taylor, G.J., & Parker, J.D.A., & Dickens, S.E. (2006). The development of the
Toronto Structured Interview for Alexithymia: item selection, factor structure, reliability
and concurrent validity. Psychotherapy and Psychosomatics, 75, 25-39.
Bagby, R.M., Taylor, G.J., Quilty, L.C., & Parker, J.D.A. (in press). Re-examining the factor
structure of the 20-item Toronto Alexithymia Scale: commentary on Gignac, Palmer, and
Stough. Journal of Personality Assessment.
Bressi, C., Taylor, G., Parker, J., Bressi, S., Brambilla, V., Aguglia, E., et al. (1996). Cross
validation of the factor structure of the 20-item Toronto Alexithymia Scale : an Italian
multicenter study. Journal of Psychosomatic Research, 41, 551-559.
Browne, M.W., & Cudeck, R. (1993). Alternative ways of assessing model fit. In K.A. Bollen
& J.S. Long (Eds.), Testing structural equation models (pp. 136-162). Newbury Park, CA:
Sage.
Byrne, B.M. (2005). Factor analytic models: viewing the structure of an assessment
instrument from three perspectives. Journal of Personality Assessment, 85, 17-32.
Byrne, B.M., Shavelson, R.J., Muthèn, B. (1989). Testing for the equivalence of factor
covariance and mean structures: the issue of partial measurement invariance.
Psychological Bulletin, 105, 456-466.

Factorial Validity
20
Chen, F.F., Sousa, K.H., & West, S.G. (2005). Testing measurement invariance of second-
order factor models. Structural Equation Modeling, 12, 471-492.
Chueng, G.W., & Rensvold, R.B. (2002). Evaluating goodness-of-fit indexes for testing
measurement invariance. Structural Equation Modeling, 9, 233-255.
De Gucht, V., Fontaine, J., & Fischler, B. (2004). Temporal stability and differential
relationships with neuroticism and extraversion of the three subscales of the 20-item
Toronto Alexithymia Scale in clinical and non-clinical samples. Journal of Psychosomatic
Research, 57, 25-33.
Erni, T., Lotscher, K., & Modestin, J. (1997). Two-factor solution of the 20-item Toronto
Alexithymia Scale confirmed. Psychopathology, 30, 335-340.
Franz, M., Schneider, C., Schafer, R., Schmitz, N., & Zweyer, K. (2001). Factorial structure
and psychometric properties of the German version of the Toronto Alexithymia Scale
(TAS-20) of psychosomatic patients. Psychotherapie Psychosomatik Medizinische
Psychologie, 51, 48-55.
Gignac, G.E., Palmer, B.R., & Stough, C. (in press). A confirmatory factor analytic
investigation of the TAS-20: corroboration of a five factor model and suggestions for
improvement. Journal of Personality Assessment.
Haviland, M.G., & Reise, S.P. (1996). Structure of the twenty-item Toronto Alexithymia
Scale. Journal of Personality Assessment, 66, 116-125.
Hu, L., & Bentler, P.M. (1998). Fit indices in covariance structure modelling: sensitivity to
underparametrized model misspecification. Psychological Methods, 3, 424-453.
Hu, L., & Bentler, P.M. (1999). Cutoff criteria for fit indexes in covariance structure analysis:
conventional criteria versus new alternatives. Structural Equation Modeling, 6, 1-55.
Jöreskog, K.G., & Sörbom, D. (1993). LISREL 8: Structural Equation Modeling with the
SIMPLIS command language. Chicago: SSI Scientific Software International.

Factorial Validity
21
Joukamaa, M., Miettunen, J., Kokkonen, P., Koskinen, M., Julkunen, J., Kauhanen, J., et al.
(2001). Psychometric properties of the Finnish 20-item Toronto Alexithymia Scale.
Nordic Journal of Psychiatry, 55, 123-127.
Komaki, G., Maeda, M., Arimura, T., Nakata, A., Shinoda, H., Ogata, I., et al. (2003). The
reliability and factorial validity of the Japanese version of the 20-item Toronto
Alexithymia Scale. Journal of Psychosomatic Research, 55, 143.
Kooiman, C.G., Spinhoven, P., & Trijsburg, R.W. (2002). The assessment of alexithymia. A
critical review of the literature and a psychometric study of the Toronto Alexithymia
Scale-20. Journal of Psychosomatic Research, 53, 1083-1090.
Loas, G., Corcos, M., Stephan, P., Pellet, J., Bizouard, P., Venisse, J.L., et al. (2001).
Factorial structure of the 20-item Toronto Alexithymia Scale. Confirmatory factorial
analyses in nonclinical and clinical samples. Journal of Psychosomatic Research, 50, 255-
261.
Loas, G., Otmani, O., Verrier, A., Fremaux, D., & Marchand M.P. (1996). Factor analysis of
the French version of the 20-item Toronto alexithymia scale. Psychopathology, 29, 139-
144.
Lumley, M.A. (2000). Alexithymia and negative emotional conditions. Journal of
Psychosomatic Research, 49, 51-54.
Marsh, H.W., Hau, K.T., & Wen, Z. (2004). In search of golden rules: comment on
hypothesis-testing approaches to setting cutoff values for fit indexes and dangers in
overgeneralizing Hu and Bentler’s (1999) findings. Structural Equation Modeling, 11,
320-341.
Müller, J., Bühner, M., & Ellgring, H. (2003). Is there a reliable factorial structure in the 20-
item Toronto Alexithymia Scale? A comparison of factor models in clinical and normal
adult samples. Journal of Psychosomatic Research, 55, 561-568.
Factorial Validity
22
Pandey, R., Mandal, M.K., Taylor, G.J., & Parker, J.D.A. (1996). Cross-cultural alexithymia:
development and validation of a Hindi translation of the 20-item Toronto Alexithymia
Scale. Journal of Clinical Psychology, 52, 173-176.
Parker, J.D.A., Bagby, R.M., Taylor, G.J., Endler, N.S., & Schmitz, P. (1993). Factorial
validity of the 20-item Toronto Alexithymia Scale. European Journal of Personality, 7,
221-232.
Parker, J.D.A., Shaughnessy, P.A., Wood, L.M., Majeski, S.A., & Eastabrook, J.M. (2005).
Cross-cultural alexithymia validity of the 20-item Toronto Alexithymia Scale in North
American aboriginal populations. Journal of Psychosomatic Research, 58, 83-88.
Parker, J.D.A., Taylor, G.J., & Bagby, R.M. (2003). The 20-item Toronto Alexithymia Scale.
III. Reliability and factorial validity in a community population. Journal of Psychosomatic
Research, 55, 269-275.
Ritz, T., & Kannapin, O. (2000). Zur Konstruktvalidität einer deutschen Fassung der Toronto
Alexithymia Scale [Construct validity of a German version of the Toronto Alexithymia
Scale]. Zeitschrift für Differentielle und Diagnostische Psychologie, 21, 49-64.
Sifneos, P.E. (1973). Prevalence of alexithymic characteristics in psychosomatic patients.
Psychotherapy and Psychosomatics, 22, 255-262.
Simonsson-Sarnecki, M., Lundh, L.G., Törestad, B., Bagby, R.M., Taylor, G.J., & Parker,
J.D.A. (2000). A Swedish translation of the 20-item Toronto Alexithymia Scale: Cross-
validation of the factor structure. Scandinavian Journal of Psychology, 41, 25-30.
Tanaka, J.S. (1993). Multifaceted conceptions of fit in structural equation models. In K.A.
Bollen, & J.S. Long (Eds.), Testing Structural Equation Models (pp. 10-39). London:
Sage.
Taylor, G.J., Bagby, R.M., & Parker, J.D.A. (1997). Disorders of affect regulation.
Cambridge: University Press.
Factorial Validity
23
Taylor, G.J., Bagby, R.M., & Parker, J.D.A. (2003). The 20-item Toronto Alexithymia Scale.
IV. Reliability and factorial validity in different languages and cultures. Journal of
Psychosomatic Research, 55, 277-283.
Waller, E., & Scheidt, C.E. (2004). Somatoform disorders as disorders of affect regulation. A
study comparing the TAS-20 with non-self-report measures of alexithymia. Journal of
Psychosomatic Research, 57, 239-247.

Factorial Validity
24
Titles Figures
Figure 1. Model (a); T1, T2, …, T20 = TAS-20 item 1, item 2, …, item 20; ALEX =
alexithymia.
Figure 2. Model (b); T1, T2, …, T20 = TAS-20 item 1, item 2, …, item 20; DIFDDF =
factor 1: difficulty identifying and describing feelings; EOT = factor 2: externally oriented
thinking.
Figure 3. Model (c); T1, T2, …, T15, T19 = TAS-20 item 1, item 2, …, item 15, item
19; DIFDDF = factor 1: difficulty identifying and describing feelings; EOT = factor 2:
externally oriented thinking.
Figure 4. Model (d); T1, T2, …, T20 = TAS-20 item 1, item 2, …, item 20; DIF = factor
1: difficulty identifying feelings; DDF = factor 2: difficulty describing feelings; EOT = factor
3: externally oriented thinking.
Figure 5. Model (e); T1, T2, …, T20 = TAS-20 item 1, item 2, …, item 20; DIFDDF =
factor 1: difficulty identifying and describing feelings; PR = factor 2: pragmatic thinking; IM
= factor 3: lack of importance of emotions.
Figure 6. Model (f); T1, T2, …, T20 = TAS-20 item 1, item 2, …, item 20; DIF= factor
1: difficulty identifying feelings; DDF = factor 2: difficulty describing feelings; PR = factor 3:
pragmatic thinking; IM = factor 4: lack of importance of emotions.
Figure 7. Second order model (d); T1, T2, …, T20 = TAS-20 item 1, item 2, …, item
20; DIF = factor 1: difficulty identifying feelings; DDF = factor 2: difficulty describing
feelings; EOT = factor 3: externally oriented thinking; ALEX = second order factor:
alexithymia.

Factorial Validity
25
Figure 1

Factorial Validity
26
Figure 2
Factorial Validity
27
Figure 3
Factorial Validity
28
Figure 4

Factorial Validity
29
Figure 5
Factorial Validity
30
Figure 6

Factorial Validity
31
Figure 7

Factorial Validity
32
Table 1
Fit Indices for Model (a), (b), (c), (d), (e), and (f)
Sample Model Number of items df SB-χ² SRMR RMSEA (90%CI) CFI AIC
clinical (a) alex 20 170 918.35 .089 .100 (.098 - .110) .80 998.35
(b) dif/ddf-eot 20 169 672.23 .079 .086 (.079 - .093) .86 754.23
(c) dif/ddf-eot 16 103 480.59 .082 .095 (.087 - .010) .88 546.59
(d) dif-ddf-eot 20 167 453.71 .068 .065 (.058 - .073) .92 539.71
(e) dif/ddf-pr-im 20 167 675.07 .078 .087 (.080 - .094) .86 761.07
(f) dif-ddf-pr-im 20 164 454.86 .068 .066 (.059 - .074) .92 546.86
student (a) alex 20 170 411.26 .095 .095 (.084 - .110) .79 491.26
(b) dif/ddf-eot 20 169 337.50 .085 .080 (.067 - .092) .86 419.50
(c)dif/ddf-eot 16 103 207.29 .081 .081 (.065 - .096) .90 273.29
(d) dif-ddf-eot 20 167 267.12 .081 .062 (.048 - .076) .91 353.12
(e) dif/ddf-pr-im 20 167 336.94 .085 .081 (.068 - .093) .85 422.94
(f) dif-ddf-pr-im 20 164 266.08 .081 .063 (.049 - .077) .91 358.08
Note. df = degrees of freedom; SB-χ² = Satorra-Bentler Scaled Chi-Square; SRMR = standardized root mean square residual; RMSEA = root mean square error of
approximation; (90% CI) = 90% confidence interval of the RMSEA; CFI = comparative fit index; AIC = Akaike Information Criteria. All χ² were significant with p < .01.
Models (a), (b), (c), (d), (e) and (f) as described in Methods; alex = alexithymia; dif = difficulty identifying feelings; ddf = difficulty describing feelings; eot = externally
oriented thinking; pr = pragmatic thinking; im = lack of importance of emotions.
Factorial Validity
33
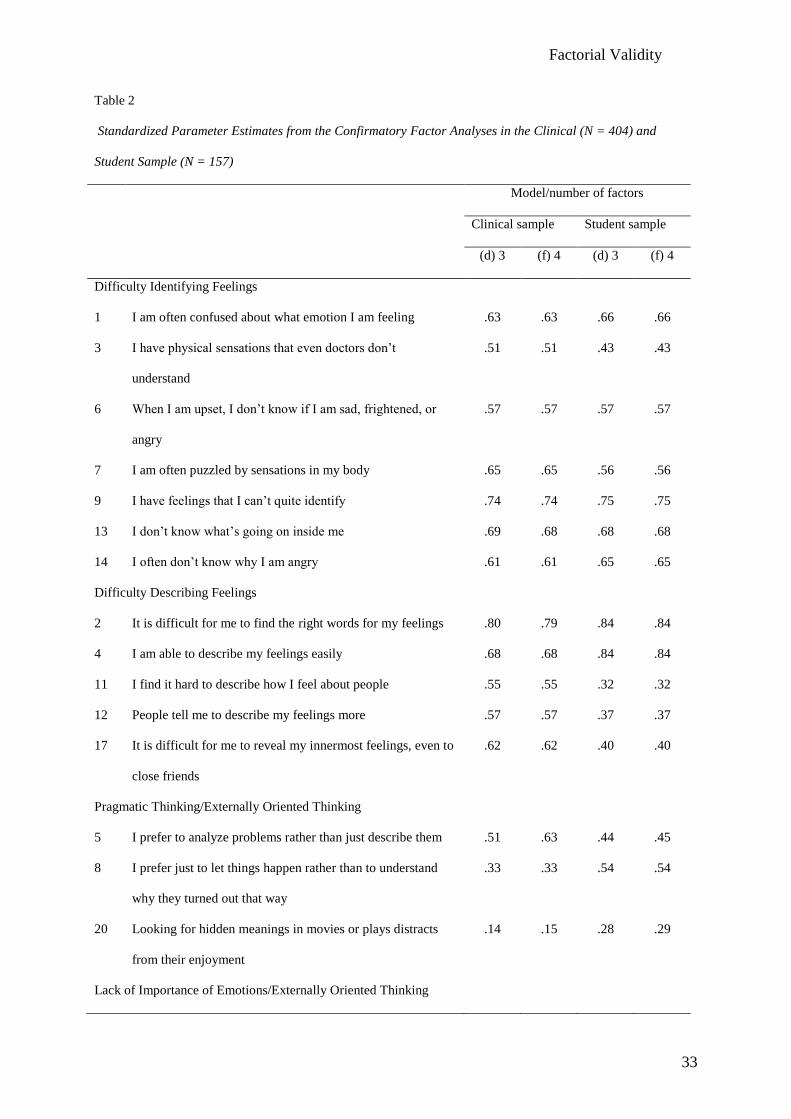
Table 2
Standardized Parameter Estimates from the Confirmatory Factor Analyses in the Clinical (N = 404) and
Student Sample (N = 157)
Model/number of factors
Clinical sample Student sample
(d) 3 (f) 4 (d) 3 (f) 4
Difficulty Identifying Feelings
1 I am often confused about what emotion I am feeling .63 .63 .66 .66
3 I have physical sensations that even doctors don’t
understand
.51 .51 .43 .43
6 When I am upset, I don’t know if I am sad, frightened, or
angry
.57 .57 .57 .57
7 I am often puzzled by sensations in my body .65 .65 .56 .56
9 I have feelings that I can’t quite identify .74 .74 .75 .75
13 I don’t know what’s going on inside me .69 .68 .68 .68
14 I often don’t know why I am angry .61 .61 .65 .65
Difficulty Describing Feelings
2 It is difficult for me to find the right words for my feelings .80 .79 .84 .84
4 I am able to describe my feelings easily .68 .68 .84 .84
11 I find it hard to describe how I feel about people .55 .55 .32 .32
12 People tell me to describe my feelings more .57 .57 .37 .37
17 It is difficult for me to reveal my innermost feelings, even to
close friends
.62 .62 .40 .40
Pragmatic Thinking/Externally Oriented Thinking
5 I prefer to analyze problems rather than just describe them .51 .63 .44 .45
8 I prefer just to let things happen rather than to understand
why they turned out that way
.33 .33 .54 .54
20 Looking for hidden meanings in movies or plays distracts
from their enjoyment
.14 .15 .28 .29
Lack of Importance of Emotions/Externally Oriented Thinking

Factorial Validity
34
10 Being in touch with emotions is essential .42 .43 .35 .35
15 I prefer talking to people about their daily activities rather
than their feelings
.60 .61 .26 .25
16 I prefer to watch “light” entertainment shows rather than
psychological dramas
.46 .46 .24 .24
18 I can feel close to someone, even in moments of silence .23 .23 .14* .14*
19 I find examination of my feelings useful in solving personal
problems
.29 .28 .68 .68
Note. Items 4, 5, 10, 18 and 19 are negatively keyed.
Models (d) and (f) as described in Methods.
*Not significant at p < .05

Factorial Validity
35
Table 3
Estimated Correlations between TAS-20 Factors for Three- (d) and Four-Factor Models.
Model Factors F1 F2 F3 F4
(d) F1: DIF - .66* .10
F2: DDF .67* - .28*
F3: EOT .13 .32* -
(f) F1: DIF - .66* .11 .08
F2: DDF .67* - .27* .28*
F3: PR .05 .30* - .98*
F4: IM .14 .30* .79* -
Note. Correlations for the student sample: above the diagonal; for the clinical sample: below the diagonal.
Models (d) and (f) as described in Methods; DIF: difficulty identifying feelings; DDF: difficulty describing
feelings; EOT: externally oriented thinking; PR: pragmatic thinking; IM: lack of importance of emotions.
* p < .05
Factorial Validity
36
Table 4.
Means, Standard Deviations (S.D.), Internal Reliability Coefficients (α), and Mean Interitem Correlations (MIC)
for Clinical and Student Samples.
Sample Factors Items TAS-20 scores MIC α
mean (SD)
Clinical Total score 20 56.52 (11.34) .16 .80
DIF 7 21.82 (6.35) .39 .82
DDF 5 15.84 (4.71) .41 .78
EOT 8 18.86 (4.48) .14 .56
PR 3 7.49 (2.15) .13 .31
IM 5 11.37 (3.26) .16 .48
Student Total score 20 42.26 (8.63) .15 .78
DIF 7 13.46 (4.52) .38 .81
DDF 5 11.82 (3.73) .32 .70
EOT 8 16.95 (3.56) .13 .53
PR 3 6.43 (3.37) .18 .38
IM 5 10.53 (5.89) .10 .35
Note. DIF = difficulty identifying feelings; DDF = difficulty describing feelings; EOT = externally oriented
thinking; PR = pragmatic thinking; IM = low importance of emotions.

Factorial Validity
37
Table 5
Fit indices for model (d) + Method Factor and model (f) + Method Factor
Sample Model Number of
items
df SB-χ² SRMR RMSEA (90%CI) CFI AIC
clinical (d) dif-ddf-eot + method factor 20 159 413.22 .062 .063 (.056 - .070) .93 515.22
(f) dif-ddf-pr-im + method factor 20 155 410.75 .061 .064 (.057 - .072) .93 520.75
student (d) dif-ddf-eot + method factor 20 159 247.39 .077 .060 (.045 - .074) .92 349.39
(f) dif-ddf-pr-im + method factor 20 155 232.19 .074 .056 (.041 - .071) .93 342.19
Note. df = degrees of freedom; SB-χ² = Satorra-Bentler Scaled Chi-Square; SRMR = standardized root mean square residual; RMSEA = root mean square error of
approximation; (90% CI) = 90% confidence interval of the RMSEA; CFI = comparative fit index; AIC = Akaike Information Criteria. All χ² were significant with p < .01.
Models (d) and (f) as described in Methods; dif = difficulty identifying feelings; ddf = difficulty describing feelings; eot = externally oriented thinking; pr = pragmatic
thinking; im = lack of importance of emotions.

Factorial Validity
38
Table 6
Fit Indices for Second Order Models.
Sample Model Number of
items
df SB-χ² SRMR RMSEA (90%CI) CFI AIC
clinical (d) dif-ddf-eot second order model 20 168a 464.59 .082 .066 (.059 - .073) .92 548.59
(e) dif/ddf-pr-im second order model 20 168a 675.93 .078 .087 (.080 - .094) .86 759.93
(f) dif-ddf-pr-im second order model 20 166 530.66 .076 .074 (.067 - .081) .90 618.66
student (d) dif-ddf-eot second order model 20 168a 273.20 .089 .063 (.049 - .077) .91 357.20
(e) dif/ddf-pr-im second order model 20 168a 337.39 .085 .080 (.068 - .093) .85 421.39
(f) dif-ddf-pr-im second order model 20 166 296.47 .089 .071 (.058 - .084) .89 384.47
Note. df = degrees of freedom; SB-χ² = Satorra-Bentler Scaled Chi-Square; SRMR = standardized root mean square residual; RMSEA = root mean square error of
approximation; (90% CI) = 90% confidence interval of the RMSEA; CFI = comparative fit index; AIC = Akaike Information Criteria. All χ² were significant with p < .01.
Models (d), (e) and (f) as described in Methods; dif = difficulty identifying feelings; ddf = difficulty describing feelings; eot = externally oriented thinking; pr = pragmatic
thinking; im = lack of importance of emotions.
a the
additional degree of freedom for these second order models is obtained by the specification of an equality constraint between two residuals for purposes of model
identification at the higher-order level.