factor exposure indices – index construction...
TRANSCRIPT

Factor Exposure Indices – Index Construction Methodology
FTSE RUSSELL PAPER
FTSE Index Construction Methodology.qxp_Layout 1 05/08/2015 14:03 Page 1

2
Contents
Introduction 3
1. Factor Design and Construction 5
2. Single Factor Index Methodology 6
3. Combining Factors 12
4. Constraints 13
5. Factor Index Example 15
6. Conclusions 32
Appendix A. Regression Analysis 33
Appendix B. Capacity, Diversification and Factor Exposure 35
References 36
Factor Exposure Indices – Index Construction Methodology
FTSE Index Construction Methodology.qxp_Layout 1 05/08/2015 14:03 Page 2

3
Introduction
The premise of a factor approach to indices is to construct astock index that has an intentional and greater exposure to afactor of interest than a given benchmark. By factor, we mean astock level characteristic such as volatility or value representedby for example, Book to Price. When the benchmark is theMarket Portfolio and a positive excess return (or factorpremium) exists over the long term, this is often termed a“factor anomaly”, contradicting as it does the “Efficient MarketHypothesis”. Anomalies such as the “value effect” ([1], [2]),“size effect” ([1], [2]) and “momentum effect” ([3], [4]) are welldocumented. FTSE’s aim is not to justify the existence of suchanomalies, but to set out a systematic methodology for theconstruction of transparent indices that exhibit an intentionaland controlled exposure to the factor(s) of choice.
Interest in a factor approach has been rekindled. This stemsfrom a belief that additional within asset class risk premia exist,and may be captured in a systematic low cost manner [8, 9].Factor tilts represent a significant component of the valueadded by traditional active managers and factor approaches todiversification may be more effective in achievingdiversification objectives [7] .
Alternatively weighted indices frequently exhibit factor tilts.However, typically the objective of such indices is not factorrelated. Diversification is the key to avoiding concentration andis the premise on which many alternatively weighted indices,from Equal Risk Contribution to Maximum Diversificationindices are constructed. Minimum Variance indices explicitlytarget reductions in index volatility. Whilst the objective ofindividual alternatively weighted indices differs, a commonthread is the presence of a specific, non-factor objective.
The historical performance of alternatively weighted indiceshas generated huge debate. The consensus is that observedhistorical out-performance is driven largely by value and smallcapitalisation factor tilts along with rebalancing gains [5, 6].This has resulted in a re-evaluation of the merits of factorbased approaches to investing and has led some to concludethat alternatively weighted indices are the appropriatemechanism for accessing factor risk premia.
This is overly simplistic; the majority of alternatively weightedindices have very specific non-factor objectives; factoroutcomes are incidental rather than the result of consciousdesign choices. The FTSE Minimum Variance indices typicallyexhibit small capitalisation and low volatility tilts. The degree towhich such tilts are systematic is debatable, but what isundeniable is that the index does not directly target either ofthese outcomes and the additional complexity of a minimumvariance approach is unnecessary for the capture of any lowvolatility factor premium.
Style and factor indices have been available for many years, butthe role of these original products was largely to fulfill abenchmarking or performance and risk attribution function asopposed to representing replicable indices, designed tocapture the performance of specific factor objectives. FTSEbelieves that second generation factor indices should employ acommon construction methodology, that directly targets aspecific factor objective, with due consideration fordiversification, capacity and ease of replication.
Factor Exposure Indices – Index Construction Methodology
FTSE Index Construction Methodology.qxp_Layout 1 05/08/2015 14:03 Page 3
4
Consequently, we emphasise that factor indices andalternatively weighted indices are not necessarilyinterchangeable. A factor index sets out to capture factorexposures in a controlled and considered way. An alternativelyweighted index sets out to achieve some other goal and mayincidentally achieve factor exposures. For example, a lowvolatility factor index with exposure to low volatility stocks isnot the same as a minimum volatility index. This is clearly seenby noting that the pattern of cross-correlations may allowpotentially volatile stocks to represent large weightings in aminimum volatility index, whereas such stocks must necessarilyrepresent a relatively small proportion of any low volatilityfactor index. The factor index provides exposure to low volatilitystocks, whereas the minimum volatility index minimises totalindex volatility which may (or may not) give incidental exposureto low volatility stocks.
Maximising exposure to a particular factor is not the onlycriterion of interest; factor indices must also be “investable”.That is, the degree of capacity, liquidity and concentration arealso considerations. For example, if the sole objective is“maximum factor exposure” we would simply devise an indexconsisting of a single stock with the maximum factor value.Such a maximally undiversified index would be anathema toinvestors. Indeed the design of factor indices is furthercomplicated by the fact that factor objectives and investablecharacteristics are often inversely related. In what follows wedemonstrate how to attain a balance across both of thesefeatures.
Finally, we address the question of how to create multiple-factor indices; how does one ensure simultaneous exposure tomore than one factor? When there is a reasonable positivecorrelation between factors, simple addition of individual factorindex weights may be sufficient. However, when factors areanti-correlated, such an approach breaks down. To address thisproblem we introduce the notion of multiple-tilting.
The structure of this document is as follows. In Section 1 wediscuss factor design. In Section 2 we set out a methodologyfor the construction of a single factor index by applying a “tilt”to the weights of some other (underlying) index. In Section 3we discuss alternative approaches to constructing multiple-factor indices. In Section 4 we consider the role and applicationof constraints. Section 5 investigates how the material set outin the previous four Sections may be applied to a concreteexample. Finally we summarise our results and conclusions inSection 6.
Factor Exposure Indices – Index Construction Methodology
FTSE Index Construction Methodology.qxp_Layout 1 05/08/2015 14:03 Page 4

5
1. Factor Design and Construction
1.1 Factor Definition
An important determinant of the behaviour of any factor indexis the definition of the factor itself. For example should a valuefactor be based on a single valuation ratio or be comprised of acomposite of different ones? Should such a compositecomprise “equally-weighted” factors or should it be moreheavily weighted to “more important” ones?
The answers to these questions are generally factor specificand preferably based on theoretical work supported byempirical results. The bulk of this document is concerned withwhat happens after a factor has been created; that is how it isturned into an index. We discuss the detailed construction ofValue, Residual Momentum and Quality factors used in theFTSE Global Factor Index Series in a set of separate papers.However, there are some general techniques used during theconstruction of factors that are important to highlight.
1.2 Factor Neutralisation
Sometimes factor A will be highly correlated with anotherfactor B. One may be interested in defining a “pure A factor”that is not confounded by a signal from factor B. There arevarious techniques that can be used to remove that part offactor A, which is strongly correlated to factor B.
As an example, consider the case where factor B represents theindustrial grouping of a stock. More specifically, assume thatfactor A is correlated with particular industry groupings and it isdesirable to remove this dependence such that any index doesnot reflect this industry bias. A simple approach is to redefinethe stock level factor within a particular industry by measuringit relative to the mean value of the factor within that industry.This ensures all industries are equivalent from a factorperspective. Since the factor is now a relative measure, industrybiases in any index based on the re-defined factor will belimited. We discuss a possible application of this, which aids theimplementation of Industry and Country constraints, inSection 5.
More sophisticated approaches, which identify independentcountry and industry factor effects and assess the significanceof these effects, are possible.
An alternative approach to limiting unintended factor positionsis to apply constraints during the index construction process.We discuss possible approaches to implementing constraints inSection 4.
1.3 Composite Factors
There are several approaches to simultaneously achieving tiltstowards multiple factors. The distinction between forming anindex based on a composite of indices and a composite factoris discussed in Section 3.
Factor Exposure Indices – Index Construction Methodology
FTSE Index Construction Methodology.qxp_Layout 1 05/08/2015 14:03 Page 5

6
2. Single Factor Index Methodology
2.1. Calculation of Factor Z-Scores
Consider a universe of stocks and let be some factor thattakes real values for stocks within some subset of . Thenwe define the Z-Score of the factor for stocks in the usual way:
where and are the cross-sectional mean and standarddeviation of the factor. Stocks with Z-Scores less than minusthree are set to minus three and those with Z-Scores greaterthan three are set to three. The Z-Scores are then recalculated.This process is repeated iteratively until all remaining stockshave absolute Z-Scores less than or equal to three.
2.2 Mapping Z-Scores to Scores
Z-Scores are now assigned a score, to determinethe weights in the factor index. The functional form we use isbased on the cumulative normal:
If the whole universe is to be weighted, stocks in (i.e. without real factor values) are assigned the score
or alternatively assigned a neutral value of
The cumulative normal mapping has several advantages overother commonly used mappings, such as:
An additional mapping that is of interest is:
for some chosen minimum value
This mapping can be used to derive a set of “Value Weighted”or "Fundamentally Weighted" indices, an example of which isdiscussed in Section 5.
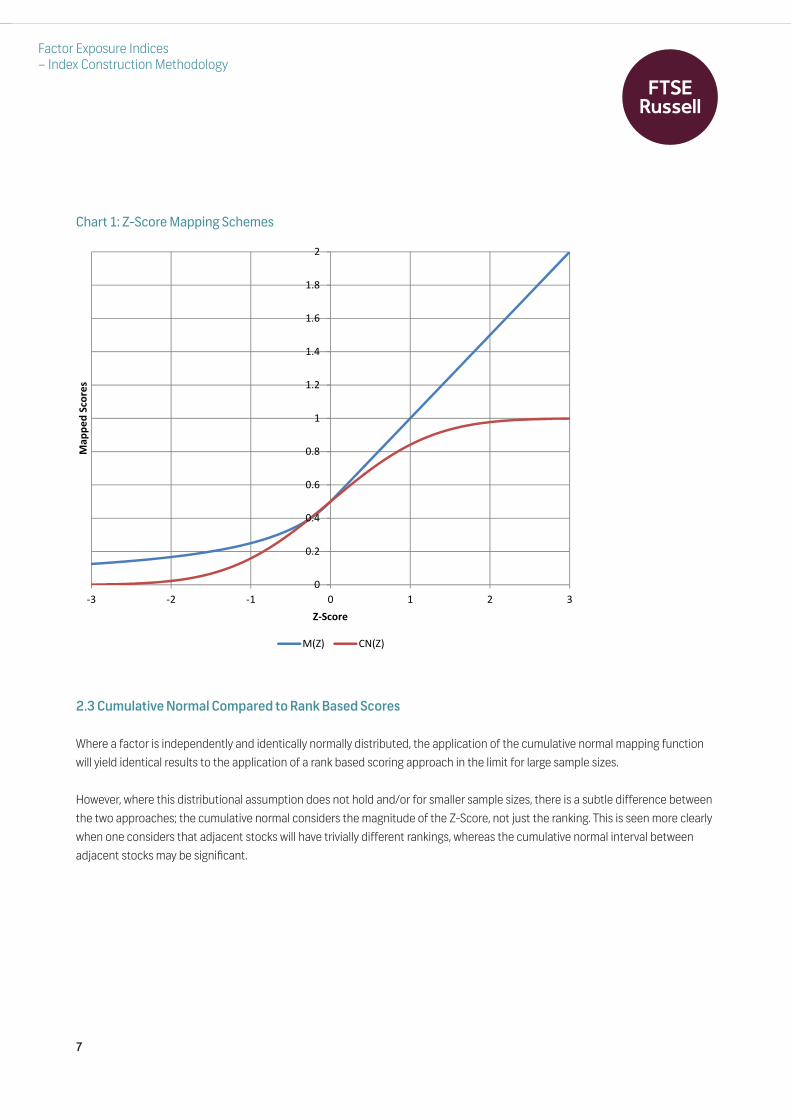
Chart 1 compares mapping schemes based on the cumulativenormal and . The main difference between thesetwo mapping schemes lies in the tails of the Z-Score data.
tends to overweight stocks with extreme Z-Scorescompared to . This is undesirable, since extreme Z-Scores are likely to be increasingly unreliable and result inreversals of index weights between index reviews generatingunnecessary turnover.
� �� � ��� � �� �
�� � ����
�� � �� ��� � � ������������� �
� � ��� �!� �� ��.
�� � " ��� � /01 # $ ��� %%&�%%�� ' �%#� # � ��� %%&�%%�� ( �
�� � ) ��� � *��%%%%%%%%&�%%%%�� + �%�,�-%%&�%%%%�� . �
�,�-.
�� �� " ��" �� �� ��
Factor Exposure Indices – Index Construction Methodology
FTSE Index Construction Methodology.qxp_Layout 1 05/08/2015 14:03 Page 6
7
Chart 1: Z-Score Mapping Schemes
2.3 Cumulative Normal Compared to Rank Based Scores
Where a factor is independently and identically normally distributed, the application of the cumulative normal mapping functionwill yield identical results to the application of a rank based scoring approach in the limit for large sample sizes.
However, where this distributional assumption does not hold and/or for smaller sample sizes, there is a subtle difference betweenthe two approaches; the cumulative normal considers the magnitude of the Z-Score, not just the ranking. This is seen more clearlywhen one considers that adjacent stocks will have trivially different rankings, whereas the cumulative normal interval betweenadjacent stocks may be significant.
Factor Exposure Indices – Index Construction Methodology
�
���
���
���
���
�
���
���
���
���
�
� � � � �
�����������
����
�� � ��� �
FTSE Index Construction Methodology.qxp_Layout 1 05/08/2015 14:03 Page 7
8
2.4 Translating Scores to Index Weights
For stocks in the universe with underlying index weights of, the factor index weights are:
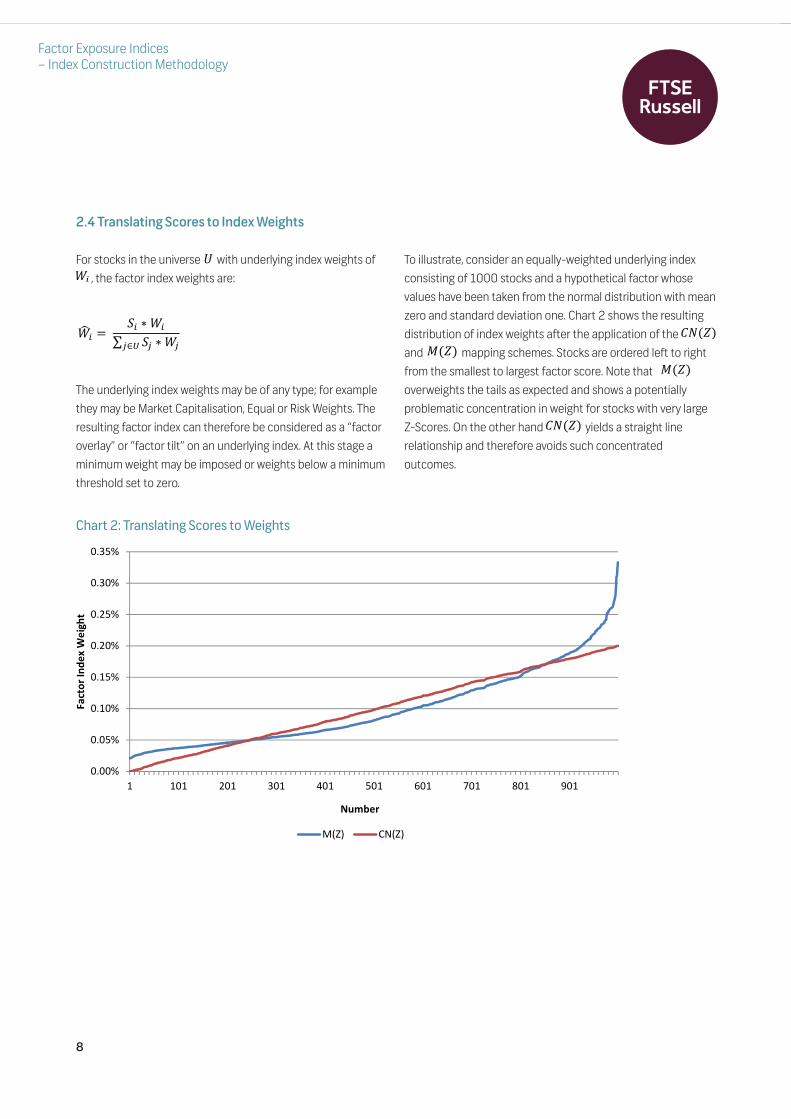
The underlying index weights may be of any type; for examplethey may be Market Capitalisation, Equal or Risk Weights. Theresulting factor index can therefore be considered as a “factoroverlay” or “factor tilt” on an underlying index. At this stage aminimum weight may be imposed or weights below a minimumthreshold set to zero.
To illustrate, consider an equally-weighted underlying indexconsisting of 1000 stocks and a hypothetical factor whosevalues have been taken from the normal distribution with meanzero and standard deviation one. Chart 2 shows the resultingdistribution of index weights after the application of theand mapping schemes. Stocks are ordered left to rightfrom the smallest to largest factor score. Note thatoverweights the tails as expected and shows a potentiallyproblematic concentration in weight for stocks with very largeZ-Scores. On the other hand yields a straight linerelationship and therefore avoids such concentratedoutcomes.
�2�
23� � % �� 4 2�5 �6 4 266�7 �� ��" �� " ���� ��
Factor Exposure Indices – Index Construction Methodology
Chart 2: Translating Scores to Weights
�����
�����
�����
�����
�����
�����
����
����
� ��� ��� �� ��� ��� ��� ��� ��� ���
�����������������
������
�� � ��� �
FTSE Index Construction Methodology.qxp_Layout 1 05/08/2015 14:03 Page 8

9
The transfer coefficient, representing the efficiency with whichthe factor signal is reflected in the resulting factor index when
is used is high at 95%. However, it is higher still whenis used, at 98%. In the limit of large sample size the
theoretical transfer coefficient values can be shown to be95.34% and 97.72% ( ) respectively.
2.5 Direction of Factor Tilt
A factor index may be tilted in either direction, for example, along-only low momentum index can be created as opposed toa long-only high momentum index. To create an index that tiltsaway from a given factor, the sign of a stock’s Z-Score is simplyreversed and the score calculated:
This enables the implementation of any view on the prospectsof a factor in a long-only context. That is, one can be short afactor without needing to be short the index.
The cumulative normal approach has the additional propertythat a tilt away from a factor satisfies a symmetry relationshipwith a tilt towards the same factor. The condition that
ensures that a linear sum of thestock weights of a factor index tilted towards a factor and onetilted away will yield the underlying index weights. Thescoring function does not share this property.
2.6 Controlling the Strength of a Factor Tilt and Multi-tilting
There are (at least) two ways that the strength of the factor tiltcan be altered. Firstly a cumulative normal mapping that has adifferent standard deviation parameter may be used. Thesmaller the standard deviation, the stronger the resulting factortilt. In the limit of zero standard deviation, the cumulativenormal function becomes a step function, with zero fornegative Z-Scores and one for positive Z-Scores. This results inindices that consist only of those stocks in the top half of theuniverse by factor rank, where weights are in identicalproportion to the underlying index.
The second method is to perform a “tilt on a tilt”. First we tiltour underlying index toward the factor in the usual way. Theresulting weights are now considered as a “new underlying”and are tilted towards the factor again. In this way we create astronger tilt towards the factor and may continue the processto yield even stronger tilts. Mathematically this can be seen as“exponentiation of the tilt operator”.
We are not forced to use the same factor at each step in theprocess and therefore can create indices that are tiltedtowards more than one factor. It is trivial to show that the orderof tilting makes no difference to index outcomes, since astock’s score in a tilt-tilt index is equal to the product of theseparate factor scores. Furthermore, this can be shownexplicitly for a multi-tilted index based on the cumulativenormal by noting that the score for a stock is given by:
where and are the stock’s Z-Scores for factor one andfactor two respectively.
" ���� ��8!��
�� � �� ����
������ ������ � �
���
� � ������ ��� � � � �������������
��
��
��
�����
�� ��
Factor Exposure Indices – Index Construction Methodology
FTSE Index Construction Methodology.qxp_Layout 1 05/08/2015 14:03 Page 9

10
2.7 Long / Short Factor Indices
From an implementation perspective, long-only indices are preferable to long/short factor indices. However, long/short factorindices will provide a stronger tilt towards a factor of interest. A long/short approach can be incorporated within the frameworkdescribed by combining a long position in a positively tilted index with a short position in the corresponding negatively tilted index.The symmetry property of the Cumulative Normal discussed in Section 2.5 ensures that a short negative factor tilt could at leasttheoretically be created, by being short the underlying index (future) and long the positive factor index. Chart 3 shows thedistribution of long/short weights when this approach is applied to an equally-weighted underlying index with hypothetical factorscores drawn from the normal distribution with mean zero and standard deviation one.
Chart 3: Long / Short Factor Index Weights
We have fixed the size of the long position to be equal to one. Note that, unlike , the cumulative normal avoidsconcentration in weight for extreme positive and negative Z-Scores.
���
Factor Exposure Indices – Index Construction Methodology
�����
�����
�����
�����
�����
�����
�����
�����
�����
� ��� ��� �� ��� ��� ��� ��� ��� ���
���������������
������
�� � ��� �
FTSE Index Construction Methodology.qxp_Layout 1 05/08/2015 14:03 Page 10
11
2.8 Broad and Narrow Indices
The size and composition of the underlying universe has aprofound effect on the characteristics of a tilted index. Forlarge numbers of stocks with suitably “well-behaved” factorswe envisage no difficulty in applying Cumulative Normalscoring. For small numbers of stocks with unusual distributionof factor values the application of the Cumulative Normal maylead to excessively concentrated weightings. A possiblesolution to this is to apply a ranking tilt (see Section 2.3) forsmall sample sizes. This is consistent with the CumulativeNormal approach, since in some overlapping regions of samplesize the two will yield indices of similar composition.
Alternatively one could turn to optimised strategies whichcontrol for factor exposure, diversification and concentration.This has the advantage that one has precise control over indexoutcomes but at the expense of less transparency. Theseissues and approaches to constructing intentionally narrowindices displaying very high levels of factor exposure will beexamined at a later date. The intention is to provide amechanism for creating indices with very high exposure thatare relatively easy to replicate. We anticipate that such indicesmay be suitable for factor ETFs and provide a mechanism forfund managers to efficiently add or remove a tactical factoroverlay to an existing portfolio.
In contrast, broad high capacity factor indices would appear tobe more suitable for long-only asset managers and ownerswith a strategic perspective on the existence of factor riskpremia. The approach to factor index construction detailed todate, results in the reweighting of all constituents in anunderlying index, irrespective of whether they contributetowards achieving a given factor objective.
A simple method that can be used to produce factor indiceswith fewer stocks is to remove stocks that contribute onlytrivially to the overall factor objective. One can achieve this byremoving stocks in order of weight, factor score orweight*factor score, (smallest first) while confirming that theeffective number of stocks (diversification) and investablecharacteristics (capacity and liquidity) of the index does not fallbelow some pre-specified values (see Appendix B fordefinitions of these). We illustrate the application of such anapproach in section 5.9.
Factor Exposure Indices – Index Construction Methodology
FTSE Index Construction Methodology.qxp_Layout 1 05/08/2015 14:03 Page 11
12
3. Combining Factors
3.1 Composite Indices
Where a simultaneous tilt towards two or more factors isrequired, there are several different ways to determine anappropriate set of index weights. The composite indexapproach simply takes the weights derived from separatefactor indices and combines them:
Where is the weight of the stock in the factor indexand are real positive numbers satisfying
. The determine the relative strength of the tiltsto our various factors. For example if an “equal tilt” towards allfactors is required we set
3.2 Composite Factors
A second approach is to create a composite factor basedon Z-Scores calculated for each single factor as described inSection 2:
where is the Z-Score of the stock in the factorindex. The problem then reduces to a single (composite) factorand the methods of Section 2 can be employed to determinethe factor index weights.
3.3 Discussion
Both approaches are readily implemented within themethodology outlined. Intuitively, the composite factorapproach is preferable as it is conceivable that combiningfactor indices in the manner of Section 3.1, where theunderlying factors are negatively correlated may result in anindex that fails to achieve a tilt in any of the desired directions.
Conversely, the composite factor approach offers the flexibilityto achieve the multiple factor tilt objective throughtransformations of the input factor Z-Scores and selection ofthe appropriate factor weightings. The use of a compositefactor allows us to redesign factors in the manner discussed inSection 1 and incorporate them into a general factor indexmethodology.
Finally multiple factor objectives may also be constructed usingthe multiple tilt methodology detailed in Section 2.6. Weillustrate the application of multiple tilts in Section 5.4.
"
23� � %9:6 4 2�6;6<= �
2�6 &>? @>?5 :6A6 � # :6
:6 � #�".
��
�� � %9:6 4 ��6;6<=
��6 &>? @>?
:6
Factor Exposure Indices – Index Construction Methodology
FTSE Index Construction Methodology.qxp_Layout 1 05/08/2015 14:03 Page 12

13
4. Constraints
4.1 Industry and Country Constraints
A factor may be strongly correlated with industries and orcountries. Consequently, the construction process describedmay give rise to unintentional over/under weight positions inparticular industries or countries. For example, a dividend yieldfactor index will preferentially tilt towards high yield industries,e.g. utilities and away from low yield countries, e.g. Japan. Thismay be desirable, but it is not clear that the resulting indexreflects the performance of a dividend yield tilt as opposed tocountry or industry effects.
One solution is to redefine the factor in order to limit suchbiases. This involves the industry/country neutralisationmethods described in Section 1. However even after theapplication of such a factor redefinition, the resulting indexmay still contain (smaller) biases. Consequently a generalmethod is required to correct for this.
The objective is to constrain the factor index, such thatindustry and country weightings do not deviate too much fromthose in the underlying index. One approach to achieving thisobjective is to impose a requirement that all industry andcountry weights in the factor index are bounded by:
for each underlying industry/country weight and somechosen percentage values and . For examplerequires the factor index to have weights between +/- 10% ofthe underlying index weights. Furthermore providesadditional freedom to assume meaningful active weights of +/-5% in small industries/countries, subject to the requirementthat the index has no short positions.
Initially, we construct a factor index using the methods outlinedin earlier sections and assess whether the index satisfies allconstraints. If not, a simple transparent method of imposingsuch constraints is required. Here we propose two suchmethods.
4.1.1 Iterative Application of Constraints
One approach is to set the weight of breaching industriesand countries to the nearer of their upper or lower bounds.Weight is then re-assigned proportionately toindustries/countries that were not in breach of their upperor lower bounds. Where such a reallocation causes breachesin previously “good” industries and countries, then theoriginal constraints are relaxed until no such breachesoccur. For example the constraint may
be relaxed to , etc, until theredistribution of weight causes no breaches to occur in any ofthe good industries and countries.
A final iteration is performed to ensure consistency betweenthe newly constrained country and industry positions.
2E F E � #�F � J
E� F� � #�� J� E� F� � #�K#� JK#�� #�K�� JK��
Factor Exposure Indices – Index Construction Methodology
"B CD #�� � E� 4 2 � FG� �H and "&ICD #�� $ E� 4 2 � FG� #��H
FTSE Index Construction Methodology.qxp_Layout 1 05/08/2015 14:03 Page 13
14
4.1.2 A Composite Index to Satisfy Constraints
A second approach relies on the creation of a composite index.The composite index consists of a mix of the unconstrainedfactor index and the underlying index and progressively tiltsaway from the underlying index using the methodology ofSection 3.1, whilst respecting all constraints.
Consider two sets of weights; those of a factor index and thoseof the underlying index. Starting with for the factorindex and for the underlying index, weincrease until any one of the constraints is breached. Thisdetermines the maximum (or factor tilt) that is consistentwith all the constraints. The looser the constraints, the greaterthe potential tilt.
4.1.3 Discussion
The factor tilt method described in Section 4.1.2 has theadvantage that it is both intuitive and transparent. However, webelieve that greater factor tilts for a given set of constraints arepossible using the iterative method in Section 4.1.1.
Our reasoning is as follows: in the iterative case we look forperturbations of the unconstrained factor index that satisfy theconstraints, i.e. we move from the unconstrained factor indexto a close suitable index.
In contrast, the starting point of the factor tilt method ofSection 4.1.2 may be a significant distance from theunconstrained factor index, (i.e. the underlying index) andmoves along a pre-defined path towards an index that nearlybreaches one of the constraints. There is always the possibilitythat another path would lead to a solution that is closer to theunconstrained factor index.
We examine empirically these approaches to applyingconstraints in Section 5.6.
:L � �:7 � # � :L� � #:L :L
Factor Exposure Indices – Index Construction Methodology
FTSE Index Construction Methodology.qxp_Layout 1 05/08/2015 14:03 Page 14
15
5. Factor Index Example
In this Section we apply the methods discussed in previous Sections to create a simple value factor index premised on EarningsYield (E/P). We construct indices based on each of the three scoring methods set out in Section 2 using both a capitalisationweighted and an equally-weighted underlying index. The underlying universe consists of constituents of the FTSE DevelopedIndex. Unless otherwise stated, for illustration, indices are rebalanced on a monthly basis from May 2000 to October 2013. Allperformance figures are in US dollars.
5.1 Performance Summary
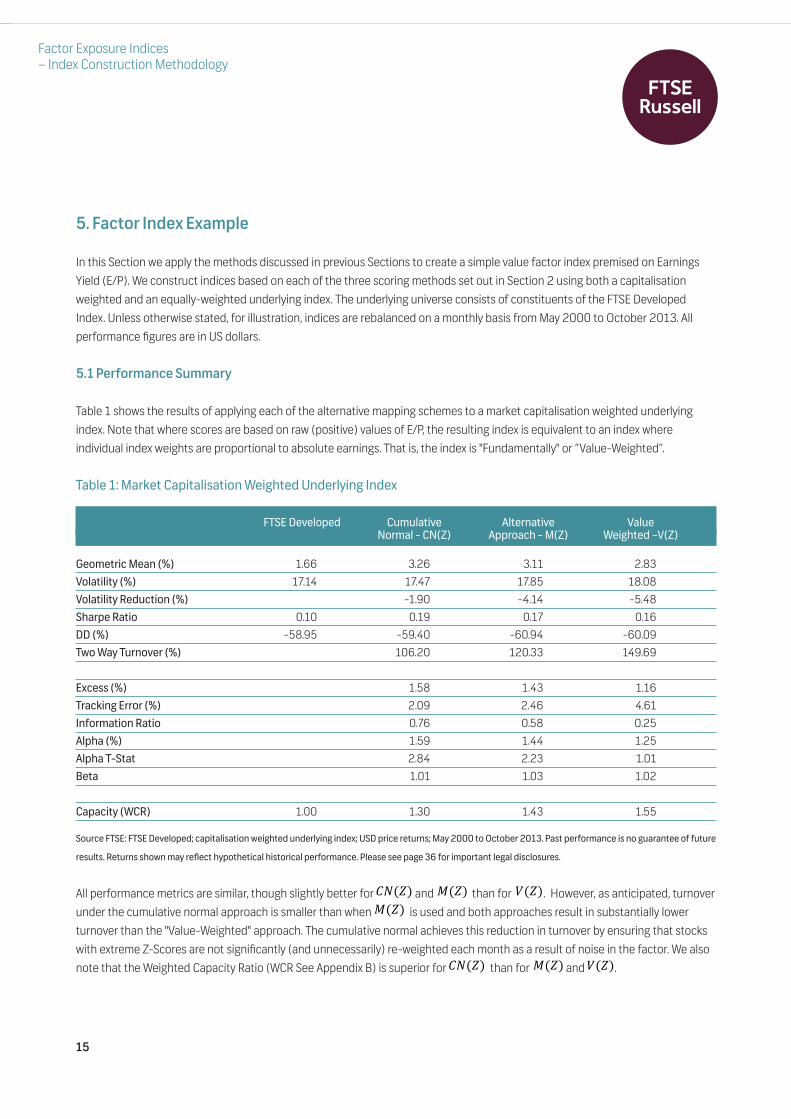
Table 1 shows the results of applying each of the alternative mapping schemes to a market capitalisation weighted underlyingindex. Note that where scores are based on raw (positive) values of E/P, the resulting index is equivalent to an index whereindividual index weights are proportional to absolute earnings. That is, the index is "Fundamentally" or “Value-Weighted”.
Table 1: Market Capitalisation Weighted Underlying Index
FTSE Developed Cumulative Alternative Value Normal - CN(Z) Approach - M(Z) Weighted –V(Z)
Geometric Mean (%) 1.66 3.26 3.11 2.83
Volatility (%) 17.14 17.47 17.85 18.08
Volatility Reduction (%) -1.90 -4.14 -5.48
Sharpe Ratio 0.10 0.19 0.17 0.16
DD (%) -58.95 -59.40 -60.94 -60.09
Two Way Turnover (%) 106.20 120.33 149.69
Excess (%) 1.58 1.43 1.16
Tracking Error (%) 2.09 2.46 4.61
Information Ratio 0.76 0.58 0.25
Alpha (%) 1.59 1.44 1.25
Alpha T-Stat 2.84 2.23 1.01
Beta 1.01 1.03 1.02
Capacity (WCR) 1.00 1.30 1.43 1.55
Source FTSE: FTSE Developed; capitalisation weighted underlying index; USD price returns; May 2000 to October 2013. Past performance is no guarantee of future
results. Returns shown may reflect hypothetical historical performance. Please see page 36 for important legal disclosures.
All performance metrics are similar, though slightly better for and than for . However, as anticipated, turnoverunder the cumulative normal approach is smaller than when is used and both approaches result in substantially lowerturnover than the "Value-Weighted" approach. The cumulative normal achieves this reduction in turnover by ensuring that stockswith extreme Z-Scores are not significantly (and unnecessarily) re-weighted each month as a result of noise in the factor. We alsonote that the Weighted Capacity Ratio (WCR See Appendix B) is superior for than for and .
�� �� " �� ) ��" ���� �� " �� ) ��
Factor Exposure Indices – Index Construction Methodology
FTSE Index Construction Methodology.qxp_Layout 1 05/08/2015 14:03 Page 15

16
Table 2 presents the comparable results using equally-weighted underlying index. Note that now delivers somethingdifferent from a Value-Weighted Index.
The turnover of all mappings is roughly one and a half times that seen when each factor mapping is applied to a capitalisationweighted underlying index. The performance figures for the cumulative normal and approaches are broadly similar, but nowdiverge from those of . The cumulative normal approach continues to deliver noticeably lower turnover. As expected, capacitydeteriorates for all scoring schemes, but is noticeably superior under the cumulative normal approach.
Table 2: Equally-Weighted Underlying Index
FTSE Developed Cumulative Alternative V(Z) Equally-Weighted Normal - CN(Z) Approach - M(Z)
Geometric Mean (%) 6.08 7.98 8.14 7.04
Volatility (%) 15.90 16.15 16.63 17.30
Volatility Reduction (%) -1.56 -4.55 -8.77
Sharpe Ratio 0.38 0.49 0.49 0.41
DD (%) -58.56 -59.95 -61.39 -60.23
Two Way Turnover (%) 96.17 171.03 187.46 245.27
Excess (%) 1.79 1.93 0.90
Tracking Error (%) 2.18 2.52 5.95
Information Ratio 0.82 0.77 0.15
Alpha (%) 1.77 1.79 0.97
Alpha T-Stat 3.02 2.71 0.61
Beta 1.01 1.03 1.02
Capacity (WCR) 10.99 20.94 149.32
Source FTSE: FTSE Developed; equally-weighted underlying index; USD price returns; May 2000 to October 2013. Past performance is no guarantee of future
results. Returns shown may reflect hypothetical historical performance. Please see page 36 for important legal disclosures.
) ��
" ��) ��
Factor Exposure Indices – Index Construction Methodology
FTSE Index Construction Methodology.qxp_Layout 1 05/08/2015 14:03 Page 16
17
5.2 Tilting Towards High And Low Earnings Yield
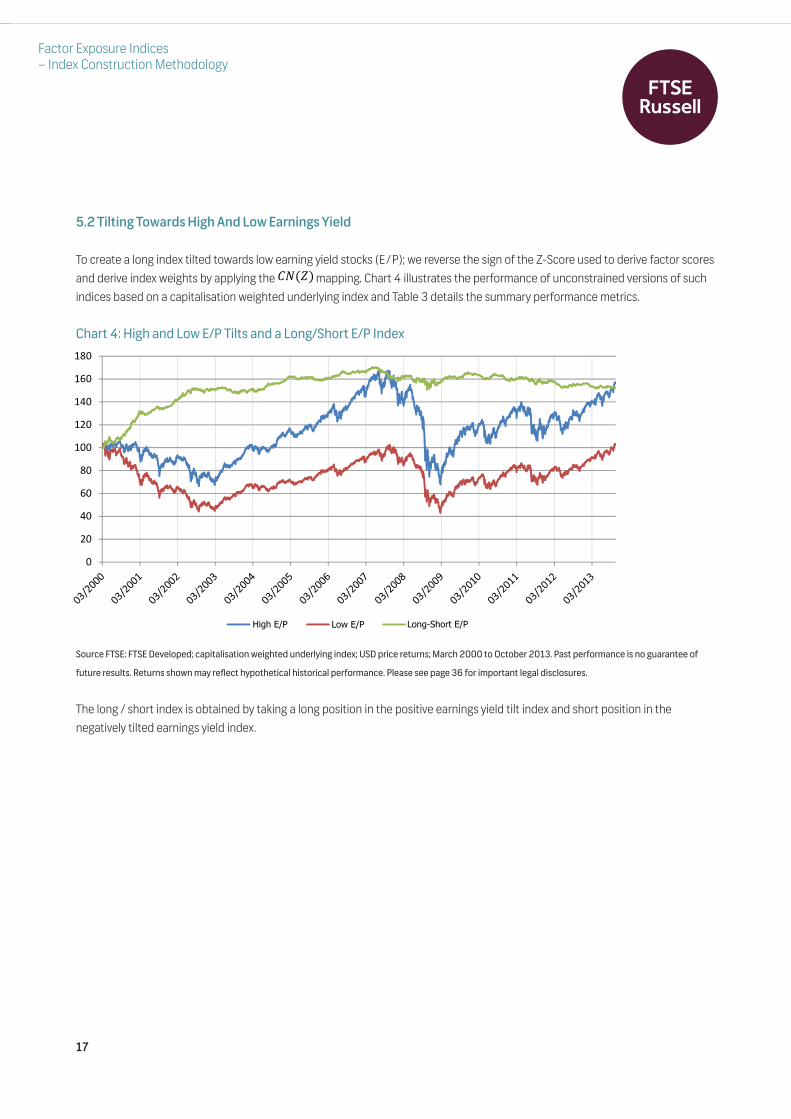
To create a long index tilted towards low earning yield stocks (E/P); we reverse the sign of the Z-Score used to derive factor scoresand derive index weights by applying the mapping. Chart 4 illustrates the performance of unconstrained versions of suchindices based on a capitalisation weighted underlying index and Table 3 details the summary performance metrics.
Chart 4: High and Low E/P Tilts and a Long/Short E/P Index
Source FTSE: FTSE Developed; capitalisation weighted underlying index; USD price returns; March 2000 to October 2013. Past performance is no guarantee of
future results. Returns shown may reflect hypothetical historical performance. Please see page 36 for important legal disclosures.
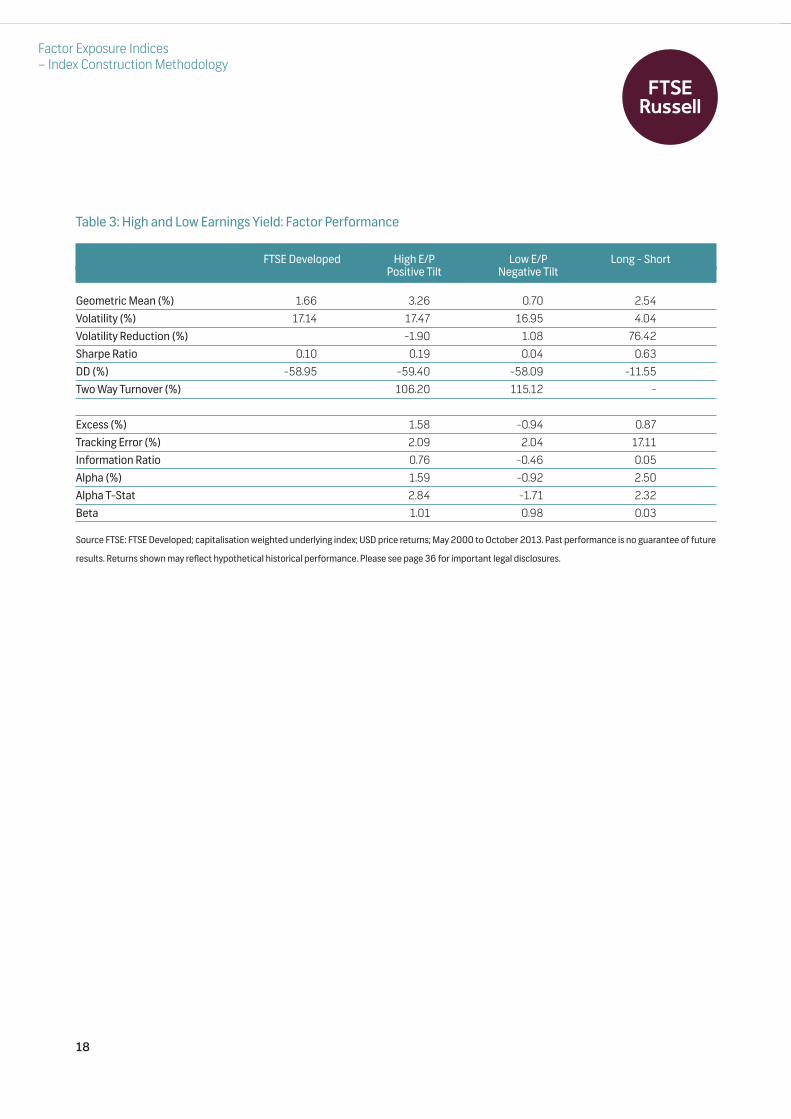
The long / short index is obtained by taking a long position in the positive earnings yield tilt index and short position in thenegatively tilted earnings yield index.
�� ��
Factor Exposure Indices – Index Construction Methodology
�
��
��
��
��
���
���
���
���
���
�������� �������� ����� �������
FTSE Index Construction Methodology.qxp_Layout 1 05/08/2015 14:03 Page 17
18
Table 3: High and Low Earnings Yield: Factor Performance
FTSE Developed High E/P Low E/P Long - Short Positive Tilt Negative Tilt
Geometric Mean (%) 1.66 3.26 0.70 2.54
Volatility (%) 17.14 17.47 16.95 4.04
Volatility Reduction (%) -1.90 1.08 76.42
Sharpe Ratio 0.10 0.19 0.04 0.63
DD (%) -58.95 -59.40 -58.09 -11.55
Two Way Turnover (%) 106.20 115.12 -
Excess (%) 1.58 -0.94 0.87
Tracking Error (%) 2.09 2.04 17.11
Information Ratio 0.76 -0.46 0.05
Alpha (%) 1.59 -0.92 2.50
Alpha T-Stat 2.84 -1.71 2.32
Beta 1.01 0.98 0.03
Source FTSE: FTSE Developed; capitalisation weighted underlying index; USD price returns; May 2000 to October 2013. Past performance is no guarantee of future
results. Returns shown may reflect hypothetical historical performance. Please see page 36 for important legal disclosures.
Factor Exposure Indices – Index Construction Methodology
FTSE Index Construction Methodology.qxp_Layout 1 05/08/2015 14:03 Page 18
19
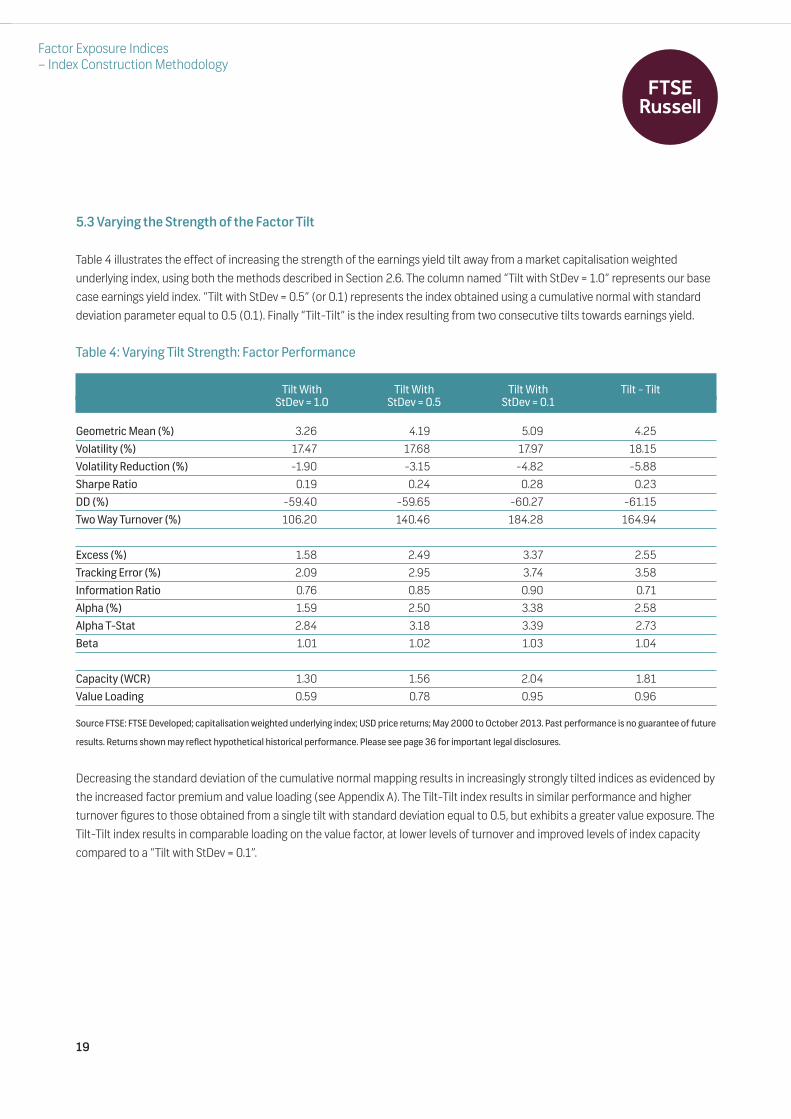
5.3 Varying the Strength of the Factor Tilt
Table 4 illustrates the effect of increasing the strength of the earnings yield tilt away from a market capitalisation weightedunderlying index, using both the methods described in Section 2.6. The column named “Tilt with StDev = 1.0” represents our basecase earnings yield index. “Tilt with StDev = 0.5” (or 0.1) represents the index obtained using a cumulative normal with standarddeviation parameter equal to 0.5 (0.1). Finally “Tilt-Tilt” is the index resulting from two consecutive tilts towards earnings yield.
Table 4: Varying Tilt Strength: Factor Performance
Tilt With Tilt With Tilt With Tilt - Tilt StDev = 1.0 StDev = 0.5 StDev = 0.1
Geometric Mean (%) 3.26 4.19 5.09 4.25
Volatility (%) 17.47 17.68 17.97 18.15
Volatility Reduction (%) -1.90 -3.15 -4.82 -5.88
Sharpe Ratio 0.19 0.24 0.28 0.23
DD (%) -59.40 -59.65 -60.27 -61.15
Two Way Turnover (%) 106.20 140.46 184.28 164.94
Excess (%) 1.58 2.49 3.37 2.55
Tracking Error (%) 2.09 2.95 3.74 3.58
Information Ratio 0.76 0.85 0.90 0.71
Alpha (%) 1.59 2.50 3.38 2.58
Alpha T-Stat 2.84 3.18 3.39 2.73
Beta 1.01 1.02 1.03 1.04
Capacity (WCR) 1.30 1.56 2.04 1.81
Value Loading 0.59 0.78 0.95 0.96
Source FTSE: FTSE Developed; capitalisation weighted underlying index; USD price returns; May 2000 to October 2013. Past performance is no guarantee of future
results. Returns shown may reflect hypothetical historical performance. Please see page 36 for important legal disclosures.
Decreasing the standard deviation of the cumulative normal mapping results in increasingly strongly tilted indices as evidenced bythe increased factor premium and value loading (see Appendix A). The Tilt-Tilt index results in similar performance and higherturnover figures to those obtained from a single tilt with standard deviation equal to 0.5, but exhibits a greater value exposure. TheTilt-Tilt index results in comparable loading on the value factor, at lower levels of turnover and improved levels of index capacitycompared to a “Tilt with StDev = 0.1”.
Factor Exposure Indices – Index Construction Methodology
FTSE Index Construction Methodology.qxp_Layout 1 05/08/2015 14:03 Page 19
20
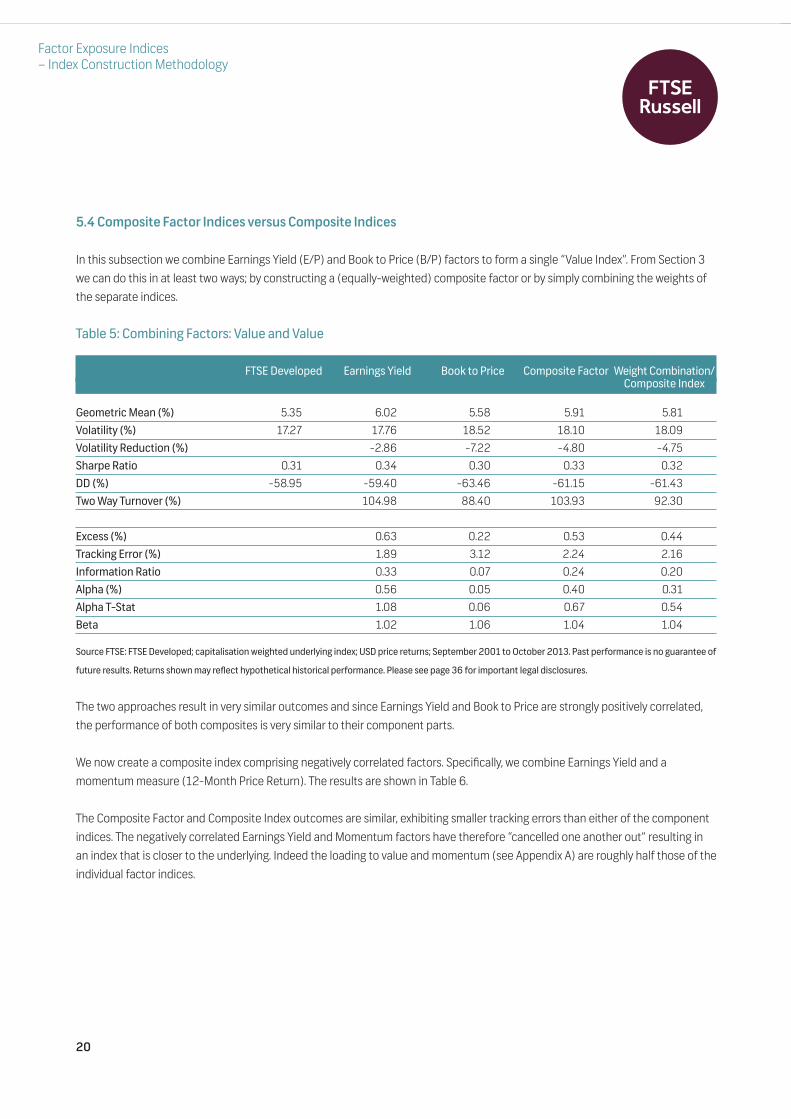
5.4 Composite Factor Indices versus Composite Indices
In this subsection we combine Earnings Yield (E/P) and Book to Price (B/P) factors to form a single “Value Index”. From Section 3we can do this in at least two ways; by constructing a (equally-weighted) composite factor or by simply combining the weights ofthe separate indices.
Table 5: Combining Factors: Value and Value
FTSE Developed Earnings Yield Book to Price Composite Factor Weight Combination/Composite Index
Geometric Mean (%) 5.35 6.02 5.58 5.91 5.81
Volatility (%) 17.27 17.76 18.52 18.10 18.09
Volatility Reduction (%) -2.86 -7.22 -4.80 -4.75
Sharpe Ratio 0.31 0.34 0.30 0.33 0.32
DD (%) -58.95 -59.40 -63.46 -61.15 -61.43
Two Way Turnover (%) 104.98 88.40 103.93 92.30
Excess (%) 0.63 0.22 0.53 0.44
Tracking Error (%) 1.89 3.12 2.24 2.16
Information Ratio 0.33 0.07 0.24 0.20
Alpha (%) 0.56 0.05 0.40 0.31
Alpha T-Stat 1.08 0.06 0.67 0.54
Beta 1.02 1.06 1.04 1.04
Source FTSE: FTSE Developed; capitalisation weighted underlying index; USD price returns; September 2001 to October 2013. Past performance is no guarantee of
future results. Returns shown may reflect hypothetical historical performance. Please see page 36 for important legal disclosures.
The two approaches result in very similar outcomes and since Earnings Yield and Book to Price are strongly positively correlated,the performance of both composites is very similar to their component parts.
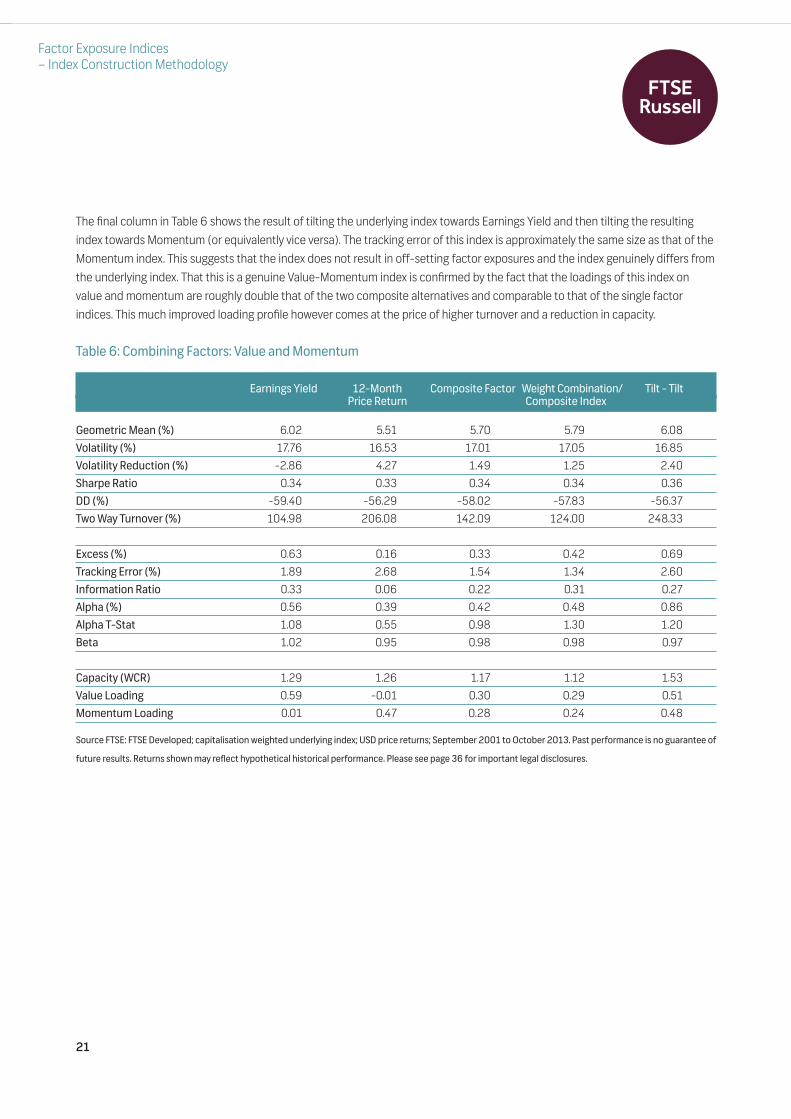
We now create a composite index comprising negatively correlated factors. Specifically, we combine Earnings Yield and amomentum measure (12-Month Price Return). The results are shown in Table 6.
The Composite Factor and Composite Index outcomes are similar, exhibiting smaller tracking errors than either of the componentindices. The negatively correlated Earnings Yield and Momentum factors have therefore “cancelled one another out” resulting inan index that is closer to the underlying. Indeed the loading to value and momentum (see Appendix A) are roughly half those of theindividual factor indices.
Factor Exposure Indices – Index Construction Methodology
FTSE Index Construction Methodology.qxp_Layout 1 05/08/2015 14:03 Page 20
21
The final column in Table 6 shows the result of tilting the underlying index towards Earnings Yield and then tilting the resultingindex towards Momentum (or equivalently vice versa). The tracking error of this index is approximately the same size as that of theMomentum index. This suggests that the index does not result in off-setting factor exposures and the index genuinely differs fromthe underlying index. That this is a genuine Value-Momentum index is confirmed by the fact that the loadings of this index onvalue and momentum are roughly double that of the two composite alternatives and comparable to that of the single factorindices. This much improved loading profile however comes at the price of higher turnover and a reduction in capacity.
Table 6: Combining Factors: Value and Momentum
Earnings Yield 12-Month Composite Factor Weight Combination/ Tilt - TiltPrice Return Composite Index
Geometric Mean (%) 6.02 5.51 5.70 5.79 6.08
Volatility (%) 17.76 16.53 17.01 17.05 16.85
Volatility Reduction (%) -2.86 4.27 1.49 1.25 2.40
Sharpe Ratio 0.34 0.33 0.34 0.34 0.36
DD (%) -59.40 -56.29 -58.02 -57.83 -56.37
Two Way Turnover (%) 104.98 206.08 142.09 124.00 248.33
Excess (%) 0.63 0.16 0.33 0.42 0.69
Tracking Error (%) 1.89 2.68 1.54 1.34 2.60
Information Ratio 0.33 0.06 0.22 0.31 0.27
Alpha (%) 0.56 0.39 0.42 0.48 0.86
Alpha T-Stat 1.08 0.55 0.98 1.30 1.20
Beta 1.02 0.95 0.98 0.98 0.97
Capacity (WCR) 1.29 1.26 1.17 1.12 1.53
Value Loading 0.59 -0.01 0.30 0.29 0.51
Momentum Loading 0.01 0.47 0.28 0.24 0.48
Source FTSE: FTSE Developed; capitalisation weighted underlying index; USD price returns; September 2001 to October 2013. Past performance is no guarantee of
future results. Returns shown may reflect hypothetical historical performance. Please see page 36 for important legal disclosures.
Factor Exposure Indices – Index Construction Methodology
FTSE Index Construction Methodology.qxp_Layout 1 05/08/2015 14:03 Page 21
22
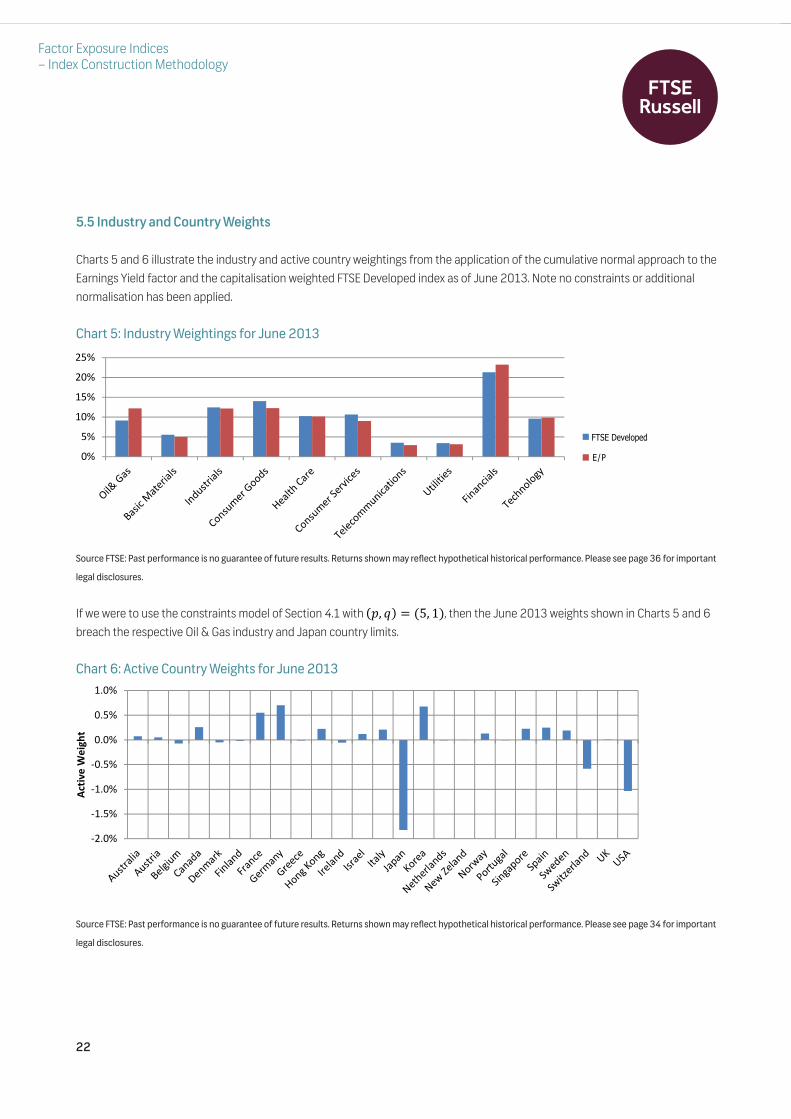
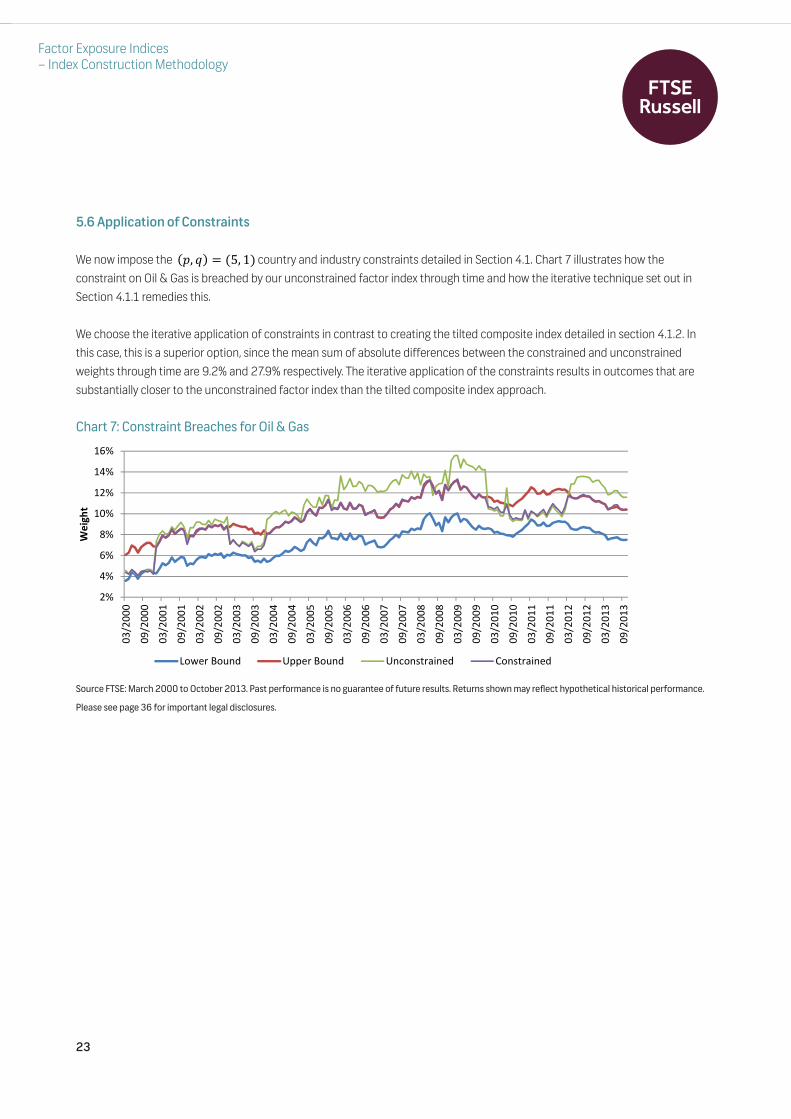
5.5 Industry and Country Weights
Charts 5 and 6 illustrate the industry and active country weightings from the application of the cumulative normal approach to theEarnings Yield factor and the capitalisation weighted FTSE Developed index as of June 2013. Note no constraints or additionalnormalisation has been applied.
Chart 5: Industry Weightings for June 2013
Source FTSE: Past performance is no guarantee of future results. Returns shown may reflect hypothetical historical performance. Please see page 36 for important
legal disclosures.
If we were to use the constraints model of Section 4.1 with , then the June 2013 weights shown in Charts 5 and 6breach the respective Oil & Gas industry and Japan country limits.
Chart 6: Active Country Weights for June 2013
Source FTSE: Past performance is no guarantee of future results. Returns shown may reflect hypothetical historical performance. Please see page 34 for important
legal disclosures.
E� F� � J� #�
Factor Exposure Indices – Index Construction Methodology
��
��
���
���
���
���
!�"#�$%&��
���
����
����
����
����
����
����
����
������������
FTSE Index Construction Methodology.qxp_Layout 1 05/08/2015 14:03 Page 22
23
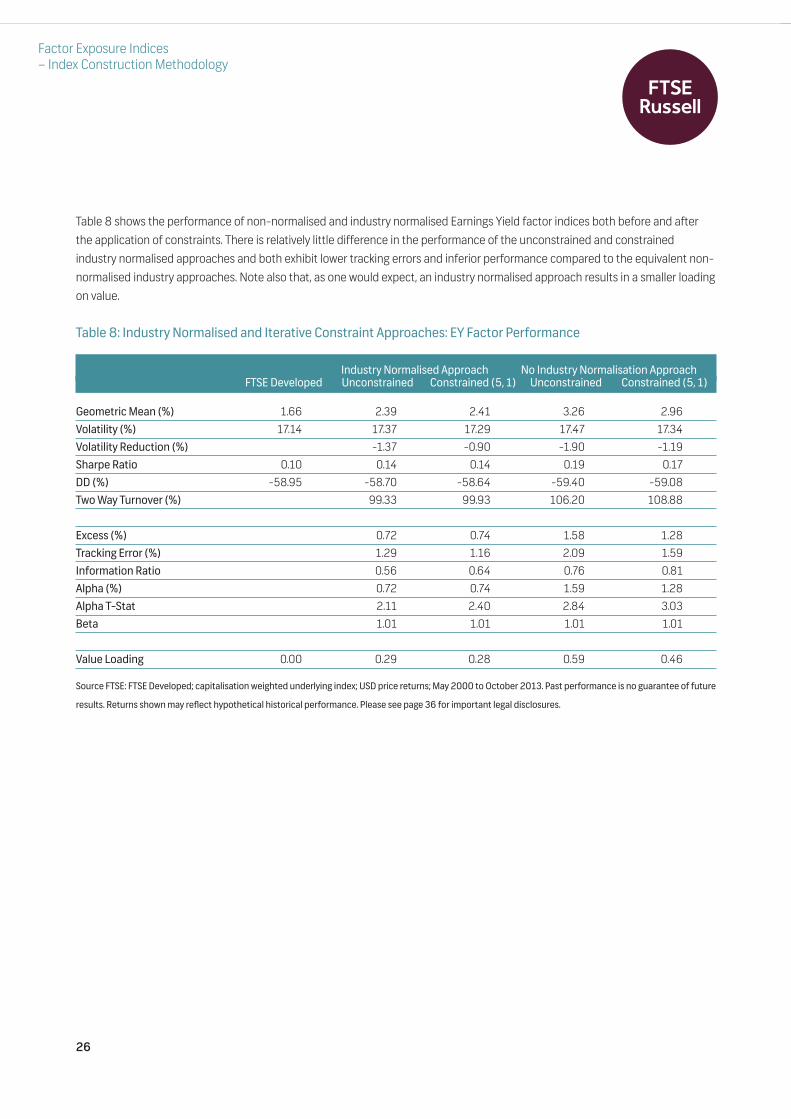
5.6 Application of Constraints
We now impose the country and industry constraints detailed in Section 4.1. Chart 7 illustrates how theconstraint on Oil & Gas is breached by our unconstrained factor index through time and how the iterative technique set out inSection 4.1.1 remedies this.
We choose the iterative application of constraints in contrast to creating the tilted composite index detailed in section 4.1.2. Inthis case, this is a superior option, since the mean sum of absolute differences between the constrained and unconstrainedweights through time are 9.2% and 27.9% respectively. The iterative application of the constraints results in outcomes that aresubstantially closer to the unconstrained factor index than the tilted composite index approach.
Chart 7: Constraint Breaches for Oil & Gas
Source FTSE: March 2000 to October 2013. Past performance is no guarantee of future results. Returns shown may reflect hypothetical historical performance.
Please see page 36 for important legal disclosures.
E� F� � J� #�
Factor Exposure Indices – Index Construction Methodology
��
��
��
��
���
���
���
���
������
�������
������
�������
������
�������
�����
������
������
�������
������
�������
������
�������
������
�������
������
�������
������
�������
������
�������
������
�������
������
�������
�����
������
������
��'#��(�)�" !**#��(�)�" !�+��,��-&�#" ���,��-&�#"
FTSE Index Construction Methodology.qxp_Layout 1 05/08/2015 14:03 Page 23

24
Table 7 illustrates the effect of increasingly stringent constraints on the performance characteristics of the Earnings Yield factorindex between May 2000 and October 2013. Note, that as the constraints become more stringent, the tracking error between thefactor and underlying index becomes smaller; additionally, both the value loading and the factor premium (as measured by theexcess return) also decline. This is expected as the constraints force the factor index back towards the underlying (marketcapitalisation weighted in this case) index.
Table 7: Iterative Application of Constraints to a Factor Index
FTSE Developed No Constraint (10, 5) (5, 2) (5, 1) (2, 1)
Geometric Mean (%) 1.66 3.26 3.26 3.09 2.96 2.91
Volatility (%) 17.14 17.47 17.47 17.41 17.34 17.31
Volatility Reduction (%) -1.90 -1.92 -1.58 -1.19 -1.02
Sharpe Ratio 0.10 0.19 0.19 0.18 0.17 0.17
DD (%) -58.95 -59.40 -59.39 -59.09 -59.08 -58.95
Two Way Turnover (%) 106.20 106.18 107.21 108.88 110.38
Excess (%) 1.58 1.58 1.41 1.28 1.23
Tracking Error (%) 2.09 2.05 1.76 1.59 1.45
Information Ratio 0.76 0.77 0.81 0.81 0.85
Alpha (%) 1.59 1.58 1.42 1.28 1.23
Alpha T-Stat 2.84 2.89 3.02 3.03 3.17
Beta 1.01 1.01 1.01 1.01 1.01
Value Loading 0.00 0.59 0.59 0.52 0.46 0.43
Source FTSE: FTSE Developed; capitalisation weighted underlying index; USD price returns; May 2000 to October 2013. Past performance is no guarantee of future
results. Returns shown may reflect hypothetical historical performance. Please see page 36 for important legal disclosures.
Note that when constraints are lax, for example, (p, q) = (10, 5) , outcomes differ very little from the unconstrained outcomes. Inthis case the constraints act as “insurance” against taking very large under/overweight positions relative to an underlying index.
Factor Exposure Indices – Index Construction Methodology
FTSE Index Construction Methodology.qxp_Layout 1 05/08/2015 14:03 Page 24

25
5.7 Additional Normalisation
We now demonstrate that the industry and country active weights may also be controlled by a more sophisticated design of theraw factor. Earnings Yield is now measured relative to industrial group membership in the manner described in Section 1.2.
Chart 8 illustrates that such an industry normalised factor results in fewer and smaller breaches of theconstraint for Oil & Gas (unconstrained line) than the non-normalised factor shown in Chart 7.
The constrained line in Chart 8 shows the Oil & Gas industry weights after the application of the constraint to theindustry normalised factor. The constrained and unconstrained lines are almost coincident indicating that the newly designedfactor already adequately controls for industry exposure. Indeed the average absolute weight difference through time betweenthe constrained and unconstrained index weights is only 2.2%.
Chart 8: Constraint Breaches for Oil & Gas: Additional Normalisation
Source FTSE: March 2000 to October 2013. Past performance is no guarantee of future results. Returns shown may reflect hypothetical historical performance.
Please see page 36 for important legal disclosures.
E� F� � J� #� M� N� � J� #�
Factor Exposure Indices – Index Construction Methodology
��
��
��
��
���
���
���
���
������
�������
������
�������
������
�������
�����
������
������
�������
������
�������
������
�������
������
�������
������
�������
������
�������
������
�������
������
�������
������
�������
�����
������
������
��'#��(�)�" !**#��(�)�" !�+��,��-&�#" ���,��-&�#"
FTSE Index Construction Methodology.qxp_Layout 1 05/08/2015 14:03 Page 25
26
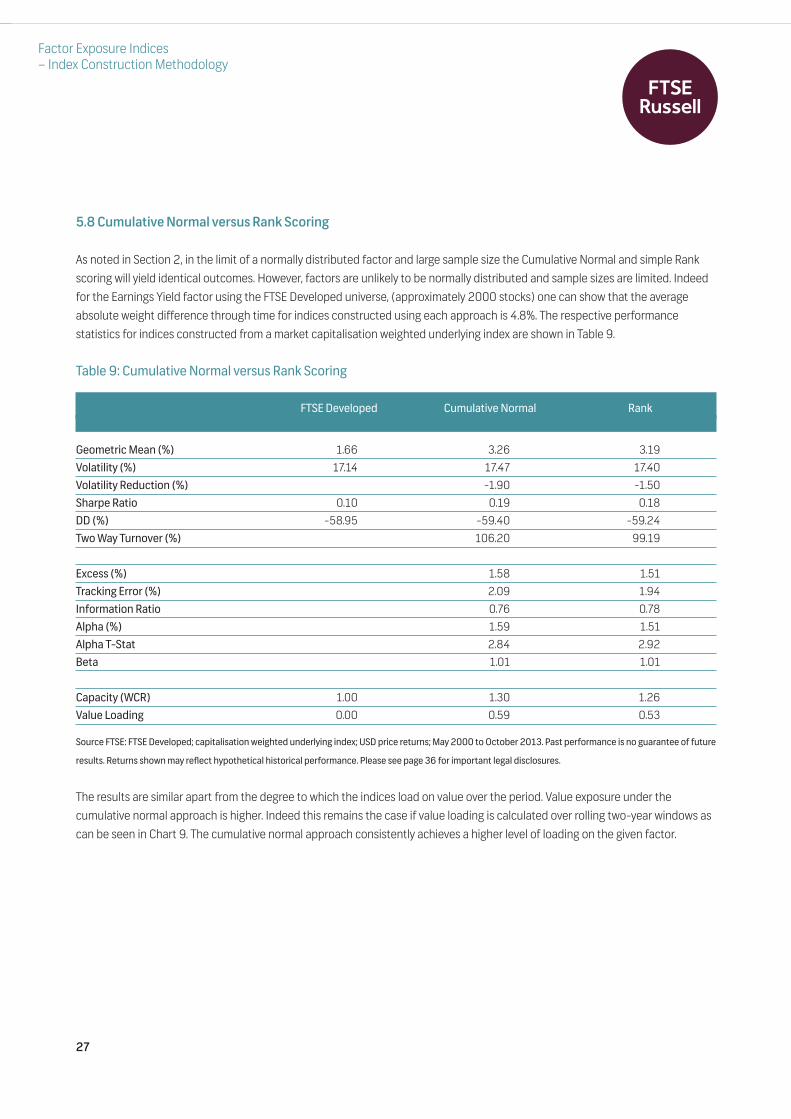
Table 8 shows the performance of non-normalised and industry normalised Earnings Yield factor indices both before and afterthe application of constraints. There is relatively little difference in the performance of the unconstrained and constrainedindustry normalised approaches and both exhibit lower tracking errors and inferior performance compared to the equivalent non-normalised industry approaches. Note also that, as one would expect, an industry normalised approach results in a smaller loadingon value.
Table 8: Industry Normalised and Iterative Constraint Approaches: EY Factor Performance
Industry Normalised Approach No Industry Normalisation ApproachFTSE Developed Unconstrained Constrained (5, 1) Unconstrained Constrained (5, 1)
Geometric Mean (%) 1.66 2.39 2.41 3.26 2.96
Volatility (%) 17.14 17.37 17.29 17.47 17.34
Volatility Reduction (%) -1.37 -0.90 -1.90 -1.19
Sharpe Ratio 0.10 0.14 0.14 0.19 0.17
DD (%) -58.95 -58.70 -58.64 -59.40 -59.08
Two Way Turnover (%) 99.33 99.93 106.20 108.88
Excess (%) 0.72 0.74 1.58 1.28
Tracking Error (%) 1.29 1.16 2.09 1.59
Information Ratio 0.56 0.64 0.76 0.81
Alpha (%) 0.72 0.74 1.59 1.28
Alpha T-Stat 2.11 2.40 2.84 3.03
Beta 1.01 1.01 1.01 1.01
Value Loading 0.00 0.29 0.28 0.59 0.46
Source FTSE: FTSE Developed; capitalisation weighted underlying index; USD price returns; May 2000 to October 2013. Past performance is no guarantee of future
results. Returns shown may reflect hypothetical historical performance. Please see page 36 for important legal disclosures.
Factor Exposure Indices – Index Construction Methodology
FTSE Index Construction Methodology.qxp_Layout 1 05/08/2015 14:03 Page 26
27
5.8 Cumulative Normal versus Rank Scoring
As noted in Section 2, in the limit of a normally distributed factor and large sample size the Cumulative Normal and simple Rankscoring will yield identical outcomes. However, factors are unlikely to be normally distributed and sample sizes are limited. Indeedfor the Earnings Yield factor using the FTSE Developed universe, (approximately 2000 stocks) one can show that the averageabsolute weight difference through time for indices constructed using each approach is 4.8%. The respective performancestatistics for indices constructed from a market capitalisation weighted underlying index are shown in Table 9.
Table 9: Cumulative Normal versus Rank Scoring
FTSE Developed Cumulative Normal Rank
Geometric Mean (%) 1.66 3.26 3.19
Volatility (%) 17.14 17.47 17.40
Volatility Reduction (%) -1.90 -1.50
Sharpe Ratio 0.10 0.19 0.18
DD (%) -58.95 -59.40 -59.24
Two Way Turnover (%) 106.20 99.19
Excess (%) 1.58 1.51
Tracking Error (%) 2.09 1.94
Information Ratio 0.76 0.78
Alpha (%) 1.59 1.51
Alpha T-Stat 2.84 2.92
Beta 1.01 1.01
Capacity (WCR) 1.00 1.30 1.26
Value Loading 0.00 0.59 0.53
Source FTSE: FTSE Developed; capitalisation weighted underlying index; USD price returns; May 2000 to October 2013. Past performance is no guarantee of future
results. Returns shown may reflect hypothetical historical performance. Please see page 36 for important legal disclosures.
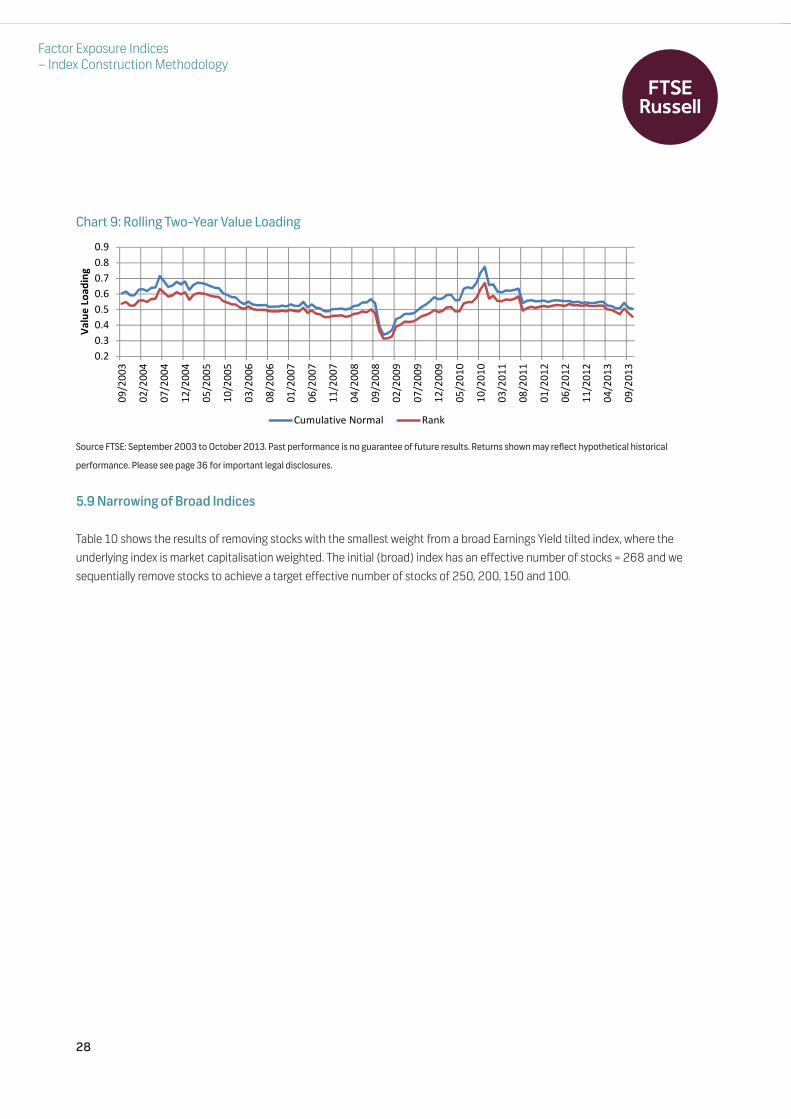
The results are similar apart from the degree to which the indices load on value over the period. Value exposure under thecumulative normal approach is higher. Indeed this remains the case if value loading is calculated over rolling two-year windows ascan be seen in Chart 9. The cumulative normal approach consistently achieves a higher level of loading on the given factor.
Factor Exposure Indices – Index Construction Methodology
FTSE Index Construction Methodology.qxp_Layout 1 05/08/2015 14:03 Page 27
28
Chart 9: Rolling Two-Year Value Loading
Source FTSE: September 2003 to October 2013. Past performance is no guarantee of future results. Returns shown may reflect hypothetical historical
performance. Please see page 36 for important legal disclosures.
5.9 Narrowing of Broad Indices
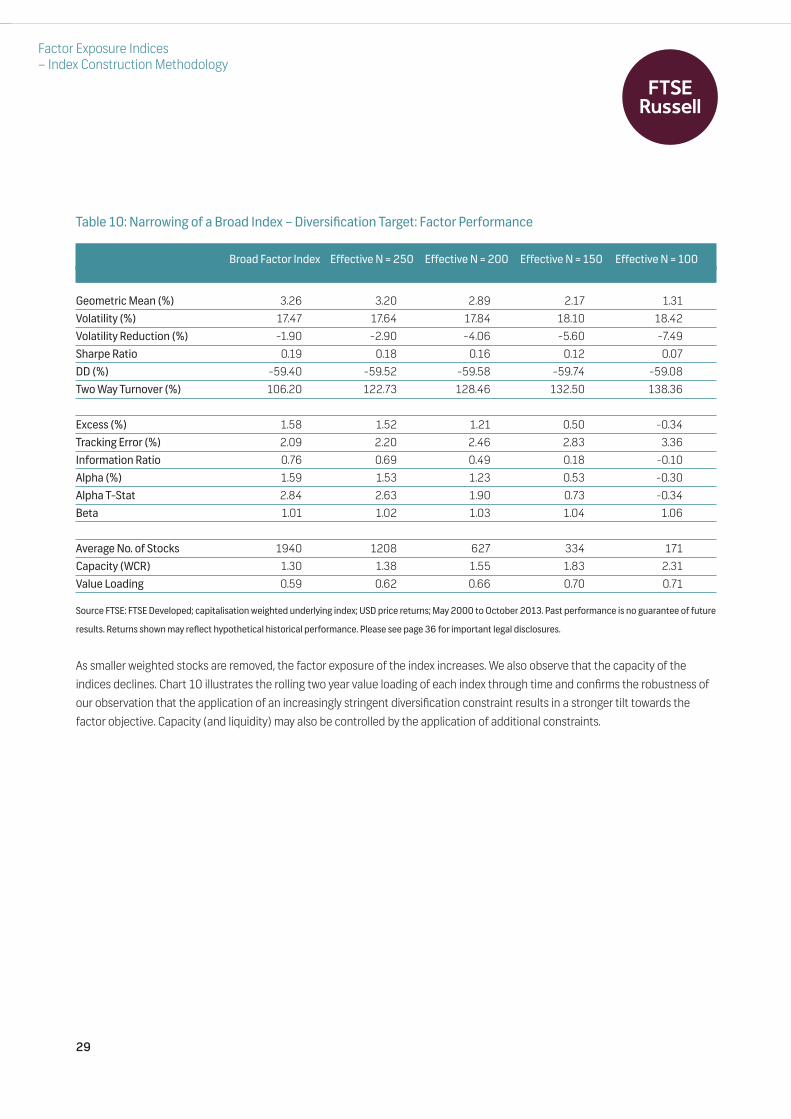
Table 10 shows the results of removing stocks with the smallest weight from a broad Earnings Yield tilted index, where theunderlying index is market capitalisation weighted. The initial (broad) index has an effective number of stocks = 268 and wesequentially remove stocks to achieve a target effective number of stocks of 250, 200, 150 and 100.
Factor Exposure Indices – Index Construction Methodology
�����������������������
������
�������
�������
�������
�������
�������
������
�������
�������
�������
�������
�������
�������
�������
�������
�������
�������
�������
������
�������
�������
�������
�������
������
������
�!���������
�).)$-�&/#����.-$ 0-�1
FTSE Index Construction Methodology.qxp_Layout 1 05/08/2015 14:03 Page 28
29
Table 10: Narrowing of a Broad Index – Diversification Target: Factor Performance
Broad Factor Index Effective N = 250 Effective N = 200 Effective N = 150 Effective N = 100
Geometric Mean (%) 3.26 3.20 2.89 2.17 1.31
Volatility (%) 17.47 17.64 17.84 18.10 18.42
Volatility Reduction (%) -1.90 -2.90 -4.06 -5.60 -7.49
Sharpe Ratio 0.19 0.18 0.16 0.12 0.07
DD (%) -59.40 -59.52 -59.58 -59.74 -59.08
Two Way Turnover (%) 106.20 122.73 128.46 132.50 138.36
Excess (%) 1.58 1.52 1.21 0.50 -0.34
Tracking Error (%) 2.09 2.20 2.46 2.83 3.36
Information Ratio 0.76 0.69 0.49 0.18 -0.10
Alpha (%) 1.59 1.53 1.23 0.53 -0.30
Alpha T-Stat 2.84 2.63 1.90 0.73 -0.34
Beta 1.01 1.02 1.03 1.04 1.06
Average No. of Stocks 1940 1208 627 334 171
Capacity (WCR) 1.30 1.38 1.55 1.83 2.31
Value Loading 0.59 0.62 0.66 0.70 0.71
Source FTSE: FTSE Developed; capitalisation weighted underlying index; USD price returns; May 2000 to October 2013. Past performance is no guarantee of future
results. Returns shown may reflect hypothetical historical performance. Please see page 36 for important legal disclosures.
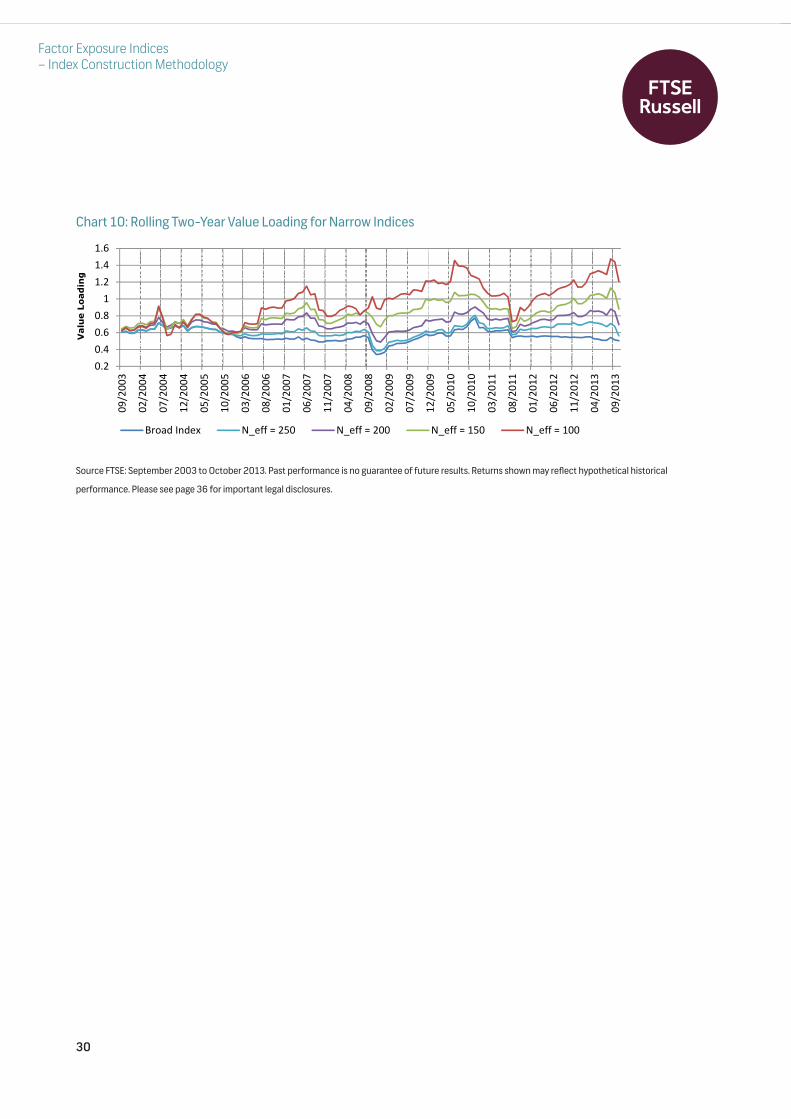
As smaller weighted stocks are removed, the factor exposure of the index increases. We also observe that the capacity of theindices declines. Chart 10 illustrates the rolling two year value loading of each index through time and confirms the robustness ofour observation that the application of an increasingly stringent diversification constraint results in a stronger tilt towards thefactor objective. Capacity (and liquidity) may also be controlled by the application of additional constraints.
Factor Exposure Indices – Index Construction Methodology
FTSE Index Construction Methodology.qxp_Layout 1 05/08/2015 14:03 Page 29
30
Chart 10: Rolling Two-Year Value Loading for Narrow Indices
Source FTSE: September 2003 to October 2013. Past performance is no guarantee of future results. Returns shown may reflect hypothetical historical
performance. Please see page 36 for important legal disclosures.
Factor Exposure Indices – Index Construction Methodology
�������������
���������
������
�������
�������
�������
�������
�������
������
�������
�������
�������
�������
�������
�������
�������
�������
�������
�������
�������
������
�������
�������
�������
�������
������
������
(��-"�2�"#3 �4#55�6���� �4#55�6���� �4#55�6���� �4#55�6����
FTSE Index Construction Methodology.qxp_Layout 1 05/08/2015 14:03 Page 30

31
Table 11 shows the result of applying the same process, using both a diversification constraint with Effective N >= 200 and acapacity constraint with WCR <= 1.5. Note that both the diversification and capacity are controlled in the resulting narrow factorindex.
Table 11: Narrowing Index – Diversification and Capacity Targets: Factor Performance
FTSE Developed Broad Factor Index Narrow Factor Index
Geometric Mean (%) 1.66 3.26 2.98
Volatility (%) 17.14 17.47 17.78
Volatility Reduction (%) -1.90 -3.73
Sharpe Ratio 0.10 0.19 0.17
DD (%) -58.95 -59.40 -59.60
Two Way Turnover (%) 106.20 128.06
Excess (%) 1.58 1.30
Tracking Error (%) 2.09 2.39
Information Ratio 0.76 0.54
Alpha (%) 1.59 1.32
Alpha T-Stat 2.84 2.09
Beta 1.01 1.03
Average No. of Stocks 1940 1940 763
Effective N 340 268 219
Capacity (WCR) 1.00 1.30 1.48
Value Loading 0.00 0.59 0.64
Source FTSE: FTSE Developed; capitalisation weighted underlying index; USD price returns; May 2000 to October 2013. Past performance is no guarantee of future
results. Returns shown may reflect hypothetical historical performance. Please see page 36 for important legal disclosures.
Factor Exposure Indices – Index Construction Methodology
FTSE Index Construction Methodology.qxp_Layout 1 05/08/2015 14:03 Page 31
32
6. Conclusions
We have set out a transparent approach to the creation oflong-only factor indices that exhibit intentional exposure tofactor(s) of interest by tilting an underlying index towards (oraway) from a given factor. The underlying index may take anyform. For example the underlying index may be marketcapitalisation weighted, equally-weighted, or an exotic set ofalternatively weighted index weights.
At each rebalance the cross-section of factor values areconverted to a set of Z-Scores with suitably truncated extremevalues. The Z-Scores are then mapped to a set of Scores usingthe Cumulative Normal function. We have shown that thecumulative normal is superior in many respects to othercommonly used functions. The Scores are used to create atilted set of index weights by multiplying the underlying indexweights by the Scores and normalizing. The resulting tiltedindex is guaranteed to have a greater exposure to the factorthan the underlying index.
We illustrated the application of this methodology to theconstruction of a simple Earnings Yield Index, using both amarket capitalisation and equally weighted underlying index forthe FTSE Developed universe. We gradually extended theempirical approach to highlight the flexibility of themethodology; creating a composite value index, comprisingEarnings Yield and Book to Price and a value-momentum tilt-tilt index of Earnings Yield and Twelve Month Price Momentum.
We outlined possible approaches to controlling the extent ofany factor tilt; either through the second moment ofcumulative normal mapping scheme or through the applicationof multiple tilts to the same factor.
We can further increase the exposure of this broad index to thefactor of interest by removing stocks that contribute trivially toit while respecting capacity and diversification constraints. Theaddition of country or industry weight limits may also be readilyincorporated in to the approach. The result is a narrow,practical index that endeavours to represent the performanceof specific factor risk premia in a realisable manner.
The approach outlined is general and may be extended toincorporate tilts on multiple factors simultaneously. A factorindex that is tilted towards more than one factor can beproduced simply within this framework. We highlighted theimportance of distinguishing between positive and negativelycorrelated factors. If a set of factors are positively correlatedwith one another a composite factor may be formed byaveraging Z-Scores. Where factors are negatively correlated,such averaging may result in limited exposure to either factor(since Z-Scores offset). In this situation, tilting the underlyingindex towards each factor separately ensures that the resulting“tilt-tilt” index has substantial exposure to both factors.
Factor Exposure Indices – Index Construction Methodology
FTSE Index Construction Methodology.qxp_Layout 1 05/08/2015 14:03 Page 32
33
Appendix A. Regression Analysis
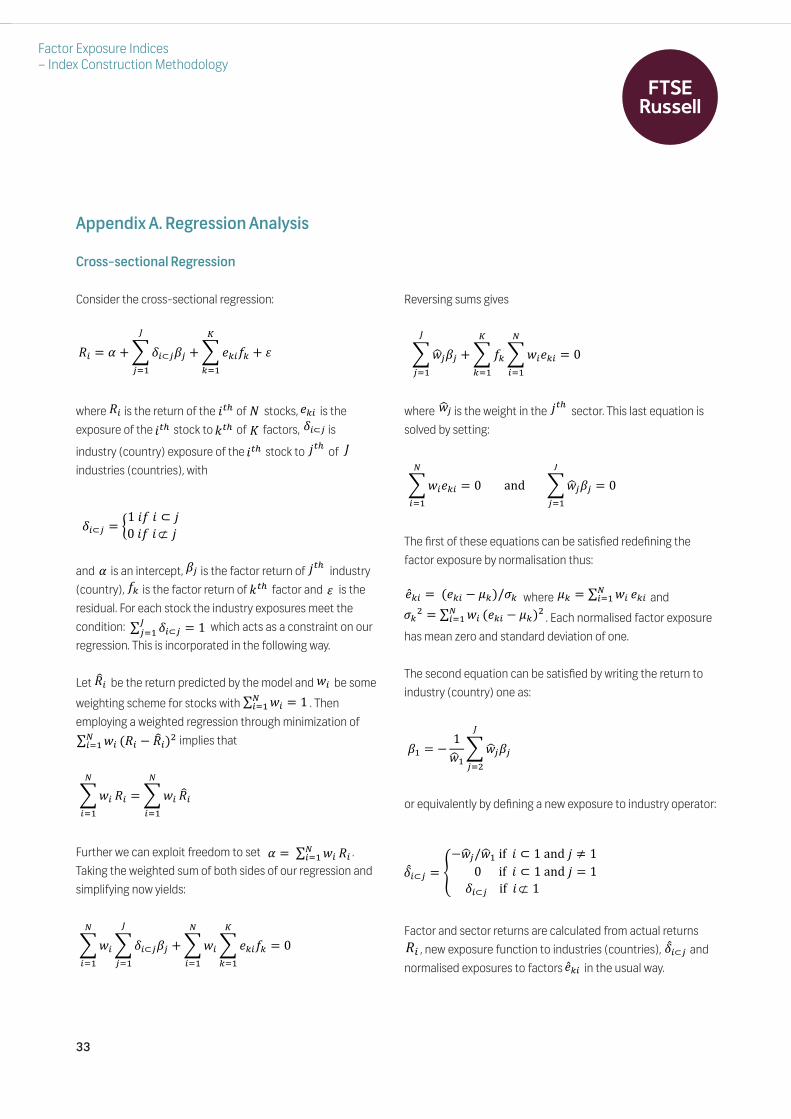
Cross-sectional Regression
Consider the cross-sectional regression:
where is the return of the of stocks, is theexposure of the stock to of factors, is
industry (country) exposure of the stock to ofindustries (countries), with
and is an intercept, is the factor return of industry(country), is the factor return of factor and is theresidual. For each stock the industry exposures meet thecondition: which acts as a constraint on ourregression. This is incorporated in the following way.
Let be the return predicted by the model and be some
weighting scheme for stocks with . Thenemploying a weighted regression through minimization of
implies that
Further we can exploit freedom to set .Taking the weighted sum of both sides of our regression andsimplifying now yields:
Reversing sums gives
where is the weight in the sector. This last equation issolved by setting:
The first of these equations can be satisfied redefining thefactor exposure by normalisation thus:
where and
. Each normalised factor exposurehas mean zero and standard deviation of one.
The second equation can be satisfied by writing the return toindustry (country) one as:
or equivalently by defining a new exposure to industry operator:
Factor and sector returns are calculated from actual returns , new exposure function to industries (countries), and
normalised exposures to factors in the usual way.
O� � : $9P�Q6R6S6<= $9�T��TU
T<= $ V
O� &>? � �T�&>? W>? X P�Q6&>? @>? Y
P�Q6 � *#%&�%& Q @�%&�%&⊄ %@%% : R6 @>?�T W>? V
5 P�Q6S6<= � #
OZ� [�5 [�A�<= � #5 [�A�<= O� � OZ���
9[�A�<= O� � 9[�
A�<= OZ�
: � %5 [�A�<= O�
9[�A�<= 9P�Q6R6S
6<= $9[�A�<= 9�T��TU
T<= � �
9[\6R6S6<= $9�TU
T<= 9[��T�A�<= � �
[\6 @>?
9[��T�A�<= � �%%%%%%%%]^_%%%%%%%9[\6R6S
6<= � �
�̀T� � % �T� � T��T T � 5 [�A�<= �T�T� � 5 [�A�<= �T� � T��
R= � � #[\=9[\6R6S6<�
Pa�Q6 � b�[\6�[\=%cd%%& Q #%]^_%@ e #%%%%%%%%�%%%%%%cd%%& Q #%]^_%@ � #P�Q6%%%%cd%%&⊄ %#%%%%%%%%%%%%%%% %
O� Pa�Q6�̀T�
Factor Exposure Indices – Index Construction Methodology
FTSE Index Construction Methodology.qxp_Layout 1 05/08/2015 14:03 Page 33
34
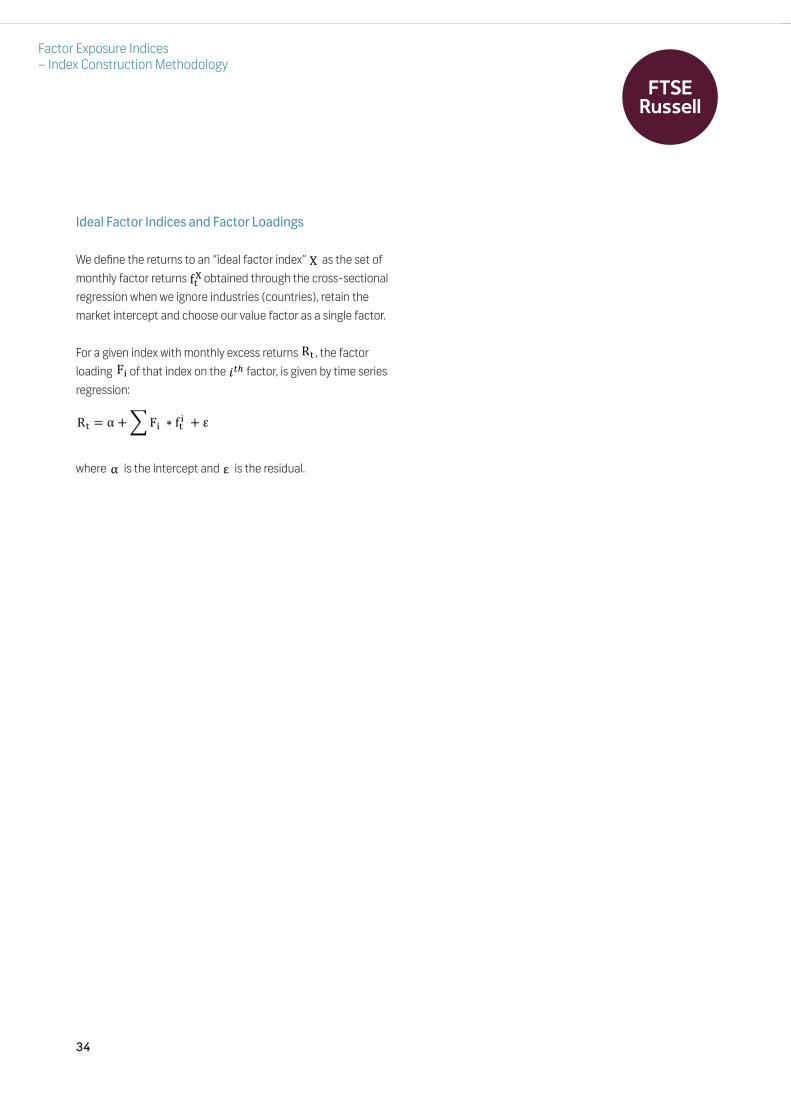
Ideal Factor Indices and Factor Loadings
We define the returns to an “ideal factor index” as the set ofmonthly factor returns obtained through the cross-sectionalregression when we ignore industries (countries), retain themarket intercept and choose our value factor as a single factor.
For a given index with monthly excess returns , the factorloading of that index on the factor, is given by time seriesregression:
where is the intercept and is the residual.
fdgh
igjk &>?ig � l $9jk %4 dgk %$ m
l m
Factor Exposure Indices – Index Construction Methodology
FTSE Index Construction Methodology.qxp_Layout 1 05/08/2015 14:03 Page 34
35
Appendix B. Capacity, Diversification andFactor Exposure
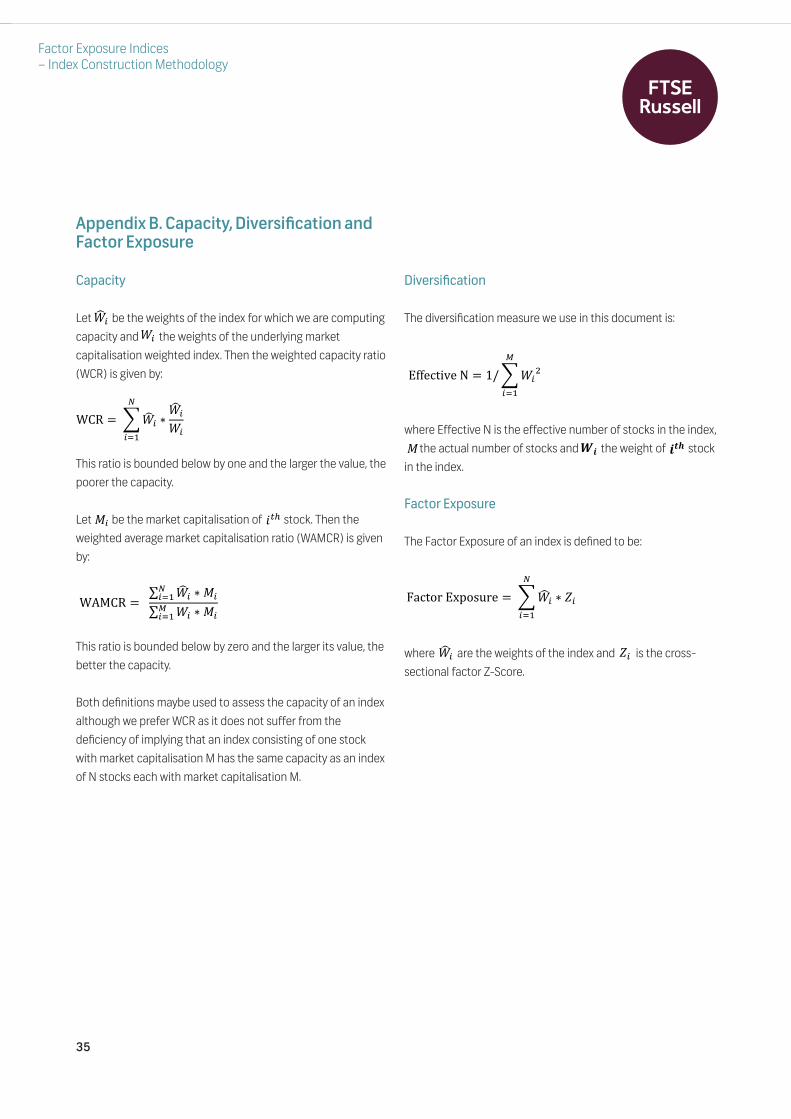
Capacity
Let be the weights of the index for which we are computingcapacity and the weights of the underlying marketcapitalisation weighted index. Then the weighted capacity ratio(WCR) is given by:
This ratio is bounded below by one and the larger the value, thepoorer the capacity.
Let be the market capitalisation of stock. Then theweighted average market capitalisation ratio (WAMCR) is givenby:
This ratio is bounded below by zero and the larger its value, thebetter the capacity.
Both definitions maybe used to assess the capacity of an indexalthough we prefer WCR as it does not suffer from thedeficiency of implying that an index consisting of one stockwith market capitalisation M has the same capacity as an indexof N stocks each with market capitalisation M.
Diversification
The diversification measure we use in this document is:
where Effective N is the effective number of stocks in the index,the actual number of stocks and the weight of stock
in the index.
Factor Exposure
The Factor Exposure of an index is defined to be:
where are the weights of the index and is the cross-sectional factor Z-Score.
23� 2�
noi � %923� 4 23�2�A�<=
"� &>?
npqoi � %%5 23� 4 "�A�<=5 2� 4 "�;�<=
rddstucvs%w � #�92��;�<= %
yz{ " xy
���������� �� � ����� � ���
���
��� ��
Factor Exposure Indices – Index Construction Methodology
FTSE Index Construction Methodology.qxp_Layout 1 05/08/2015 14:03 Page 35
36
References
[1] Fama, E. F., and French, K.R. “The Cross-Section of Expected Stock Returns.” Journal of Finance, v. 47, June 1992, pp.427-465.
[2] Fama, E. F., and French, K.R. “Common Risk Factors in the Returns on Bonds and Stocks.” Journal of Financial Economics, v. 33,February 1993, pp.3-53.
[3] Chan, L. K. C., Jegadeesh, N. and Lakonishok J. “Momentum Strategies.” Journal of Finance, v. 51, December 1996, pp.1681-1713.
[4] Chan, K., Hameed, A., and Tong, W. “Profitability of Momentum Strategies in the International Equity Markets.” Journal ofFinancial & Quantitative Analysis, v. 35, June 2000, pp.153-172.
[5] Cass Consulting, “Evaluation of Alternative Equity Indices .“ Cass Business School Report, 2013.
[6] Arnot, R. D., Hsu, J., Kalesnik, V., and Tindall, P., “The Surprising Alpha From Malkiel’s Monkey and Upside Down Strategies.”Journal of Portfolio Management, Summer 2013, Vol. 39, No. 4: pp. 91-105.
[7] Ilmanen, A., and Kizer, J. “The Death of Diversification has Been Greatly Exaggerated.” Journal of Portfolio Management Spring2012, Vol. 38, No. 3: pp. 15-27.
[8] Blitz, D. “Strategic Allocation to Premiums in the Equity Market.” Journal of Index Investing, Spring 2012, Vol. 2, No. 4: pp. 42-49.
[9] Ang, A., Goetzman, W.N., and Schaefer, S.M. “Evaluation of Active Management of the Norwegian Government Pension Fund –Global.” December 2009.
Factor Exposure Indices – Index Construction Methodology
FTSE Index Construction Methodology.qxp_Layout 1 05/08/2015 14:03 Page 36

For further information, please contact:
Beijing +86 10 5833 2202Dubai +971 4 319 9901Hong Kong +852 2164 3333London +44 (0) 20 7866 1810Milan +39 02 3604 6953
Mumbai +91 22 6649 4180New York +1 888 747 FTSE (3873)Paris +33 (0)1 53 76 82 89San Francisco +1 888 747 FTSE (3873)Sao Paulo +55 21 9983 5788
Shanghai +86 21 6058 9131Sydney +61 (2) 9293 2864Tokyo +81 (3) 3581 2811Toronto +1 416 572 7979
© 2015 London Stock Exchange Group companies.
London Stock Exchange Group companies includes FTSE International Limited (“FTSE”), Frank Russell Company (“Russell”), MTS Next Limited (“MTS”), and FTSE TMXGlobal Debt Capital Markets Inc (“FTSE TMX”). All rights reserved.
“FTSE®”, “Russell®”, “MTS®”, “FTSE TMX®” and “FTSE Russell” and other service marks and trademarks related to the FTSE or Russell indexes are trade marks of theLondon Stock Exchange Group companies and are used by FTSE, MTS, FTSE TMX and Russell under licence.All information is provided for information purposes only. Every effort is made to ensure that all information given in this publication is accurate, but no responsibility orliability can be accepted by the London Stock Exchange Group companies nor its licensors for any errors or for any loss from use of this publication.
Neither the London Stock Exchange Group companies nor any of their licensors make any claim, prediction, warranty or representation whatsoever, expressly orimpliedly, either as to the results to be obtained from the use of FTSE Russell Indexes the or the fitness or suitability of the Indexes for any particular purpose to whichthey might be put.
The London Stock Exchange Group companies do not provide investment advice and nothing in this communication should be taken as constituting financial orinvestment advice. The London Stock Exchange Group companies make no representation regarding the advisability of investing in any asset. A decision to invest in anysuch asset should not be made in reliance on any information herein. Indexes cannot be invested in directly. Inclusion of an asset in an index is not a recommendationto buy, sell or hold that asset. The general information contained in this publication should not be acted upon without obtaining specific legal, tax, and investmentadvice from a licensed professional.
No part of this information may be reproduced, stored in a retrieval system or transmitted in any form or by any means, electronic, mechanical, photocopying, recordingor otherwise, without prior written permission of the London Stock Exchange Group companies. Distribution of the London Stock Exchange Group companies’ indexvalues and the use of their indexes to create financial products require a licence with FTSE, FTSE TMX, MTS and/or Russell and/or its licensors.The Industry Classification Benchmark (“ICB”) is owned by FTSE. FTSE does not accept any liability to any person for any loss or damage arising out of any error oromission in the ICB.
Past performance is no guarantee of future results. Charts and graphs are provided for illustrative purposes only. Index returns shown may not represent the results ofthe actual trading of investable assets. Certain returns shown may reflect back-tested performance. All performance presented prior to the index inception date isback-tested performance. Back-tested performance is not actual performance, but is hypothetical. The back-test calculations are based on the same methodologythat was in effect when the index was officially launched. However, back- tested data may reflect the application of the index methodology with the benefit of hindsight,and the historic calculations of an index may change from month to month based on revisions to the underlying economic data used in the calculation of the index.
This publication may contain forward-looking statements. These are based upon a number of assumptions concerning future conditions that ultimately may prove tobe inaccurate. Such forward-looking statements are subject to risks and uncertainties and may be affected by various factors that may cause actual results to differmaterially from those in the forward-looking statements. Any forward-looking statements speak only as of the date they are made and neither London Stock ExchangeGroup companies nor their licensors assume any duty to and do not undertake to update forward-looking statements.
FTSE Index Construction Methodology.qxp_Layout 1 05/08/2015 14:03 Page 37