facility redesign for increased throughput and improved
TRANSCRIPT

FACILITY REDESIGN FOR INCREASED THROUGHPUT AND IMPROVED PRODUCT
FLOW OF SHARK RACK PRODUCTS FINAL ASSEMBLY AT PARIS PRECISION
A Senior Project submitted
In Partial Fulfillment
of the Requirements for the Degree of
Bachelor of Science in Industrial Engineering
To the Faculty of California Polytechnic State University,
San Luis Obispo
by
Karina Hromyak
Julia Remnant
May 2016
Graded by:______________ Date of Submission__________________________
Checked by:_____________ Approved by:_____________________________

1
Abstract
Paris Precision is a metal fabrication company that fabricates metal components for
various companies, one of which is Shark Rack, which creates high end server racks. Shark Rack
has plans for a dramatic increase in demand over the next two years. Paris Precision’s Final
Assembly area is currently not conducive to produce such a large increase in demand. A redesign
of the Final Assembly facility is needed to handle the increase in production and to improve
product flow through the space. The project team’s objectives are to:
● Study current Final Assembly production process
● Analyze the production flow
● Create an ideal state facility redesign
● Propose recommendations of layout and staffing based off the results
The project team will follow the DMAIC process and use various Industrial Engineering
tools to identify how much space is required for the increased demand, how each department
within the facility should be laid out, and how many employees will be required to meet demand.
First, the team performed time studies on the production process and observed the flow
through the facility. The dimensions and current layout were taken to create a current state
facility model using SketchUp software. Next, the project team used Simio simulation software
to determine how many employees will be necessary to produce the Shark Racks at increased
demand. The team then used SketchUp to create a digital design of the new proposed layout,
using employee feedback, relationship diagrams, space requirements, and demand requirements
to produce a final recommended layout.
From the findings, the group found that two employees were required to meet the future
increase in demand of 200 Shark Racks per month. The proposed layout ended up being
approximately double in size, with improved mobility for forklifts and movement of Shark Racks
throughout the facility. The new facility layout also provided ease of movement between
departments and promoted a natural flow of product through the facility.
The total cost of implementing this layout was calculated to be $6,500.00 with two total
employees working in Shark Rack Final Assembly. The project team highly recommends this
new facility layout if Shark Rack hopes to achieve enough capacity for their projected demand.

2
Table of Contents
List of Tables .................................................................................................................................. 3
List of Figures ................................................................................................................................. 4
I. Introduction ................................................................................................................................. 5
II. Background and Literature Review ............................................................................................ 6
Literature Review .................................................................................................................... 7
Inventory Control: ............................................................................................................... 7
Assembly and Costs of Manufacturing: .............................................................................. 9
Lead Time Reduction:....................................................................................................... 12
Facility Design: ................................................................................................................. 14
III. Design ..................................................................................................................................... 16
Current State: ......................................................................................................................... 16
Employee Interview/Input: .................................................................................................... 18
Design Constraints:................................................................................................................ 18
Time Studies: ......................................................................................................................... 18
Calculations: .......................................................................................................................... 21
Reasoning: ............................................................................................................................. 23
Design Specifications: ........................................................................................................... 24
Design Requirements:............................................................................................................ 25
Modeling:............................................................................................................................... 25
IV. Methods .................................................................................................................................. 26
Simio Modeling: .................................................................................................................... 26
SketchUp: .............................................................................................................................. 27
V. Results and Discussion............................................................................................................. 29
Simio Model Findings: .......................................................................................................... 29
Facility Layout Findings:....................................................................................................... 29
Cost Analysis Results: ........................................................................................................... 32
Obstacles and Lessons Learned: ............................................................................................ 33
VI. Conclusion .............................................................................................................................. 34
References ..................................................................................................................................... 36
APPENDIX ................................................................................................................................... 38

3
List of Tables
Table 1. Current State Department Square Footage ..................................................................... 16
Table 2. Time Study for five Subassemblies ................................................................................ 19
Table 3. Time Study for five 0% to 85% Shark Racks ................................................................. 19
Table 4. Time Study for five 85% to 100% Shark Racks ............................................................. 19
Table 5. Set-up Times ................................................................................................................... 20
Table 6. Cycle Time for five Shark Racks .................................................................................... 20
Table 7. Allowance Calculation .................................................................................................... 44
Table 8. Revised Department Square Footage Requirements ...................................................... 24
Table 9. Total Revenue in Current and Re-Design State .............................................................. 32
Table 10. Improvements and Costs ............................................................................................... 32
Table 11. Square Footage Cost ..................................................................................................... 44

4
List of Figures
Figure 1. Four Shark Rack models ............................................................................................... 38
Figure 2. Final Assembly Rough Floor Plan ................................................................................ 38
Figure 3. Spaghetti Diagram: Current State .................................................................................. 17
Figure 4. Minimum Illumination Levels for Specific Various Functions .................................... 39
Figure 5. Approximate Reflectance for Watt and Ceiling Finishes .............................................. 39
Figure 6. The Percent Effective Ceiling Reflectance (ECR) ........................................................ 40
Figure 7. Coefficient of Utilization (CU) ..................................................................................... 40
Figure 8. Lumens Output .............................................................................................................. 41
Figure 9. Lamp Luminary Dirt Depreciation Factors ................................................................... 41
Figure 10. Proposed Luminary Placement .................................................................................... 23
Figure 11. Department Relationships ........................................................................................... 24
Figure 12. Add-On Process Triggers ............................................................................................ 41
Figure 13. Simio model of Final Assembly .................................................................................. 27
Figure 14. Current State Facility Right Side View ....................................................................... 42
Figure 15. Current State Facility Left Back View ........................................................................ 42
Figure 16. Current State Facility Top View6................................................................................ 43
Figure 17. Current State Facility Back View ................................................................................ 43
Figure 18. Simio Model: Throughput per Week ........................................................................... 29
Figure 19. Re-Design Facility Layout .......................................................................................... 30
Figure 20. Re-Design Facility Layout .......................................................................................... 31
Figure 21. Re-Design Facility Layout .......................................................................................... 31

5
I. Introduction
In the competitive industry of metal fabrication, good customer relationships and low
lead times are crucial to stay relevant. Paris Precision, a metal fabrication company, understands
that lead times and cutting costs on inventory are a paramount aspect of maintaining a successful
and growing business. From commercial airplane interiors to industrial server racks, this
company uses state of the art machinery and shrewd engineering and business practices to create
a wide range of products at the highest quality level. As the revival of the Shark Rack server rack
product line has taken place, Paris Precision has seen the need for clear cut, defined, and efficient
assembly and inventory control methods.
As this product line is expected to double in sales in the next fiscal year, Paris Precision
is adamant about reducing order fulfillment lead times, reducing the amount of inventory created
from this product line’s production, reducing storage space of WIP, and reorganizing assembly
workstations. These efforts will be reached by creating a more efficient, cohesive, concise final
assembly and storage environment of Shark Rack products.
The objectives of this report are as follows:
● Create a process flow of final assembly workstation steps
● Design a staging, assembly, and storage space within Paris Precision’s current Final
Assembly work area that accommodates all aspects of Shark Rack WIP and finished
products storage
Not included in the scope of this project is the creation of an inventory analysis, nor the
consolidation of the products production flow. These are due to either time related inadequacies
and production realities. Only final assembly is taken into consideration when designing a new
workstation layout.
In order to complete these objectives, the project team, comprised of Karina Hromyak
and Julia Remnant, conducted the following:
● Product storage configuration analysis to accommodate for all pre-final assembly Shark
Rack products
● Workstation and product flow analysis within final assembly to decrease lead time
● Final assembly facility redesign to accommodate all Shark Rack WIP and final products
The remainder of this report will continue with a more detailed background of this project
and outline the research completed by the team through review of relevant literature. The report
will also describe the process of designing a production process flow and a facility workstation
redesign, the methods used to produce these deliverables, the potential cost saving business
improvement impacts resulting from these efforts, and conclusions about the real impact these
changes can bring to the revival of the Shark Rack product line.

6
II. Background and Literature Review
Paris Precision is looking to expand their sales of their Shark Rack server racks within
the next year. In an effort to do so, they would like to increase final assembly capacity and
improve production flow and inventory storage methods. They currently have four different
Shark Rack models that have slight variations from one another. The four Shark Rack models
can be found in Figure 1 in the Appendix. Because they have four existing models, they have
implemented an 85% assembly completion method that fulfills the assembly of the racks to 85%
of the total assembly required. The remaining 15% of assembly can include customized features
or add-ons specified in each customer’s order. Therefore, when a customer order is received, the
final assembly of the product can be customized to the desired level of demand and shipped out
with the shortest lead time possible.
Paris Precision has recently moved their Final Assembly work area due to facility
relocations within the factory. The new work area consolidates three different aspects of Shark
Rack production: assembly, inventory storage, and final product storage. This new work area
needs to be able to withstand future growth of the Shark Rack product line, promote a productive
assembly environment, as well as a final product and assembly part inventory storage. The
current layout inhibits the ability to efficiently store and retrieve inventory and parts required for
final assembly, while at the same time assembling the racks in the same area. This issue
coincides with a poor assembly process flow and no pre-assembly/staging area. The area needs
to be redesigned to allow for maximum capacity of assembly and storage of part inventory to
meet the desired demand for future years.
Originally, the project team was asked to redesign the Final Assembly area within the
factory, given the constraints of the current dimensions. However, midway through the project,
the team was informed that Paris Precision’s facility located in Paso Robles was closing within
the next two months. Shark Rack would be relocated to another facility. The group and the
stakeholders decided to redirect the project to be designed for an ideal state.

7
Literature Review
The following literature review covers topics related to the project. These topics include
inventory control, assembly and costs of manufacturing, lead time reduction, and facility design.
Inventory Control:
Controlling inventory is important for every company. The following describes certain
aspects of inventory within a manufacturing plant, the effects inventory has on a production
process, and methods of inventory control. Paris Precision currently has a high amount of
inventory causing increased costs relating to storage space and unused material. When being
consolidated into an assembly environment, the large amount of inventory storage decreases
potential work space.
Accuracy and productivity are important aspects to consider in inventory control.
Inaccuracy in an inventory control system can create three main consequences: poor customer
service, incorrect production and purchase plans, and reduced production efficiency (Young, 8).
First, it can result in poor customer service due to shortages. This can be particularly relevant to
the Shark Rack process as it could affect lead time if there were shortages of product. Reduced
production efficiencies can be seen when inaccuracies cause emergency orders, extra material
handling, unnecessary machine setups, and potentially poor morale in the facility.
Young also describes a method for creating and keeping physical inventory. He describes
one method in detail that illuminates how to create and manage a dynamic inventory. Young
explains a physical inventory system based on clerks working with counting sheets. Once this
initial inventory is established, Young describes cycle counting as a way to keep track of
accuracy within the inventory system. Counting is done in small batches to check small sections
of inventory as a sample of the accuracy of the whole system. Cycle counting can catch and
correct inventory errors along with measuring the accuracy of the firm’s inventory records
(Young, 198). This is particularly useful when trying to maintain an accurate BOM and
inventory record. This method of inventory counting and checking could be used when
consolidating their inventory and for keeping track of inventory once it is consolidated into the
new Shark Rack assembly area. Lastly, Young explains different methods of material storage.
Some material storage devices can be pallet racks, or mezzanines to access material stack on
high racks. Mezzanines are especially useful when floor space is limited.
Different ways to analyze the nature of WIP, inventory management, and major factors
affecting WIP are also necessary to consider in inventory control. In Managing Work-in-Process
Inventory by Kenneth Kivenko explains that a fully functional control system is necessary to
have effective inventory control. These control systems are called closed loop systems and are
designed for an ideal type of inventory environment, which means an already pre-established
inventory system is in place. There are some basic problems that contribute to ineffective
production inventory management. First, there could be unnecessary separation of responsibility
for scheduling, ordering, record keeping, control, and storage between departments. Second,

8
there may be inadequate separation of responsibility between inventory control and procurement
and inventory control and manufacturing. Next, it is important to consider inefficient materials
handling. There are four aspects of material handling. These four aspects are motion, time,
quantity, and space (Kivenko, 119). With motion, operators must be concerned with the process
of moving materials in the most efficient manner. With time, material must arrive at a workplace
at the right time. With quantity, the purpose of materials handling is to provide each stage of
production with the exact quantity of the right material in the correct batch sizes. Batch sizes are
of interest when talking about inventory created in the Shark Rack process. It will be important
for future growth to be able to correctly batch raw material as to not create excess inventory.
Lastly, storage space is discussed. Storage space, both used and unused, is a huge element to the
facility because storage costs a significant amount of money (Kivenko, 119). The material flow
pattern largely influences space requirements and control of inventory (Kivenko, 119). Also,
good utilization of space requires high stacking in storage areas, and thus storage areas and
material handling equipment that can withstand high stacking of heavy materials. The benefits of
material handling include outcomes such as reduced inventories, increased productive capacity,
improved space utilization, reduction in waste, and more efficient use of labor (Kivenko, 121).
Materials handling can eat up to 25-50% of production costs.
Work-in-process inventory increases the facility space required and can potentially
increase the time to process materials. In the article, "The Effect of Work-in-Process Inventory
Levels on Throughput and Lead Times”, Richard E. Crandall and Timothy H. Burwell explain
how WIP inventories often provide buffers between operations and prevent machinery from
being idle, in turn increasing efficiency and maximizing capacity (6). This causes more
inventory, but Crandall and Burwell say that the cost of having idle machinery is more than the
inventory costs (6). Having the WIP inventory also helps with balancing the production loads
and allows a room for error. The problem with having WIP inventory though, is that it could
potentially increase lead time.
Just-in-Time programs were created with the goal of reducing the WIP inventories.
Crandall and Burwell suggest a general approach to arbitrarily reduce the inventory and then
correct the problems that arise from the lower inventory levels (6). This process is then repeated
until the minimum level of inventory is achieved. This reduced inventory will then lead to
reduced lead times in the system. The relationship between reduced inventories and throughput is
unknown because it is possible that a reduced inventory can reduce throughput by not having as
many parts on hand, or a reduced inventory can increase throughput because of JIT
implementation and an increased schedule stability (Crandall, Burwell, 6). JIT operations can be
used to find the effect on reduced WIP on throughput, lead time, and utilization through a
manufacturing process. Throughput decreases as queue capacity decreases, as product variation
increases, and as the process complexity increases.
There is also a direct relationship between lead times and WIP inventories. Lead time
equals processing time plus queue time (Crandall, Burwell, 8). Therefore, lead time decreases as
queue capacity decreases, as product/process variability decreases, and as process complexity

9
decreases. Throughput and utilization decreases as WIP decreases. In order to reduce process
variability, the length of the line can be reduced by reducing the number of stations and by
reducing the process time variation by standardizing the products being marketed. These actions
of reducing variability are said to have “reduced WIP inventories and lead times while
maintaining or increasing levels of throughput and resource utilization” (Crandall, Burwell, 10).
Sometimes though, product/process variability cannot be reduced and there will be a trade-off
between lead times and throughput. This is the case for Paris Precision's Shark Racks, in which
we cannot change the set number of the four product lines they carry and the variations within
them. If high levels of throughput and utilization are desired, then WIP inventories will be
beneficial to account for the variability in the production process. As the variability is reduced,
the higher the throughput, the lower the lead times, and the lower the WIP inventory levels.
Assembly and Costs of Manufacturing:
The following section describes assembly methods, manufacturing costs, assembly line
balancing, and the benefits of having an assemble-to-order environment. Paris Precision will
need to redesign the final assembly flow of the Shark Rack product line in order to prepare for
the increase in capacity in the next year and reduce the lead time of orders.
Redford and Chal’s book Design for Assembly: Principles and Practice had some topics
that were particularly useful to this senior project. In chapter 4, titled “Product Design Factors
Dependent on Assembly Process”, product design factors dependent on assembly process was
discussed. There were 3 categories of assembly described. The first is manual, where assembly is
either serial or parallel. Next was dedicated assembly, which is strictly parallel assembly. Lastly
was flexible, which can also combine serial and/or parallel assembly (Redford and Chal, 48).
Each of these types of assembly have an associated assembly cost. However, they can all be
related to the following main concept. Either more production is needed from the same size
facility or the same amount of production is needed in a smaller facility. This is known as an
assembly cost ratio. This is a ratio of production rate to the size of the facility (Redford and Chal,
39). The higher that this ratio is, the less the cost of the assembly. The two factors influencing
this cost ratio are the amount of assembly effort required and the effectiveness of the assembly
effort. In chapter 5, titled “Product Design Factors Dependent on Assembly Method”, three
different types of assemblies were explained. They are single station assembly, line assembly,
and hybrid assembly (Redford and Chal, 59). In single station assembly, every aspect of
assembly is completed at one station all at once (Redford and Chal, 59). In line assembly, all
parts are assembled in succession of each other, with each station only completing one aspect of
the whole product. Hybrid assembly is a mixture of these two previous assemblies (Redford and
Chal, 59). There can be succession of assemblies, where there might be multiple steps completed
at each workstation. This type of assembly seems particularly applicable to the Shark Rack
assembly process. The assembly and production is largely a line assembly, however there are
some stages where multiple actions are completed at once. Examples of these types of assembly
areas at Paris Precision are welding and final assembly.
10
Next, elements of cost in manufacturing and warehousing, and also precision costing of
materials handling operation will be explored. When discussing the materials elements of cost in
manufacturing, there are many aspects to defining material costs. These aspects include direct
materials, indirect and/or contingent materials, burden materials, consumable tooling, power,
fuel, and office and sanitary supplies (Sims, 78). For the purpose of this senior project, indirect
materials and burden materials will be of special interest. In order to assess these, one would
need to use an inventory valuation technique. These valuation techniques include FIFO, LIFO,
Average, and Standard (Sims, 78). There are also major impacts of storage on total costs. When
products are being stored and handled, there is no change being made to the product (for most
industries, maybe not for steel as it can start to rust), and there is no value added to the product
(Sims, 223). When storing a product, it is important to consider the products dollar density.
Dollar density is the price placed on a certain predetermined “package cube” size (Sims, 224).
As the dollar density increases, or in other words as there is a reduction in the package cube, the
economics of handling and storage operations will improve by “increasing dollar throughput and
cash flow for greater profits” (Sims, 224).
Assembling products in advance is a method often used to reduce the risk of shortages as
well as reducing costs. This brings in the question as to how far in advance should these products
be assembled. In the journal article, “Optimal Decisions for Assemble-to-order Systems with
Uncertain Assembly Capacity”, Xiao, Yongbo, Jian Chen, and Chung-Yee Lee present a profit-
maximization model to determine optimal inventory based on demand to determine the best
production decisions. The article states that assemble-to-order systems have been widely adopted
in order to increase product variety and increase their response time with a low cost system
(Xiao, Chen, Lee, 1). A common conception they found to be true is that “the time to assemble a
product from its components is negligible; therefore, the production capacity is seldom
considered as a bottleneck during the assemble process” (Xiao, Chen, Lee, 1). However, they do
state that it can be a bottleneck if there are capacity issues because of sharing the capacity with
other products or machinery that may have a higher priority. The article suggests that a certain
quantity of final products should be assembled before the customer order is even received. Then,
after the demand is known, the rest of the products should be assembled and the inventories of
the components should be restocked. The first scenario they consider is an assemble-to-order
system with a single order of a product in which the future demand and the available assembly
capacity is known. Knowing the future demand from forecasting, a certain quantity of the final
product should be assembled in advance. The components should all be stocked based on the
demand at the time the order is placed and then the rest of the finished products ordered should
be assembled from the components. All components should be urgently replenished to safety
stock standards. Through numerical experiments, the study found that it is most profitable to
have a hybrid strategy of assembly-in-advance and assemble-to-order. Paris Precision currently
has this hybrid strategy process implemented, but needs improved organization of current storage
methods and improved on-hand quantity WIP inventory amounts.

11
Paris Precision is in need of a standardized assembly process to improve their lead time.
Modern assembly processes can aid in producing high quality and low cost products with
maximized efficiency. In Amarpreet Singh Bassan and Saranjit Singh’s case study, “Productivity
Improvement of a Compressor Assembly Plant Layout: Value Addition by Assembly Line
Balancing” in the book, Value Engineering, they examine a compressor assembly plant based on
time studies and cost models in operations at workstations and develop standard times. In the
manufacturing of products, the individual components must be fabricated and then assembled to
make the final product. The amount of labor in the product assembly must be split up into
different workstations where a certain amount of time will be spent at each workstation
depending on the task required. Some tasks present a limit on how they can be split up between
workstations, called the irreducible work element that would not make sense to be further
subdivided (Bassan and Singh, 118). The irreducible work elements present a challenge to the
assembly line. The goal is to prevent overloading or under loading of operators at each
workstation to ensure a smooth flow. Assigning work evenly to all workstations to achieve the
least cycle time is the process of assembly line balancing (Bassan and Singh, 119). In assigning
tasks to workstations, they must follow an ordered sequence of stations to satisfy precedence
requirements and to optimize the effectiveness of the order. The goals are to minimize balance
delay and throughput time, minimize the total cost of the line, minimize idle time of the
operators, have balanced work assignments at all stations that do not fluctuate based on product
model, minimize the overload of workers to ensure high quality and low rework, and minimize
inventory and set-up costs (Bassan and Singh, 119).
There are three categories of assembly line balancing techniques: Largest candidate rule,
ranked positional weights method, and computer line balancing software (Bassan and Singh,
119). The largest candidate rule says to rank the work elements based on standard times and to
have the first station be the work element with the longest time. The ranked positional weights
method considers the standard time and the precedence of each element. The elements with a
large number of work elements dependent upon being completed are assigned first. The
computer line balancing takes in all given information and produced line balancing simulations.
A case study at the Compressor Assembly Plant was performed on value addition to the
compressor assembly plant layout. They first drew out the initial layout of the plant, showing the
workflow and storage, which showed the plant did not have any properly fixed layout, creating
problems. Data was collected, the assembly operations were divided into tasks and arranged in
preceding order, and assumptions were made about the operations. Different cycle times and
workstations were created and the best one was chosen based on minimum balance delays and
minimum labor costs. The new balanced line is designed in a proposed layout of the plant.
Similar actions can be taken to propose a new assembly process for the Shark Rack line.
An important aspect of lean assembly is understanding and eliminating as much waste as
possible. Shortages of parts or of sub-assemblies are some of the most common reasons for wait
time in an assembly process. In order to prevent this wait time, it is important for Management to
create level workloads and balance the work between different assemblers (Baudin, 12). Process

12
waste is very difficult to detect, as it requires vast knowledge of the entire assembly process.
There is some psychology to the idea behind why workers will add steps to their assembly
process that are unnecessary. These workers might do this in an attempt to keep busy, or are
embarrassed that they have time on their hands while other workers around them are busy
(Baudin, 12).
A detailed analysis of assembly steps are needed in order to analyze the areas of
assembly that are wasteful, and that can be eliminated. There are many different tools to use to
collect data. There are three ways in particular that could be especially useful in the Shark Rack
assembly area. These methods are operator interviews, stopwatch studies, and videotaping
(Baudin, 104-105). In operator interviews, it would be even more useful to have more than one
operator answer a series of same questions, as they could be compared and analyzed against each
other. Stopwatch studies are useful in segments of a few minutes where there is extensive manual
intervention (Boudin, 104). Videotaping is very useful to help understand a longer assembly
process, as it can be sped up to get a better overall understanding of how a product is assembled.
This material could be viewed repeatedly, and operators could even view the video themselves.
Sometimes, when a worker sees him/herself in action, they can better understand how much or
how little of their effort is wasted in the assembly process (Bouldin, 105). This could be used in
the Shark Rack assembly, and the team could view the material with the assemblers to gain any
other insight that they might think of while watching the process.
Lead Time Reduction:
The goal of almost every company is to get their product to their customer in the shortest
amount of time possible from when the order is placed. In order to do so, lead time must be
reduced. Paris Precision’s main goal is to reduce their lead time from seven days to two days,
from the time they receive an order to the time they ship it to the customer, given they have
assemble to order items available. Below, manufacturing agility is discussed, as well strategies to
reduce lead time.
How product mix and manufacturing agility can help reduce production lead times are
discussed in C. Watanabe and B.K. Ane’s article about concurrent roles of modularity in
improving agility and reducing lead time. They defined modules as building blocks which enable
companies to customize a product by assembling various combinations of each of these modules
(572). Furthermore, modularity allows manufacturing companies to produce original modified
versions, which were just “derivatives of their basic models” (Watanabe and Ane, 573).
Modularity applies the concept of creating flexibility in the architecture of the product,
where a product can be designed around common parts, common fix turning geometries, and
standardized interfaces. As Watanabe and Ane stated, “agile manufacturing is defined as the
ability to accomplish rapid changeover between manufacturing of different assemblies” (574).
This is particularly applicable to the Shark Rack assembly process as it requires very little setup
of actual equipment, and rather staging of materials and sequence of setup. Furthermore, they
explained how changeovers display the ability to move from one assembly to another assembly

13
with a minimum change in tooling and/or equipment. As the Shark Rack final assembly process
does not have much change in tooling or equipment, their changeover time is virtually zero.
Having a low changeover time allows for great flexibility in production and allows for small
batch sizes, which Shark Rack seems to take advantage of as their batch sizes are currently at a
max of 5 total assemblies. Furthermore, increasing capability in a single flexible production line
in small batches results in higher degree of manufacturing agility, which results in a shorter
manufacturing lead time.
When trying to reduce lead time, it is important to try and use as many techniques for
reducing lead time that are relatively inexpensive and fairly simple to apply. In Hopp, Spearman,
and Woodruff’s article titled “Practical Strategies for Lead Time Reduction”, they entered a plant
where the process time for the product was about four hours and the average flow from the time
when the job was started until it was ready to ship was around four weeks. This manufacturing
environment is very similar to that of the Shark Rack assembly, as the assembly time for each
group of 5 racks is about four hours and the total production time is about six weeks. This article
describes the effects of shorter lead times from the perspectives of sales and offers the ability to
quote faster to customers and reduce the need to make forecasts about future demands. This is
also applicable to Shark Rack as they are trying to quadruple their sales in the next couple of
years. From the point of view of production, shorter lead times can improve quality management,
reduce in-process inventories, and allow easier overall management of the facility because there
will be fewer jobs to keep track of. These benefits can only be deemed beneficial if they can be
achieved without consequential sacrifices in other areas such as quality and throughput (Hopp,
Spearman, Woodruff, 78). The just-in-time (JIT) philosophy results in shorter lead times, lower
WIP, and thus lower space requirements. As the space provided by Paris Precision for the Shark
Rack assembly is limited in space, they almost have no choice but to provide a JIT environment,
which will incidentally reduce their lead times.
There are four simple strategies for reducing lead time that can self-explain their importance
and application. These strategies are looking for WIP, keep things moving, synchronize
production, and smooth the workflow. In regards to WIP, “excess inventory is the root of all
evil” (Hopp, Spearman, Woodruff, 79). However, not all inventory is bad. Some inventory is
needed to protect the bottlenecks. Little’s law can help us see that a means of identifying the
largest contributors to lead time is to find the largest inventories (Hopp, Spearman, Woodruff,
80). To keep things moving, it is important to always keep the product moving towards
completion because most of the time a product spends in a factory is spent waiting. When
synchronizing production, it is important to make sure that fabrication and assembly are
concurrent. It is often common to “produce based on what is available rather than what is
needed” (Hopp, Spearman, Woodruff, 81). It is of high importance to level work releases. When
there are small amounts of work released, there are shorter queues and quicker turnarounds. It is
important to release frequently and in small amounts, especially when trying to increase
production rates and capacity, as Shark Rack is trying to do.

14
Implementing a lean system allows for elimination of waste and continuous
improvement, which in turn results in a reduced lead time. Focusing in on eliminating waste
naturally creates conditions that lead to additional capacity and increased revenue (Bell, 16). Bell
states the seven forms of waste in the form of which were found during the development of the
Toyota Production System: inventory, delay, motion, transportation, overproduction,
overprocessing, and defects (17-19). Paris Precision currently has too much inventory on hand,
causing problems of waste in tied up storage facilities, obsolescence, time spent tracking items,
and a lack of movement capacity. Products with a longer lead time, require more planning and
scheduling, creating more uncertainty and greater differences between forecasts and reality (Bell,
120). This uncertainty is the reason for increased level of safety stock inventory. As lean is
implemented and lead times reduced, the forecast accuracy can be increased and the raw, WIP,
and final inventories reduced (Bell, 120).
Facility Design:
The facilities layout design within a manufacturing system is important for high
efficiency and work space productivity. Time, money, and space can all be saved if an effective
layout is created. The overall goal of a facilities design is to get the materials in, through and out,
as fast as possible at an acceptable cost, giving less opportunity for that material to collect labor
and overhead changes (Apple, 4). Paris Precision is in need of a new final assembly layout to
create an ideal assembly work space within the space of the WIP and final goods inventory.
When designing a facility, there are two main conflicting objectives: to minimize the amount of
space needed within the facility and to maximize the efficiency of the system within that space
(Bukchin, Meller, Liu, 1). If the given facility area is pre-determined and constrained, as Paris
Precision’s final assembly space is, the layout and placements of objects must be placed to best
utilize the set capacity. The objective of the assembly placement within the space is to minimize
the distances traveled by material flow (Bukchin, Meller, Liu, 1). The Material Handling System
(MHS) governs how the material flows throughout a facilities design. Many assembly systems
have complex systems of component, sub-assembly, and assembly lines feeding into one
another. “Line-of-sight” management looks to achieve the desired goal of creating the output
point of one line to be as close as possible to the input point of the next line. A U-shaped line is
the most popular design that locates every worker close to all the processes performed in the
assembly. In designing a facility, there is a constant trade-off between the facility area and the
transportation distance. Bukchin, Meller, and Liu recommend creating an algorithm to generate
effective solutions. Creating a good MHS within the facility will ensure the most effective use of
space with keeping costs to a minimum.
It is very attractive to say that your production facility is engaging in the best lean
manufacturing principles. In order to achieve this bragging right, it is necessary to design your
facility and assembly with lean principles in mind. Lean thinking employs ideologies to reduce
waste (Duggan, 30). When discussing tools that can be used for lean design, there are two main
tools and measures that can make any factory or assembly more productive and successful.

15
These measurements are throughput and capacity (Duggan, 31). These two are depended upon
each other. The faster the throughput of the products, the more capacity the facility will have.
When designing a facility layout, it is important to understand what tools and areas of the
shop your products flow through. The best way to understand this is by making a process map
(Duggan, 31). This can be done using an excel spreadsheet, listing out all of your products on the
left-most column, and then making column headings of all the processes in the facility. You will
then make a check in each of the processes that each of the products flow through. The next step
is to group products with similar patterns. As the Shark Rack assembly area only contains 4
different products with similar processes, this may or may not be a very elaborate analysis. By
determining all the processes necessary, can then determine the amount of space required for
each of these processes and are then ready to make a lean layout.
Most of the Shark Rack products will contain shared resources. Locating shared
resources within the assembly area correctly is a crucial step for lean manufacturing. Perimeter
access is very important to “achieving value-added facilities design” (Duggan, 32). If the shared
resources were place along a wall, the flow pattern would be restricted and only allows for the
material to flow in one direction (Duggan, 32). However, placing a shared resource in the center
of the assembly area will allow for the least amount of material movement as well as more
access to the shared resource.
Flexibility and adaptability are key aspects of allowing for scalability, and therefore,
growth of the product (Duggan, 34). The facility must be designed to accommodate change. In
order to have flexibility and adaptability, the facility might have modular workstations that can
be rearranged quickly to make new cell configuration. Results of successfully implementing this
type of workstation include drastic reduction of material handling, inventory, and manufacturing
lead-time which will “flush substantial dollars to the bottom line” (Duggan, 34). As Shark Rack
is facing intense potential growth, these concepts will be crucial in the facility assembly analysis.
The design of any facility must ensure a good flow of material. According to Apple, in
his book Plant Layout and Material Handling, an efficient flow is the “backbone of a productive
facility” (5). This material flow then results in the best arrangement of facilities for the most
efficient operations. Possible material flow patterns are straight line, zig-zag, u-shaped, circular,
or odd-angle (Apple, 110-111). Each pattern can be beneficial depending on the given space and
production process. In order to design a facility, a design procedure can be followed. First obtain
the basic data and analyze it, design the production process and plan the material flow pattern,
consider the material handling plan and equipment requirements, plan the work area for each
individual operation, and coordinate groups and design activity relationships. Next, storage
requirements must be determined, along with space requirements so areas can be allocated to
certain work activities, resulting in the master layout (Apple, 26-31).
16
III. Design
At the beginning of the project, Paris Precision presented a problem of long lead times
within their Shark Rack production line. The first step of the project was to define a clear
approach and to define the project scope. When considering the design and scope of the project,
it was decided to focus on the final assembly of the Shark Racks. The Final Assembly area has
recently been relocated within the factory floor. The project team found a need to create an
improved process flow within the workstation, along with a redesign of the Final Assembly
layout. In order for Paris Precision to meet an increase in demand in the future years, the Final
Assembly area needs to be redesigned to accommodate a higher flow of products with both
changes in spatial and workforce requirements. Due to the recent and unexpected closure of the
Paso Robles facility, the project team decided to design for an ideal state.
Current State:
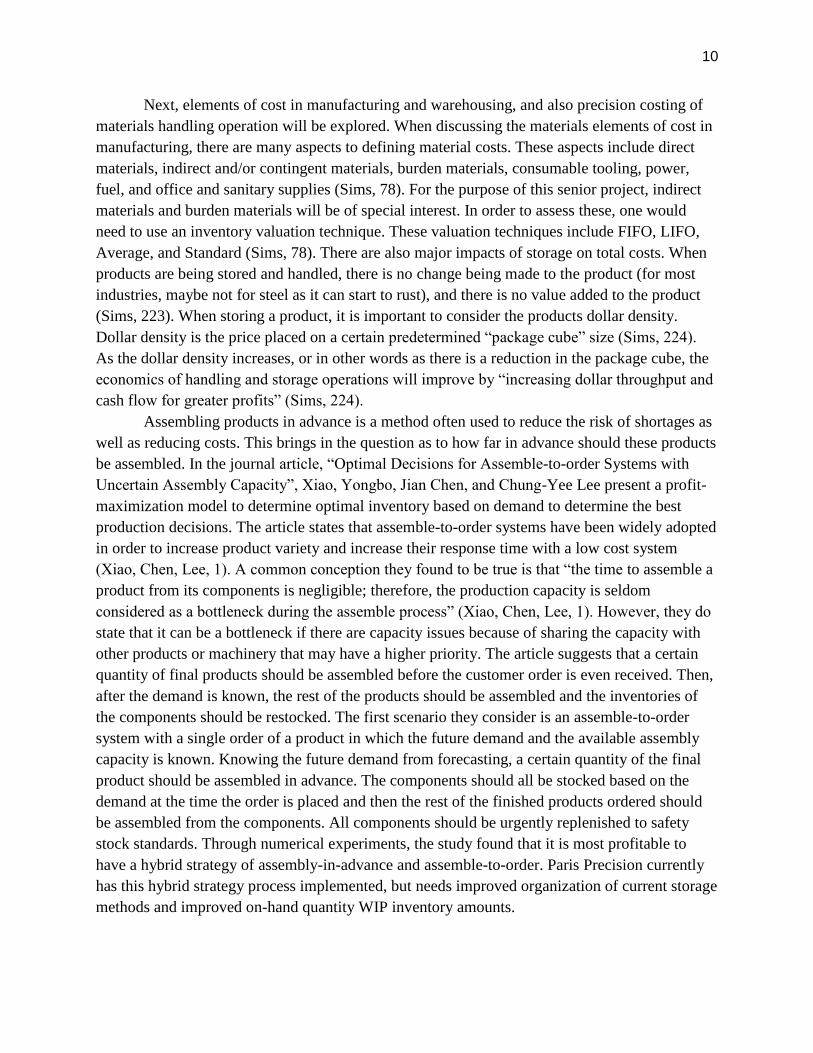
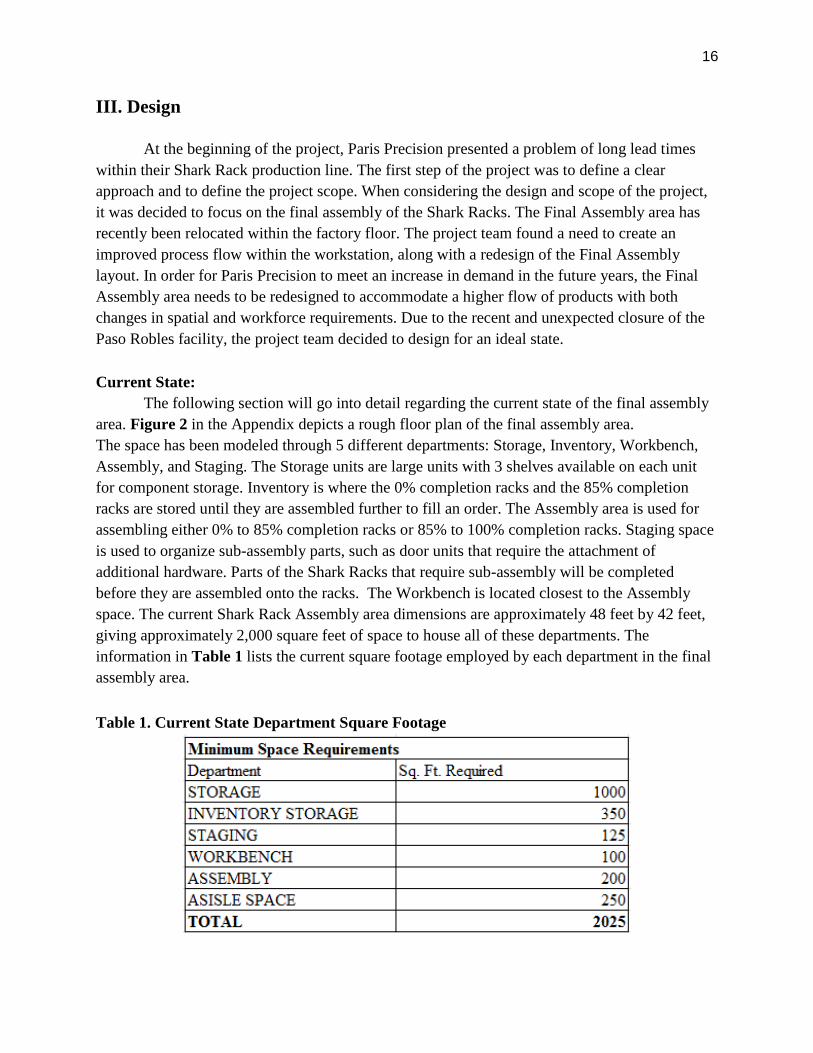
The following section will go into detail regarding the current state of the final assembly
area. Figure 2 in the Appendix depicts a rough floor plan of the final assembly area.
The space has been modeled through 5 different departments: Storage, Inventory, Workbench,
Assembly, and Staging. The Storage units are large units with 3 shelves available on each unit
for component storage. Inventory is where the 0% completion racks and the 85% completion
racks are stored until they are assembled further to fill an order. The Assembly area is used for
assembling either 0% to 85% completion racks or 85% to 100% completion racks. Staging space
is used to organize sub-assembly parts, such as door units that require the attachment of
additional hardware. Parts of the Shark Racks that require sub-assembly will be completed
before they are assembled onto the racks. The Workbench is located closest to the Assembly
space. The current Shark Rack Assembly area dimensions are approximately 48 feet by 42 feet,
giving approximately 2,000 square feet of space to house all of these departments. The
information in Table 1 lists the current square footage employed by each department in the final
assembly area.
Table 1. Current State Department Square Footage

17
There is a general process that the employee follows when assembling the Shark Racks.
When assembling both the 0%-85% and the 85%-100% racks, the employee created a method of
assembling five racks at a time. The employee sets the racks up next to each other in the
assembly area and completes each step of assembly on each rack before moving to the next
assembly step. Before he starts assembly, he completes all of the parts of assembly that require
sub-component assembly. These are parts that are to be attached in assembly but require further
addition of hardware and smaller assembly steps. Upon completion of these sub-components, the
employee will then stage the sub-assemblies on pallets that are adjacent to the larger Shark Rack
frames that are ready for assembly. The server racks are then assembled to their next level of
completion, and then either placed back in inventory if it was a 0%-85%, or out to the shipping
dock if it was an 85%-100% rack.
In an effort to better understand this process, the project team utilized a spaghetti diagram
to identify the major travel paths of the worker in the current state layout. By doing this, the
project team could more easily identify the areas of the final assembly that had the most foot
traffic. As the spaghetti diagram can indicate, the areas that had the most movement were
between the workbench and assembly, the workbench and staging, and staging and assembly.
There was also notable movement between storage and staging, and also inventory and
assembly. These findings are depicted below in Figure 3.
Figure 3. Spaghetti Diagram: Current State

18
Employee Interview/Input:
There was one employee named Shane that was the only employee who worked in Shark
Rack Assembly. The project team spent a lot of time talking with Shane about some of his initial
observations and about what he finds “painful” in his job. He was asked questions such as “What
are some big things that keep you from doing your job the way you wish you could?”, “Do you
feel you have enough space to get everything done?”, and “What are some things you’d like to
see change?”, “What are things that are helpful to you in the current layout?”. Shane pointed out
that one of the biggest things that keep him from doing things fast, or even at all, is that there
isn’t enough space between the staging area and the storage shelves for a forklift to get through
and place more components on the racks. If he is currently assembling Shark Racks, then he
cannot place or get down more components from the storage shelves until he clears the staging
area. He either has to move the pallets with staging materials, or refrain from making sub-
assemblies for staging altogether. Doing this takes a lot of time, and detracts from the time he
could be using to assembly the Shark Racks. This was the biggest takeaway from the interview
with Shane.
Design Constraints:
In the beginning stages of the project, there were very concrete, physical constraints that
the design would have to fall within. The space that was currently outlined for Shark Rack
Assembly didn’t have any surrounding space available to expand upon. However, since the
company decided to close the facility in Paso Robles and move the Assembly of Shark Rack to
another location, the group and the stakeholders decided that an Ideal State design should be
created for a product demand that is expected to quadruple in the next two years.
The group also made a conscious effort to keep additional costs to a minimum. Costs of
additional equipment and space were considered and the group made their best effort to factor in
accurate yet cost effective estimates of necessary equipment.
The final notable constraint that the group had to abide by was that no changes would be
made to the design of the Shark Racks themselves. The redesign of the racks would not only be
stepping outside the scope of the project, but was also designated as off limits to the project
team.
Time Studies:
The project team then examined the assembly processes within the Final Assembly area.
Time studies were conducted on the subassembly of the three parts that would be later assembled
to the 85% completion racks: the top panel, the split rear doors, and the side panels. Time studies
were also performed on the 0% to 85% racks and the 85% to 100% racks. After multiple time
studies, the average times to complete five subassemblies are shown below in Table 2.

19
Table 2. Time Study for five Subassemblies
The processes for the 0% to 85% racks and the 85% to 100% racks were broken down
into discrete tasks, and the time required for each task was measured. The tasks to assemble the
racks can be seen in the tables below. These are the times for the completion of five racks, since
five are assembled at a time. The 0% to 85% racks and the 85% to 100% rack’s Time Studies are
shown below in Table 3 and Table 4 respectively.
Table 3. Time Study for five 0% to 85% Shark Racks
Table 4. Time Study for five 85% to 100% Shark Racks

20
Each subassembly process along with the 0% to 85% and the 85% to 100% assemblies
require set-up times. The Approximate set-up times for assembling five products at a time can be
seen in Table 5 below. The subassemblies items require more items to be pulled off the
inventory shelves and therefore require more time.
Table 5. Set-up Times
Table 6 below depicts the total cycle time for the final assembly of five Shark Racks.
Giving the employee a Performance Rating of 100% since he is the only worker in Final
Assembly, the Normal Time to assemble five Shark Racks from 0% to 100% is 8:30:36. To find
the Standard Time, the worker is given an Allowance of 22%. See Table 7 in the Appendix to
see how this value was determined. The Standard Time was then found to be 10:22:55, using the
equation ST=NT(1+Allowance).
Table 6. Cycle Time for five Shark Racks
The current output and number of sales of Shark Racks is about 50 per month. Given the
Time Studies conducted, 100 Shark Racks per month can be produced if one employee is
working full time (5 days/week, 8 hour shift). Given 22 working days in a month, there are 176
working hours. 176 hours divided by the total cycle time gives the completion of 103 racks, but
they are only completed in batches of five, and therefore 100 Shark Racks could be potentially
completed with one worker. They currently have enough capacity to make 100 Shark Racks, but
their demand is not high enough to fulfill this.

21
Calculations:
Illumination:
The base calculations for illumination analysis can be found in Figure 4 and Figure 5 in
Appendix. The list of assumptions used to complete these calculations are presented below:
● There are fluorescent lights at 85 watts each
● The height from the working surface to luminaries is 30 feet
● Room width is 60 feet
● Room length is 70 feet
● The height from the luminaries to the ceiling is 2 feet
The project team followed the illumination analysis methods mentioned in the course
textbook for IME 443, Facilities Design (Facilities Planning: Tompkins, & White 491-499). This
analysis method includes 8 steps that lead the facilities planner to identify how many lamps and
luminaires are required to adequately illuminate the working space. The 8 steps are presented
below.
Illumination Procedure:
Step 1: Determine the level of illumination required.
Use Figure 4 in the Appendix to aid in determining the minimum illumination level (in
footcandles). The nature of these tasks are mainly assembly, and the level of difficulty was
chosen as “Medium”. Thus, the minimum level of illumination is 100 footcandles.
Step 2: Determine the room cavity ratio (RCR).
The RCR is an index of the shape of the room to be lit. The calculation is below:
RCR = (5)(Height from working surface to luminaries)(Room width + Room length)
(Room width + Room length)
Using values from the assumptions listed above in the RCR calculation, the RCR came
out to a value of 4.44.
Step 3: Determine the ceiling cavity ratio (CCR).
The group is assuming that the luminaries are not ceiling mounted, so there would be
some ceiling reflectance.
CCR = (Height from luminaries to ceiling)(RCR)
Height from working surface to luminaries
Using the values listed in the assumptions the CCR came out to a value of 0.31.

22
Step 4: Determine the wall reflections (WR) and the effective ceiling reflectance (ECR).
The WR and the base ceiling reflectance (BCR) value can be obtained from Figure 5 in
the Appendix. The Shark Rack assembly is surrounded by many tools and products made out of
sheet metal. With these facts considered, the project team decided that the best reflectance is
65%. Therefore, the WR and the BCR are 65% or 0.65. Using these values in Figure 6 in the
Appendix, we can find an ECR value of approximately 60.
Step 5: Determine the coefficient of utilization (CU).
The CU is a ration of the lumens reaching the work plane to those emitted by the lamp.
The CU is determined from Figure 7 in the Appendix using the RCR, WR, and the ECR. Using
the values obtained in previous steps of the procedure, that the RCR = 4.44 (rounded down to 4),
the WR = 65% (rounded down to 50%), and the ECR = 60 (which we must round down to 50),
we can find a CU value of 0.52. We can also assume that there is a 1.3 x mounting height.
Step 6: Determine the light loss factor (LLF).
The two most significant light loss factors are lamp lumen depreciation and luminary dirt
depreciation. The lamp lumen depreciation factors are expressed as a ratio of lumen output of the
lamp at 70% of rated life to the initial value. The lumens outputs can be found in Figure 8 in the
Appendix. With the assumption that there are fluorescent lights at 85 watts each, the lamp output
would be 5400.
The luminary dirt depreciation is the light loss associated with the conditions which the
luminary operates, i.e., how often it is cleaned and the conditions in which the luminaries live.
Figure 9 in the Appendix helps identify the lamp luminary dirt depreciation factors. The factory
is under very dirty and heavy machining conditions, and the lights are cleaned once a year (24
months). The LLF is 0.75.
Step 7: Calculate the number of lamps and luminaries.
The following equation can be used to calculate the number of necessary lamps using all
of the information previously identified.
# of Lamps = (Required level of illumination)(Area to be lit)
(CU)(LIF)(Lamp output at 70% rated life)
=(100 footcandles)(4200 sq. ft.) = 199.43 = 200 lamps
(0.52)(0.72)(5400)
This next equation can be used to identify how many luminaries should be placed within
the facility.

23
# of Luminaries = (Number of lamps)
(Lamps per luminary)
= (200) = 50 luminaries
4
Step 8: Determine the placement of the luminaries.
The area of final assembly facility is 60 ft. x 70 ft. Accounting for a length of 4 feet per
each fluorescent light, the following placement of the luminaries have been created, and would
be overlaid on the proposed layout. Figure 10 below depicts this proposed luminary placement,
with 5 rows of 10 luminaries.
Figure 10. Proposed Luminary Placement
Reasoning:
In order to understand which departments should be nearest each other, the group decided
that using a relationship diagram would work best. The group decided against methods such as
the Direct Clustering Algorithm as the parts are all very similar and would therefore pass through

24
all of the same departments. Figure 11 below shows the relationships between each of the 5
departments.
Figure 11. Department Relationships
To make use of this Relationship Diagram, the following list was formatted:
A: Staging and Assembly
Assembly and Workbench
E: Assembly and Inventory
Staging and Workbench
Staging and Storage
I: Storage and Assembly
O: Storage and Workbench
U: Staging and Inventory
Inventory and Storage
Inventory and Workbench
X: No relationships deemed undesirable
Design Specifications:
In Table 8 below, revised square footage requirements for each department are listed.
Table 8. Revised Department Square Footage Requirements

25
The Storage department was kept within the same square footage requirements due to the
fact that excess storage was noted and the current storage shelves can accommodate an increase
in demand. However, with an increase in demand, the Inventory Storage department would need
to be expanded to hold more Shark Rack units. The Staging, Workbench, Assembly, and Aisle
Space Workstations all were expanded in square feet required to easy movement within the
workstations, to improve product flow, to allow for an increase in products assembled, and to
allow for a forklift to access shelving units during final assembly.
Design Requirements:
The following list compiles all of the requirements for the Assembly Redesign:
● Must have enough space for component storage
● Must have enough space for any forklifts or pallet jacks to move around the aisles and the
staging pallets
● There must be enough space in the assembly area to allow for assembly of at least 5
Shark Racks at a time
● The design should promote a natural flow of product from Inventory to Assembly and
from Component Storage to Staging
● Tool storage is easily accessible
● The Workbench is near Staging and Assembly
● There is adequate lighting
Modeling:
In order to model an ideal state, the project team used the simulation software, Simio.
The purpose of using this software was to determine the changes in throughput with added
workers and a changed assembly process. The optimal change that allowed for the desired
increase in Shark Racks of around 200 per month will be explained in the results section.
The project team used SketchUp software to create a model of the proposed facility
layout. SketchUp offers enough complexity and detail while not being overly precise. This
software program allows for placement of complex objects that provide flattering visuals and a
pleasant aesthetic feel to the design.

26
IV. Methods
Simio Modeling:
Simio was used to model a future state with an increase of demand. The model begins
with two incoming sources that arrive into the Final Assembly area. One source contains model
entities of incoming Shark Racks. The other source contains model entities of incoming
subassembly materials. For the purpose of simplifying the model, without taking away from the
accuracy, all subassemblies are grouped together. The interarrival time of the incoming Shark
Rack source is based off of the assumption that the desired increase in sales of 200 per month
will be made and therefore 200 Shark Racks a month will be entering Final Assembly. The
project team assumed that these racks will come in at a somewhat uniform rate over the month.
The interarrival time for the Shark Racks is set to Random.Uniform(4,5) hours, for five entering
at a time. The subassembly source has its interarrival time set equal to the subassembly server’s
processing time since the subassembly materials are usually in stock in the inventory and used
when need to sub assemble. The incoming Shark Racks go straight to the 0% to 85% Assembly
server and the incoming subassembly materials go straight to the subassembly server. Since the
Shark Racks are assembled five at a time, each server is set to process five at a time. In the Simio
model, a server is used in between the Shark Rack source and the 0% to 85% Assembly server in
order to batch five Shark Racks together into one entity that travel together through the model.
With the current state being that only one worker is in Final Assembly, the project team
decided to see if the throughput would reach the desired increase if one employee is added to the
model in the assembly of the Shark Racks. In order to do this, the way the process is modeled
with three servers, at least one server has to be inactive while others are operating. Although
there are three stations, only two can be operating at a time with two employees. Starting off, one
worker will be at the 0% to 85% assembly station and the other worker will be at the
subassembly station. The subassembly station is not a bottleneck, and therefore as soon as both
of those workers are done completing their jobs, they will both move straight to the 85% to
100% assembly station to work on completing the batch of five Shark Racks together. During
this time, the Simio model is programed to have the other two stations blocked while the workers
are at the 85% to 100% station. This was programming using add-on process triggers which can
be seen in Figure 12 in the Appendix. As the racks and subassemblies enter the 85% to 100%
station, the 0% to 85% station and the subassembly station fail. As soon as the five racks are
completed, the workers will go back to their first stations, which will be repaired back to normal
and become unblocked as soon as the Shark Racks exit the 85% to 100% assembly station.
The three servers follow a triangular distribution since not enough time studies were
taken to see a trend in the data, due to the long cycle times of the final assembly process. The
processing time for the 0% to 85% Assembly server follows a Random.Triangular(111,113,115)
minute distribution. This was found by taking the total time to complete the 0% to 85% assembly
process for five racks of 103 minutes, found in Table 3, and adding 10 minutes to that for the set-
up times for every five racks. The subassembly server follows a

27
Random.Triangular(187,189,191) minute distribution. This was found by taking the total time to
assembly five of each of the three subassemblies of 144 minutes, found in Table 2, and adding
45 minutes of total set-up time to this value. The 85% to 100% Assembly server follows a
Random.Triangular(102,104,106) minute distribution. This was found by taking the total time to
complete this process for five racks of 198 minutes, found in Table 4, and adding 10 minutes to
that value for the set-up time for every five racks. This value is then cut in half, due to the model
having two workers at the station performing 85% to 100% assembly at a time. The 0% to 85%
Assembly and the subassemblies combine to the assembled before the final step. Therefore, a
combiner was used in the Simio model to replicate this action. After the 85% to 100% assembly
in completed, the final Shark Rack leaves the Simio through a sink and exits the Final Assembly
area to be shipped. The Simio model can be seen in Figure 13 below.
Figure 13. Simio model of Final Assembly
The Final Assembly workers at Paris Precision follow a work schedule of 6 am to 2 pm
Monday through Friday, totaling to a 40 hour per week work schedule. The Simio model follows
this work schedule of 40 hours/ week in which final assembly is operating. With these times set,
the total throughput of the model can be determined. The results of the Simio model with two
employees working will be discussed in the Results section of the report.
SketchUp:
In order to visualize any of the data that the group found in the Simio model and in other
calculations and requirements, the project team used SketchUp software to model the
improvements. Multiple iterations were considered and improved upon throughout the entire
project timeline, and as new data and information was realized or discussed, the team came to a
final edit that fit all the criteria that met the data and requirements. SketchUp is a very useful tool
as it allowed for relatively quick implementation of designs and fast edits. When conceptualizing
a facility redesign without a model to aid in visualization, it is easy to overlook some key details

28
and effects of a certain layout. With this software, the group could easily see any mistakes in
logic of the layout or flow of the project. This lead to a smooth iteration process that quickly
brought the group to a final recommended facility layout.
The project team first decided to create a current state model that accurately reflected the
current assembly facility. Figures 14 -17 in the Appendix show the current layout.
The project team was able to ideate numerous layout improvements from the employee
interviews and from spending time in the current facility. The current layout felt too small for the
amount of product Shark Rack is processing. There is not enough room for forklifts to place
product on the shelves with staging placed where it is. From those two critiques alone, the
project team knew that there needed to be a better way for the forklift to place product on the
storage shelves, and a better way to place the staging areas in the space, and that there needed to
be much more space for actual assembly. Since the current amount of space available to
complete the assembly is tight, the space would certainly have to expand to accommodate for
future increases in demand. Because Shark Rack expects to increase demand from 50 to 200
racks per month, the product team thought it was justified to assume that Shark Rack would
become a more significant source of income, and could therefore see justification in increasing
the size of the assembly area to allow for more space for forklifts to move through the area and
for a higher volume of product. Also, from the updated square footage requirements for each of
the departments, the group saw needs for increased inventory storage space, component storage
space, staging, assembly, aisle space, and workbench space. With the increase of one worker, the
group saw it necessary to add in another workbench area to allow for simultaneous assembly.
The team then looked at the relationship diagram. From this diagram the group identified
which departments absolutely had to be next to each other. These departments are Staging and
Assembly, Assembly and Workbench, Assembly and Inventory, Staging and Workbench, and
Staging and Storage. The current state model is set up in a way that the assembly area is almost a
barrier to the staging area. In order to fix this, the group decided that making the rows of
Assembly and Staging areas perpendicular to the Workbench would allow for equal access of
Assembly and Staging from the Workbench. This change in layout accommodates all of the
departments that need to be next to each other, and therefore helps create the layout for all of the
departments except for the storage. The group decided to arrange the storage shelves in aisles to
allows a more specified area for the forklifts drive through, making sure that the aisle was at least
10 feet wide to allow the forklift full mobility in the aisle. This space requirement also needed to
be considered between the storage shelves and the staging area. There was a designated 10 feet
between these two departments as well to allow for forklift movement.

29
V. Results and Discussion
Simio Model Findings:
After performing a Simio model analysis, the project team had the task of creating a new
process flow that would allow for an increase in throughput. With the addition of one employee,
the subassemblies and the 0% to 85% rack assemblies could be done simultaneously. Once those
two tasks were completed, both workers could go to the 85% to 100% rack assembly station to
complete the five Shark Racks at once. This model increased throughput to 180 Shark Racks per
month, given a 40 hours per week work schedule. When the work week was increased to 43
hours per week, all 200 Shark Racks could be made in the month. With the new facility design,
the project team proposes that about three hours per week can be cut down with an improved
workspace, staging area, and product flow. This increased efficiency will allow for 200 Shark
Racks to be made per month, meeting the desired increase in demand for future years. Below, in
Figure 18, is the Simio model that shows the product flow and the total throughput per week.
The work stations in red show that they are blocked, while both of the workers are at the 85% to
100% assembly workstation that is shown in green, meaning it is currently processing. The
model stopped after 40 hours and the total throughput is 45 Shark Racks per week or 180 Shark
Racks per month.
Figure 18. Simio Model: Throughput per Week
Facility Layout Findings:
After considering the design constraints, requirements, and incorporating the calculations
and results from the Simio model, the final facility layout below has been recommended. The
total square feet of this design is 4200 square feet.

30
Figure 19. Re-Design Facility Layout
Moving from left to right in Figure 19 above, the component storage is oriented into two
aisles. This allows for the material to be in a concentrated area, instead of scattered throughout
the Final Assembly area. These aisles have the proper 10 feet width necessary for the forklift to
have full mobility. Next, the staging area is located directly next to the component storage aisles,
to allow for minimum transportation. This row of pallets contains component material that has
yet to go through sub-assembly. These pallets have product on them that have been pulled from
the storage component shelves, and are waiting to be picked for various sub-assemblies. Staging
is also located in between these pallets and the row of Shark Racks awaiting assembly. However,
these pallets will have components that have already been sub-assembled. In component sub-
assembly, the worker will take a pallet from a stack located to the left of their desk and place it
behind their work station. They will then grab material located on the staging pallets and
complete sub-assembly items. Upon completion of this item, they will then set it on the pallet
behind their workstation. Once they have completed the amount of sub-assembly items required,
they will use the pallet jack to move stack of completed sub-assembly items in between the
component staging area and the shark rack being assembled. They will repeat this process for the
remaining items that require sub-assembly. The Assembly worker will use the pallet jack to
move the Shark Racks from Inventory Storage to their designated Assembly area with the pallet
jack and use both his desk, the mobile storage cart, and the sub-assembled component pallets to
complete the assembly of each of the five Shark Racks. When the Sub-Assembly worker is done

31
with all of his work, he will then assist the Assembly worker in assembling each rack to its
required level of completion. Figure 20 and Figure 21 below show various views of this layout.
Figure 20. Re-Design Facility Layout
Figure 21. Re-Design Facility Layout

32
This layout allows for easy accessibility between all departments that have a large
correlation to each other. There is enough space for all necessary equipment, and room for more
equipment and room for more Inventory storage as well. Another aspect that this layout satisfies
is that it is scalable. It is very possible to mirror this design, with the Inventory storage in the
middle, as well as opportunities to expand the assembly and staging in the middle, as well as
place additional Storage racks next to each other to expand storage if demand increases more
than 4 times in the next two years.
Cost Analysis Results:
The project team proposed many improvements that have implementation costs. Paris
Precision currently has approximately 50 Shark Rack sales per month. With each Shark Rack
selling for $1,000, the total revenue per month would be $50,000. In the redesign state, the
number of sales/month with the increased capacity would increase to 200 per month, bringing in
$200,000 in revenue per month. This can be seen in Table 9 below.
Table 9. Total Revenue in Current and Re-Design State
In Table 10, the improvements are listed and the costs of each are shown. The square footage
calculation can be found in Table 11 in the Appendix.
Table 10. Improvements and Costs
Although these costs may seem significant, these costs will virtually be made up in less
than one day of work, as each Shark Rack sells for approximately $1,000.00 and the new
assembly plan completes 10 Shark Racks per day. Based on these results, we predict that Shark
Rack will be able to successfully meet their predicted demand of 200 units per month.

33
Obstacles and Lessons Learned:
There were some significant obstacles that arose throughout the duration of this project.
The project team learned that the Paso Robles location of Paris Precision was going to be shut
down halfway through the project timeline. This was shocking news and presented many initial
concerns. Although the location was shutting down, the project team was still able to create a
hypothetical ideal state model for Shark Rack to implement before the location closed. Even with
this knowledge, the team did not understand the true ramifications of the facility closure.
Because the location was closing, many of the workers decided to find other jobs before their
current job at the facility came to an end. The team worked closely with Shane, one of the
workers that did exactly that. Shane abruptly left before the team had enough time to truly
complete the project, and had no choice but to make a few small assumptions about the process.
This provided a great learning opportunity for the team, as it shows the unpredictability in the
market environment and illuminated the real world obstacles that happen every day.

34
VI. Conclusion
Paris Precision presented a problem to the project team concerning their production line
of Shark Rack Server Racks. The project’s problem statement is as follows: Paris Precision's
Shark Rack production flow process and final assembly layout are preventing a reduction in lead
time. Their current lead time of seven days will not be able to satisfy future increases in demand.
In order to narrow the scope of the project, the team decided to focus on the Final Assembly
area. The team’s main objective was to reduce the total lead time from seven days to two days to
meet a future increase in demand. In order to accomplish this, the objectives were to perform
time studies, conduct a facility resign, and analyze the workflow process in order to come up
with suggested implementations. Throughout the project, the team followed the DMAIC
approach: Define, Measure, Analyze, Improve, Control, and used many Industrial Engineering
tools.
Halfway through the project duration, the team was informed that the Paso Robles facility
would be relocated to Hayward, California and would be closing permanently. Due to this
closure, the project direction changed from designing within predetermined assembly area
boundaries to be designed for an ideal state. The current dimensions of the Final Assembly area
no longer became a constraint in the suggested final model. The project team took multiple visits
to the factory floor in order to fully understand the Final Assembly process of the Shark Rack
Server Racks. While there, the project team took time studies of the assembly process, gained
knowledge of the process from the assembly worker, and noted many areas in need of
improvement.
Through the analysis phase of the project, the team used SketchUp software to model a
facility redesign and Simio software to model an ideal state process flow that would allow Paris
Precision to expand their capacity to meet a future demand. The project team came up with
multiple suggestions in conclusion:
● Re-design of the facility layout to 3,800 square feet that allows increased flow and
movement throughout
● Addition of one employee to the subassembly and 85% to 100% assembly workstations
● Two rolling carts that aid in assembly processes and reduce processing time
● 3 workbenches for a designated subassembly workstation area
The project team achieved their original project objectives, with the design changing to
an ideal state. The team highly recommends adding an additional final assembly worker and
using this new facility layout if Shark Rack would like to increase their capacity to meet future
demand.
Throughout the project, the team learned a great deal through a hands-on experience
working with a local company. The team encountered an unforeseen obstacle and learned how to
change direction quickly and handle the new situation presented. For the project team, visiting
the facility and having a hands on experience within the workplace was very beneficial in

35
understanding the whole process from raw material to finished product. During the visits,
interaction with the workers provided a lot of inside knowledge that helped direct the project to
where the most improvements could be made. The project team learned how to take the data
collected and use it in SketchUp and Simio programs in order to design a new ideal state for the
company.
Next time, the team would like to have collected more data earlier on in the process.
Once the facility began to close, many different operations were happening in the facility that
had to try be normalized back to the standard state. The sooner the data collection began, the
more this could have been avoided, although it could not have been foreseen.

36
References
Apple, James M. Plant Layout and Material Handling. New York: Wiley, 1977. Print.
Baudin, Michel. Lean Assembly: The Nuts and Bolts of Making Assembly Operations Flow. New
York: Productivity, 2002. Print.
Bukchin, Yossi, Russell D. Meller, and Qi Liu. "Assembly system facility design." IIE
Transactions 38.1 (2006): 53+. Academic OneFile. Web. 18 Feb. 2016.
Crandall, Richard E., and Timothy H. Burwell. "The Effect of Work-in-Progress Inventory
Levels on Throughput and Lead Times." Production and Inventory Management Journal
34.1 (1993): 6. ProQuest. Web. 18 Feb. 2016.
Duggan, Kevin J. "Facilities Design for Lean Manufacturing." IIE Solutions (1998): 30-34.
Iienet.org. Dec. 1998. Web. 18 Feb. 2016.
Hopp, Wallace J., Mark L. Spearman, and David L. Woodruff. Practical Strategies for Lead
Time Reduction. 2nd ed. Vol. 3. N.p.: Manufacturing Review, 1990. Print.
Kivenko, Kenneth. Managing Work-in-process Inventory. New York: M. Dekker, 1981. Print.
Kumar, Surender, Ritesh Kumar. Singh, Sanjay Kumar. Jha, Amarpreet Singh Bassan, and
Saranjit Singh. Value Engineering: A Fast Track to Profit Improvement and Business
Excellence. New Delhi: Narosa Pub. House, 2005. Print.
Plossl, George W. <i>Production and Inventory Control Principles and Techniques</i>. 2nd ed.
Englewood Cliffs, NJ: Prentice-Hall, 1985. Print.
Redford, A. H., and Jan Chal. Design for Assembly: Principles and Practice. London:
McGraw-Hill, 1994. Print.
Sims, E. Ralph. Precision Manufacturing Costing. New York: M. Dekker, 1995. Print.
Tompkins, James A., and John A. White. Facilities Planning. New York: Wiley, 1984. Print.
Watanabe, Chihiro, and Bernadetta Kwintiana Ane. "Constructing a Virtuous Cycle of
Manufacturing Agility: Concurrent Roles of Modularity in Improving Agility and
Reducing Lead Time." Technovation 24.7 (2004): 573-83. Web. 2 Feb. 2016.

37
Bell, S. Lean Enterprise Systems: Using IT for Continuous Improvement. Hoboken,NJ:
Wiley-Interscience, 2006. Print.
Xiao, Yongbo, Jian Chen, and Chung-Yee Lee. “Optimal Decisions for Assemble-to-order
Systems with Uncertain Assembly Capacity.” International Journal of Production
Economics 123.1 (2010): 155-65. Science Direct. Web. 4 Feb. 2016
Young, Jan B. Modern Inventory Operations: Methods for Accuracy and Productivity. New
York: Van Nostrand Reinhold, 1991. Print.

38
APPENDIX
Figure 1. Four Shark Rack models
Figure 2. Final Assembly Rough Floor Plan

39
Figure 4. Minimum Illumination Levels for Specific Various Functions
Figure 5. Approximate Reflectance for Watt and Ceiling Finishes

40
Figure 6. The Percent Effective Ceiling Reflectance (ECR)
Figure 7. Coefficient of Utilization (CU)

41
Figure 8. Lumens Output
Figure 9. Lamp Luminary Dirt Depreciation Factors
Figure 12. Add-On Process Triggers
42
Figure 14. Current State Facility Right Side View
Figure 15. Current State Facility Left Back View

43
Figure 16. Current State Facility Top View
Figure 17. Current State Facility Back View

44
Table 7. Allowance Calculation
Table 11. Square Footage Cost