eyeblaster: trends in conversions
TRANSCRIPT

Eyeblaster Analytics BulletinIssue 3 | Trends in Conversions
March 2009
Pg 193 – Marketing Sherpa’s 2008
Background
In a time of recession, accountability of online advertising becomes more critical than ever. Whether you are pursuing a direct response initiative or looking to achieve measurable branding objectives, the focus is on the process of `conversion’: that moment when an individual exposed to an ad performs a desired action.1
This issue of the Analytics Bulletin focuses on the role of conversions. Given the accountability and measurability of online media, what measures can we take in order to maximize conversions at zero or minimum cost? Eyeblaster conversion tags give the ability to track user’s activity on the advertiser’s site after viewing or clicking on an ad, but this is only one of a myriad of methods that can be deployed to ensure a better yield of success.
Summary of findings
Click-thru Rate vs. Conversion Rate: •Worldwide (WW) ’08 CTR is 0.14% while WW’08 Conversion Rate stands at 0.32% - more than double.
Correlation between Format Type and •Conversion Rate: Rich media ad formats increase the tendency of users to convert by 2.5x.
Impact of Data Capture on Conversion •Rate: Lowering the number of phases the user needs to go through by bringing the conversion mechanism into the banner. You are 5x more likely to convert in a banner than you are on a site.
CTR vs. Data Capture: Comparisons •across unique data reveals users are nearly 8x more likely to convert in a banner than click on it and about 34% of unique users who interact will fill in form details within a banner.
Automatic Optimization and its impact •on Conversion Rate: Conversion rate of campaigns using an optimization algorithm is significantly higher (1.25x) than the average conversion rate of rich media and practically double the global average conversion rate for all ad formats.
Search as a conversion metric: One can •measure an increase in search activity as a result of display advertising that is sustained for a sizeable amount of time after the display campaign has finished.
Behavioral sequencing: Consumers •exposed to targeted messages in sequence are more likely to move through a conversion sequence.
1 Pg 193 - Marketing Sherpa's 2008

3 AnALYTICS BuLLETIn ISSuE 3 | MARCh 2009
Table of contents
Research Methodology ............................................................................. 4
Results in Detail ........................................................................................ 4
Post-Click vs. Post-Impression ................................................................. 5
Improving the conversion process with Data Capture ................................ 6
Automatic Optimization mechanism and its impact on conversion rate ..... 10
Search within the conversion process ....................................................... 11
Benchmarks
Appendix 1: north America .................................................................... 15
Appendix 2: Europe ................................................................................ 16
Appendix 3: Spain .................................................................................. 17
Appendix 4: APAC .................................................................................. 18
Appendix 5: Taiwan ................................................................................. 19

4 AnALYTICS BuLLETIn ISSuE 3 | MARCh 2009
Research MethodologyThis study is based on data of more than 2,000 campaigns representing 29 billion impressions collected between Jan ’08 and Dec ’08 covering all sectors. These campaigns represent advertisers using Eyeblaster conversion tags. Conversion rates were based on total conversions with no differentiation of the type. All calculations were performed on daily delivery data aggregated to the ad level.
Thinking about conversions…
Results in detailClick-thru Rate (CTR) vs. Conversion RateCTR is a valuable metric to measure the amount of users who wish to visit the advertiser’s site, but this in itself is not a true conversion. The common perception is that CTR indicates campaign success; the following analysis shows that low or high CTR does not necessarily correlate with the campaign’s overall objectives. Conversion tags placed on the advertiser’s web site on the other hand, track actual user activity that the advertiser wishes to track.
In observing the CTR metric alone, we expect all consumers to react immediately and overlook consumers who converted after being exposed to – and possibly interacting with – the ad.
In order to see the full picture we should sum both types of conversions.
CTR vs. Conversion Rate
Figure 1 Source: Eyeblaster Research 2009
In looking at the overall lift in the conversion rate, it indicates that a higher percentage of consumers take in the advertising message, then require time to digest the information, possibly clarify it from other sources, before finally being in a position to actually convert.
Conversion rate provides more accurate and precise measurement of the campaign’s success and global data reveals that by focusing on CTR alone, we are missing 2.5x the actual data an advertiser requires to correctly analyze the overall consumer journey.
It could be argued that a true conversion would be where a consumer has made a monetary transaction directly with the advertiser, i.e. purchased something. The focus here is on conversions where the conversion means ‘showing intent’ – such as through data capture – indicating a consumer’s desire to purchase.
It is worth noting that a total conversion could happen directly on an advertiser’s site but possibly more so on a reseller’s site or in some other place, such as offline or in-store. The true effects of digital advertising against this overall conversion process (included within or in isolation from other media) are not considered here due to current tracking methods. For the purpose of this document, we shall limit conversions to those indicating intent within the ad itself or direct on an advertiser’s site, appreciating this in itself is only showing a slither of the actual overall conversion rate and ROI.
0.14%
0.32%
0.00%
0.05%
0.10%
0.15%
0.20%
0.25%
0.30%
0.35%
CTR Total Conversion Rate
Eyeblaster Jan.2009
x2.5

5 AnALYTICS BuLLETIn ISSuE 3 | MARCh 2009
Post-Click vs. Post-ImpressionCorrelation between Format Type and Conversion Rate With pressure mounting on trying to ascertain the most cost-effective online advertising, it would seem that high volume standard display advertising would naturally be a first choice. however, when we look at the true conversion rates for the 3 most popular ad format types online, we clearly distinguish a higher rate for rich media advertising.
Conversion Rate by Formats
Figure 2 Source: Eyeblaster Research 2009
Both popular rich media formats are showing 2.5x uplift in the ability to generate conversions over standard display inventory.The results reveal that rich media is doing two things here. First, it is attracting attention of the viewer against site content, and thereby ensuring greater stand out from site editorial. Second, by allowing a consumer to tangibly touch and interact with the advertising message, the consumer experience is enhanced through physical involvement, with a resulting positive effect for the advertiser, shown in actual conversions.
Standard advertising plays an important role in enhancing reach and frequency of the entire media mix (Rich, Standard, Search) so while not having as strong a recall and conversion rate, it acts as a reminder for those already with awareness, and as a reach extender. We shall look at ways to enhance the standard banner effectiveness later.
Another way to look at this conversion process is to try to understand when the conversion ultimately takes place, i.e. is the advertising message creating an immediate or a time delayed conversion? Previously we have seen that rich media is creating stand-out to ensure brand recall later, but is this a trend we should expect when we consider all display advertising?
Let’s compare the following two scenarios:
See-Click-Convert (post click)•
See-Delay-Convert (post impression)•
Conversion Rate
Figure 3 Source: Eyeblaster Research 2009
The results indeed show that there is a sizeable uplift in the number of consumers who do not necessarily respond and convert immediately to an advertising message, and this factor needs to be explored further in trying to understand the consumer’s mindset.
1.75x conversions happen after a time delay
0.20%
0.50% 0.47%
0.00%
0.10%
0.20%
0.30%
0.40%
0.50%
0.60%
STD Banner Polite Banner Expandable Banner
Eyeblaster Jan.2009
0.08%
0.00%
0.02%
0.04%
0.06%
0.08%
0.10%
0.12%
0.14%
0.16%
Post - Click Post - Impression
x1.75
0.14%

6 AnALYTICS BuLLETIn ISSuE 3 | MARCh 2009
Improving the conversion process with Data Capture We all know that in the “viewer to converter” funnel there is a drop off at every step. Therefore, we should aim to minimize the funnel steps. In general, data capture is the ability to collect information submitted by the user. By placing data capture functionality into the advert itself; we are addressing a type of conversion that occurs on the web site where the advert is placed, instead of the advertiser’s web site. This feature can be implemented in various ways: one of the most common is allowing users to request additional advertiser information from within the ad. It can also be used for polling users’ opinion, collecting email addresses, cell phone numbers, or any other details, including full transactional details.
“Viewer to Converter” Funnel
Figure 4 Source: Eyeblaster Research 2009
Whether you go for standard or rich display advertising, not including data capture within any DR campaign is at least halving your overall ROI effectiveness.
Viewing and/or interacting with the ad
Clicking on the advert
Arriving at the web page
Sign in-start page
Sign in - Confirmation
page
Viewing and/or interacting with the ad
Details Submission
DetailsConfirmation
On-Site conversion Regular banner flow (Rich
or Standard)
in-Banner Conversion Rich Media banner flow

7 AnALYTICS BuLLETIn ISSuE 3 | MARCh 2009
Conversion Rate (on-Site vs. in-Banner)
Figure 5 Source: Eyeblaster Research 2009
When comparing the data capture within a banner (1.06%) with that of on-site (0.20% and 0.51%) we see that by removing a number of required steps, the conversion rate is 5x that of standard display and double that of rich media as a result!
By simplifying the process that the consumer is required to follow, the advertiser achieves a more desirable result. however, it is important to note that the level of interactivity within Rich Media is nOT a bearing on the conversion result here; it is purely about making things easier for the consumer to connect and convert in general. users want to connect with a brand where they are.
When we consider that standard advertising does not have the ability to measure anything beyond a click, the need for inclusion of a data capture facility across networks is startlingly obvious. not only is this challenging the notions of cost-effectiveness of standard media buys at driving conversions, but also what we have come to define as Direct Response advertising online. It would serve all standard advertising well to move towards the inclusion of simple response based functionality.
0.20%
0.51%
1.06%
0.00%
0.20%
0.40%
0.60%
0.80%
1.00%
1.20%
Standard Banner
Rich Banner
Impact drives Conversions
Data Capture
x5
You are 5x more likely to convert in a banner than convert on a site as a result of clicking on a standard banner
Let’s try to clarify the power of data capture by referring to the following case study.
In a health and Beauty campaign we monitored the amount of email addresses submitted on a daily basis during the campaign’s lifetime, 22 days. (Over 3 million impressions were served on Yahoo, nine.MSN and news.com.)
in-Banner vs. on-Site Conversions
Figure 6 Source: Eyeblaster Research 2009
The amount of emails submitted from the banner itself (data capture) was significantly higher throughout the campaign’s lifetime in comparison to emails submitted from the advertiser’s site.
Co
nve
rsio
n o
r Fo
rm S
ub
mis
sio
n
Days from campaign’s start date
1 2 3 4 5 6 7 8 9 10 11 12 13 14 15 16 17 18 19 20 210
10
20
30
40
50
60
Form Submissions Confirmation Conversions
Eyeblaster Jan.2009
Case Study health and Beauty campaign

8 AnALYTICS BuLLETIn ISSuE 3 | MARCh 2009
Further challenging the notion of CTR as an effective conversion metricWith CTR being the de-facto measurement of online DR campaigns, how does this need to be addressed given the wealth of data on consumer behaviour discovered over the last 10 years about rich media advertising?
Unique Clicking Users vs. Form Submission
Figure 7 Source: Eyeblaster Research 2009
using global data, we can see that the inclusion of data capture within a banner is just shy of 8x more effective at addressing conversions than CTR. It begs the question, why don’t all DR campaigns have basic data capture functionality built-in as standard?
Consumers are nearly 8x more likely to fill in a form in a banner then click on it
Personalizing the “Viewer to Converter” FunnelImpressions and CTR are non-personal attempts at trying to understand what consumers actually do online. In breaking down the “viewer to converter” funnel for those who convert in banner, we need to try and understand how many times does a consumer get exposed to an advert, how many touch the advert, for how long do they interact with it and what is the resulting conversion pattern?
Therefore we see a funnel of total impressions ➔ unique impressions ➔ unique interacting users ➔ number of conversions (which we will determine as form submission and assuming that person will not submit more than one form and thus can be related to as a unique number.)
See-Interact-Convert (in-Banner) •
What we see from the data is the viewer is being exposed to the ad at least twice (42.79%). 7.40% of these then go on to interact with the ad, and do so for well over a minute (78.08 secs). 33.56% of those who interact go on to convert within the banner.
unique viewers’ rate – unique out of total impressions•
unique Interacting users - unique interacting users out •of unique impressions
Average Dwell Time – number of seconds a viewer •actively is engaged with an advert
Converting users – form submissions out of unique •interacting users
34% of unique users who interact will fill in form details within a banner
0.14%
1.06%
0.00%
0.20%
0.40%
0.60%
0.80%
1.00%
1.20%
Click Through Rate
x7.7
7
In - Banner Conversion Rate

9 AnALYTICS BuLLETIn ISSuE 3 | MARCh 2009
Case Study e-Commerce transactional banner
How far can we push conversions in-Banner?
A leading European mobile operator wanted to attract new subscribers to their network. The concept of data capture was taken to the next stage as they wanted to get much more personal attributes from the interested user as part of entering into a contract with the operator. In this case not just address details, but additional qualifiers such as passport or ID card number as well as bank account details. The incentive to do so was an offer for a free mobile handset. The placement of a creative on a leading portal seemed to offer assurance to the interested consumer and combined with the incentive was enough to inspire confidence of 500 consumers who went on to give full personal details within the advert! This level of success was well-beyond the expectations of the advertiser, but it goes to prove the willingness of modern consumers – and the need to not overlook data capture within creative executions.
Communication and conversionPeople love to talk. Whether it is product feedback or recommending to a friend, there are a variety of methods to start to penetrate the consumer conversation to ensure higher conversion rates. Widgets within social networks are one such method. But what is more interesting is that due to the poised typing position people have within communication channels, such as email and Messenger, there is often more of a willingness to fill in data capture forms within these channels.
Health Campaign CTR vs. Data Capture
Figure 8 Source: Eyeblaster Research 2009
Taking standard display advertising to the next level:A health and Beauty Campaign that utilized a standard display advert within a communication channel found that the CTR was under performing. however, the inclusion of a simple data-capture form that opened in an expansion panel upon clicking on a button within the creative saw a quadruple rise in in-banner submissions over the CTR, incentivized by the chance to win a pair of sunglasses.
Inclusion of a simple data-capture form… saw a quadruple rise in in-banner submissions over the CTRThis is a trend that is seen in Automotive, Travel and health who often utilize data capture as part of their campaign objectives.
0.10%
0.60%
0.00%
0.10%
0.20%
0.30%
0.40%
0.50%
0.60%
0.70%
Click Through Rate In - Banner Submission
x4.0
6

10 AnALYTICS BuLLETIn ISSuE 3 | MARCh 2009
Automatic Optimization mechanism and its impact on conversion ratenot only can you minimize the number of steps in the “viewer to converter” funnel, there is an ability to monitor in real-time the effects of one creative against another during the campaign.
Eyeblaster’s Automatic Optimization mechanism uses an algorithm to find the ads with the highest success rate based on the metric defined, which can often vary upon placement of media by section or publisher. The case study below demonstrates the results of such a methodology deployed and the overall campaign performance based on conversions.
Comparisons against similar campaigns - one with optimization and one without, reveals a considerable change in the ability to control a positive shift in ROI.
From data collected across one Automotive advertiser over a six month period, the conversion rate of campaigns using an optimization algorithm (0.63%) is significantly higher (1.25x) than the average conversion rate of rich media ads (0.51%). In fact, it is practically double the average conversion rate for WW ’08 – 0.32%.
To understand this more fully, let’s delve inside a campaign that implemented real-time optimization.
WW ’08(0.32%)
Rich Media(0.51%)
AutomotiveAdvertiser (0.63%)
0.00%
0.10%
0.20%
0.30%
0.40%
0.50%
0.60%
0.70%
Conversion Rate
x1.97
x1.25
Case Study Data Capture as the desired call to action
Masterfoods hoped to compel interested consumers to sample a new type of chocolate without the need to click through to a mini-site. They created a contest to drive interest and engagement and a series of ads was developed around the idea of “Mix It up”. The prize was the chance to win a 3 month’s supply of chocolates in exchange for personal contact details. The executions were adapted to suit the publisher environment; e.g. high impact on the homepage, with the ability to play a game prior to entry into the competition – but data-capture alone within communication channels. All creatives were designed to remove steps to conversion by immediately presenting the competition entry form on roll-over which was the focus, instead of muddying the call to action with click-thru. It worked. In a single day 35,000 people entered details indicating they wanted to taste Mars chocolates! An incredible indication to a brand as to audience favorability and a true demonstration of online DR at work.
The inclusion of an incentive, such as a giveaway or access to exclusive content, will positively impact the data capture rates.
Figure 9 Source: Eyeblaster Research 2009
11 AnALYTICS BuLLETIn ISSuE 3 | MARCh 2009
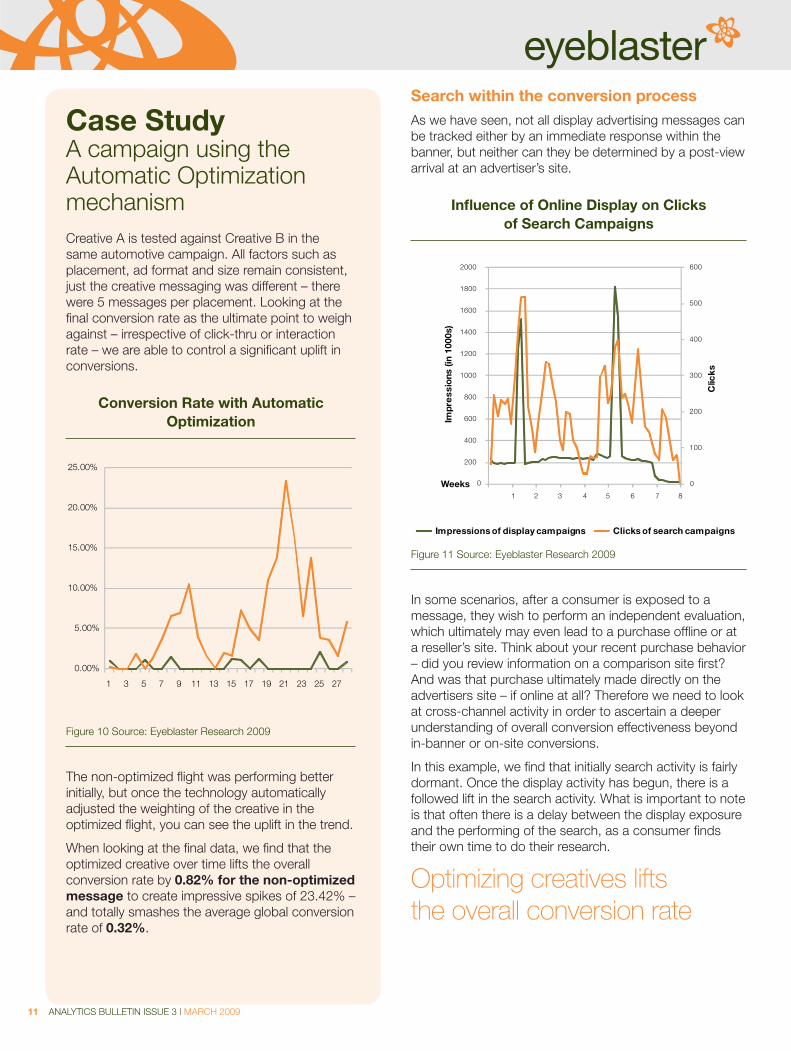
Search within the conversion processAs we have seen, not all display advertising messages can be tracked either by an immediate response within the banner, but neither can they be determined by a post-view arrival at an advertiser’s site.
Influence of Online Display on Clicks of Search Campaigns
Figure 11 Source: Eyeblaster Research 2009
In some scenarios, after a consumer is exposed to a message, they wish to perform an independent evaluation, which ultimately may even lead to a purchase offline or at a reseller’s site. Think about your recent purchase behavior – did you review information on a comparison site first? And was that purchase ultimately made directly on the advertisers site – if online at all? Therefore we need to look at cross-channel activity in order to ascertain a deeper understanding of overall conversion effectiveness beyond in-banner or on-site conversions.
In this example, we find that initially search activity is fairly dormant. Once the display activity has begun, there is a followed lift in the search activity. What is important to note is that often there is a delay between the display exposure and the performing of the search, as a consumer finds their own time to do their research.
0
100
200
300
400
500
600
200
0
400
600
800
1000
1200
1400
1600
1800
2000
1 2 3 4 5 6 7 8
Clic
ks
Impr
ess
ions
(in
1000
s)
Impressions of display campaigns Clicks of search campaigns
Weeks
Case Study A campaign using the Automatic Optimization mechanism Creative A is tested against Creative B in the same automotive campaign. All factors such as placement, ad format and size remain consistent, just the creative messaging was different – there were 5 messages per placement. Looking at the final conversion rate as the ultimate point to weigh against – irrespective of click-thru or interaction rate – we are able to control a significant uplift in conversions.
Conversion Rate with Automatic Optimization
Figure 10 Source: Eyeblaster Research 2009
The non-optimized flight was performing better initially, but once the technology automatically adjusted the weighting of the creative in the optimized flight, you can see the uplift in the trend.
When looking at the final data, we find that the optimized creative over time lifts the overall conversion rate by 0.82% for the non-optimized message to create impressive spikes of 23.42% – and totally smashes the average global conversion rate of 0.32%.
0.00%
5.00%
10.00%
15.00%
20.00%
25.00%
1 3 5 7 9 11 13 15 17 19 21 23 25 27
Conv Rate of a Regular f light Conv Rate of an Optimized f light
Optimizing creatives lifts the overall conversion rate

12 AnALYTICS BuLLETIn ISSuE 3 | MARCh 2009
Thomas McIlheran, Senior Media Manager says: “The Eyeblaster Channel Connect Reporting system is the most progressive reporting tool for monitoring the joint impact of search and display advertising. CC4S allows advertisers and marketers to put numbers around exactly how well these online tactics work together as opposed to how they work against or in spite of one another.”
“Using Channel Connect for Search and Display, Mindshare was able to pinpoint crucial campaign data and draw important insights about the interaction of our search and display ads. In the end, it provided us with a more comprehensive overview of user behavior”, Harry Case, Director of Media Analytics and Technology, Mindshare.
The tailing-off effect of the search activity is maintained at a much slower decline than the display advertising, as the emotional connections a consumer has made as a result of the ad exposure continue to play on their minds for perhaps the next couple of weeks. It could also be fair to say that the multiple exposures to display messaging during this time are having a positive impact in the desire to search, and this higher frequency ensures a greatly drawn-out time span of searches – long after the effects can be seen within traditional display advertising metrics, i.e. clicks have declined, but searches are maintained. This inherently challenges traditional notions of how to optimize display advertising frequency, based upon display advert CTR.
There is a delay between the display exposure and the performance of the search - potentially by as much as 3 weeks!From campaigns we have looked at already, we have found a positive shift towards brand/product name searches as a result of the display activity, proving recall effect of display advertising. We have also seen uplift in search activity as a result of display impressions. We shall look forward to sharing such results in future bulletins.
0
500
1000
1500
2000
2500
3000
3500
4000
4500
0
500
1000
1500
2000
2500
3000
3500
4000
4500
03/10/2008
17/10/2008
31/10/2008
14/11/2008
28/11/2008
12/12/2008
09/01/2009
Imp
ress
ions
(in
1000
s)
Clic
ksImpressions of display campaigns Clicks of search campaigns
12/12/2008
Figure 12 Source: Eyeblaster Research 2009
Targeted messaging with behavioral sequencingThe ability to adaptively sequence creative messaging can be done using various tracking methodologies utilizing cookies and Flash Shared Objects. This has distinct uses to ensure relevance to the viewer.
First, you can ascertain if a user has previously been to the advertiser’s site, and begin to delve where on the site and the profile of the person based upon established criteria. This enables knowledge of the person exposed to the creative to be ascertained prior to being shown a creative and is known in Eyeblaster as DéjàVu.
Second, there is the ability to learn what creatives have been previously shown and/or interacted with and adapt the creative messaging accordingly. This is known as behavioral sequencing.
Finally, there is also the ability to read in host-site content of where the ad is sitting and adapt the creative messaging to the surrounding page content. Called Mash-up technology, this is another way to increase advertising relevance.

13 AnALYTICS BuLLETIn ISSuE 3 | MARCh 2009
Case Study Sony Ericsson k550i campaign
Sony Ericsson ran a campaign across CEEMEA, which adapted differently depending on how a user had interacted – and where – on site or within a banner. The creative was also changed each week to try and minimize ad fatigue through over exposure.
http://creativezone.eyeblaster.com/#ItemName=SE%20K550
Those exposed to a more targeted message… were more likely to move through the conversion sequence
The results demonstrated that as the creative fatigue happened with each week the campaign ran, even with changing the creative per week, CTR steadily declined due to over-saturation.
Stages 1 and 2 represent a targeted message showing a personal message for this week’s competition (stage 1) or if the user had already participated, a message advertising the coming week’s competition (stage 2) up to the final week 4. The data revealed that those exposed to a more targeted message through prior involvement, either on site or within the banner, were more likely to move through the conversion sequence; in this case uploading photographs alongside personal data and as a result, actively recommend the campaign to their friends with a forward-to-friend mechanism built into the ad unit.
This is one of the most exciting findings of how activity on-site and in-banner can work together to engage consumers and lead them through a conversion cycle, as well as engage brand advocacy to their friends.
Data Impressions Clicks CTR Stage 1 Stage 2 Upload Send TotalCustom
Week 1 20,827,665 38,825 0.19% 1,704 249 25 1,978
Week 2 33,928,483 32,264 0.10% 12,416 85 1,058 200 13,759
Week 3 35,917,203 32,233 0.09% 20,245 423 1,600 280 22,548
Week 4 36,036,434 33,369 0.09% 17,978 111 1,827 357 20,273
Total 126,709,785 136,691 0.12% 52,343 619 4,734 862 58,558
Figure 13 Source: Eyeblaster Research 2009

14 AnALYTICS BuLLETIn ISSuE 3 | MARCh 2009
ConclusionThe advent of being able to link data across-channels is a revolutionary breakthrough for the advertising community and heralds the start of a completely new way of being able to effectively and accurately strategize media and reduce overall marketing dollar wastage. We look forward, in future Analytics Bulletins, to show how this is progressing.
We have shown how there are multiple ways to utilize conversions and gain higher ROI for advertisers. As with most software, between 5-10% of possible functionality is currently being utilized within most campaigns and thereby the potential to develop more cost-effective advertising is being lost through lack of knowledge of what is possible with modern day ad serving. As this functionality is generally included within the ad serving costs, coupled with a little creative strategy, the potential to deliver better ROI for clients is easily within the grasp for most agencies and their clients.
Ask your Eyeblaster representative about how you can harness the potential of Eyeblaster’s Ad Campaign Manager to deliver greater ROI for your next client objective.
The potential to deliver better ROI for clients is easily within grasp for agencies and their clients

15 AnALYTICS BuLLETIn ISSuE 3 | MARCh 2009
Performance Metrics (Format and Verticals)Benchmark for North America Q4 ’07 - Q3 ’08
Appendix 1
Basic Metrics Video Metrics Expandable Metrics
IR
Interaction Average Duration
(Seconds)
CTRAvg. Video Duration
(Seconds)
Started Rate
50% Played Rate
Fully Played Rate
Total Expansion
Rate
Impressions with any Panel
Expansion Rate
Avg. Expansion Duration
(Seconds)
Form
ats
Standard Banner — — 0.09% — — — — — — —Rich Media Commercial Break 13% 2.73 2.61% 5.46 72% 10% 3% — — —Expandable Banner 11% 3.87 0.30% 23.62 15% 79% 69% 11% 7% 51.46Floating Ad 3% 2.78 3.15% 6.64 48% 50% 34% — — —Floating Ad With Reminder 5% 3.00 2.80% — — — — — — —
Floating Expandable 10% 3.26 1.52% 5.26 62% 83% 70% 72% 5% 23.70In Game 13% — 4.67% 16.60 94% 71% 47% — — —Polite Banner 5% 3.36 0.17% 19.76 53% 68% 52% — — —Push Down Banner 4% 2.29 0.28% — — — — 35% 3% 18.80Video Strip 17% 4.02 0.17% 17.26 48% 59% 31% 46% 6% 70.23
IR
Interaction Average Duration
(Seconds)
CTR (Rich
Media)
CTR (Standard
Media)
Avg. Video Duration
(Seconds)
Started Rate
50% Played Rate
Fully Played Rate
Total Expansion
Rate
Impressions with any Panel
Expansion Rate
Avg. Expansion Duration
(Seconds)
Vert
ical
s
Apparel 12% 3.33 0.30% 0.24% 15.04 47% 74% 36% 20% 7% 30.41Auto 9% 3.35 0.23% 0.11% 19.63 16% 76% 64% 17% 9% 31.20B2B 6% 3.11 0.48% 0.17% — — — — 12% 9% 65.23Careers 10% 3.45 0.30% 0.09% — — — — 24% 16% 53.43Consumer Packaged Goods 7% 3.63 0.35% 0.11% 24.90 25% 54% 33% 9% 6% 48.21
Corporate 1% 3.09 0.09% 0.05% 22.05 7% 47% 31% 12% 8% 78.68Electronics 8% 3.71 0.24% 0.12% 19.63 20% 66% 71% 15% 11% 42.02Entertainment 11% 3.60 0.26% 0.13% 15.39 13% 61% 46% 9% 5% 49.49Financial 5% 3.35 0.15% 0.07% 13.08 56% 76% 60% 6% 4% 46.69Gaming 7% 4.35 0.63% 0.08% 59.46 17% 49% 35% 22% 8% 61.49Government/utilities 5% 3.18 0.17% 0.07% 24.48 62% 78% 66% 16% 4% 26.07health/Beauty 13% 3.29 0.24% 0.17% 30.80 8% 63% 41% 19% 13% 61.72Medical 6% 3.07 0.14% 0.10% 21.88 38% 72% 58% 7% 5% 36.49news/Media 10% 2.64 0.27% 0.07% — — — — 14% 9% 22.58Restaurant 1% 2.94 0.13% 0.09% 16.04 50% 39% 27% 3% 2% 33.43Retail 11% 3.09 0.29% 0.07% 23.48 11% 40% 25% 16% 9% 28.08Services 8% 3.08 0.38% 0.05% 23.23 56% 77% 63% 33% 21% 70.24Sports 7% 2.98 0.28% 0.08% 11.37 55% 68% 52% 7% 4% 44.50Tech/Internet 4% 3.59 0.17% 0.14% 14.82 51% 77% 65% 6% 4% 88.84Telecom 7% 3.28 0.18% 0.09% 23.55 34% 81% 62% 15% 10% 48.35Travel 4% 3.80 0.21% 0.08% 40.20 59% 78% 61% 13% 5% 31.28
Interaction Rate (IR) user Initiated Interactions' divided by 'Served Impressions'
Click-through Rate (CTR) Frequency of Click-throughs as a percentage of served impressions. 'Clicks' divided by 'Impressions'.
Avg. Video Duration The average duration the video was played, including user and auto initiated videos (in seconds).
Started Rate The number of times the video started out of video's served Impressions
50% Played Rate The number of videos that played over 50% of their total video length divided by 'Video Started'.
Fully Played Rate The number of videos that were fully played divided by video that started
Total Expansion Rate Total expansions divided by served impressions. Including Auto-initiated expansions
Impressions with any Panel Expansion Rate The number of impressions with at least one panel expansion.
Avg. Expansion Duration The average time a panel was expanded, including user and auto initiated expansions
Rich Media Ads All Eyeblaster's format excluding standard banner, wallpaper and window ads
— not Available - either this measurement is not applicable to the format or there was not enough data to be statistically relevant
north America: including uS and Canada. The benchmark is for a rolling year, last updated Q4 2008.

16 AnALYTICS BuLLETIn ISSuE 3 | MARCh 2009
Appendix 2
Performance Metrics (Format and Verticals)Benchmark for Europe Q4 ’07 - Q3 ’08
Basic Metrics Video Metrics Expandable Metrics
IR
Interaction Average Duration
(Seconds)
CTRAvg. Video Duration
(Seconds)
Started Rate
50% Played Rate
Fully Played Rate
Total Expansion
Rate
Impressions with any Panel
Expansion Rate
Avg. Expansion Duration
(Seconds)
Form
ats
Standard Banner — — 0.14% — — — — — —Rich Media —Commercial Break 4% 2.30 3.96% 3.97 72% 48% 29% — — —Expandable Banner 35% 3.27 0.66% 44.12 25% 62% 48% 41% 17% 52.60Floating Ad 13% 2.68 4.16% 8.90 65% 51% 30% — — —Floating Ad With Reminder 6% 2.38 4.66% — — — — — — —
Floating Expandable 20% 2.58 0.48% — — — — 56% 14% 41.95In Game 19% — 5.80% 17.17 99% 93% 80% — — —Polite Banner 7% 2.95 0.21% 44.42 59% 67% 51% — — —Push Down Banner 16% 3.46 0.15% 44.72 55% 84% 78% 22% 12% 57.37Video Strip 23% 4.87 0.18% 63.20 10% 74% 60% 43% 8% 72.39
IR
Interaction Average Duration
(Seconds)
CTR (Rich
Media)
CTR (Standard
Media)
Avg. Video Duration
(Seconds)
Started Rate
50% Played Rate
Fully Played Rate
Total Expansion
Rate
Impressions with any Panel
Expansion Rate
Avg. Expansion Duration
(Seconds)
Vert
ical
s
Apparel 15% 3.05 0.38% 0.17% 51.92 35% 57% 44% 47% 16% 47.41Auto 14% 2.85 0.41% 0.15% 49.68 51% 68% 51% 42% 16% 55.11B2B 9% 3.01 0.44% 0.34% — — — — 12% 6% 46.55Careers 11% 3.00 0.54% 0.15% — — — — 25% 11% 51.31Consumer Packaged Goods 25% 3.58 0.57% 0.12% 39.68 31% 56% 42% 47% 18% 63.97
Corporate 18% 3.11 0.32% 0.08% — — — — 59% 26% 74.74Electronics 21% 2.90 0.35% 0.13% 46.15 36% 72% 59% 42% 17% 48.40Entertainment 28% 3.35 0.57% 0.18% 54.69 30% 62% 46% 40% 18% 39.44Financial 17% 3.03 0.30% 0.14% 33.11 45% 62% 43% 36% 17% 64.06Gaming 19% 3.48 0.68% 0.21% 74.16 39% 61% 41% 41% 17% 51.12Government/utilities 20% 3.33 0.47% 0.08% 49.45 41% 64% 42% 41% 16% 51.84health/Beauty 18% 2.95 0.42% 0.10% 40.92 38% 62% 45% 30% 15% 47.21Medical 12% 2.92 0.34% 0.28% 52.04 32% 50% 32% 54% 18% 57.12news/Media 8% 3.04 0.35% 0.15% 93.30 45% 60% 42% 42% 14% 30.76Restaurant 23% 3.13 0.38% 0.07% 25.33 53% 46% 37% 44% 15% 57.49Retail 21% 2.83 0.47% 0.15% 42.97 57% 63% 44% 54% 22% 57.30Services 21% 3.13 0.44% 0.08% 56.89 29% 62% 42% 42% 18% 55.09Sports 8% 3.05 0.31% 0.10% 32.58 42% 75% 53% 38% 24% 28.36Tech/Internet 15% 3.05 0.38% 0.14% 32.89 43% 82% 72% 37% 14% 46.39Telecom 22% 2.98 0.43% 0.13% 49.42 48% 56% 41% 42% 17% 51.14Travel 22% 3.15 0.49% 0.10% 42.38 59% 69% 57% 40% 14% 46.39
Interaction Rate (IR) user Initiated Interactions' divided by 'Served Impressions'
Click-through Rate (CTR) Frequency of Click-throughs as a percentage of served impressions. 'Clicks' divided by 'Impressions'.
Avg. Video Duration The average duration the video was played, including user and auto initiated videos (in seconds).
Started Rate The number of times the video started out of video's served Impressions
50% Played Rate The number of videos that played over 50% of their total video length divided by 'Video Started'.
Fully Played Rate The number of videos that were fully played divided by video that started
Total Expansion Rate Total expansions divided by served impressions. Including Auto-initiated expansions
Impressions with any Panel Expansion Rate The number of impressions with at least one panel expansion.
Avg. Expansion Duration The average time a panel was expanded, including user and auto initiated expansions
Rich Media Ads All Eyeblaster's format excluding standard banner, wallpaper and window ads
— not Available - either this measurement is not applicable to the format or there was not enough data to be statistically relevant
Europe: including Austria, Belgium, Denmark, France, Germany, Greece, Ireland, Italy, netherlands, Poland, Portugal, Spain, Sweden, Switzerland, uK. The benchmark is for a rolling year, last updated Q4 2008.

17 AnALYTICS BuLLETIn ISSuE 3 | MARCh 2009
Performance Metrics (Format and Verticals)Benchmark for Spain Q4 ’07 - Q3 ’08
Appendix 3
Basic Metrics Video Metrics Expandable Metrics
IR CTRAvg. Video Duration
(Seconds)
Started Rate
50% Played Rate
Fully Played Rate
Total Expansion
Rate
Impressions with any Panel Expansion Rate
Avg. Expansion Duration
(Seconds)
Form
ats
Standard Banner — 0.18% — — — — — — —Rich Media Commercial Break 4% 3.87% — — — — — — —Expandable Banner 53% 1.02% 73.23 20% 56% 44% 64% 23% 67.38Floating Ad 8% 2.08% — — — — — — —Polite Banner 6% 0.25% 60.29 47% 65% 50% — — —Push Down Banner 12% 0.21% — — — — — — —
IRCTR (Rich
Media)
CTR (Standard
Media)
Avg. Video Duration
(Seconds)
Started Rate
50% Played Rate
Fully Played Rate
Total Expansion
Rate
Impressions with any Panel Expansion Rate
Avg. Expansion Duration
(Seconds)
Vert
ical
s
Apparel 21% 0.62% 0.45% 26.86 41% 55% 40% — — —Auto 19% 0.44% 0.18% 21.57 54% 54% 40% 76% 30% 58.70Consumer Packaged Goods 42% 0.95% 0.15% 31.62 25% 62% 38% — — —
Electronics 17% 0.45% 0.16% 40.81 61% 74% 60% 47% 22% 57.02Entertainment 51% 1.06% 0.22% 35.28 44% 66% 51% 53% 10% 51.19Financial 14% 0.34% 0.12% 87.28 60% 84% 52% — — —Gaming 40% 0.94% 0.58% 38.05 44% 62% 45% — — —Government/utilities 13% 0.30% 0.08% — — — — 46% 7% 73.58health/Beauty 38% 0.81% 0.22% 54.38 35% 62% 46% 43% 13% 51.90Retail 18% 0.65% —Services 41% 0.54% 0.14% — — — — 79% 23% 63.60Tech/Internet 9% 0.48% 0.14% 44.00 31% 69% 40% 68% 24% 57.03Telecom 34% 0.50% 0.39% — — — — — — —Travel 22% 0.68% — 35.64 60% 43% 29% 50% 8% 38.69
Interaction Rate (IR) user Initiated Interactions' divided by 'Served Impressions'
Click-through Rate (CTR) Frequency of Click-throughs as a percentage of served impressions. 'Clicks' divided by 'Impressions'.
Avg. Video Duration The average duration the video was played, including user and auto initiated videos (in seconds).
Started Rate The number of times the video started out of video's served Impressions
50% Played Rate The number of videos that played over 50% of their total video length divided by 'Video Started'.
Fully Played Rate The number of videos that were fully played divided by video that started
Total Expansion Rate Total expansions divided by served impressions. Including Auto-initiated expansions
Impressions with any Panel Expansion Rate The number of impressions with at least one panel expansion.
Avg. Expansion Duration The average time a panel was expanded, including user and auto initiated expansions
Rich Media Ads All Eyeblaster's format excluding standard banner, wallpaper and window ads
— not Available - either this measurement is not applicable to the format or there was not enough data to be statistically relevant
The benchmark is for a rolling year, last updated Q4 2008.

18 AnALYTICS BuLLETIn ISSuE 3 | MARCh 2009
Basic Metrics Video Metrics Expandable Metrics
IR
Interaction Average Duration
(Seconds)
CTRAvg. Video Duration
(Seconds)
Started Rate
50% Played Rate
Fully Played Rate
Total Expansion
Rate
Impressions with any Panel
Expansion Rate
Avg. Expansion Duration
(Seconds)
Form
ats
Standard Banner — — 0.11% — — — — — — —Rich Media Commercial Break 3% 2.70 3.14% — — — — — — —
Expandable Banner 21% 3.32 0.34% 22.96 6% 47% 36% 24% 11% 57.25
Floating Ad 8% 3.00 2.28% 50.89 76% 84% 78% — — —Floating Ad With Reminder 5% 2.64 1.60% 11.04 63% 64% 21% — — —
Floating Expandable 32% 2.93 0.43% — — — — 78% 32% 151.76
Polite Banner 2% 2.82 0.11% 40.54 40% 66% 50% — — —Push Down Banner 26% 2.89 0.32% 17.32 23% 63% 47% 45% 11% 24.57
IR
Interaction Average Duration
(Seconds)
CTR (Rich Media)
CTR (Standard
Media)
Avg. Video Duration
(Seconds)
Started Rate
50% Played Rate
Fully Played Rate
Total Expansion
Rate
Impressions with any Panel
Expansion Rate
Avg. Expansion Duration
(Seconds)
Vert
ical
s
Apparel 10% 3.11 0.36% 0.18% 17.65 17% 49% 34% 26% 12% 67.31Auto 7% 2.92 0.23% 0.22% 46.30 27% 78% 69% 17% 10% 52.91Careers 24% 3.45 0.46% 0.04% — — — — 62% 22% 36.10Consumer Packaged Goods 12% 3.27 0.33% 0.12% 24.46 25% 70% 56% 26% 13% 50.61
Corporate 5% 2.55 0.12% 0.05% — — — — 10% 5% 50.69Electronics 16% 2.88 0.32% 0.11% 34.20 34% 64% 50% 29% 15% 56.57Entertainment 11% 3.09 0.35% 0.16% 29.23 16% 68% 55% 21% 10% 56.96Financial 8% 2.76 0.15% 0.05% 19.87 22% 64% 52% 30% 8% 74.25Gaming 6% 4.60 0.30% 0.10% 33.03 20% 54% 41% 6% 3% 46.98Government/utilities 18% 3.77 0.31% 0.18% 69.27 20% 38% 24% 25% 13% 55.22
health/Beauty 12% 2.86 0.45% 0.11% 26.73 18% 47% 34% 23% 13% 62.54Medical 15% 2.75 0.41% 0.09% — — — — 32% 16% 55.26news/Media 11% 3.51 0.21% 0.18% — — — — 19% 11% 68.97Restaurant 27% 4.16 0.67% 0.17% — — — — 37% 17% 32.42Retail 10% 3.70 0.22% 0.11% 35.47 21% 50% 37% 21% 11% 36.07Services 9% 2.77 0.14% 0.06% 50.42 13% 51% 35% 15% 8% 53.70Sports 3% 2.36 0.40% 0.06% — — — — — — —Tech/Internet 4% 2.61 0.12% 0.10% 27.48 27% 58% 38% 23% 11% 67.82Telecom 13% 3.23 0.31% 0.09% 32.26 11% 52% 40% 34% 15% 49.93Travel 15% 2.95 0.32% 0.15% 12.99 17% 63% 51% 25% 10% 48.51
Appendix 4
Performance Metrics (Format and Verticals)Benchmark for APAC Q4 ’07 - Q3 ’08
Interaction Rate (IR) user Initiated Interactions' divided by 'Served Impressions'
Click-through Rate (CTR) Frequency of Click-throughs as a percentage of served impressions. 'Clicks' divided by 'Impressions'.
Avg. Video Duration The average duration the video was played, including user and auto initiated videos (in seconds).
Started Rate The number of times the video started out of video's served Impressions
50% Played Rate The number of videos that played over 50% of their total video length divided by 'Video Started'.
Fully Played Rate The number of videos that were fully played divided by video that started
Total Expansion Rate Total expansions divided by served impressions. Including Auto-initiated expansions
Impressions with any Panel Expansion Rate The number of impressions with at least one panel expansion.
Avg. Expansion Duration The average time a panel was expanded, including user and auto initiated expansions
Rich Media Ads All Eyeblaster's format excluding standard banner, wallpaper and window ads
— not Available - either this measurement is not applicable to the format or there was not enough data to be statistically relevant
APAC: including Australia, China, hong Kong, India, Japan, Korea, Malaysia, new Zealand, Pakistan, Singapore. The benchmark is for a rolling year, last updated Q4 2008.

19 AnALYTICS BuLLETIn ISSuE 3 | MARCh 2009
Performance Metrics (Format and Verticals)Benchmark for Taiwan Q4 ’07 - Q3 ’08
Appendix 5
Basic Metrics Video Metrics Expandable Metrics
IR CTRAvg. Video Duration
(Seconds)
Started Rate
50% Played Rate
Fully Played Rate
Total Expansion
Rate
Impressions with any Panel Expansion Rate
Avg. Expansion Duration
(Seconds)
Form
ats
Standard Banner — 0.04% — — — — — — —Rich Media Expandable Banner 45% 0.58% 307.36 40% 72% 63% 33% 16% 73.48Floating Ad With Reminder 4% 1.97% — — — — — — —
Polite Banner 2% 0.13% 69.28 61% 53% 38% — — —Push Down Banner 2% 0.20% 17.32 23% 63% 47% 29% 0.14% 18.58
IRCTR (Rich
Media)
CTR (Standard
Media)
Avg. Video Duration
(Seconds)
Started Rate
50% Played Rate
Fully Played Rate
Total Expansion
Rate
Impressions with any Panel Expansion Rate
Avg. Expansion Duration
(Seconds)
Vert
ical
s
Apparel 6% 0.25% — 58.71 30% 67% 51%Auto 29% 0.54% — 20.32 19% 61% 47% 36% 11% 14.64Consumer Packaged Goods 5% 0.20% — 72.24 39% 60% 47% — — —
Entertainment 14% 0.35% — 229.87 45% 69% 58% 28% 13% 80.67Financial 52% 0.74% — — — — — — — —health/Beauty 28% 0.38% — 296.51 42% 71% 62% 26% 17% 85.24Tech/Internet 2% 0.20% 0.04% — — — — — — —Telecom 36% 0.47% — 93.79 29% 59% 43% 43% 28% 84.96Travel 18% 0.42% — — — — — 28% 10% 27.70
Interaction Rate (IR) user Initiated Interactions' divided by 'Served Impressions'
Click-through Rate (CTR) Frequency of Click-throughs as a percentage of served impressions. 'Clicks' divided by 'Impressions'.
Avg. Video Duration The average duration the video was played, including user and auto initiated videos (in seconds).
Started Rate The number of times the video started out of video's served Impressions
50% Played Rate The number of videos that played over 50% of their total video length divided by 'Video Started'.
Fully Played Rate The number of videos that were fully played divided by video that started
Total Expansion Rate Total expansions divided by served impressions. Including Auto-initiated expansions
Impressions with any Panel Expansion Rate The number of impressions with at least one panel expansion.
Avg. Expansion Duration The average time a panel was expanded, including user and auto initiated expansions
Rich Media Ads All Eyeblaster's format excluding standard banner, wallpaper and window ads
— not Available - either this measurement is not applicable to the format or there was not enough data to be statistically relevant
The benchmark is for a rolling year, last updated Q4 2008.

www.eyeblaster.com