extreme drying events in the australian high-country and ... · and anomalous atmospheric drying...
TRANSCRIPT

157
Australian Meteorological and Oceanographic Journal 62 (2012) 157–170
Extreme drying events in the Australian high-country and their implications for
bushfire risk management
(Manuscript received January 2012; revised August 2012)
J.J. Sharplesa, G.A. Millsb and R.H.D. McRaec
aApplied and Industrial Mathematics Research Group, School of Physical, Environmental and Mathematical Sciences, University of New South Wales, Canberra, Australia
bCentre for Australian Weather and Climate Research, Melbourne, AustraliacAustralian Capital Territory Emergency Services Agency, Canberra ACT, Australia
Introduction
Understanding and predicting short-term changes in fire weather conditions, which are predominantly governed by air temperature, relative humidity and wind speed, form an important component of bushfire management (Noble et al. 1980; Chandler et al. 1983). Unexpected or abrupt changes in fire weather conditions can result in the loss of containment of wildfires, the loss of control of prescribed fires, and extreme danger to firefighters (Cheney et al. 2001). While a number of atmospheric processes, such as cold fronts, sea breezes and foehn winds, are known to generate abrupt changes in fire weather (Bond et al. 1967; Brotak and Reifsnyder 1977; Mills 2002; 2005; 2007; Mills and Pendlebury 2003; Sharples et al. 2010), the present focus is on synoptic events that specifically impact high-country landscapes. High-country landscapes, such as those in and around the Australian Alps, are susceptible to a number of processes and phenomena that are generally not encountered in
the flatter, lower hinterlands (the ‘low-lands’). Moreover, many of the processes and phenomena endemic to high-country landscapes have significant implications for bushfire risk management. In particular, the assumption of a ‘fire weather continuum’, which is often valid in low-land settings, may not be applicable at higher elevations due to the atmospheric structures encountered (Blumen 1990; Gorski and Farnsworth 2000; Kossmann et al. 2001; Sharples 2009). For example, adiabatic lapse rate (ALR) arguments are often employed to extrapolate knowledge of temperature and relative humidity at low-land sites to estimates of temperature and relative humidity at elevated sites. Such considerations are often implemented by fire ground personnel as rules of thumb that are based on various assumptions, such as constant mixing ratio and dry adiabatic conditions. These can result in the expectation that temperatures will decrease and relative humidity will increase with increasing elevation. For example, under dry adiabatic conditions (and hydrostatic equilibrium) a useful approximation is that temperature will decrease by approximately 10 °C for each 1000 m increase in elevation, and relative humidity will approximately double for each 1200 m increase in elevation. However, ALR arguments
Corresponding author address: J. J. Sharples, The University of New South Wales, UNSW Canberra, PO Box 7916, Canberra BC 2610, Australia. Email: [email protected]
An analysis of extreme drying events in the Australian high-country and an ex-amination of their effects in the context of fire weather and bushfire potential are presented. The analyses consider differences in low-land and high-country fire weather observations, as represented by a pair of automatic weather stations: Canberra Airport (578 m) and Mt Ginini (1760 m). An ‘extreme’ high-country dry-ing event is formally defined and a number of extreme drying events are identi-fied. These are used to provide information on the temporal distribution of ex-treme drying events and on their frequency of occurrence. In addition, instances of extreme differences between high-country and low-land values of the McAr-thur Forest Fire Danger Index are considered in parallel with the extreme dry-ing events. Two extreme drying events are selected as case studies and examined using a numerical weather prediction model (meso-LAPS). In each case model diagnoses provide an indication of the atmospheric processes driving the extreme surface drying in the high-country. Some implications of the results for bushfire risk management are briefly discussed.

158 Australian Meteorological and Oceanographic Journal 62:3 September 2012
will only apply within the lower, mixed atmospheric layer, below elevations where significant changes in the vertical atmospheric structure (e.g. inversions) are found. Above these elevations, ALR arguments will be invalid and any estimates based upon them can be seriously in error. The elevation and ruggedness of high-country regions exposes them to processes like wind-terrain interactions and anomalous atmospheric drying phenomena, both of which can have drastic implications for bushfire risk management. Atmospheric moisture levels directly affect the flammability of fuels through their (lagged) influence on fuel-moisture content. The implication is that in the high-country fire potential and expected fire behaviour can vary considerably across the landscape and in time. Thus in the context of bushfire risk management, understanding the driving factors behind significant changes in fire weather in the high-country and how they might affect fire behaviour and bushfire risk is an important problem. Over the last decade there have been a number of significant fires burning in and around the southeast Australian high-country (Nairn 2003; Smith 2007; Teague et al. 2010) that have behaved in a manner that have surprised experienced fire-management personnel. Examples of this have been brought to the attention of the authors through discussions with firefighters, who mention instances where early morning back-burning had failed, with the fire suddenly intensifying, breaking control lines and even transitioning to a crown fire. In terms of fire weather, any process that acts to alter temperature, atmospheric moisture or wind speed and direction could have a significant effect on fire potential and behaviour (Noble et al. 1980). To address this issue we conducted a comparative analysis of fire weather variables at a high-country site and a low-land site. In particular we considered the difference between low-land and high-country dewpoint temperature expressed as an anomaly. The analysis utilised fire weather data recorded at Canberra Airport AWS and Mt Ginini AWS. These stations are of interest since they are in the general area affected by the disastrous 2003 Canberra fires (Nairn 2003). Mt Ginini AWS, in particular, was only installed after the 2003 fires in response to the apparent need for direct fire weather observations in the Brindabella Mountains to the west of Canberra. Mt Ginini is in the general area where the 2003 fires had burnt for several days before making their runs toward Canberra on 18 January. As such, the use of these two stations provides an opportunity to examine differences in high-country and low-land fire weather over a region of historical relevance. One shortcoming of using Mt Ginini in the analysis, however, is that it only has a relatively short record of data. As such the present study should be considered somewhat preliminary. An ‘extreme high-country drying event’ was defined as an instance where the corresponding dewpoint-difference anomaly exceeds a certain threshold value (defined in terms of difference anomaly standard deviation). The following presents analyses of the dewpoint-difference anomalies
that address the frequency of extreme high-country drying events and their association with anomalously high fire danger conditions in the high-country. Moreover, a similar analysis was conducted using differences in the McArthur Forest Fire Danger Index (McArthur 1967; Noble et al. 1980). According to Noble et al. (1980) a unit change in relative humidity has a greater effect on fire danger levels than unit changes in temperature and wind speed. While the simple fire danger index of Sharples et al. (2009) treats temperature and relative humidity as algebraically equivalent in sensitivity, relative humidity remains an important variable. The analysis of the fire danger index was therefore used to examine more closely the correlation between anomalously low atmospheric moisture in the high-country and anomalously high fire danger rating. We note however, that the effects of precipitation on fire danger levels are ignored in the present study. Indeed, the drought factor (Griffiths 1999), which quantifies fuel availability as a function of antecedent rainfall, was assumed to be at its maximum value of ten at both stations. As such the results pertain to potential differences in fire danger rating rather than actual differences. Spatiotemporal variability of the drought factor will be considered in future work. To better understand the atmospheric processes that can lead to anomalously low high-country dewpoint and anomalously high fire danger levels in the high-country, two high-country drying events were investigated using a mesoscale numerical weather prediction model to simulate the atmospheric dynamics and to diagnose the main atmospheric processes resulting in the low high-country dewpoint temperatures. The results of the observational analyses and the model simulations are discussed in the context of fire-management in high-country landscapes.
Data and methods
Weather data from two automatic weather stations were obtained. The two weather stations, both maintained by the Bureau of Meteorology, were: Canberra Airport (ID: 070014), located 6.25 km to the east-southeast of Canberra at an elevation of 578 m; and Mt Ginini (ID: 070349), located 43 km to the southwest of Canberra, in the Brindabella Ranges at an elevation of 1760 m. The data recorded at Canberra Airport and Mt Ginini were taken to be representative of low-land and high-country weather conditions, respectively. The data were comprised of half-hourly records of temperature (°C), dewpoint temperature (°C), relative humidity (%), wind direction (compass point), wind speed and gust (km h-1), which covered the period 0000, 1 November 2006 to 0900, 14 May 2008 (times are given in terms of local standard time: UTC+10 hours, unless stated otherwise). Data for the period 1000, 29 June 2007 to 0230, 29 July 2007 were not available at Mt Ginini and so this period is not represented in the analyses. The data also had the occasional missed record, and some additional records corresponding to measurements taken between the standard half-hourly measurements, when

Sharples et al: Extreme drying events in the Australian high country and their implications for bushfire risk management 159
unusual weather was detected, for example. In total there were 24 114 records at both automatic weather stations. The analyses presented here focus on the dewpoint temperature Tdp, and the McArthur Mk 5 Forest Fire Danger Index FFDI (McArthur 1967), which is a dimensionless measure of fire potential derived from the available fire weather data. Specifically, the analyses will consider the differences between low-land and high-country Tdp and FFDI. It is thus convenient to introduce the quantities δTdp and δFFDI, defined by:
δTdp = Tdp – Tdp L H ...(1)
δFFDI = FFDIL
– FFDIH
...(2)
where the superscript ‘L’ signifies the low-land value (i.e. recorded at Canberra Airport) and the superscript ‘H’ signifies the high-country value (i.e. recorded at Mt Ginini). These quantities are then expressed in the form of difference anomalies ηdp and ηFFDI, defined by:
ηdp = δTdp – δTdp
—...(3)
ηFFDI = δFFDI – δFFDI—
...(4)
where the over-bar denotes the (all-value) mean of a quantity. Note here that ηdp > 0 implies that the high-country site had a lower dewpoint temperature than the low-land site, while ηFFDI < 0 implies that the fire potential at the high-country site was greater than that at the low-land site. We note for reference that
δTdp = 4.0˚C, δFFDI = 2.5 ·— —
For convenience in calculating ηFFDI the drought factor was taken to have its maximum value of ten at both the high-country and low-land sites. While this assumption may not be true in general, it would be valid after periods of extended drought such as during the 2003 Canberra fires (Griffiths 1999; Taylor and Webb 2005). The inclusion of actual drought factors would make an interesting extension of the present work. An ‘extreme’ event was defined in terms of the standard deviation of the distribution of the difference anomalies. Denoting the standard deviation of the dewpoint-difference anomalies as σdp, an ‘extreme’ high-country drying event was defined as one of those associated with difference anomalies satisfying:
ηdp ≥ 3σdp ·
Similarly, denoting the standard deviation of the FFDI-difference anomalies as σFFDI, an ‘extreme’ FFDI event was defined as one of those satisfying:
ηFFDI ≤ -2σFFDI ·
The thresholds 3σdp and -2σFFDI were chosen because they correspond to extremity levels of approximately one per cent; that is, approximately one per cent of dewpoint-difference anomalies are greater than 3σdp, and one per
cent of FFDI-difference anomalies are less than -2σFFDI. In total, there were 370 dewpoint-difference anomalies with ηdp ≥ 3σdp and 277 FFDI-difference anomalies with ηFFDI ≤ -2σFFDI. The extreme FFDI events were used to investigate if there was any correlation or overlap with the extreme drying events identified.
Statistical characterisation of difference anomaliesIn this section we consider the statistical characteristics of the dewpoint- and FFDI-difference anomalies. In particular we provide a characterisation of the timing and frequency of extreme high-country drying events. We note for reference that for the data used in this study σdp = 3.16 °C and σFFDI = 5.27.
Dewpoint-difference anomaliesThe distribution of ηdp can be seen in Fig. 1(a). The distribution is slightly positively skewed, with a skewness (third standardized moment) of γ1 = 1.33 and an extended upper tail. The time series plot of ηdp in Fig. 2(a) indicates that the positive skew seen in the distribution in Fig. 1(a) is due to a number of extreme events, distinguishable in Fig. 2(a) as points that extend well above the main cluster of dewpoint-difference anomalies satisfying |ηdp| < 5 °C. A number of the more extreme dewpoint-difference anomalies are identified by their date and time of occurrence in Fig. 2(a). Interestingly, all of the extreme dewpoint-difference anomalies identified in Fig. 2(a) occur during the early morning 0000–0900, with most occurring just before, or just after sunrise in the period 0430–0900. More generally
Fig. 1. Distributions of (a) dewpoint-difference anomalies
ηdp, and (b) FFDI-difference anomalies ηFFDI.
Rela
tive
frequ
ency
of d
ewpo
int-
diffe
renc
e an
omal
y
0.18
0.16
0.14
0.12
0.10
0.08
0.06
0.04
0.02
0.00-15 -10 -5 0 5 10 15 20 25 30
Dewpoint-difference anomaly (˚C)
Low-lands drier High country drier
Rela
tive
frequ
ency
of
FFDI
-diff
eren
ce a
nom
aly
0.35
0.30
0.25
0.20
0.15
0.10
0.05
0.00-24 -16 -8 0 8 16 24 32 40 48 56 64
FFDI-difference anomaly
Greater fire potential in high-country
Greater fire potential in low-lands

160 Australian Meteorological and Oceanographic Journal 62:3 September 2012
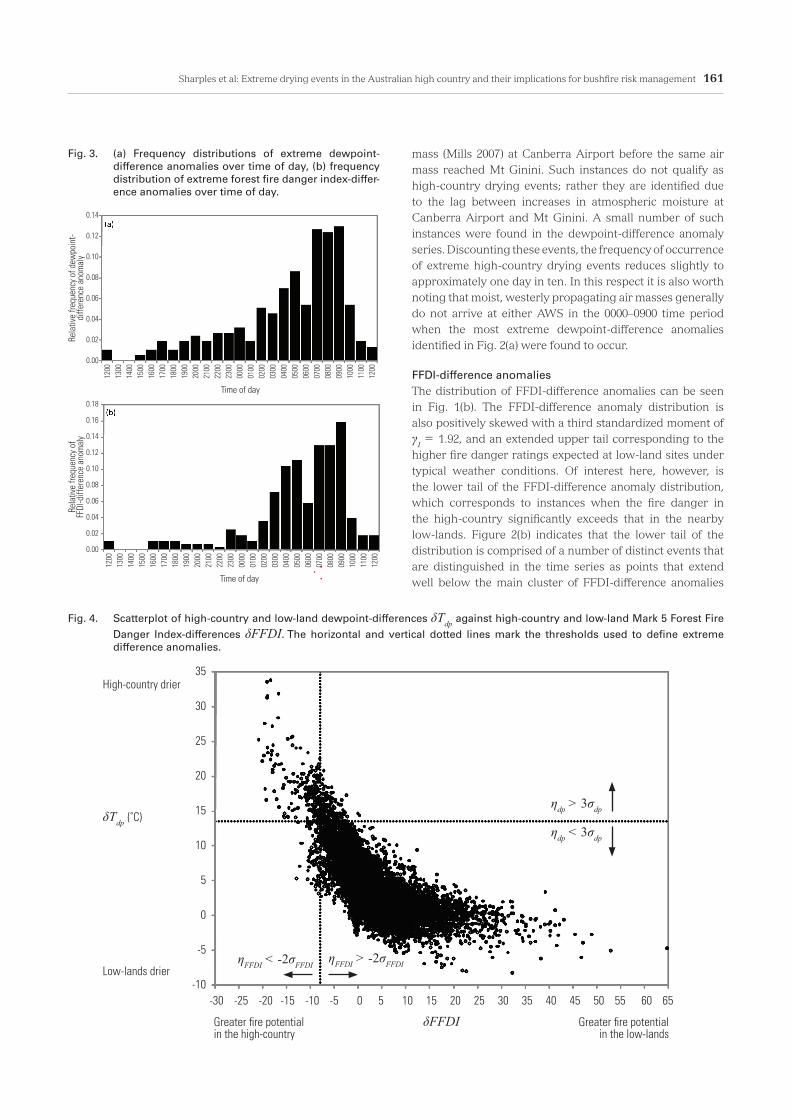
Fig. 3(a), which illustrates how all of the extreme dewpoint-difference anomalies are distributed over time of day, confirms a strong preference for anomalously low dewpoint temperatures over the high-country in the early morning. In fact, 76 per cent of all dewpoint-difference anomalies ηdp > 3σdp occurred between midnight and 0900, while 49 per cent occurred between 0430 and 0900. Given the limitations of the data, in particular the missing data for July 2007, it was difficult to ascertain any seasonal preference for the extreme drying events. Extreme dewpoint-difference anomalies occurred most frequently in November, but also across all months with little apparent seasonal pattern. Of the 532 days represented in the data, there were 60 days on which an extreme anomaly occurred.
This total will include some instances when a single high-country dewpoint-depression event spanned two separate days and so it could be construed that such events were counted twice. In fact this occurred in a few instances, and when it did, the effects of double counting were countered by instances where two separate dewpoint-depression events occurred on a single day and so were only counted as one. With this limitation in mind, the numbers cited above imply that on average an extreme high-country drying event can be expected on approximately one day in nine. The method used to count the dewpoint-difference anomalies did not distinguish instances where the large differences in low-land and high-country dewpoint were caused by the arrival of a moist, westerly propagating air
Fig. 2. Time series of difference anomalies (a) ηdp, and (b) ηFFDI. Dates and times of some extreme values are indicated in each panel.
Dew
poin
t-diff
eren
ce a
nom
aly
(˚C)
35
30
25
20
15
10
5
0
-5
-10
-15
Date
10/1
0/20
06
29/1
1/20
06
18/0
1/20
07
09/0
3/20
07
28/0
4/20
07
17/0
6/20
07
06/0
8/20
07
25/0
9/20
07
14/1
1/20
07
03/0
1/20
08
22/0
2/20
08
12/0
4/20
08
01/0
6/20
08
FFDI
-diff
eren
ce a
nom
aly
70
60
50
40
30
20
10
0
-10
-20
-30
-40
Date
10/1
0/20
06
29/1
1/20
06
18/0
1/20
07
09/0
3/20
07
28/0
4/20
07
17/0
6/20
07
06/0
8/20
07
25/0
9/20
07
14/1
1/20
07
03/0
1/20
08
22/0
2/20
08
12/0
4/20
08
01/0
6/20
08
(a)
(b)
11 May0400 27 May
0900
23 Jun0300 2 Sep
060011 Jan0530
30 Nov0530
31 Dec0400
8 Mar0530
1 May0000
30 Nov0330
11 Jan0530
11 May0630
27 May0900
23 Jun0330
2 Sep0630
23 Sep0630
18 Oct0430
26 Nov0500
31 Dec0400
8 Mar0530
1 May0030
Sharples et al: Extreme drying events in the Australian high country and their implications for bushfire risk management 161
mass (Mills 2007) at Canberra Airport before the same air mass reached Mt Ginini. Such instances do not qualify as high-country drying events; rather they are identified due to the lag between increases in atmospheric moisture at Canberra Airport and Mt Ginini. A small number of such instances were found in the dewpoint-difference anomaly series. Discounting these events, the frequency of occurrence of extreme high-country drying events reduces slightly to approximately one day in ten. In this respect it is also worth noting that moist, westerly propagating air masses generally do not arrive at either AWS in the 0000–0900 time period when the most extreme dewpoint-difference anomalies identified in Fig. 2(a) were found to occur.
FFDI-difference anomaliesThe distribution of FFDI-difference anomalies can be seen in Fig. 1(b). The FFDI-difference anomaly distribution is also positively skewed with a third standardized moment of γ1 = 1.92, and an extended upper tail corresponding to the higher fire danger ratings expected at low-land sites under typical weather conditions. Of interest here, however, is the lower tail of the FFDI-difference anomaly distribution, which corresponds to instances when the fire danger in the high-country significantly exceeds that in the nearby low-lands. Figure 2(b) indicates that the lower tail of the distribution is comprised of a number of distinct events that are distinguished in the time series as points that extend well below the main cluster of FFDI-difference anomalies
Fig. 3. (a) Frequency distributions of extreme dewpoint-difference anomalies over time of day, (b) frequency distribution of extreme forest fire danger index-differ-ence anomalies over time of day.
Rela
tive
frequ
ency
of d
ewpo
int-
diffe
renc
e an
omal
y
0.14
0.12
0.10
0.08
0.06
0.04
0.02
0.00
Time of day
1200
13
00
1400
15
00
1600
17
00
1800
19
00
2000
21
00
2200
23
00
0000
0100
0200
0300
0400
0500
0600
0700
0800
0900
1000
1100
1200
Rela
tive
frequ
ency
of
FFDI
-diff
eren
ce a
nom
aly
0.18
0.16
0.14
0.12
0.10
0.08
0.06
0.04
0.02
0.00
Time of day
1200
13
00
1400
15
00
1600
17
00
1800
19
00
2000
21
00
2200
23
00
0000
0100
0200
0300
0400
0500
0600
0700
0800
0900
1000
1100
1200
35
30
25
20
15
10
5
0
-5
-10
δFFDI
High-country drier
-30 -25 -20 -15 -10 -5 0 5 10 15 20 25 30 35 40 45 50 55 60 65
Low-lands drier
δTdp (˚C)
Greater fire potential in the high-country
Greater fire potential in the low-lands
ηdp > 3σdp
ηdp < 3σdp
ηFFDI < -2σFFDIηFFDI > -2σFFDI
Fig. 4. Scatterplot of high-country and low-land dewpoint-differences δTdp against high-country and low-land Mark 5 Forest Fire
Danger Index-differences δFFDI. The horizontal and vertical dotted lines mark the thresholds used to define extreme difference anomalies.

162 Australian Meteorological and Oceanographic Journal 62:3 September 2012
satisfying |ηFFDI| < 10. The dates and times of the most extreme events indicated in Fig. 2(b) are the same as those corresponding to extreme dewpoint-difference anomalies in Fig. 2(a). In fact, in each of these cases, the minimum FFDI-difference anomalies occur within two and a half hours of the maximum dewpoint-difference anomaly and we are led to conclude that, at least for the period considered, the most extreme negative FFDI-difference anomalies only occur
in connection with extreme positive dewpoint-difference anomalies. Regardless of whether dewpoint-differences are the sole cause of such FFDI-difference anomalies, or whether they are correlated with higher wind speeds, for example, they remain diagnostic. This conclusion is supported by Fig. 4, which depicts the relationship between the dewpoint and FFDI-difference anomalies. The data indicate that every extreme FFDI-
Fig. 5. Time series of (a) dewpoint temperature at Mt Ginini and Canberra Airport over the period 1200, 28 November 2006 and 1200, 1 December 2006, and (b) forest fire danger index at Mt Ginini and Canberra Airport (assuming a drought factor of 10 at both locations) over the same period.
Dew
poin
t tem
pera
ture
(˚C)
15
10
5
0
-5
-10
-15
-20
-25
-30
Date and time
28/1
1/20
06 1
200
28/1
1/20
06 1
500
28/1
1/20
06 1
800
28/1
1/20
06 2
100
29/1
1/20
06 0
000
29/1
1/20
06 0
300
29/1
1/20
06 0
600
29/1
1/20
06 0
900
29/1
1/20
06 1
200
29/1
1/20
06 1
500
29/1
1/20
06 1
800
29/1
1/20
06 2
100
30/1
1/20
06 0
000
30/1
1/20
06 0
300
30/1
1/20
06 0
600
30/1
1/20
06 0
900
30/1
1/20
06 1
200
30/1
1/20
06 1
500
30/1
1/20
06 1
800
30/1
1/20
06 2
100
01/1
2/20
06 0
000
01/1
2/20
06 0
300
01/1
2/20
06 0
600
01/1
2/20
06 0
900
01/1
2/20
06 1
200
(a)
Fore
st F
ire D
ange
r Ind
ex (F
FDI)
60
50
40
30
20
10
0
Date and time
28/1
1/20
06 1
200
28/1
1/20
06 1
500
28/1
1/20
06 1
800
28/1
1/20
06 2
100
29/1
1/20
06 0
000
29/1
1/20
06 0
300
29/1
1/20
06 0
600
29/1
1/20
06 0
900
29/1
1/20
06 1
200
29/1
1/20
06 1
500
29/1
1/20
06 1
800
29/1
1/20
06 2
100
30/1
1/20
06 0
000
30/1
1/20
06 0
300
30/1
1/20
06 0
600
30/1
1/20
06 0
900
30/1
1/20
06 1
200
30/1
1/20
06 1
500
30/1
1/20
06 1
800
30/1
1/20
06 2
100
01/1
2/20
06 0
000
01/1
2/20
06 0
300
01/1
2/20
06 0
600
01/1
2/20
06 0
900
01/1
2/20
06 1
200
(b)

Sharples et al: Extreme drying events in the Australian high country and their implications for bushfire risk management 163
difference anomaly coincides with a positive dewpoint-difference anomaly. In fact, 72 per cent of extreme FFDI-difference anomalies coincided with extreme high-country drying events. Moreover, if the definition of an extreme high-country drying event was extended to include events such as the one at 0630, 29 November 2006 satisfying ηdp > 2σdp, then 84 per cent of extreme FFDI-difference anomalies would coincide with extreme high-country drying events. The distribution of extreme negative FFDI-difference anomalies over time of day, illustrated in Fig. 3(b), bears a strong resemblance to the distribution of extreme positive dewpoint-difference anomalies in Fig. 3(a). In particular, Fig. 3(b) indicates a preference for extreme negative FFDI difference anomalies in the early morning. Indeed, 85 per cent of all extreme FFDI-difference anomalies occurred between midnight and 0900, while 52 per cent occurred between 0430 and 0900. These are similar percentages as those found for the extreme dewpoint-difference anomalies. Despite the fact that this analysis only uses the maximum drought factor, seasonal trends in temperature and dewpoint alone produce strong seasonal trends in FFDI, with elevated FFDI values, and thus also difference anomalies, restricted to the warmer months. Indeed, extreme FFDI-difference anomalies were found to occur most frequently in November, and with the exception of May, extreme FFDI-difference anomalies did not occur very often during the cooler months of April – September, though the limitations of the data again need to be recognised here. Of the 532 days represented in the data, there were 47 days on which an extreme FFDI-difference anomaly occurred. Noting again the issue with counting the number of days on which anomalous events occurred, the number of days cited above implies that on average an extreme negative FFDI-difference anomaly can be expected on approximately one day in eleven.
Numerical weather modelling of two case studies
We use a mesoscale version of the Limited Area Prediction System (LAPS) NWP model (Puri et al. 1998) to investigate the evolving three-dimensional atmospheric structures associated with the extreme dewpoint and/or FFDI-difference anomalies that occurred in the early morning of 29 and 30 November, 2006 (Fig. 5). LAPS is a hydrostatic model with a boundary layer and vertical diffusion scheme that uses similarity theory in the constant flux layer and vertical eddy transports parameterised using stability-dependent mixing length methods. We use a mesoscale version of LAPS (hereafter meso-LAPS) with a horizontal grid spacing of 0.05° (~5 km), and with 29 vertical σ (pressure divided by surface pressure) levels, from σ = 0.9988 (approximately 10 m above the surface) to σ = 0.05, with ten levels between the surface and σ = 0.85. We note, however, that cross-sections derived from meso-LAPS are displayed in pressure coordinates with the model σ-level data interpolated to a regular 25 hPa increment. A systematic verification of meso-LAPS forecasts
of surface parameters against station observations is given in Engel and Ebert (2007).
2300, 29 November–0800, 30 November 2006Figure 5(a) depicts the separate dewpoint temperature time series at Canberra Airport and Mt Ginini for the period 1200, 28 November 2006 to 1200, 1 December 2006. This period contains the highest dewpoint-difference anomaly of ηdp = 29.5 °C, which occurred at 0330, 30 November 2006. The dewpoint-depression event at Mt Ginini associated with this anomaly actually evolved over several hours: the high-country dewpoint temperature dropped dramatically after 2300, 29 November and remained very low, with dewpoint temperatures between -30 °C and -20 °C, until about 0800, 30 November. During this time the dewpoint at Canberra Airport remained relatively steady at about 5–6°. In terms of relative humidity, Canberra Airport experienced relative humidity of 75–80 per cent, while Mt Ginini experienced simultaneous relative humidity of 4–10 per cent. A temperature increase also occurred at Mt Ginini during the dewpoint-depression event (not shown), with temperature rising from about 6 °C at 2300, 29 November to over 11 °C after 0100, 30 November. This was again in contrast to the behaviour of the temperature at Canberra Airport, which only fluctuated slightly between 8 °C and 10 °C. Figure 5(b), which depicts the separate FFDI time series at Canberra Airport and Mt Ginini, shows that the extreme dewpoint-difference anomaly was concomitant with an extreme FFDI-difference anomaly. In fact, the third lowest FFDI-difference anomaly of ηFFDI = -22.1, occurred at 0530, 30 November 2006, two hours after the highest dewpoint-difference anomaly occurred. The FFDI time series in Fig. 5(b) indicates that during this dewpoint-depression event at Mt Ginini the fire danger index in the high-country could have potentially been fourteen times higher than that simultaneously encountered in the low-lands. At the same time differences in temperature were only of the order of 4–5 °C and wind speeds were approximately 10 km h-1 at both sites. We note in passing that an extreme dewpoint-difference anomaly also occurs at approximately 1500, 29 November (Fig. 5(a)). This event, however, is of the type discussed previously where a moist, westerly propagating air mass impacts Canberra Airport before it impacts the high-country to the west. As such it does not qualify as a high-country drying event. Overnight on 29–30 November 2006 a north-south oriented ridge of high pressure was located just east of the high-country, and was moving eastwards. This can be seen in the NCEP-DOE reanalyses1 (Kalnay et al. 1996) in Fig. 6. For example, Fig 6(a) depicts MSL pressure at 2200. A strong mid-tropospheric ridge was upstream of the Alps, over central South Australian longitudes (Fig. 6(b)), which resulted in marked descent in the low-mid-troposphere over
1http://www.esrl.noaa.gov/psd/data/gridded/data.ncep.reanalysis2.html

164 Australian Meteorological and Oceanographic Journal 62:3 September 2012
southeast Australia (Fig. 6(c)). The presence of a descending air mass over the region of interest provides the mechanism to bring very dry air aloft to high-country altitudes. The meso-LAPS model was used to investigate further. Meso-LAPS model runs were initialised at 1600, 29 November. The model diagnoses showing the evolution of the mixing ratio isopleths (g kg-1) during the period of interest can be seen in Fig. 7(a–c). The main feature seen in the mixing ratio cross-sections is a very strong moisture gradient with exceedingly dry air above it. Figure 7(a), which shows meso-LAPS output for 1800, 29 November 2006, well before the drop in dewpoint at Mt Ginini, indicates that mixing ratio decreased rapidly at around the 700 hPa level from 4.5 g kg-1 to less than 0.5 g kg-1. The subsequent atmospheric development is shown in Fig. 7(b), which shows the model output at 2300, 29 November when the dewpoint-depression event was observed to begin, and in Fig. 7(c), which shows the model output at 0300, 30 November approximately when the dewpoint-depression event was at its peak. As time progresses the dry upper air steadily descends until it reaches a level commensurate with the high-country. Between 1800, 29 November and 0300, 30 November the sharp moisture gradient moves from the 700 hPa level to the 800 hPa level, approximately. The isentropes in Fig. 7(d), which depicts the model output at the peak of the dewpoint-depression event (0300), indicates that in the absence of diurnal heating a strong subsidence inversion has formed at an altitude similar to the model elevation ascribed to Mt Ginini. Note that the smoothed rendering of the terrain used by meso-LAPS ascribes an elevation of only about 1000 m to the location of Mt Ginini (e.g. see Fig. 9), while the station itself is significantly more elevated at 1760 m. This means that the high peaks in the vicinity of Mt Ginini may protrude much further into the dry air above the inversion than is indicated in Fig. 7. On the other hand, the model elevation ascribed to Canberra Airport of about 700 m is higher than the actual station elevation of 578 m. The modelled subsidence inversion level (Fig. 7(d)) thus indicates that Canberra Airport was well below the inversion in the significantly moister air mass. The meso-LAPS output in Fig. 7 is generally consistent with the observations recorded at Mt Ginini during the period of interest. For example, the modelled near surface winds of 5 knots (Fig. 7(d)) in the vicinity of Mt Ginini are consistent with the observed wind speeds of 8–11 km h-1 (4.3–5.9 knots). Moreover, dewpoint started to drop abruptly at Mt Ginini at 2300, 29 November 2006 (see Fig. 5(a)), which according to the model diagnoses in Fig. 7(c) coincides with the time when the dry air above the sharp moisture gradient had subsided to about the 750 hPa level. The modelled subsidence inversion consolidated at about 0000 and remained in place until about 0800 after daytime surface heating commenced. Likewise, the general altitude of the air mass with very low mixing ratio remained unchanged with only small-scale perturbations evident in
the overall development of the mixing ratio field until about 0900. This is again consistent with observations showing that the anomalous dewpoint temperatures at Mt Ginini had abated by 0800 (Fig. 5(a)). The model diagnoses therefore provide good qualitative confirmation that the high-county drying event was due to subsidence of very dry upper air to a level where it impacted the high-country, but not the low-lands. However, given the known atmospheric moisture biases of the LAPS model (Draper and Mills 2008) and the differences between model and actual elevation, no attempt was made to quantitatively compare the modelled mixing ratio with observed measures of atmospheric moisture at Mt Ginini.
0200–0900, 29 November 2006Another two, less extreme, high-country dewpoint-depression events can be seen in Fig. 5(a). The two events occur at approximately 0630, 29 November and 2000, 30 November. The first of these events corresponds to a maximum dewpoint-difference anomaly of ηdp = 6.4 °C, while the second event has a maximum anomaly of ηdp = 5.1 °C. As such, neither of these events qualifies as extreme, although the former does exceed the 2σdp level. This dewpoint-depression event, which spans the period 0200–0900, 29 November, also corresponds to a period of elevated high-country FFDI (Fig. 5(b)). The associated minimum FFDI-difference anomaly, which occurs at 0700, 29 November, is ηFFDI = -14.7 and so qualifies as an extreme FFDI-difference anomaly. The other anomalous dewpoint event evident in Fig. 5(a) at 2000, 30 November does not correspond to an extreme FFDI event with ηFFDI = -4.7. The only other period represented in Fig. 5(b) when high-country FFDI exceeded that in the nearby low-lands was 0000–0730, 1 December 2006. In this case, which did not qualify as an extreme FFDI-difference anomaly, the difference in FFDI was driven mainly by stronger winds in the high-country (approximately 24 km h-1 as opposed to approximately 2 km h-1 in the low-lands), rather than differences in atmospheric moisture. Figure 5(b) also emphasizes the nocturnal aspect of the extreme events. Indeed, during the daytime, at around noon on 28 and 29 November and 1 December, the FFDI at Canberra Airport is seen to be significantly higher than the FFDI at Mt Ginini, while the relationship is reversed during the night. Overnight on 28–29 November 2006 a low pressure trough/cold front was crossing southeast Australia (Fig. 8(a)). A mid-tropospheric anticyclone was over central Australia with a marked short-wave trough in the westerlies just west of Tasmania associated with the (westward-sloping) surface trough (Fig. 8(b)). A clear ascent/descent couplet in the lower troposphere is seen east/west of this short-wave trough (Fig. 8(c)). Associated with this trough system is a low-level wind maximum through Tasmania and extending over the high-country over the ACT (Fig. 8(d)). Lower tropospheric humidity is very low to the northwest and higher to the south of this low-level wind speed maximum (Fig. 8(e)), and

Sharples et al: Extreme drying events in the Australian high country and their implications for bushfire risk management 165
combined with the eastward movement of the systems this leads to a decrease in humidity extending eastwards. In addition, a layer of much drier air covers all of southeastern Australia at levels just a little higher, for example, at the 700 hPa level shown in Fig. 8(f). The reanalyses discussed above are supported by wind speed observations at Mt Ginini and Canberra Airport,
which indicate that during the high-country dewpoint-depression event, which peaked at 0630, the winds were significantly stronger at the high-country station. Wind speeds at Mt Ginini were in the 25–30 km h-1 range, while wind gust reached as high as 58 km h-1. By contrast, the wind speed at Canberra Airport ranged between 0–13 km h-1 with a maximum wind gust of only 16 km h-1.
Fig. 6. NCEP2 reanalysis charts at 2200, 29 November 2006: (a) MSL pressure (hPa); (b) mid-tropospheric (500 hPa level) geopotential height (m); (c) vertical motion (Pa s-1) at the 700 hPa level, with positive values indicating descent.
Fig. 7. Vertical cross-sections of meso-LAPS output show-ing (a) predicted mixing ratio (g kg-1) for 1800, 29 November 2006, (b) predicted mixing ratio (g kg-1) for 2300, 29 November 2006, (c) predicted mixing ratio (g kg-1) for 0300, 30 November 2006, and (d) predicted potential temperature (K) (black curves) and wind speed (knts) (red dashed curves) for 0300, 30 November 2006. The vertical axis gives altitude in pressure coordinates (hPa). The dot-ted curve represents the smoothed terrain surface. Note that the cross-section extent is shown in Fig. 9. The approximate locations of Mt Ginini and Canberra Airport are marked on each panel.
(a)
(b)
(c)
(d)
Canberra AirportMt Ginini
Canberra AirportMt Ginini
Canberra AirportMt Ginini
Canberra AirportMt Ginini

166 Australian Meteorological and Oceanographic Journal 62:3 September 2012
Meso-LAPS runs, initialised at 2200, 28 November 2006, were used to further investigate these features and the causes of the anomalous dewpoint-depression event in the high-country. The surface wind-field for 0400, 29 November 2006, as modelled by meso-LAPS, can be seen in Fig. 9. The meso-LAPS output confirms the existence of stronger winds over Mt Ginini and indicates that the stronger winds were localised over parts of the landscape for which the terrain (as
represented in meso-LAPS) was higher than about 1000 m. In terms of actual terrain, rather than the smoothed topography used in meso-LAPS, such an elevation would equate to approximately 1500 m. The localised region of higher wind speeds is circled in Fig. 9. The modelled wind speed in this region peaks in the vicinity of Mt Ginini at 15 knots (28 km h-1), which agrees well with the observed wind speed at Mt Ginini of 26 km h-1 at 0400.
Fig. 8. NCEP2 reanalysis charts: (a) MSL pressure (hPa) at 2200, 28 November 2006; (b) mid-tropospheric (500 hPa lev-el) geopotential height (m) at 2200, 28 November 2006; (c) vertical motion (Pa s-1) at the 700 hPa level at 2200, 28 November 2006, with positive values indicating descent; (d) 850 hPa level wind speed (knots) at 0400, 29 November 2006; (e) relative humidity (%) at the 850 hPa level at 0400, 29 November 2006; (f) relative humidity (%) at the 700 hPa level at 0400, 29 November 2006.

Sharples et al: Extreme drying events in the Australian high country and their implications for bushfire risk management 167
Vertical cross-sections of the simulated atmosphere can be seen in Fig. 10, with the spatial extent of the cross-section indicated by the black dotted line in Fig. 9. Figure 10(a–d) shows the modelled evolution of the mixing ratio isopleths (g kg-1) for the period 0200–0700, 29 November 2006. In Fig. 10(a–b) the model output indicates the presence of a significant moisture gradient at approximately the 750 hPa level, which confirms the reanalyses (Fig 8.), and the progression of a mass of drier air across the high-country in the vicinity of Mt Ginini. We note that according to the model, the drier air is only about 1 g kg-1 drier than the air it replaces and that such a change would not produce the drop in dewpoint observed at Mt Ginini. However, in this context it is important to again acknowledge the known issues with the LAPS model and its ability to accurately predict moisture levels (Draper and Mills 2008). Repeating the simulations with a non-hydrostatic NWP model, including an improved land surface scheme, could provide better quantitative confirmation of the observed changes in humidity at Mt Ginini. The model output indicates that the air mass is moving with a west-east component speed of approximately 50 km h-1, which is in good agreement with the observations at Mt Ginini where westerly winds, gusting at around
50 km h-1, were recorded over the same period. The meso-LAPS model diagnoses also indicate that the onset of the dewpoint-depression event would have occurred sometime between 0200 and 0300, which is generally consistent with the observations at Mt Ginini, where a steady reduction in dewpoint was recorded after 0300, followed by an abrupt drop in dewpoint between 0530 and 0630. Figure 10(c) shows that at 0500 the abrupt change in moisture with height was becoming less pronounced. By 0700 the modelled mixing ratio in Fig 10(d) indicates substantial mixing of the dry
Fig. 9. Meso-LAPS output showing predicted near-sur-face wind barb (5 knots = half feather) for 0400, 29 November 2006. The grey shading indicates the (smoothed) topography of the region. The white oval surrounds a region of high localised winds, with speeds up to 15 knots. The white star with black border marks the approximate location of Mt Ginini, while the black star with white border marks the approximate location of Canberra Airport. The black dotted line shows the spatial cross-section depicted in Figs. 7 and 10.
Fig. 10. Vertical cross-sections of meso-LAPS output show-ing predicted mixing ratio (g kg-1) for (a) 0200, 29 November 2006, (b) 0300, 29 November 2006, (c) 0500, 29 November 2006, and (d) 0700, 29 Novem-ber 2006. The vertical axis gives altitude in pressure coordinates (hPa). The dotted curve represents the smoothed terrain surface. Note that the cross-sec-tion extent is shown in Fig. 9. The approximate loca-tions of Mt Ginini and Canberra Airport are marked on each panel.
(a)
(b)
(c)
(d)
Canberra AirportMt Ginini
Canberra AirportMt Ginini
Canberra AirportMt Ginini
Canberra AirportMt Ginini
0 200 400 600 800 1000 1200 1310

168 Australian Meteorological and Oceanographic Journal 62:3 September 2012
upper air, which was formerly above the sharp moisture gradient, down to the surface near Mt Ginini. This time coincides roughly with the peak of the dewpoint-depression event when the minimum dewpoint of -5.6 °C was observed at Mt Ginini at 0630. The structure of the mixing ratio isopleths in Fig. 10 suggests that the dry air impacting the high-country originates just above the inversion at the 800 hPa level. The localised stronger winds and the distinctive vertical profile of the mixing ratio isopleths provide a strong indication that the anomalous dewpoint-depression event at Mt Ginini is due to enhanced mixing of the dry upper air down to lower levels, brought about by the enhanced interaction of a low-level wind speed maximum, the terrain and the upper levels of the atmosphere in the absence of daytime surface heating (Banta et al. 1998; Sharples 2009).
Discussion and conclusions
The southeast Australian high-country is susceptible to a number of processes that are detrimental to fire weather conditions and which do not occur in nearby low-land areas. These processes can result in fire danger conditions in the high-country that are significantly worse than corresponding conditions in the nearby low-lands. For example, on 30 November 2006, such a process resulted in a nine-fold increase in fire danger index between midnight and 0400 at Mt Ginini, reaching a level fourteen times higher than the corresponding fire danger index at Canberra Airport (assuming the same drought factor). Moreover, such processes are much more likely to occur during the early hours of the morning when fire potential is traditionally assumed to be at its lowest. This could result in an early morning enhancement of fire danger in the high-country, which might for example experience ‘high’ fire danger rating, while ‘low’ fire danger rating is expected based on low-land information. Specifically, differences in atmospheric moisture were shown to be particularly important in driving differences in fire potential. Indeed, the analyses presented above indicated a strong correspondence between anomalously low high-country dewpoint and anomalously high high-country FFDI. Over three-quarters of the extreme FFDI-difference anomalies coincided with extreme dewpoint-difference anomalies, while 85 per cent of extreme FFDI-difference anomalies corresponded to dewpoint-difference anomalies greater than twice the dewpoint-difference anomaly standard deviation. These results therefore support the hypothesis that instances of comparatively high fire danger in the high-country are driven in large part by differences in atmospheric moisture. However, we also note the role of wind speed in driving the elevated fire danger index values in the high-country in some instances, for example the event that occurred in the early morning of 29 November 2006. Fire danger indices are sensitive to changes in both wind speed and humidity and processes that cause large changes in both can have
a significant effect on fire danger levels (Matthews 2008; Dowdy et al. 2010; Bedia et al. 2012). Observational analyses indicated a strong preference for anomalously low dewpoint temperatures and anomalously high fire danger in the high-country during the early morning, with around half occurring between 0430 and 0900; that is just before and just after sunrise. This finding has obvious implications for firefighting operations at night. Traditional firefighting wisdom assumes that the cooler temperatures, higher relative humidity and calmer conditions typically encountered at night provide an opportunity for successfully employing various bushfire-suppression tactics such as back-burning. While this may be sound advice when ALR arguments can be applied with validity over a landscape, the above analyses have shown that basing judgments on such assumptions could produce grossly misleading information when working on bushfires in the high-country. As such the results highlight the need for careful monitoring of weather conditions and for maintaining a good dialogue between firefighters and weather service providers during night-time fire operations in the high-country. In this context it is interesting to note that the automatic weather station at Mt Ginini was only installed after the 2003 Canberra fires. On 18 January 2003 when the fires intensified, burnt out of the high-country and impacted Canberra, detailed high-country fire weather observations were not available. The results presented above also have strong implications for campaign fires that burn for several weeks. The analyses based on the Canberra–Mt Ginini station pairing revealed that anomalously low high-country dewpoint temperatures could be expected on about one day in ten, and that fire danger anomalies could be expected on about one day in eleven, with a high degree of coincidence. Based on these statistics it is highly likely that such an anomalous event will be encountered during the course of a campaign fire burning in the high-country. However, it is important to note that the data only spans about one and a half years and so taking these frequencies as indicative of climatology may be premature. Further investigation into climatological frequencies, through analysis of larger data sets, will be pursued in future work. The case studies using meso-LAPS identified the role that subsidence inversions and nocturnal low-level wind maxima can have on dewpoint temperatures in the high-country. Subsidence inversions can affect broad areas of southeast Australia resulting in anomalously low dewpoint temperatures over much of the Australian Alps—essentially any part of the landscape sufficiently elevated to protrude above the inversion will be affected. On the other hand, the effects of low-level wind maxima and their interaction with topography can produce much more localised (in both space and time) maxima in fire danger rating across the high-country. Moreover, the influence that low-level wind maxima have on increasing fire danger levels through exacerbating surface drying is compounded by the associated high wind speeds.

Sharples et al: Extreme drying events in the Australian high country and their implications for bushfire risk management 169
Based on the meso-LAPS model diagnoses and the results of other studies by the authors (as yet unpublished) it is possible to suggest a rough figure of approximately 1500 m as the elevation above which such extreme drying processes can be expected to occur. Such a threshold elevation could be used for rough guidance in planning fire operations, but it should be stressed that the value of 1500 m requires further investigation as the exact elevation above which the effects of such processes will apply will be affected by the specific features of an event. Indeed, it is possible that this figure could be revised downwards as research progresses. Further investigation into extreme drying events in the high-country will extend the present work to consider additional station pairings, including a number from in and around the Victorian Alps. In addition to these broader-scale studies, the work will be extended using dense networks of portable automatic weather stations (PAWS). The authors have already completed a survey of finer-scale fire weather using a network of eight PAWS centered around Mt Ginini, that cover a range of elevations and different terrain elements. Analysis of these data is currently in progress.
Acknowledgments
This work was conducted as part of the Bushfire Cooperative Research Centre’s HighFire Risk Project (www.highfirerisk.com). The support of the Bushfire CRC is gratefully acknowledged. J. Sharples is grateful to the Centre for Australian Climate and Weather Research for hosting him during the initial stages of this work. We are also grateful to the two anonymous reviewers whose comments resulted in significant improvements to the manuscript.
ReferencesBanta, R.M., Senff, C.J., White, A.B., Trainer, M., McNider, R.T., Valente,
R.J., Mayor, S.D., Alvarez, R.J., Hardesty, R.M. and Parish, D.D. 1998. Daytime buildup and night-time transport of urban ozone in the boundary layer during a stagnation episode. J. Geophys. Res., 103, 22519–44. doi:10.1029/98JD01020.
Banta, R.M., Newsom, R.K., Lundquist, J.K., Pichugina, Y.L., Coul-ter, R.L. and Mahrt, L. 2002. Nocturnal low-level jet characteris-tics over Kansas during CASES-99. Bound. Lay. Met., 105, 221–52. doi:10.1023/A:1019992330866.
Bedia, J., Herrera, J., Gutiérrez, J.M., Zalava, G., Urbieta, I.R. and More-no, J.M. 2012. Sensitivity of Fire Weather Index to different reanalysis products in the Iberian Peninsula. Natural Hazards and Earth System Sciences, 12, 699–708. doi:10.5194/nhess-12-699-2012.
Blumen,W. 1990. Atmospheric processes over complex terrain. American Meteorological Society, Boston, MA. 323 pp.
Bond, H.G., Mackinnon, K. and Noar, P.F. 1967. Report on the meteorologi-cal aspects of the catastrophic bushfires in southeastern Tasmania on 7 February 1967. Bureau of Meteorology, 54 pp.
Brotak, E.A. and Reifsnyder, W.E. 1977. An investigation of the synoptic situations associated with major wildland fires. J. Appl. Meteorol., 16, 867–70.
Chandler, C., Cheney, P., Thomas, P., Trabaud, L. and Williams, D. 1983. Forest Fire Behaviour and Effects. Vol. 1, Fire in Forestry, John Wiley and Sons, 450 pp.
Cheney, P., Gould, J. and McCaw, L. 2001. The dead-man zone: a neglect-ed area of fire fighter safety. Aust. For., 64, 45–50.
Dowdy, A.J., Mills, G.A., Finkele, K. and de Groot, W. 2010. Index sensitiv-ity analysis applied to the Canadian Forest Fire Weather Index and the McArthur Forest Fire Danger Index. Meteorological Applications, 17, 298–312. doi: 10.1002/met.170.
Draper, C. and Mills, G.A. 2008. The Atmospheric Water Balance over the Semiarid Murray–Darling River Basin. J. Hydrometeor., 9, 521–34. doi: http://dx.doi.org/10.1175/2007JHM889.1.
Engel, C. and Ebert, E. 2007. Performance of hourly operational consen-sus forecasts (OCFs) in the Australian region. Weath. Forecasting, 22, 1345–59.
Gorski, C.J. and Farnsworth, A. 2000. Fire weather and smoke manage-ment. In: C.D. Whiteman, Mountain Meteorology Fundamentals and Applications. Oxford University Press, New York.
Griffiths, D. 1999. Improved formula for the drought factor in McArthur’s Forest Fire Danger Meter. Aust. For., 62, 202–6.
Kalnay, E., Kanamitsu, M., Kistler, R., Collins, W., Deaven, D., Gandin, L., Iredell, M., Saha, S., White, G., Woolen, J., Zhu, Y., Chelliah, M., Ebisu-zaki, W., Higgins, W., Janowiak, J., Mo, K.C., Ropelewski, C., Wang, J., Leetmaa, A., Reynolds, R., Jenne, R. and Joseph, D. 1996. The NCEP/NCAR 40-year reanalysis project. Bull. Am. Meteorol. Soc., 77, 437–71.
Kossmann, M., Sturman, A. and Zawar-Reza, P. 2001. Atmospheric influ-ences on bushfire propagation and smoke dispersion over complex terrain. In: G. Pearce, L. Lester (eds) Proceedings of the Australasian Bushfire Conference, 3–6 July 2001, Christchurch, New Zealand. New Zealand Forest Research Institute, Rotorua.
Matthews, S. 2008. A comparison of fire danger rating systems for use in forests. Aust. Met. and Oceanogr. J., 58, 41–48.
McArthur, A.G. 1967. Fire behaviour in eucalypt forests. Department of National Development, Forestry and Timber Bureau Leaflet No. 107. Canberra, Australia.
Mills, G. A. 2002. A case of coastal interaction with a cool change. Aust. Meteorol. Mag., 51, 203–21.
Mills, G. A. 2005. A re-examination of the synoptic and mesoscale meteo-rology of Ash Wednesday 1983. Aust. Meteorol. Mag., 54, 35–55.
Mills, G. A. 2007. On easterly changes over elevated terrain in Australia’s southeast. Aust. Meteorol. Mag., 56, 177–90.
Mills, G. A. and Pendlebury, S. 2003. Processes leading to a severe winds-hear incident at Hobart Airport. Aust. Meteorol. Mag., 52, 171–88.
Nairn, G. 2003. A Nation Charred: Inquiry into the Recent Australian Bush-fires. The Parliament of the Commonwealth of Australia, Canberra.
Noble, I. R., Bary, G.A.V. and Gill, A.M. 1980. McArthur’s fire-danger me-ters expressed as equations. Aust. J. Ecol., 5, 201–3.
Puri, K., Dietachmayer, G.D., Mills, G.A., N. E. Davidson, N.E., Bowen, R.A. and Logan, L.W. 1998. The new BMRC Limited Area Prediction System, LAPS. Aust. Meteorol. Mag., 47, 203–23.
Sharples, J.J. 2009. Review of mountain meteorological effects relevant to fire behaviour and bushfire risk. Int. J. Wildland Fire, 18, 737–54.
Sharples, J.J., McRae, R.H.D., Weber, R.O. and Gill, A.M. 2009. A simple index for fire danger rating. Environmental Modelling and Software, 24, 764–74.
Sharples, J.J., Mills, G.A., McRae, R.H.D. and Weber, R.O. 2010. Foehn-like winds and elevated fire danger conditions in southeast Australia. J. Appl. Meteor. Climatol., 49, 1067–95.
Smith, R. 2007. Report of the Key Issues Identified from Operational Re-views of Major Fires in Victoria 2006/07. Melbourne: Department of Sustainability and Environment.
Taylor, J. and Webb, R. 2005. Meteorological aspects of the January 2003 south-eastern Australian bushfire outbreak. Aust. For., 68, 94–103.
Teague, B., McLeod, R. and Pascoe, S. 2010. 2009 Victorian Bushfires Royal Commission Final Report, State of Victoria, Melbourne, Victoria.

170 Australian Meteorological and Oceanographic Journal 62:3 September 2012