extraction of macular disease area using regional ... technique for human retinal optical ......
TRANSCRIPT

Applied Mathematical Sciences, Vol. 9, 2015, no. 129, 6437 - 6448
HIKARI Ltd, www.m-hikari.com
http://dx.doi.org/10.12988/ams.2015.53291
Extraction of Macular Disease Area Using Regional
Statistics Technique for Human Retinal Optical
Coherence Tomography (OCT) Image
Mohd Fadzil Abdul Kadir1*, Abd Rasid Mamat1, Azrul Amri Jamal1,
Shinji Tsuruoka2, Haruhiko Takase3, Hirobaru Kawanaka3,
Fumio Okuyama4 and Hisashi Matsubara5
1Faculty of Informatics and Computing, University Sultan Zainal Abidin, 22000
Tembila, Besut, Terengganu, Malaysia
*Corresponding author
2Graduate School of Regional Innovation Studies
Mie University, Tsu, Mie, Japan
3Graduate School of Engineering, Mie University, Tsu, Mie, Japan
4Faculty of Medical Engineering, Suzuka University of Medical Science
Suzuka Mie, Japan
5Graduate School of Medicine, Mie University, Tsu, Mie, Japan
Copyright © 2015 Mohd Fadzil Abdul Kadir et al. This article is distributed under the Creative
Commons Attribution License, which permits unrestricted use, distribution, and reproduction in any
medium, provided the original work is properly cited.
Abstract
Optical Coherence Tomography (OCT) has emerged as a new technology that enables
high-resolution cross-sectional images of the retina for identifying, and quantitatively
assessing of the retina disease. Quantitative information of retina is needed for tracking
progression of ocular disease and evaluatesthe efficacy of treatment. In this paper, we
propose a new border tracking procedure using regional statistics (BTPRS) to extract an
abnormal area that specified by medical doctor. This procedure uses a combination of
regional statistics and border tracking method. The objectives of this research are to extract

6438 Mohd Fadzil Abdul Kadir et al.
the abnormal area in human retina from optical coherence tomography images and to
improve the extraction percentage.This research uses 128 pieces of 2 dimensional OCT
retinal image of one drusenpatient, and 128 pieces of 2dimensional OCT retinal image
of a diabetic macular edema (DME) patient. The part of the diseases are specified by a
medical doctor. Results show that the regional statistic border tracking method provided
the highest extraction of rate percentage and can extract the abnormal area in
bothconditions, white and black. In this paper, we will focus on the abnormal area at
macular part.This research will provide more useful information to medical doctor and
patient for informed consent. We hope that thisprocedure willbe added in the
commercial OCT unit to evaluate the degree of disease and response to the treatment.
Keywords: Optical Coherence Tomography·Image Scanning ·Border Tracking
·Regional Statistics
1. Introduction
Optical coherence tomography (OCT) is an imaging technology performed non-
invasivehigh resolution cross-sectional images of transparent and translucent structures
[1]. OCT imaging is similar to ultrasound imaging except it uses light instead of sound.
In ophthalmology OCT canprovide the structure imaging of retinal morphology at an
intraretinal level. The quantitative information of retinal thickness can be obtained in
order to assessing retinal diseases. The precise visualization of retinal structure
morphology is the most critical in diagnosis retinal diseases.Therefore the needs of
retinal imaging using OCT devices have been growing [2].
Fig. 1: Example of OCT retina image
Measurement the retinal structure layers and thickness performed by directing the light
beam from optical source onto the retina. The back reflected light produced by the
accident with the retinal layers contained interference beams. The OCT images
generated by scanning reflected beams, producing two-dimensional data set of gray
scale images (Fig. 1) [2, 3]. Fig.2 shows the example of normal and abnormal retina
OCT image. The generated abnormal area in the OCT images can be displayed in two
different colours; white (Fig. 3(a)) or black (Fig. 3(b)) in color.

Extraction of macular disease area using regional statistics technique 6439
(a) (b)
Fig. 2: (a) Example of normal retina. (b) Example of abnormal retina.
Fig. 3: White and black abnormal areas.
Retinal nerve fiber layer thickness is important in early diagnosis of retinal disease.
Quantitative information between inner limiting membrane (ILM) and retinal pigment
epithelium (RPG), retinal layer structure and abnormal area in the retina can be used to
access the retinal disease and monitoring the treatments process [4, 5]. Yagi et al. [6]
proposed a method of extraction ILM and RPG using conventional morphological
technique. However, the proposed method still cannot extracts the layer lines when the
original or input OCT images having some disappearance points. To improve Yagi`s
method, Yamakawa et al [7] used one directional activenet (ODAN) to extract the
layers. The correction rate of extraction increased (Fig. 4) to 98.7% for normal retinal
image and 91.0% for abnormal. Kodama et al [8] proposed extraction method using
statistical technique to measure the number of layer boundaries in retina in order to eva-
(a) abnormal area displayed
in white colour.
(b) abnormal area displayed
in black colour.

6440 Mohd Fadzil Abdul Kadir et al.
luate the size of retinal disease in horizontal direction. All of these methods have some
problems are i) cannot extract the abnormal area in the image that contained retinal
layer damages, ii) only can detect the black pixels in gray scale OCT images and iii)
cannot specify the abnormal area by a medical doctor.
Fig. 4: Extracted borders by Yamakawa`s method
Image scanning and border tracking method [9] proposed to fulfill the medical doctors’
need that they can select the abnormal area by themselves, but cannot extract the
abnormal area properly when the OCT image contained retinal layer damage. Regional
statistics scanning method (from here on referred to as: our previous procedure) [10]
was proposed to improve image scanning and border tacking method has a problem that
cannot extract precisely at the small part in abnormal area.
Traditional extraction methods evaluate the retinal disease and treatment effectiveness
by measure the thickness of retinal layer. In this paper we proposed a new border
tracking procedure using regional statistics (BTPRS) that only extract the abnormal area
in the retinal images. These methods will give more precise results and can reduce the
processing time.
2. Border Tracking Procedure Using Regional Statistics (BTPRS)
Our previous method (see Fig. 5(a)) starts with median filter image smoothing,
followed initial pixel selection, and finally the area extraction. In border tracking
procedure (see Fig. 5(b)), starts with initial pixel selection, followed by two threshold
binarization and finally the border extraction.
In this paper, the sample of 128 pieces of 2-dimensional OCT image about one retina of
a drusen patient and 128 pieces of 2-dimensional OCT image about one retina of a
DME patient are digitalized to a pixel size of 6μm x 6μm, 16-bit gray scale with
resolution 512 x 480 pixels.

Extraction of macular disease area using regional statistics technique 6441
(a)Previous method (b) Border tracking method.
Fig. 5: Previous and Border tracking method comparision
2.1. Selection of Initial Pixel and Initial Region
The initial position of pixel (i) (see Fig.6(a) and Fig.6(b)) will select by a medical
doctor in the abnormal area in OCT retina image using the computer mouse on the
monitor display.
(a) (b) (c)
Fig. 6: (a) The pointed initial pixel, (b) Pointed initial pixel surrounded by initial
region, (c) Binary image

6442 Mohd Fadzil Abdul Kadir et al.
An initial region is defined as 25 pixels (5 × 5 pixels) surrounding the selected initial
pixel, i. The mean μand standard deviation σof gray level of pixels in the initial region
will be calculated, and stored in program memory.
2.2. Binarization Using Two Thresholds
The calculated values of mean and standard deviation are used to generate two threshold
formulas. The system will calculate mean 𝜇𝑥 and standard deviation 𝜎𝑥 of all regionsand
determines that every pixelisbelonging to the abnormal area or not using equation (1).
(μ – aσ) <𝜇𝑥< (μ + aσ) (1)
where a is the constant
If the calculated values of mean and standard deviation are in the range, the gray level
values of the center pixel of that region will changes to 255 or white in color. If the
calculated values of mean and standard deviation are out of the stated range, the gray
level value of the center pixel of that regionwill changes to 0 or black in color. The
system will scan all regions from top to bottom of the image and changes the raw gray
scale image to binary image. (see Fig. 6(c)).
2.3. Boundary Extraction
From the initial pixel i, the scanning process to detect the abnormal area is started, and
the position of the next pixel is determined by moving the initial pixel to (i + 1) to the
top of the image. The pixel will move one by one until finds the different color of pixel;
from white to black. The border following process will used four points of contact
algorithm to extract the abnormal area (see Fig. 7).
(a) Border tracking image (b) Enlarge of border tracking
image
Fig. 7: Border tracking image from the proposed method

Extraction of macular disease area using regional statistics technique 6443
3. Results and Discussions
We determined four values for a that stated in the benchmark formula. The values are
0.5, 1.0, 1.5, and 2.0. In this experiment, only 35 pieces of image from drusen sample
and 36 pieces of image from DME sample that contained the abnormal area at the
macular part were used to extract border line. Below are the sample of binary and
border tracking image from experiment results.
Fig. 8 (a-1 to a-3) and (b-1 to b-3) show the results using proposed BTPRS to the OCT
images that contained abnormal area in white colour.
(a-1) Original image (a-2) Binary image (a-3) Border tracking
image
(b-1) Original image (b-2) Binary image (b-3) Border tracking
image
Fig. 8: Experiment results for abnormal area in white colour.
Fig. 9 (a-1 to a-3) and (b-1 to b-3) below show the results using proposed BTPRS to
the OCT images that contained abnormal area in black colour.

6444 Mohd Fadzil Abdul Kadir et al.
(a-1) Original image (a-2) Binary image (a-3) Border tracking
Image
(b-1) Original image (b-2) Binary image (b-3) Border tracking
image
Fig. 9: Experiment results for abnormal area in black colour.
Table 1 shows that the extracted abnormal area from drusen OCT image samples got
the highest rate of successful when we set the a value at 1.0.
Table 1. Extraction results from drusen OCT images
Table 2 shows that the extracted abnormal area from DME OCT image samples got the
highest rate of successful when we set the a value at 1.5.
a
(value)
Extracted Failed Successful Rate
(%)
0.5 22 13 62.9
1.0 26 9 74.3
1.5 25 10 71.4
2.0 23 12 65.7
Extraction of macular disease area using regional statistics technique 6445
Table 2. Extraction results from DME OCT images
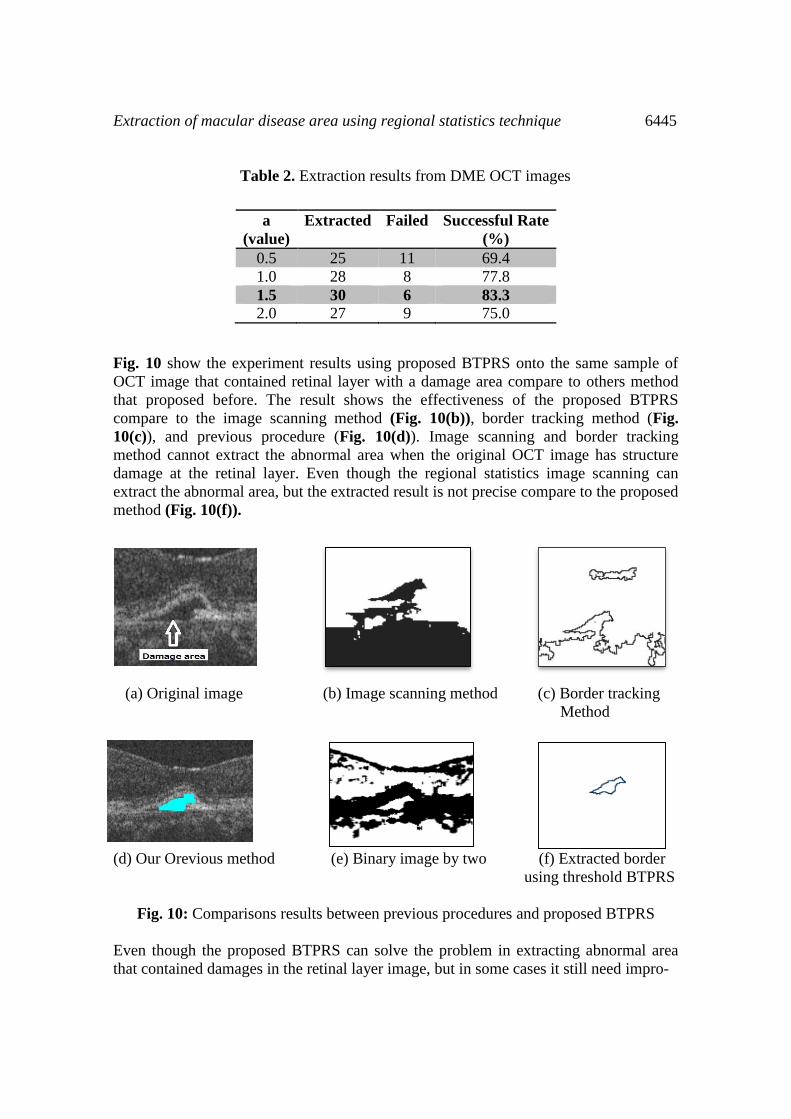
Fig. 10 show the experiment results using proposed BTPRS onto the same sample of
OCT image that contained retinal layer with a damage area compare to others method
that proposed before. The result shows the effectiveness of the proposed BTPRS
compare to the image scanning method (Fig. 10(b)), border tracking method (Fig.
10(c)), and previous procedure (Fig. 10(d)). Image scanning and border tracking
method cannot extract the abnormal area when the original OCT image has structure
damage at the retinal layer. Even though the regional statistics image scanning can
extract the abnormal area, but the extracted result is not precise compare to the proposed
method (Fig. 10(f)).
(a) Original image (b) Image scanning method (c) Border tracking
Method
(d) Our Orevious method (e) Binary image by two (f) Extracted border
using threshold BTPRS
Fig. 10: Comparisons results between previous procedures and proposed BTPRS
Even though the proposed BTPRS can solve the problem in extracting abnormal area
that contained damages in the retinal layer image, but in some cases it still need impro-
a
(value)
Extracted Failed Successful Rate
(%)
0.5 25 11 69.4
1.0 28 8 77.8
1.5 30 6 83.3
2.0 27 9 75.0

6446 Mohd Fadzil Abdul Kadir et al.
vements to provide more higher extraction rate. Fig. 11 and Fig. 12 show the failure
example of extraction images from two different conditions of abnormal area.
(a) Original image (b) Binary image (c) Border tracking image
Fig. 11: Example of failure extraction for abnormal area in white colour.
Fig. 11(a) to Fig. 11(c) show the proposed BTPRS cannot extract half of the abnormal
area (in the red circle) when the abnormal area separated into two. The proposed
method also cannot extract the abnormal area when the original image contained bigger
damage in the retinal layer (Fig. 12(a) to Fig 12(b)).
(a) Original image (b) Binary image (c) Border tracking image
Fig. 12.Example of failure extraction for abnormal area in black colour.
4. Conclusion and Future Works
This paper presented a new border tracking procedure using regional statistics (BTPRS)
to extract the abnormal area from the human retina optical coherence tomography
image. We have done four different methods to extract the abnormal area. The first is
image scanning method. Then we tried using image border tracking method. Both of
these method have a same problem that is, the system cannot extract the abnormal area
that contained the damage retinal layer in the OCT image. To resolve that problem, we
proposed the extraction method using regional statistics scanning image; previous
procedure. To improve the result, we proposed the BTPRS by combined the regional
statistics and border tracking methods.

Extraction of macular disease area using regional statistics technique 6447
From all experimental results, the proposed BTPRS provides the betteralternative to
extract the abnormal area from human retinal optical coherence tomography images.
This method also can extract the abnormal area from the OCT image in both colours,
white or black. It also can detect the abnormal part that only specified by a medical
doctor.
For the future enhancement experiment to get more precise result, we are thinking to
combine the mean and standard deviation values of every region to compare with the
benchmark. We hope this research will help the task of clinical doctors, and the system
would specify the degree of retina disease accurately.
Acknowlwdgements. We are grateful to Universiti Sultan Zainal Abidin (UniSZA),
Malaysia for supporting this research and to Suzuka University of Medical Science,
Japan for providing the expertise.
References
[1] C. K. Hitzenberger, P. Trost, P. W. Lo, Q. Zhou, Three-dimensional Imaging of the
Human Retina by High-speed Optical Coherence Tomography, Optics Express, 11
(2003), no. 21, 2753-2761. http://dx.doi.org/10.1364/oe.11.002753
[2] D. Huang, E. A. Swanson, C. P. Lin, J. S. Schuman, W. G. Stinson, W. Chang, M.
R. Hee, T. Flotte, K. Gregory, C. A. Puliafito, J. G. Fujimoto, Optical Coherence
Tomoghraphy, Science, 254 (1991), 1178-1181.
[3] J. G. Fujimoto, C. Pitris, S. A. Boppart, M. E. Brezinski, Optical Coherence
Tomography: An Emerging Technology for Biomedical Imaging and Optical Biopsy,
Neoplasia, 2 (2000), no. 1-2, 9-25. http://dx.doi.org/10.1038/sj.neo.7900071
[4] H. K. Tony, J. G. Fujimoto, J. S. Schuman, L. A. Paunescu, A. M. Kowalevicz, I.
Hartl, W. Drexler, G. Wallstein, H. Ishikawa, J. S. Duker, Comparision of Ultrahigh
and Standard Resolution Optical Coherence Tomography for Imaging Macular
Pathology, Ophthalmology, 112 (2005), no. 11, 1922-1935.
http://dx.doi.org/10.1016/j.ophtha.2005.05.027
[5] W. Drexler, U. Morgner, R. K. Ghanta, F. X. Kartner, J. S. Schuman, J. G.
Fujimoto, Ultrahigh-resolution Ophthalmic Optical Coherence Tomography, Nature
Medicine, 7 (2005), no. 4, 502-507.
[6] T. Yagi, F. Okuyama, H. Kawanaka, S. Tsuruoka, A Study on Extraction Method of
Internal Limiting Membrane and Retinal Pigment Epithelium from OCT Images,
Proceeding of Joint 4th Interna tional Conference on Soft Computing and Intelligent
Systems and 9th International Symposium on Advanced Intelligent Systems (SCIS &
ISIS 2008), 2008-2013.

6448 Mohd Fadzil Abdul Kadir et al.
[7] A. Yamakawa, D. Kodama, S. Tsuruoka, H. Kawanaka, H. Takase, M. F. A. Kadir,
H. Matsubara, F. Okuyama, Extraction Method of Retinal Border Lines in Optical
Coherence Tomography Image by Using Dynamic Contour Model, World Congress
Biomechanics 2010, International Federation for Medical and Biological Engineering
IFMBE Proceedings, 31 (2010), 1558-1561.
http://dx.doi.org/10.1007/978-3-642-14515-5_397
[8] D. Kodama, A. Yamakawa, S. Tsuruoka, H. Kawanaka, H. Takase, M. F. A. Kadir,
H. Matsubara, F. Okuyama, A Retinal Layer Structure Analysis to Measure the Size of
Diesease Using Layer Boundaries Detection for Optical Coherence Tomography
Images, World Congress Biomechanics 2010, International Federation for Medical and
Biological Engineering IFMBE Proceedings, 31 (2010), 1554-1557.
http://dx.doi.org/10.1007/978-3-642-14515-5_396
[9] M. F. A. Kadir, A. Yamakawa, D. Kodama, S. Tsuruoka, H. Kawanaka, H. Takase,
Y. Uji, H. Matsubara, F. Okuyama, Extraction Method of Abnormal Parts in Retinal
Layers from Optical Coherence Tomography Image, Proceedings of the 2nd
International Workshop on Regional Innovation Studies (IWRIS2010), 83-86.
[10] M. F. A. Kadir, S. Tsuruoka, H. Takase, H. Kawanaka, F. Okuyama, Y. Uji, H.
Matsubara, H. Yagami, Extraction of Macular Disease Area Using Ragional Statistics
for Optical Coherence Tomography (OCT) Image, Proceedings of the 3rd International
Workshop on Regional Innovation Studies (IWRIS2011), (2011), 57-60.
Received: April 15, 2015; Published: November 2, 2015