extraction of dna staining dyes from dna using hydrophobic ... · extraction of dna staining dyes...
TRANSCRIPT

S1
Electronic Supplementary Information
Extraction of DNA staining dyes from DNA using hydrophobic ionic liquids
Imran Khimji, Krystina Doan, Kiara Bruggeman, Po-Jung Jimmy Huang, Puja Vajha, and Juewen Liu*
Department of Chemistry, Waterloo Institute for Nanotechnology, University of Waterloo, Waterloo,
Ontario, N2L 3G1, Canada. Fax: 519 7460435; Tel: 519 8884567 Ext. 38919;
E-mail: [email protected] 1. Materials and Methods. Chemicals. All of the ionic liquid (IL) samples used in this work were purchased from Ionic Liquids Technologies (Tuscaloosa, AL). The DNA oligonucleotide samples were purchased from Integrated DNA Technologies (Coralville, IA) and were purified by standard desalting or by HPLC (for Cy3, Alexa Fluo 488 and Iowa Black FQ labeled DNAs). The sequences and modifications of the DNA samples are in Table S1. Salmon testes DNA of low molecular weight (catalog number 31149) and high molecular weight (catalog number D1626) were from Sigma-Aldrich. SYBR Green 1 (SG), PicoGreen, and SYTO-13 were from Life Technologies Inc. Thiazole orange (TO), fluorescein, bromophenol blue, malachite green, and ethidium bromide and were from Sigma-Aldrich. Chloroform, ethylacetate, hexane, and toluene were from VWR. PCR related reagents were from Bio-Rad. All the salts and buffers are from Mandel Scientific (Guelph, Canada). Milli-Q water was used for all experiments. Table S1. DNA oligomer sequences used in this work.
DNA name Sequence and modifications (from 5 to 3) 24-mer ACGCATCTGTGAAGAGAACCTGGG FAM-24-mer FAM-ACGCATCTGTGAAGAGAACCTGGG cDNA CCCAGGTTCTCTTCACAGATGCGT Cy3-DNA Cy3– TTGGTGGTGGTGGTTGTGGTGGTGGTGG FAM-A15 FAM-AAAAAAAAAAAAAAA FAM-T15 FAM-TTTTTTTTTTTTTTT FAM-C15 FAM-CCCCCCCCCCCCCCC FAM-G15 FAM-GGGGGGGGGGGGGGG Alexa-DNA TCACAGATGCGT-Alexa Fluo 488 Quencher-DNA Iowa Black FQ-ACGCATCTGTGA Primer 1 CGTTAAGACCTCTATGAATGAATGTA Primer 2 GAAAGGTAAGTACAGGGAAAGG PCR Template GAAAGGTAAGTACAGGGAAAGGACCTTCCTCCGCAATACTCCCCC
AGGTTCTCTTACATTCATTCATAGAGGTCTTAACG
Electronic Supplementary Material (ESI) for Chemical CommunicationsThis journal is © The Royal Society of Chemistry 2013

S2
Partition of DNA staining dyes. The stock solutions of SG, SYTO-13 and TO (~500 M) were prepared in DMSO and subsequent dilutions were made in water. In general, the final concentrations of SG (5 M), EB (10 M), SYTO-13 (5 M), Pico-Green (1 M), and TO (10 M) were used for visual observation. The volume ratio of the aqueous phase (containing DNA/dye) and IL was 1:1. The mixture was then vortexed/sonicated to fully mix both phases, forming a milky emulsion-like suspension. To facilitate phase separation, the samples were then centrifuged (7000 rpm for 6 min) and phase separation was observed. To test the partition of SG, to 100 L FAM-24-mer (1 M) in buffer A (50 mM NaCl, 20 mM HEPES, pH 7.6), 1 L of SG (500 M in DMSO) was added. The sample was split into two tubes; to one tube 50 L of [Bmim][PF6] was added. After mixing and centrifugation, the samples were observed under a handheld UV lamp in a dark room and imaged using a digital camera (Power Shot SD 1000, Canon). The ILs were in the bottom phase since they are heavier than water. To test the effect of using ds-DNA, in the starting DNA solution, 1 M cDNA was also included. To test whether there was still DNA in the aqueous phase, 0.5 L SG (500 M) was gently added to the upper layer. A similar process was used for the Cy3-DNA but the DNA sample was split into three tubes, each containing 50 L of DNA (1 M). One tube was used for reference. The remaining two tubes were added with a final of 5 M SG. One of the SG stained sample was added with 50 L of [Bmim][PF6]. Dye extraction using molecular solvents were performed in a similar way using 50 L of the solvents and 50 L of the aqueous solution containing SG and the ds-DNA. The molecular solvents are partitioned in the top phase since their densities are smaller than that for water. Partition of FAM-labeled DNA. FAM-labeled DNA homopolymers (15-mer) were used to quantitatively study the partition between DNA and IL. A solution was prepared by adding DNA to water for a final concentration of 0.5 µM DNA. 300 µL of the aqueous DNA samples were used for each run and 150 µL IL was added. The samples were then sonicated and centrifuged as described above. The upper aqueous phase was then removed for fluorescence measurement, which indicates the amount of DNA remained in the aqueous phase. To ensure a consistent pH, the aqueous phase samples were diluted by a factor of 20 in 100 mM HEPES (pH 7.6) and measured using a fluorescence plate reader (SpectraMax M3, excitation: 490 nm, emission: 525 nm). All experiments were performed in triplicate. Back extraction. For back extraction, the IL phase was also collected and mixed in a 1:1 ratio with either water or the back extraction buffer (phosphate-citrate, pH=4.0) in a new tube. These samples were again sonicated for approximately 30 minutes to achieve mixing. Following centrifugation, the aqueous phase was again collected to measure fluorescence as described above. DNA melting curves. The Alexa-DNA and Quencher-DNA were first hybridized in buffer (5 M fluorophore-labeled DNA, 6 M quencher labeled DNA, 200 mM HEPES, pH 7.6). 2 L of this DNA solution was added to 48 L water or the aqueous phase containing saturated [Bmim][PF6] IL. The final DNA concentration was 200 nM and HEPES was 10 mM. 20 L of the sample was transferred into a PCR plate and the plate was sealed. The melting curves were collected using a real time PCR thermocycler (CFX96, Bio-Rad) using heated lid at 103 C. The temperature was increased from 4 to 80 C with 1 C increment. The fluorescence in the FAM channel was read at each temperature after a holding time of 20 sec. Similar procedures were used to measure the DNA melting temperatures in NaCl and in [Bmim][BF4].
Electronic Supplementary Material (ESI) for Chemical CommunicationsThis journal is © The Royal Society of Chemistry 2013

S3
2. ADDITIONAL RESULTS AND DISCUSSION Extraction of other dyes. In the main paper we reported that a few cationic DNA staining dyes were extracted into the IL phase. To gain a more complete understanding, we further tested a few more dyes. Malachite green (MG) is also a cationic dye that is usually non-fluorescent. MG was fully extract into the [Bmim][PF6] IL phase. The results of the extraction test and MG structure are shown in Figure S1A. For bromophenol blue, extraction to the IL phase was also observed. The extracted dye undergoes a color change from blue (in neutral aqueous conditions) to yellow in the IL (Figure S1B). This is the same color transition observed when bromophenol blue was dispersed in an acidic solution. The blue form of bromophenol blue is anionic, while the yellow form is expressed in a neutral molecule. The observed color change suggests that the cation of the IL might donate a proton to bromophenol blue. Fluorescein is negatively charged at neutral pH. Fluorescein was also fully extracted into the IL phase, as well as a color change from yellow to colorless and the loss of fluorescence. The loss of color and fluorescence of fluorescein might also be related to its protonation, since fluorescein is a well-known pH-sensitive dye. Based on the extraction of cationic DNA staining dyes and the additional dyes in Figure S1, it seems that anionic species tend to be avoided by this IL. This can be achieved by either donating protons as in the case of fluorescein and bromophenol blue, or in the case of DNA, the extraction was inhibited. On the other hand, all the cationic dyes are extracted with high efficiency. In all the experiments, the dye concentration was diluted so that the main absorption peak has an absorbance of ~2.0.
Figure S1. Extraction of a few more dyes by [Bmim][PF6]. In each photograph, the left tube contains 50% of the IL while the right tube contains only the aqueous phase. The structures of the dye molecules are also presented. Extraction of deoxyadenosine. To further test extraction of DNA-related small molecules, we measured the extraction of deoxyadenosine. Since deoxyadenosine has not color or fluorescence, UV-vis spectroscopy was used. We first mixed deoxyadenosine with bromophenol blue and its absorption spectrum is shown in Figure S2 (gray line), where the absorption of both species can be observed. After
Electronic Supplementary Material (ESI) for Chemical CommunicationsThis journal is © The Royal Society of Chemistry 2013

S4
adding the IL and extraction, the absorption spectrum in the aqueous phase is shown in green, where the visible region is flat suggesting the extraction of bromophenol blue. However, the absorption at 260 nm remained roughly the same, indicating that deoxyadenosine was not extracted by the IL.
Figure S2. Extraction of deoxyadenosine and bromophenol blue mixture by [Bmim][PF6] measured by UV-vis spectroscopy. Extraction of low molecular weight salmon testes DNA monitored by fluorescence spectroscopy. When we were carrying out our dye extraction experiments, we noticed that oligonucleotides were not extracted by the ILs but stayed in the aqueous phase. This is inconsistent with the literature report that DNA can be extracted by the ILs.[1] One difference between our work and the literature report is that we used short ss- and ds-DNA instead of long ds-DNA. To fully understand it, long ds-DNA solutions were prepared in water and in citrate-phosphate buffer (pH 4) at varying concentrations and tested using the fluorescence method of ethidium bromide staining.[1] We used two types of ds-DNA from salmon testes; low and high molecular weights. First the low molecular weight DNA was tested. Aqueous ds-DNA (500 μL) was mixed with the [Bmim][PF6] IL (200 μL). The sonication and centrifugation method described above was used. For fluorescence-based assay, the aqueous phase was removed and mixed in a 1:1 ratio with ethidium bromide (EB) (5 ng/μL). The amount of DNA present was then determined by fluorescence measurements (excitation at 525 nm and fluorescence at 600 nm). The results are shown in Figure S3. It appears that when dispersed in water, the fluorescence intensity was decreased after the extraction step (compare red and blue dots in Figure S3), which may suggest extraction of DNA into the IL phase as reported previously.[1] However, the data variation in the measurement was quite large. If the DNA was dispersed in buffer, the change of fluorescence cannot be observed after the extraction step (compare purple and green dots in Figure S3). To further confirm extraction, back extraction experiments were also conducted. In these, the IL phase from the previous step was removed and then mixed with an aqueous citrate phosphate stripping buffer (pH 4.06). The buffer acts as a stripper to remove DNA present in the IL and returns it to the aqueous phase. The IL and buffer were mixed and separated using the same procedure, and the aqueous buffer phase was collected for fluorescence measurement. Back extraction experiments were run on the DNA in the water trials. The fluorescence intensity of back extracted samples was independent of the initial DNA concentration, indicating no DNA was recovered, and there was no DNA initially present in the IL phase. Therefore, the direct extraction results based on EB staining are conflicting. Back extraction, on the other hand, confirmed the lack of DNA extraction into the IL phase. We reason that part of the reason for such inconsistency could be related to the interactions between EB and the IL that might be left in
Electronic Supplementary Material (ESI) for Chemical CommunicationsThis journal is © The Royal Society of Chemistry 2013

S5
the aqueous phase. In addition, the DNA and EB concentrations were quite low in these experiments, which may also contribute to the large variation in the collected data.
Figure S3: DNA extraction in water and in citrate phosphate buffer by the [Bmim][PF6] IL. Back extraction for the water samples was also tested.
Extraction of low molecular weight salmon testes DNA monitored by UV-vis spectroscopy. Since fluorescence spectroscopy based on EB staining to quantify DNA appears to give relatively large variation, we next performed UV-vis spectroscopic studied to resolve it. An example of the UV-Vis absorbance result is shown in Figure S4. DNA is known to absorb light at 260 nm. There was very little difference between the control values and after extraction values, suggesting that little extraction occurs. This experiment was repeated at various DNA concentrations and buffer conditions (Figure S5). In all the cases, we did not observe the extraction of DNA into the IL phase.
Electronic Supplementary Material (ESI) for Chemical CommunicationsThis journal is © The Royal Society of Chemistry 2013
S6
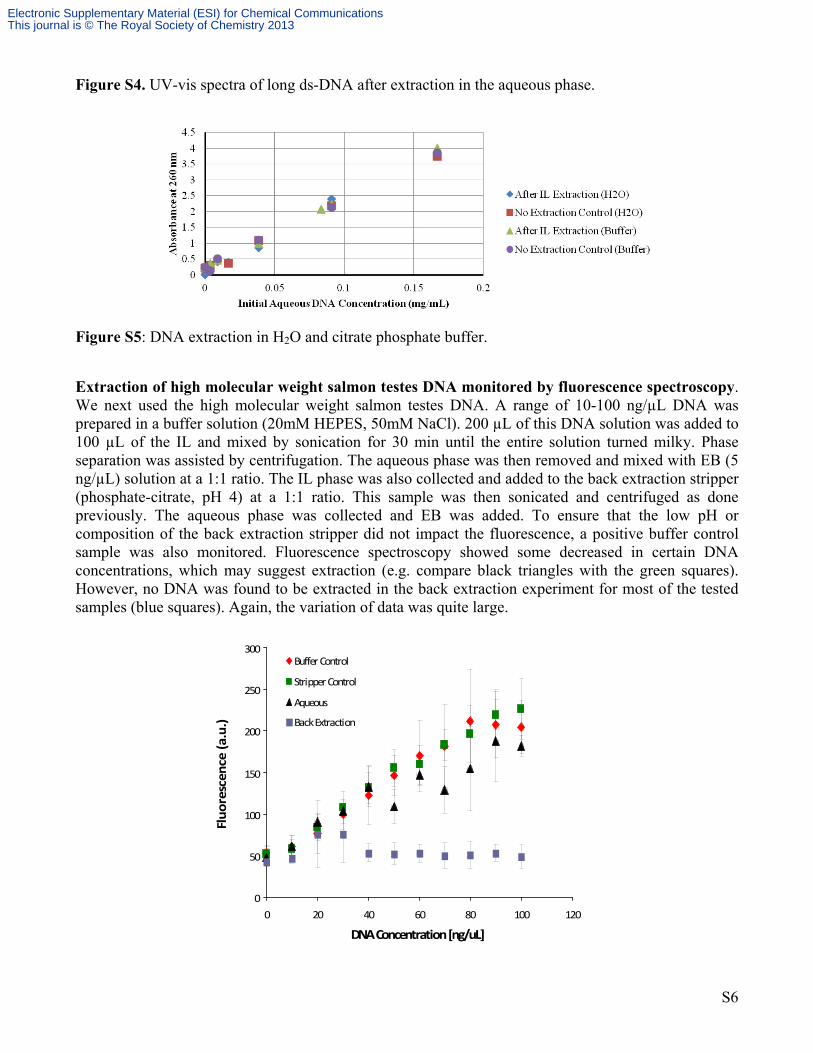
Figure S4. UV-vis spectra of long ds-DNA after extraction in the aqueous phase.
Figure S5: DNA extraction in H2O and citrate phosphate buffer.
Extraction of high molecular weight salmon testes DNA monitored by fluorescence spectroscopy. We next used the high molecular weight salmon testes DNA. A range of 10-100 ng/µL DNA was prepared in a buffer solution (20mM HEPES, 50mM NaCl). 200 µL of this DNA solution was added to 100 µL of the IL and mixed by sonication for 30 min until the entire solution turned milky. Phase separation was assisted by centrifugation. The aqueous phase was then removed and mixed with EB (5 ng/µL) solution at a 1:1 ratio. The IL phase was also collected and added to the back extraction stripper (phosphate-citrate, pH 4) at a 1:1 ratio. This sample was then sonicated and centrifuged as done previously. The aqueous phase was collected and EB was added. To ensure that the low pH or composition of the back extraction stripper did not impact the fluorescence, a positive buffer control sample was also monitored. Fluorescence spectroscopy showed some decreased in certain DNA concentrations, which may suggest extraction (e.g. compare black triangles with the green squares). However, no DNA was found to be extracted in the back extraction experiment for most of the tested samples (blue squares). Again, the variation of data was quite large.
0
50
100
150
200
250
300
0 20 40 60 80 100 120
DNA Concentration [ng/uL]
Buffer Control
Stripper Control
Aqueous
Back Extraction
Fluorescence (a.u.)
Electronic Supplementary Material (ESI) for Chemical CommunicationsThis journal is © The Royal Society of Chemistry 2013
S7
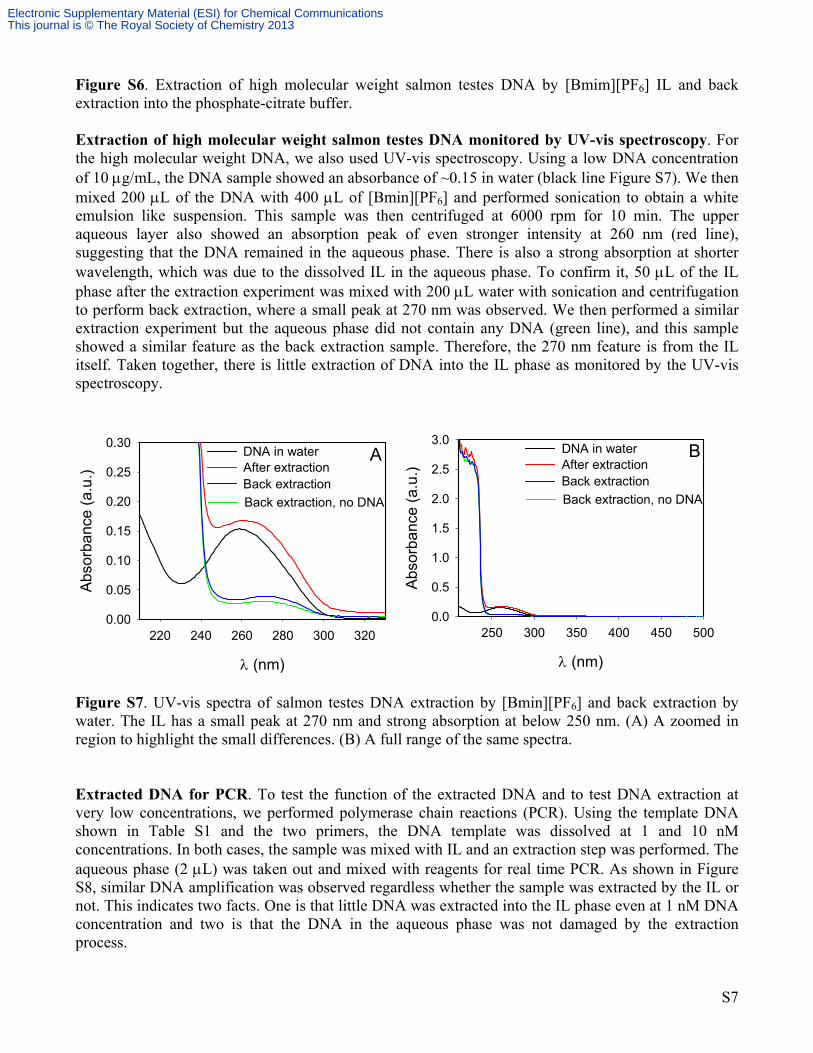
Figure S6. Extraction of high molecular weight salmon testes DNA by [Bmim][PF6] IL and back extraction into the phosphate-citrate buffer. Extraction of high molecular weight salmon testes DNA monitored by UV-vis spectroscopy. For the high molecular weight DNA, we also used UV-vis spectroscopy. Using a low DNA concentration of 10 g/mL, the DNA sample showed an absorbance of ~0.15 in water (black line Figure S7). We then mixed 200 L of the DNA with 400 L of [Bmin][PF6] and performed sonication to obtain a white emulsion like suspension. This sample was then centrifuged at 6000 rpm for 10 min. The upper aqueous layer also showed an absorption peak of even stronger intensity at 260 nm (red line), suggesting that the DNA remained in the aqueous phase. There is also a strong absorption at shorter wavelength, which was due to the dissolved IL in the aqueous phase. To confirm it, 50 L of the IL phase after the extraction experiment was mixed with 200 L water with sonication and centrifugation to perform back extraction, where a small peak at 270 nm was observed. We then performed a similar extraction experiment but the aqueous phase did not contain any DNA (green line), and this sample showed a similar feature as the back extraction sample. Therefore, the 270 nm feature is from the IL itself. Taken together, there is little extraction of DNA into the IL phase as monitored by the UV-vis spectroscopy.
(nm)
220 240 260 280 300 320
Ab
sorb
anc
e (
a.u
.)
0.00
0.05
0.10
0.15
0.20
0.25
0.30DNA in waterAfter extraction
Back extraction, no DNA
Back extraction
(nm)
250 300 350 400 450 500
Abs
orb
anc
e (
a.u
.)
0.0
0.5
1.0
1.5
2.0
2.5
3.0DNA in waterAfter extraction
Back extraction, no DNA
Back extraction
A B
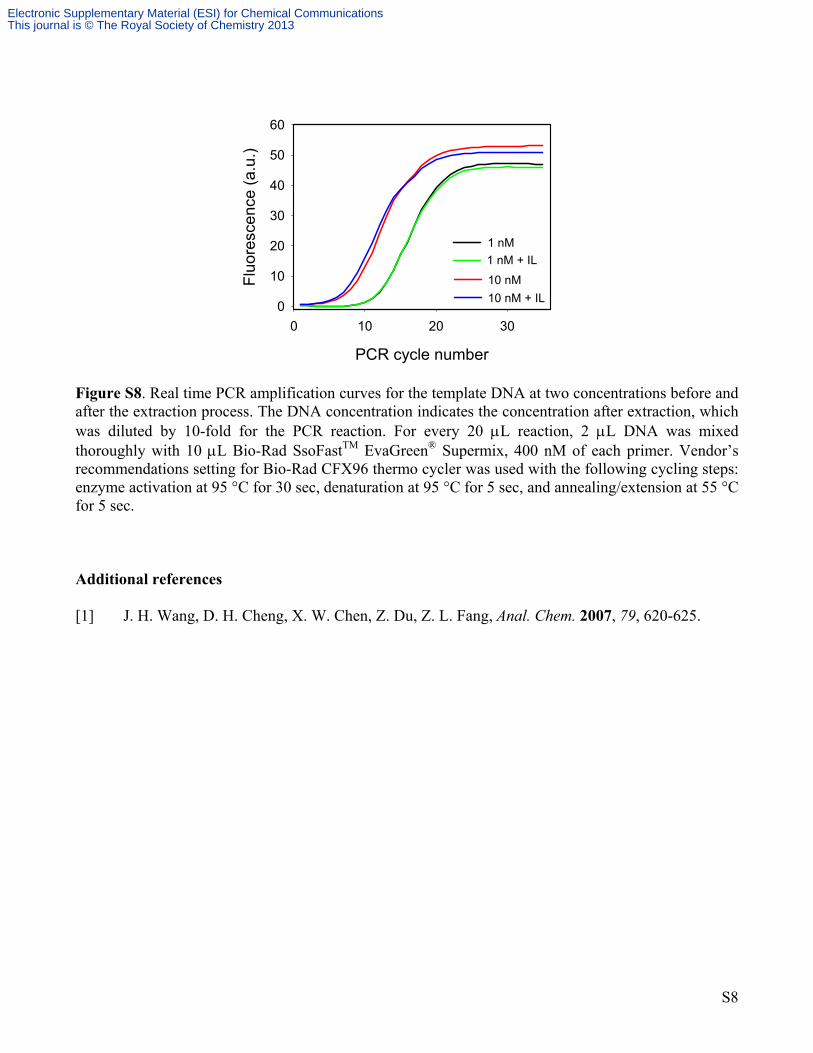
Figure S7. UV-vis spectra of salmon testes DNA extraction by [Bmin][PF6] and back extraction by water. The IL has a small peak at 270 nm and strong absorption at below 250 nm. (A) A zoomed in region to highlight the small differences. (B) A full range of the same spectra. Extracted DNA for PCR. To test the function of the extracted DNA and to test DNA extraction at very low concentrations, we performed polymerase chain reactions (PCR). Using the template DNA shown in Table S1 and the two primers, the DNA template was dissolved at 1 and 10 nM concentrations. In both cases, the sample was mixed with IL and an extraction step was performed. The aqueous phase (2 L) was taken out and mixed with reagents for real time PCR. As shown in Figure S8, similar DNA amplification was observed regardless whether the sample was extracted by the IL or not. This indicates two facts. One is that little DNA was extracted into the IL phase even at 1 nM DNA concentration and two is that the DNA in the aqueous phase was not damaged by the extraction process.
Electronic Supplementary Material (ESI) for Chemical CommunicationsThis journal is © The Royal Society of Chemistry 2013
S8
PCR cycle number
0 10 20 30
Flu
ores
cenc
e (a
.u.)
0
10
20
30
40
50
60
1 nM
10 nM
1 nM + IL
10 nM + IL
Figure S8. Real time PCR amplification curves for the template DNA at two concentrations before and after the extraction process. The DNA concentration indicates the concentration after extraction, which was diluted by 10-fold for the PCR reaction. For every 20 L reaction, 2 L DNA was mixed thoroughly with 10 L Bio-Rad SsoFastTM EvaGreen® Supermix, 400 nM of each primer. Vendor’s recommendations setting for Bio-Rad CFX96 thermo cycler was used with the following cycling steps: enzyme activation at 95 °C for 30 sec, denaturation at 95 °C for 5 sec, and annealing/extension at 55 °C for 5 sec. Additional references [1] J. H. Wang, D. H. Cheng, X. W. Chen, Z. Du, Z. L. Fang, Anal. Chem. 2007, 79, 620-625.
Electronic Supplementary Material (ESI) for Chemical CommunicationsThis journal is © The Royal Society of Chemistry 2013