extracting diagnostic information from intrinsic...
TRANSCRIPT
1
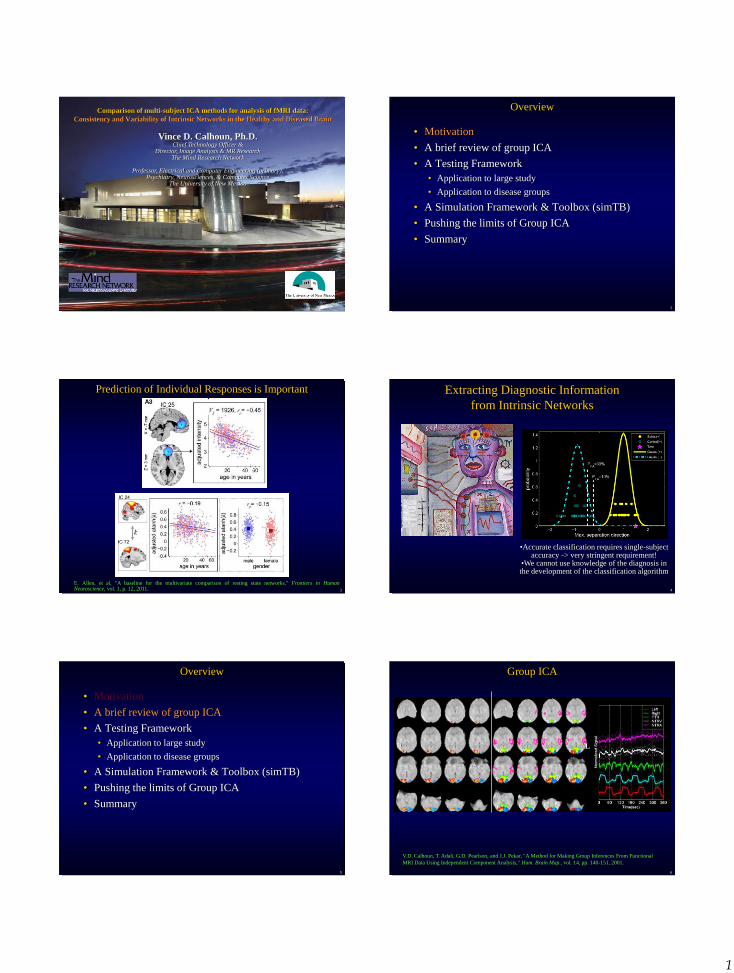
Comparison of multi-subject ICA methods for analysis of fMRI data:
Consistency and Variability of Intrinsic Networks in the Healthy and Diseased Brain
Vince D. Calhoun, Ph.D. Chief Technology Officer &
Director, Image Analysis & MR Research The Mind Research Network
Professor, Electrical and Computer Engineering (primary),
Psychiatry, Neurosciences, & Computer Science The University of New Mexico
Overview
• Motivation
• A brief review of group ICA
• A Testing Framework
• Application to large study
• Application to disease groups
• A Simulation Framework & Toolbox (simTB)
• Pushing the limits of Group ICA
• Summary
2
Prediction of Individual Responses is Important
3
E. Allen, et al, "A baseline for the multivariate comparison of resting state networks," Frontiers in Human Neuroscience, vol. 1, p. 12, 2011. 4
Extracting Diagnostic Information
from Intrinsic Networks
•Accurate classification requires single-subject accuracy -> very stringent requirement!
•We cannot use knowledge of the diagnosis in the development of the classification algorithm
Overview
• Motivation
• A brief review of group ICA
• A Testing Framework
• Application to large study
• Application to disease groups
• A Simulation Framework & Toolbox (simTB)
• Pushing the limits of Group ICA
• Summary
5 6
Group ICA
R L
V.D. Calhoun, T. Adali, G.D. Pearlson, and J.J. Pekar, "A Method for Making Group Inferences From Functional
MRI Data Using Independent Component Analysis," Hum. Brain Map., vol. 14, pp. 140-151, 2001.

2
Single Subject ICA vs Group ICA
E. Erhardt, E. A. Allen, Y. Wei, T. Eichele, and V. D. Calhoun, "SimTB, a simulation toolbox for fMRI data under a model of spatiotemporal separability," NeuroImage, Under Review. & Poster #657. E. A. Allen, E. Erhardt, Y. Wei, T. Eichele, and V. D. Calhoun, "Capturing inter-subject variability with group independent component analysis of fMRI data: a simulation study," NeuroImage, Under Review. & Poster# 690.
8
Group ICA
:
Subject 1
Subject N
Data
Subject i
Back-reconstruction through inversion1
1
Ai Si
ICA (Forward Estimation)
PCA reduction1
A S_agg
ICA
A1
AN
PCA reduction2
Subject i
Back-reconstruction through Spatial-temporal (dual) regression2,3
Ai
Si
S_agg 1) Regress onto each timepoint of to generate
Subject i Ai 2) Regress onto each image of to generate
Iterate steps 1 & 2 until converged
1. V. D. Calhoun et al Hum.Brain Map., vol. 14, pp. 140-151, 2001. 2. V. D. Calhoun et al Neuropsychopharmacology, vol. 29, pp. 2097-2107, 2004.
3. N. Filippini et al Proc Natl Acad Sci U S A, vol. 106, pp. 7209-7214, Apr 28 2009
Default Mode Group Maps
9
Inversion STR
E. Erhardt, S. Rachakonda, E. Bedrick, T. Adali, and V. D. Calhoun, "Comparison of multi-subject ICA methods for analysis of fMRI data," Hum Brain Mapp, In Press.
Evaluation of Group ICA Methods
10
E. Erhardt, S. Rachakonda, E. Bedrick, T. Adali, and V. D. Calhoun, "Comparison of multi-subject ICA methods for analysis of fMRI data," Hum Brain Mapp, In Press.
11
X
Subject 1
Subject N
Data
A S_agg
ICA
A1
AN
Subject i
Back-reconstruction
1
Ai Si
Comp# R2 Subject Reg1 Reg2
2 0.81
1 1.89 0.02
2 2.28 0.66
10 0.80
1 0.28 2.19
2 0.65 2.03
4 0.017
1 -0.19 -0.40
2 -0.10 0.08
Component Timecourses
Task-modulation
(e.g. Fit timecourses
to GLM model then
test parameter)
Component Images
Voxel-wise stats
(e.g. one-sample t-test,
two-sample t-test,
correlation, etc)
}
}
Component
images
(one per
subject)
T-statistic
}
}
Multiple
regression
fit to ICA
timecourses
Beta-weights
(second
level
model)
} Model
timecourses
Spectra
(e.g. power spectra,
fractal parameters,
etc)
Controls-Patients
-5
-4
-3
-2
-1
0
1
2
3
4
0.03 0.08 0.13 0.19 0.24 0.3
Frequency (Hz)
T-v
alu
e
T-Values
} Component
timecourses
} Power
spectra
group
differences
Tim
e
Components Voxels Voxels
Co
mp
oe
nts
Tim
e
Tim
e
Voxels
Tim
e
Components
Functional Network
Connectivity
(e.g. inter-component
correlation)
Overview
• Motivation
• A brief review of group ICA
• A Testing Framework
• Application to large study
• Application to disease groups
• A Simulation Framework & Toolbox (simTB)
• Pushing the limits of Group ICA
• Summary
12

3
Rest fMRI Networks (N=603)
13
E. Allen, et al, "A baseline for the multivariate comparison of resting state networks," Frontiers in Human Neuroscience, vol. 1, p. 12, 2011.
Main Effects & MANCOVA Model
14
E. Allen, et al, "A baseline for the multivariate comparison of resting state networks," Frontiers in Human Neuroscience, vol. 1, p. 12, 2011.
1
1
1
log ,..., log
,...,
atanh ,..., atanh
TT T
c c Mc
TT T
c c Mc
TT T
M
P P P
S S S
K K K
Selecting/Labeling Components
15
E. Allen, et al, "A baseline for the multivariate comparison of resting state networks," Frontiers in Human Neuroscience, vol. 1, p. 12, 2011.
28 labeled components superset of 75 components
N=603 subjects http://mialab.mrn.org/data/index.html
Various Metrics for component selection Compare with below atlas
Spatial Maps
16
E. Allen, et al, "A baseline for the multivariate comparison of resting state networks," Frontiers in Human Neuroscience, vol. 1, p. 12, 2011.
Functional Network Connectivity (FNC)
17
E. Allen, et al, "A baseline for the multivariate comparison of resting state networks," Frontiers in Human Neuroscience, vol. 1, p. 12, 2011.
Spectra
18
E. Allen, et al, "A baseline for the multivariate comparison of resting state networks," Frontiers in Human Neuroscience, vol. 1, p. 12, 2011.

4
Overview
• Motivation
• A brief review of group ICA
• A Testing Framework
• Application to large study
• Application to disease groups
• A Simulation Framework & Toolbox (simTB)
• Pushing the limits of Group ICA
• Summary
19
Relationship to Disease (N=1140)
Healthy (N=590) Substance Use (N=469)
Schizo/BP (N=81)
Within network example: anterior DMN Between network example:
precuneus-cerebellar connectivity
Overview
• Motivation
• A brief review of group ICA
• A Testing Framework
• Application to large study
• Application to disease groups
• A Simulation Framework & Toolbox (simTB)
• Pushing the limits of Group ICA
• Summary
23
• Motivation
• Simulated data facilitate comparative evaluations
• Creating reasonable simulations can be challenging
given the complexities of fMRI data
• SimTB goals
• Flexible, easy and fast generation of simulated fMRI
data under an ICA model
• Ability to answer basic questions regarding the group
ICA model
A simulation toolbox
1
Cnn r
i ic ic ic i i i i i
c
Y g N diag N
r s R g S

5
E. Erhardt, E. A. Allen, Y. Wei, T. Eichele, and V. D. Calhoun, "SimTB, a simulation toolbox for fMRI data under a model of spatiotemporal separability," NeuroImage, Under Review. & Poster #657.
Overview of simTB Spatial Maps
• Roughly 30 SMs can be selected through the graphical
user interface by clicking on components, or by component
number in the batch script
• For each subject, each selected component can be included
or not, be translated and rotated in space, and the spatial
spread of the component can be increased or decreased
• Each SM is normalized to have a peak-to-peak amplitude
range of one
Moments compared with real fMRI data
• Tissue types affect baseline intensity
• Possible to match simulation to real fMRI data
27
Two paradigm examples
28
• x- and y- translation and rotation
• Subject 1 (bold) has half the motion of subject 2
http://mialab.mrn.org/software
Overview
• Motivation
• A brief review of group ICA
• A Testing Framework
• Application to large study
• Application to disease groups
• A Simulation Framework & Toolbox (simTB)
• Pushing the limits of Group ICA
• Summary
29
Group ICA: Pushed to the Limits
• Four Experiments
• Varied component rotation
• Varied component position
• Varied component amplitude
• Varied the temporal correlation among components
30
E. A. Allen, E. Erhardt, Y. Wei, T. Eichele, and V. D. Calhoun, "Capturing inter-subject variability with group independent component analysis of fMRI data: a simulation study," NeuroImage, Under Review. & Poster #690.
http://mialab.mrn.org/software

6
Rotation
31
Position
32
Amplitude
33
Temporal Correlation Among Components (FNC)
34
Constrained ICA
35
1{ ( ) } { ( : ) }
2
T TE G E g y yλ W ρ Wx x μ y W x
Q. Lin, J. Liu, Y. Zheng, H. Liang, and V. D. Calhoun, "Semi-blind Spatial ICA of fMRI Using Spatial Constraints”, Hum. Brain Map., vol. 31, 2010
Overview
• Motivation
• A brief review of group ICA
• A Testing Framework
• Application to large study
• Application to disease groups
• A Simulation Framework & Toolbox (simTB)
• Pushing the limits of Group ICA
• Summary
36

7
Summary
• groupICA provides excellent estimates of single
subject SMs and TC and captures extensive spatial,
temporal, and amplitude variability.
• In general spatial ICA assumes consistency across
space, however estimation is surprisingly robust to
modest violation of this model.
• We introduce a tool for rapidly producing realistic
simulations of fMRI data under an ICA model.
• Enable rapidly answering questions about existing and
new ICA and group ICA approaches.
37
E. Erhardt, E. A. Allen, Y. Wei, T. Eichele, and V. D. Calhoun, "SimTB, a simulation toolbox for fMRI data under a model of spatiotemporal separability," NeuroImage, Under Review. & Poster #657. E. A. Allen, E. Erhardt, Y. Wei, T. Eichele, and V. D. Calhoun, "Capturing inter-subject variability with group independent component analysis of fMRI data: a simulation study," NeuroImage, Under Review. & Poster# 690.
http://mialab.mrn.org/software
Software/Algorithms
Left Hemisphere
Visual Stimuli Onset
Left Hemisphere
Visual Stimuli Onset
http://mialab.mrn.org/software 4100+ unique downloads
Funded by: 1R01EB006841
http://mialab.mrn.org/software
39
http://mialab.mrn.org Posters: #657 (M-T), #690 (W-Th)
40