expropriation risk vs. government bailout: implications
TRANSCRIPT
HAL Id: hal-02512308https://hal-unilim.archives-ouvertes.fr/hal-02512308
Preprint submitted on 19 Mar 2020
HAL is a multi-disciplinary open accessarchive for the deposit and dissemination of sci-entific research documents, whether they are pub-lished or not. The documents may come fromteaching and research institutions in France orabroad, or from public or private research centers.
L’archive ouverte pluridisciplinaire HAL, estdestinée au dépôt et à la diffusion de documentsscientifiques de niveau recherche, publiés ou non,émanant des établissements d’enseignement et derecherche français ou étrangers, des laboratoirespublics ou privés.
Expropriation risk vs. government bailout: implicationsfor minority shareholders of state-owned banks
Aldy Fariz Achsanta, Laetitia Lepetit, Amine Tarazi
To cite this version:Aldy Fariz Achsanta, Laetitia Lepetit, Amine Tarazi. Expropriation risk vs. government bailout:implications for minority shareholders of state-owned banks. 2020. �hal-02512308�
1
Expropriation risk vs. government bailout: implications for
minority shareholders of state-owned banks
Aldy Fariz Achsantaa1, Laetitia Lepetita, Amine Tarazia,b
a Université de Limoges, LAPE, 5 rue Félix Eboué, 87031 Limoges Cedex, France
b Institut Universitaire de France (IUF), 1 rue Descartes, 75231 Paris Cedex 05, France
This version : March 18, 2020
Abstract
We investigate the implications of government versus private ownership for bank minority shareholders. Specifically, we use unique data to examine whether the stock prices of government-owned and family-owned banks, equally engaged in related lending, differently react to loan announcements. Our empirical findings show that the expected negative market reaction due to minority shareholder expropriation driven by related lending (“grabbing hand” effect), is offset by shareholders’ expectations of future support from the government (“helping hand” effect). Positive announcement returns are also larger for new loans to state-owned firms than for those to private firms. Our findings support the view that in countries with weak shareholder protection, shareholders of state-owned banks rationally anticipate expropriation, but are willing to accept it in exchange for higher expectations of government support to state-owned banks and to state-owned firms.
JEL Classification: G21, G28 Keywords: Banks; government ownership; loan announcements; related party transactions.
1 Corresponding author: A. Fariz Achsanta: [email protected].
2
1. Introduction
In emerging countries, although many banks have been privatized over the last twenty years,
governments still maintain their controlling shareholding positions in many privately-owned
but also publicly-traded banks. Conversely, in developed countries, the bank failures triggered
by the 2007-2008 global financial crisis have led governments to substantially increase their
stakes and involvement in several large banks. How government ownership influences banks'
corporate governance has, therefore, become an important area of research for developed as
well as emerging economies.
According to the “grabbing hand” hypothesis of Frye and Shleifer (1997) and Shleifer and
Vishny (1998), government ownership might be harmful to corporate governance if the state
expropriates shareholders' wealth for the benefit of politicians. In line with this hypothesis, La
Porta et al. (2002), Dinc (2005), Sapienza (2004) and Khwaja and Mian (2005) find that
government ownership of banks facilitates the financing of projects that maximize the private
welfare of politicians rather than banks' revenues. Meanwhile, the “helping hand” hypothesis
argues that the state as a shareholder is in a position to provide preferential treatment and is
unlikely to let down large state-owned firms in case of distress (Faccio et al., 2006).
Consequently, the interests of minority shareholders of state-owned banks are potentially
influenced by two countervailing effects. Indeed, although they can suffer from expropriation,
shareholders might also benefit from taxpayer support to either state-owned firms or the state-
owned banks themselves. The research question that we address in this paper is how minority
shareholders anticipate being affected by government ownership when banks extend their
activities. On the one hand, as the bank invests in new projects, minority shareholders will
expect higher expropriation ("grabbing hand" effect). On the other hand, if these new projects
fail, they will expect specific support from taxpayers and to a larger extent than shareholders of
private banks would ("helping hand" effect).
To compare the relative merits and disadvantages of state versus private ownership previous
studies have essentially focused on non-financial firms. Claessens et al. (1998) find, for a
sample of publicly listed East Asian firms, that government ownership does not significantly
influence market valuation. They also find that firms controlled by families exhibit lower
market values. Their findings hence indicate that minority shareholders suffer from
expropriation to a larger extent in such firms than in state-owned firms. Conversely, using a
sample of listed non-financial Chinese firms, Bai et al. (2004) find that large holdings by the
government have a negative effect on market valuation. Cheung et al. (2009) further find that
the “grabbing hand” hypothesis only holds for Chinese firms controlled by local governments,
3
while central government ownership is beneficial for minority shareholders in line with the
“helping hand” hypothesis.
In this paper, we focus on banking firms and investigate the valuation effect of loan
announcements in publicly listed state-owned banks (SOBs) in comparison to publicly listed
non-state-owned banks and by specifically considering the type of borrowing firms (state-
owned firms or non-state-owned firms). Looking at banks and not firms from the real sector
brings in an important dimension that has not been investigated so far. Government bailouts are
much more common for banks than other firms and hence while shareholders might expect a
lower return from these new projects because of expropriation, they might also perceive them
as less risky because of the higher probability of government support in case of distress. Unless
default resolution mechanisms are credibly implemented to impose the losses on majority as
well as minority shareholders in both government and private banks (bail-in and not bailout),
such behavior could be even more pronounced in the post 2007-2008 financial crisis era.
We use an event study approach to investigate the market reaction to bank loan
announcements for state-owned in comparison to private. Specifically, to uncover the possible
presence of a “helping hand” effect for state-owned banks we look at how the extent of
expropriation affects the stock price reaction in both types of banks. To thoroughly conduct our
empirical investigation, we focus on a single country, Indonesia, whose banking industry
provides an ideal setting. Firstly, since 2009, a regulation has required listed Indonesian firms
to report information on related party transactions in their annual report. This allows us to
consider related party transactions, and more specifically related lending, as a proxy of the
extent of expropriation. Secondly, the Indonesian banking sector is characterized by strong
government ownership. The banking reforms implemented in the 2000s, especially with the
Single Presence Policy Act of 2006, strengthen the presence of the government as a controlling
shareholder but also force private investors to consolidate their ownership to maintain their
control. This leads to a high concentration of ownership in the banking sector, with either the
government or families being the controlling shareholder in a large number of banks. Thirdly,
according to the World Bank Doing Business Index, Indonesia is ranked 88th regarding the
protection of minority investors, far behind its neighboring countries such as Singapore (1st),
Malaysia (4th), and Thailand (36th). The combination of high ownership concentration and
weak minority shareholder protections is likely to favor the expropriation of minority
shareholders. The existing literature shows that families and government, as controlling
shareholders, are more prone to engage in the extraction of corporate resources through perks
or transfer of assets on non-market terms to related parties (Claessens et al., 2002; Villalonga
4
and Amit, 2006). We, therefore, use family-owned banks as a benchmark against which to
assess the valuation effect of loan announcements for state-owned banks under the threat of
expropriation. If investors rationally anticipate the “helping hand” effect to mitigate the
“grabbing hand” effect, we should expect announcement returns of state-owned banks to be
less affected than those of family-owned banks for similar levels of expropriation.
We further investigate if the valuation effect of loan announcements from state-owned
banks or family-owned banks could also depend on the type of borrowers they lend to. When
the borrower is a state-owned firm (SOE), minority shareholders of state-owned banks could
anticipate benefiting from a twin “helping hand” effect as SOEs are also likely to benefit from
government support in case of distress. Similarly, minority shareholders of family-owned banks
could also benefit from a “helping hand” effect if the loan is made to a SOE.
We use a unique hand-collected dataset on 342 loan announcements of listed Indonesian
banks. The dataset includes information on the ownership structure of banks and borrowing
firms as well as information on banks’ related party transactions to proxy the likelihood of
expropriation over the 2009–2014 period. Reliable data on related party transactions are only
available since 2009, as explained above. We do not consider data beyond 2014 because a
specific regulation for banks implied many changes in the ownership structure of banks after
2014. The new rules limit the shares held by financial institutions, non-financial institutions,
and individuals/families to 40%, 30%, and 20%, respectively.
Our findings show that there is no significant relationship between announcement returns
and expropriation at state-owned banks, while there is a negative and significant relationship at
family-owned banks. Our results further show that, for state-owned banks, announcement
returns become significantly and positively associated with expropriation when loans are
granted to state-owned firms. Taken altogether these results are consistent with the conjecture
that even if expropriation is present in state-owned banks (“grabbing hand” effect), the negative
outcome for stock prices of such resource diversion is likely to be offset by the “helping hand”
effect (when loans are extended to privately-owned firms), and even to be outweighed by the
twin “helping hand” effect (when loans are extended to state-owned firms).
This study makes several contributions to the literature. Firstly, it contributes to the literature
on state versus private ownership, providing evidence that for dispersed minority shareholders
government ownership of banks can be more beneficial than private ownership, especially when
the institutional environment is weak. Secondly, it examines the value of government ownership
of banks and sheds light on yet undocumented factors that make bank stock prices react to loan
5
announcements. Our findings are of interest to policymakers in countries with weak legal
protection for shareholders and where governments maintain their controlling shareholdings.
The rest of the paper is organized as follows. Section 2 presents the related literature and
the tested hypotheses. Section 3 describes our sample and defines our variables of interest.
Section 4 presents the market reaction results. Section 5 examines the determinants of bank
loan announcements. Section 6 contains additional investigations. Section 7 presents robustness
checks, and section 8 concludes the paper.
2. Background and hypotheses
Megginson (2005) argues that state ownership of banks is driven by several factors. Firstly,
government ownership of banks is a way to maintain domestic control over a nation’s financial
system. Secondly, state-owned banks can compensate for a possible lack of private capital with
sufficient risk tolerance to finance growth. Thirdly, state-owned banks can be used to finance
sectors which play an important social role and which private banks would be less keen to
finance because of lower profitability than other sectors. Globally, state-owned banks are also
expected to lend countercyclically, providing credit when and where other banks do not. This
could encourage industrialization and development at a more rapid pace than private financing
would allow.
Controlling government shareholders are therefore more likely to adopt a non-profit
maximization behavior to achieve social and political objectives, to the detriment of other
shareholders’ interest (Bai et al., 2000; Lin and Li, 2008). Schleifer and Vishny (1994) show
that, even in a fully competitive market, state-owned firms will be inefficient because the state
forces them to pursue non-economic objectives, such as maintaining employment. Shleifer and
Vishny (1998) argue that this “grabbing hand” behavior, with governments expropriating
shareholders' wealth from state-owned firms, implies that private ownership is preferable to
state ownership. In line with this argument, empirical evidence shows that government
ownership of banks is detrimental to their performance (Berger et al, 2005; Bonin et al., 2005;
Berger et al, 2009).2
However, prior research has also shown that shareholders in state-owned firms may benefit
from government cross-subsidization to counter financial difficulties. Seshinski and Lopez-
Calva (2003) document that governments provide subsidies to state-owned firms in financial
distress whenever the political costs of allowing these firms to go bankrupt outweigh the
2 See the survey of Shaban and James (2018).
6
political cost of subsidization. The large number of bailouts during the global financial crisis of
2007-2008 is indicative of how much the cost of allowing banks to go bankrupt outweighs the
cost of subsidization in such severe circumstances. The government can also help the banks in
which it has a major stake through preferential treatment, such as preferential loans when the
government is creditor (Tian and Estrin, 2008). This preferential treatment could also include
explicit bias when the government is the regulator, as it is the case in Indonesia.
We, therefore, expect loan announcement returns of state-owned banks to be less affected
by the threat of expropriation than those of family-owned banks if the “helping hand” effect
could potentially mitigate the “grabbing hand” effect in state-owned banks. We cannot directly
test whether investors of state-owned banks anticipate that the “helping hand” effect could
mitigate the “grabbing hand” effect as we cannot separately measure these two effects.
However, as family-owned banks are also prone to expropriate minority shareholders
(Claessens et al., 2002; Villalonga and Amit, 2006; Maury, 2006), our results will support this
conjecture if we find that loan announcement returns are more affected by the threat of
expropriation (gauged by the importance of related lending) in the case of family-owned banks
compared to state-owned banks.
H1 (“helping hand effect” for SOBs): Loan announcement returns of state-owned banks
are less affected by the threat of expropriation than those of family-owned banks.
To gain further insights into the market reaction to the loan announcements of state- and
family-owned banks, we also need to consider if the loan is extended to a state-owned firm or
a private firm. To avoid their possible failure, the state may provide preferential treatments to
SOEs and subsidize them if they encounter financial difficulties (Faccio et al., 2006).
Shareholders of state-owned banks could, therefore, benefit from a twin “helping hand” effect
when the borrower is a SOE. We hence expect that the market reaction to loan announcements
of state-owned banks depends on the type of borrowing firms. Shareholders might less
negatively react to loan announcements of SOBs when the borrowing firm is a SOE than when
the borrower is a private firm if they expect a twin “helping hand”. It is also possible that the
market anticipates that family-owned banks might also benefit from a “helping hand” effect
when borrowers are SOEs.
H2a (“Twin helping hand” effect for SOBs lending to SOEs): When the borrower is a
SOE and the lender a state-owned bank, loan announcement returns are less affected by the
threat of expropriation than when the borrower of the SOB is a private firm.
7
H2b (“Helping hand” effect for family-owned banks lending to SOEs): When the
borrower is a SOE and the lender a family-owned bank, loan announcement returns are less
affected by the threat of expropriation than when the borrower of the family-owned bank
is a private firm.
The literature analyzing the reaction of bank stock prices to loan announcements is very
scarce and does not specifically examine market reactions of state-owned banks. Working on a
sample of 88 bank loan announcements in Japan, Kang and Liu (2008) find a negative impact
of loan announcements on the stock returns of lending banks, while they observe a positive
impact on the valuation of borrowing firms. They conclude that such findings are consistent
with the hypothesis that banks make suboptimal lending decisions that lead to wealth transfers
to borrowers. Bailey et al. (2011), who find no significant response for the stock prices of
Chinese banks, fail to confirm these results. However, their investigation is limited to 24 loan
announcements made by Chinese banks listed on the stock market.
Our paper is more closely related to Claessens et al. (1998), Bai et al. (2004) and Cheung
et al. (2009) that examine whether non-financial firms benefit from the presence of government
shareholding. These three papers provide opposite results, with Bai et al. (2004) showing that
government ownership has a negative impact on market valuation, while Claessens et al. (1998)
find no significant impact and Cheung et al. (2009) find a positive impact but only for central
government ownership. We contribute to this literature by focusing on government ownership
of banks, with potentially a stronger expected “helping hand” effect as government bailouts are
much more common for banks than for non-financial firms. We furthermore investigate
whether the type of the borrowing firm makes shareholders of state-owned banks differently
react to loan announcements.
3. Data and variable definitions
3.1. Presentation of the sample
Since 2004, the Indonesian market authority obliges borrowing firms to report information
on each loan contract no later than two working days after the transaction is undertaken to the
Indonesian Financial Services Authorities (OJK) and in Indonesian newspapers. However, the
information provided around the announcement date is often limited to the name of the lending
bank and the loan size. More detailed information (contract date, the interest rate, and the
maturity) are only provided in the annual report of borrowing firms. We, therefore, collected
our data on bank loan announcements from the annual reports of borrowing firms and not from
8
announcements to the Stock Exchange.3 We furthermore collect data on related party
transactions from banks annual reports. We have reliable information since 2009 as the law
requires listed Indonesian firms to publicly report any related party transaction (RPT). We also
use the annual reports of banks to assemble data on their ownership structure, in addition to the
information provided by BvD BankScope and Bloomberg. As discussed above, we only collect
data on the ownership structure of banks until 2014. A regulation became effective in 2014
intending to reduce over the five following years the potential negative effects of ownership
domination for the banking industry. The law was initially enacted in 2012 by the Central Bank
(Central Bank of Indonesia regulation Nomor 14/8/PBI/2012), with maximum ownership
limited to 40%, 30% and 20% for financial institution, non-financial institution, and
individual/family, respectively. This limit takes into account if different shareholders are
connected by stakes, family relationships or act in a concert relationship, and this is the total
combined ownership of the whole connected parties that cannot exceed the maximum threshold.
The adjustments in the ownership stakes start in 2014 and had to be made by the end of 2018.
However, this law does not apply to the central government of Indonesia and restructuration
agencies. Based on these policies, we limit our analysis to the period 2009-2014,4 by collecting
market data over the period 2010-2014 as we use the lagged value of related party transactions
in our empirical analysis.
Out of the 521 firms publicly listed on the Indonesian Stock Exchange (IDX) over the 2010-
2014 period, 153 firms have taken out loans from banks and disclosed detailed information on
the loan contracts. We obtain information on 421 loan contracts, involving 27 listed banks
(among the 35 banks that are listed on the IDX over the period). Among these 27 banks, 12 are
identified as state-owned, 12 are family-owned and 3 are institutionally-owned (the largest
shareholder is an institutional investor), and they account for 211, 131 and 23 loan
announcements, respectively. Because of the very small number of observations on
institutionally-owned banks we drop them from our sample especially because our framework
requires identifying the type of borrowers they lend to. We furthermore examine if other events
may affect banks’ stock prices around the loan announcements (e.g. dividend payments, change
in managerial key position, etc.) in banks’ annual reports and website corporate announcements;
3 We did not use Thomson Reuters LPC DealScan to collect data on loan announcements for three reasons. First, only a small number of Indonesian banks (2 over our period of analysis) are involved in the market of syndicated loans. Second, this commercial database does not provide data on related party transactions; such data are only available in countries where it is mandatory to report them in annual reports, such as Indonesia. Third, syndicated loans involve several lenders for a given borrower. 4 We keep the year 2014 in our analysis to gain in degrees of freedom because we observe that we do not have significant changes between 2013 and 2014 in the ownership structure of our sample of banks.
9
we drop 23 loans announcement for which other events were identified. Because all the relevant
data (financial statements, ownership structure, and related party transactions) on borrowing
firms and lending banks are not available in either annual financial reports or Bloomberg and
Bankscope, we end up with a final sample of 342 loans involving 136 borrowers and 24 lending
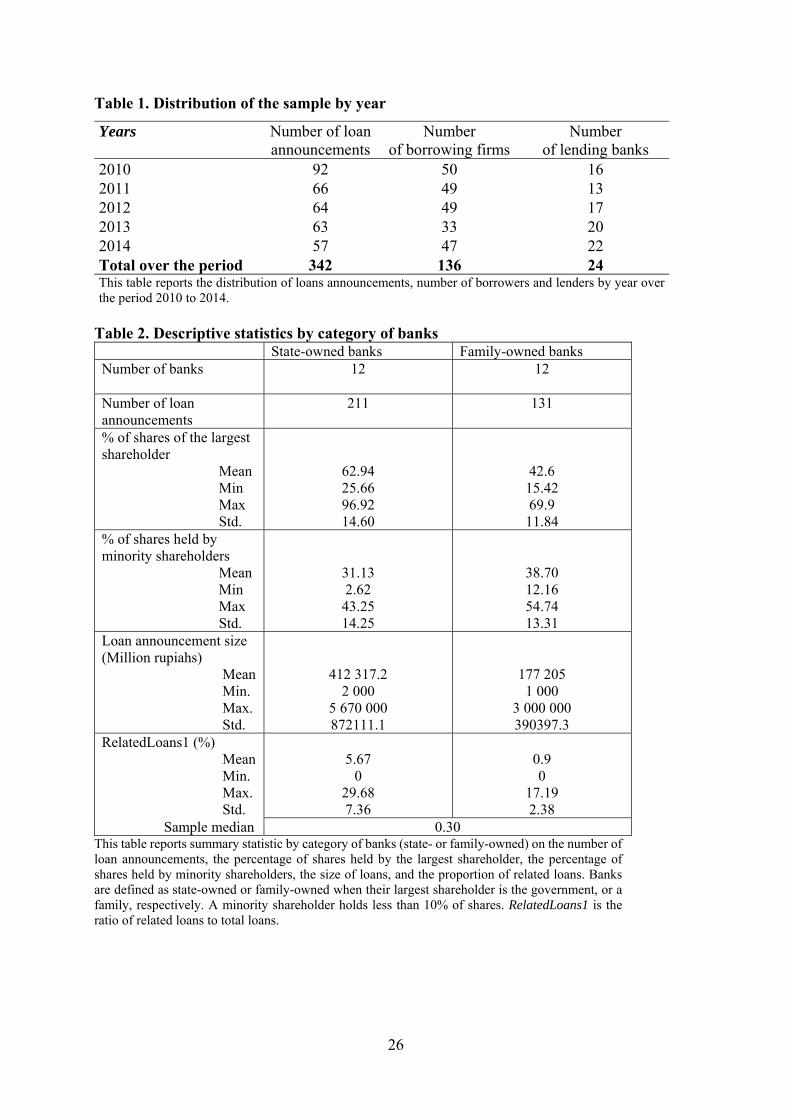
banks. We verify that these 24 banks are actively traded on the market. Table 1 presents the
distribution of loans, borrowing firms, and lending banks by year over the 2010-2014 period.
[Insert Table 1]
3.2. Ownership structure of lending banks and borrowing firms
Banks in Indonesia are generally controlled by one large shareholder until 2014. This could
be due to the reforms imposed by the government over the 2000s. In 2005, the government
provided incentives for consolidation by raising the minimum capital requirement to IDR 100
billion (PBI No 7/15/2005). In 2006, the Indonesian government further attempted to promote
competition by preventing shareholders from having controlling stakes in multiple banks (PBI
No. 8/16/PBI/2006), forcing them to divest or consolidate through mergers and acquisitions.
We follow the existing literature (e.g. La Porta et al., 1999, 2002; Caprio et al., 2007; Lepetit
et al., 2015) by using the control threshold of 10% to build the control chain of banks for each
year and identify all owners that have a controlling stake. We find that all banks have at least
one controlling owner, with the largest and the second largest owner holding on average around
55% and 7% of the shares, respectively, leaving minority shareholders with on average a 34%
stake.
We find that the largest owner is a government for 12 banks, with on average a controlling
stake of around 63%, while minority shareholders hold on average 31% of the shares (see Table
2). We have 8 banks controlled directly or indirectly by the government of Indonesia, and 4
banks controlled by a foreign government (Singapore, Malaysia, and Qatar). The 8 Indonesian
state-owned banks account for a substantial market share with around 42% of the total assets
of the banking system over the 2010-2014 period (for a total of 116 banks). We also have 12
family-owned banks, with families holding on average 42.6% of the shares (see Table 2). We
find that the ownership structure of these state- and family-owned banks is stable over the
sample period, the largest controlling owner remaining the same with however time-varying
shareholdings. The number of loan announcements for state-owned and family-owned banks is
211 and 131, respectively (see Table 2). We can see that the size of the loan is on average larger
for state-owned banks than for family-owned banks (see Table 2). We create the dummy
10
variable DLenderGvtOwned, taking the value of one for loan contracts when the lender is
government-owned, and zero otherwise.
For the borrowing firms, we identify if they are state- or privately-owned using the
information provided by the company website and annual reports, the IDX, and the Ministry of
SOEs. We have in our sample 10 borrowers that are SOEs among the 20 SOEs that are listed
on the IDX, with the government holding more than 50% of the shares. These 10 borrowers
account for 45 loan announcements. We, therefore, have 126 borrowers that are privately
owned, accounting for 297 loan announcements. We create the dummy variable
DBorrowerGvtOwned that takes the value of one for loan contracts when the borrower is
government-owned.
[Insert Table 2]
3.3. Related loans as a proxy for the likelihood of expropriation
We try to identify which loans can be classified as related at the announcement date. In
Indonesia, the regulator considers loans as related if: (i) borrowers and lenders are owned by
the same controlling shareholder(s); or (ii) borrowing firms are controlled by a key person in
lenders’ management (executive manager, director, etc.). Since 2009, the regulation requires
listed Indonesian firms to publicly announce any related party transaction (RPT) a maximum
of two working days after the transaction takes place, except for related party transactions
having a value lower than 0.5% of the firm’s paid capital (BAPEPAM Kep-412/BL/2009). Such
rules might create incentives for firms to arrange RPT and split them into smaller ones; this
implies that investors on the market might not be aware of all RPTs when they take place, but
instead only have information, ex-post, on the total amount of RPTs that are disclosed in annual
reports since 2009 (Indonesian accounting standard regulation PSAK No. 7/2009). Moreover,
if related parties and controlling owners are in the same group with consolidated annual reports,
the status of the transactions (RPT or non-RPT) does not need to be publicly announced to the
IDX although they need to be reported to the Indonesian Financial Services Authorities (OJK)
and in borrowing firms’ annual reports. Listed banks are furthermore subject to the rules
imposed by the Central Bank of Indonesia; since 2005, loans extended to related parties cannot
exceed 10% of the banks’ equity (Peraturan Bank Indonesia No. 7/3/PBI/2005).
In this context, market participants will not be able to identify all loans that are related using
public information available at the announcement date. We cannot, therefore, conduct our event
study analysis using the information on loans classified as related at the announcement date, as
11
a large number of loans will be classified as non-related while they are related.5 The only
reliable information is the information on related loans provided in the annual report. We,
therefore, use the information published in banks’ annual reports on loans to related parties as
a proxy for the likelihood of expropriation, as common in the existing literature (e.g. Bailey et
al., 2011, Djankov et al., 2008; Huang et al., 2012). Related party transactions can be used by
large shareholders as a vehicle to transfer resources from the company to its related parties (La
Porta et al. 2003; Gordon et al., 2004; Jiang et al. 2010). Such expropriation behavior with the
pursuit of non-profit maximizing objectives could affect minority shareholders through a
reduction in firm value. Alternatively, related party transactions could also take the form of
efficient arrangements that are of benefit to all shareholders when there is incomplete
information (Ryngaert and Thomas, 2012). This can be the case if the availability of more
information on related parties reduces the uncertainty on the risk characteristics of projects
(Rajan, 1992). However, the existing empirical literature finds that related party transactions
are negatively related to firm value, supporting the expropriation hypothesis (Gordon et al.,
2004; Cheung et al. 2009; Jiang et al. 2010; Kohlebeck and Mayhew, 2010; Ryngaert and
Thomas, 2012).
We collect data on the total amount of related loans provided in banks annual reports for the
years 2009 to 2014 and compute for each bank the ratio of related loans to total loans
(RelatedLoans1) and the ratio of related loans to total assets (RelatedLoans2). Related loans
represent on average around 3.8% of total loans, with a median value of 0.30% (see Table 3).
On average, the proportion of related loans is higher for state-owned banks (5.67%) compared
to family-owned banks (0.9%) (see Table 2).
[Insert Table 3]
4. Abnormal returns surrounding loan announcements
4.1. Event study methodology
We investigate the impact of loan announcements on stock prices of state-owned banks in
comparison to family-owned banks over the period 2010-2014. The announcements of
individual loan agreements can have a significant effect on the stock prices of the lending bank
although loans to an individual firm generally represent a small portion of a bank’s loan
portfolio (Kang and Liu, 2008). They provide information to the market about the bank’s
lending policy and how the bank invests its funds to generate cash flows.
5 Based on the information publicly available, we can only identify 54 loans that are related among the 342 loans announcements we have in our sample.
12
We apply a standard event study methodology to compute CARs for all announcements. The
date of the loan announcement is the date of the loan contract plus two working days as the loan
transactions should be announced within a maximum of two working days. We obtain daily
stock prices and market index data from Bloomberg. We compute ex-post abnormal returns,
defined as the difference between actual stock returns and expected returns in the event window,
as follows:
𝐴𝑅 𝑅 𝛼 𝛽 𝑅 1
where 𝑅 is the daily return of the ith lending bank at time t and 𝑅 is the daily market index
return at time t; 𝛼 and 𝛽 are ordinary least squares (OLS) regression estimates from the market
model. We compute the abnormal returns by estimating 𝛼 and 𝛽 using 180 daily returns
beginning with day t = -200 and ending with t = -20 relative to the announcement date t=0.
We calculate the cumulative abnormal returns between any two dates T1 and T2 as
CAR 𝑇 ,𝑇 ∑ AR 2
and we construct the cross-sectional average of CARs between dates T1 and T2 as
ACAR 𝑇 ,𝑇 ∑ CAR 𝑇 ,𝑇 3
We test the significance of average CARs using the standard cross-sectional t-statistic test that
the average CARs over any given time interval are equal to zero. We also employ the Wilcoxon
test (1945) that uses a median test of the null hypothesis to check if the mean return is not
unduly influenced by outlier returns.
4.2. Results
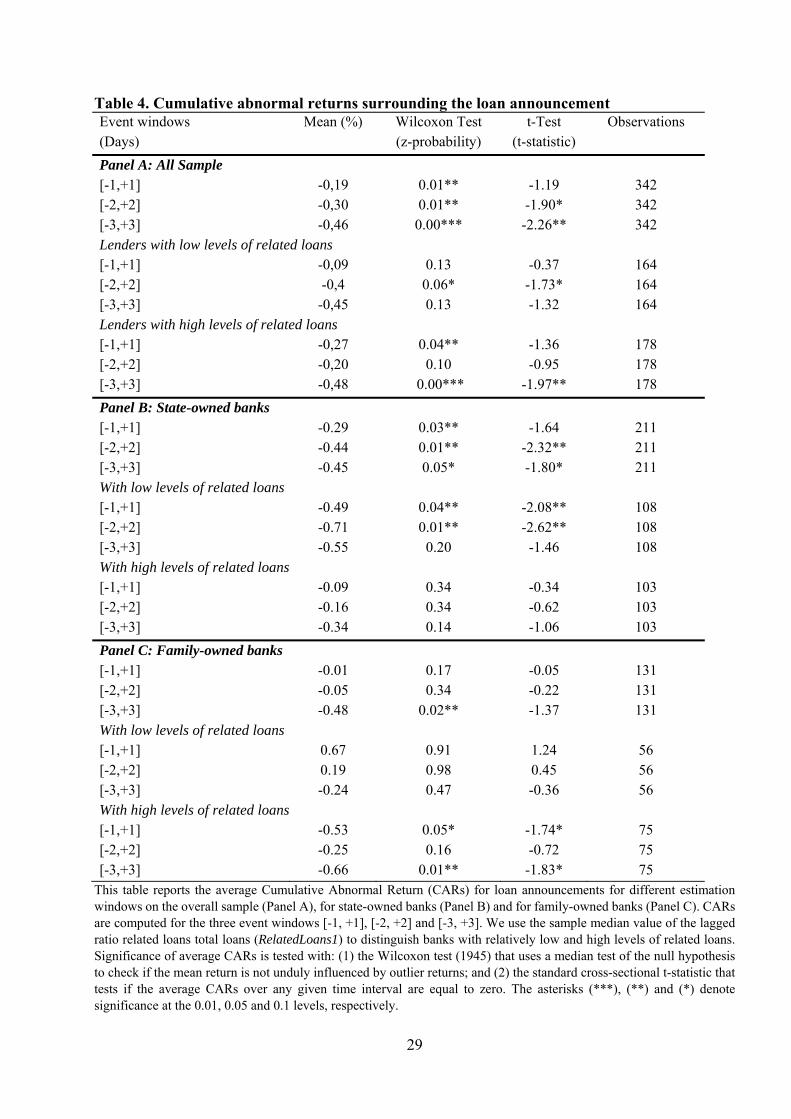
Tables 4 reports the CARs for state-owned banks (Panel B) in comparison with family-
owned banks (Panel C), that we further differentiate according to their relatively high or low
levels of related loans.6 Panel A also reports the results for the whole sample. We consider
different event windows spanning from 3 days before and 3 days after the loan announcement
date. We use the sample median value of the ratio of related loans to total loans (RelatedLoans1)
in t-1 in the period preceding the announcement date to differentiate banks with relatively high
and low likelihood of expropriation.
Panel A for the whole sample shows that there are significant negative CARs at the 1 or 5%
confidence levels for banks. These negative CARs are driven by banks with relatively high
6 We have also computed CARs for state- and family-owned banks depending on the level of their related loans (high or low) and also on the type of borrowers they lend to (SOEs vs. privately-owned). However, dividing each sub-group of banks into four subsamples leaves some cases with a very small number of observations (or even no observations).
13
levels of related loans for two of the three-event windows we consider. We furthermore observe
that the stock market reacts negatively to loan announcements of family-owned banks with
higher levels of related loans for the event windows [-3,+3] and [-1,+1] (Panel C). CARs for
family-owned banks with lower levels of related loans are consistently non-significant.
Regarding state-owned banks, Panel B shows that CARs are non-significant for state-owned
banks with a relatively high level of related party loans, for the three-event windows we
consider and for both the t-statistic and the Wilcoxon tests. But for state-owned banks with
relatively lower levels of related loans, the abnormal returns are significantly negative for the
two event windows [-2,+2] and [-1,+1].7 Together with the finding of negative announcement
returns for family-owned banks with relatively high levels of related loans, the absence of
significant negative returns for state-owned banks with high levels of related loans is consistent
with hypothesis 1. These results support the argument that investors expect the “helping hand”
effect to mitigate the “grabbing hand”effect.
[Insert Table 4]
5. Determinants of loan announcement effect
5.1. Type of banks and levels of related loans
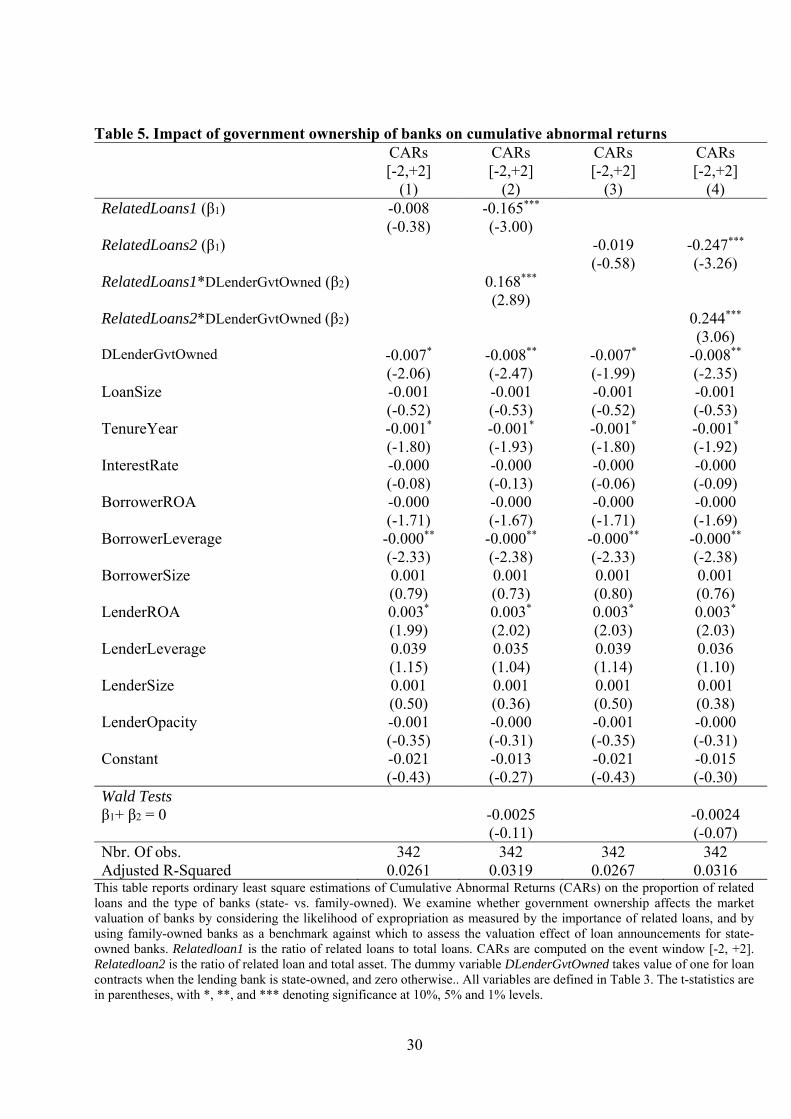
We next conduct a cross-sectional regression analysis to determine how government
ownership affects the market valuation of banks by considering the likelihood of expropriation
as measured by the importance of related loans. We use a CAR event window of [-2, +2] as the
dependent variable8 and consider family-owned banks as a benchmark as follows:
𝐶𝐴𝑅 𝛽 𝛽 𝑅𝑒𝑙𝑎𝑡𝑒𝑑𝐿𝑜𝑎𝑛𝑠 𝛽 𝑅𝑒𝑙𝑎𝑡𝑒𝑑𝐿𝑜𝑎𝑛𝑠 𝐷𝐿𝑒𝑛𝑑𝑒𝑟𝐺𝑣𝑡𝑂𝑤𝑛𝑒𝑑
𝛽 𝐷𝐿𝑒𝑛𝑑𝑒𝑟𝐺𝑣𝑡𝑂𝑤𝑛𝑒𝑑 𝜃 𝐶𝑜𝑛𝑡𝑟𝑜𝑙 ε 4
where RelatedLoans is either the ratio of related loans to total loans (RelatedLoans1) or the
ratio of related loans to total assets (RelatedLoans2) in the period preceding the announcement
date; DLenderGvtOwned takes the value of one when the lending bank is government-owned.
To be in line with hypothesis 1, we expect loan announcement returns of state-owned banks to
be less affected by the threat of expropriation than those of family-owned banks.
7 This unexpected result is driven by foreign state-owned banks. Indeed, in our sample, most of the state-owned banks with relatively low levels of related lending are foreign (see Section 6). Not surprisingly, state-owned banks are less likely to develop such links in a foreign country than at home. 8 We check the robustness of our results by considering other CAR event windows in Section 7.
14
We include a set of control variables in Equation (4). All variables are defined in Table 3
with corresponding descriptive statistics. We first control for loan characteristics. We include
the ratio of loan size to the total assets of the borrowing firm (LoanSize) and expect a negative
sign if the market perceives loans as suboptimal with a wealth transfer to borrowers ( Kang and
Liu, 2008). We also consider the maturity of loans in years (TenureYear); we expect a negative
coefficient if loans with longer maturity are associated with higher probabilities of default. We
control for the interest rate fixed by banks (InterestRate); a positive coefficient is expected if
higher interest rates contribute to increase bank profits. We furthermore include a set of
variables to control for borrowers’ and banks’ characteristics (taking lagged values): the ROA
(BorrowerROA and LenderROA), the leverage ratio (BorrowerLeverage and LenderLeverage),
and the logarithm of total assets (BorrowerSize and LenderSize). We furthermore compute an
index to measure the degree of bank opacity (LenderOpacity), as banks with lower degrees of
opacity should display lower CARs. We consider two components in our opacity index: trading
volume as a proxy for information uncertainty and asymmetry (e.g., Leuz and Verrecchia 2000,
Bailey et al. 2003) and bid-ask-spreads as a proxy for information asymmetry among investors
(Leuz and Verrecchia 2000; Mohd 2005). The index ranges from one to ten, with the highest
value representing the highest level of opacity (see Table 3 for more details). We analyze the
correlation matrix of our variables and does not point to potential multicollinearity problems.
Equation (4) is estimated using the ordinary least squared estimator with standard errors
clustered at the bank level.9 We also run regressions where we only include the variable
RelatedLoans and the dummy variable DLenderGvtOwned without considering their
interaction. The results are all provided in Table 5. When we consider the basic regression
without the interplay between the level of related lending and the type of bank (state-owned
versus family-owned), we find that announcement returns are not significantly related to either
the extent of related lending or the type of the bank at the 1 or 5% confidence levels (see
columns (1) and (3)).
However, the results in columns (2) and (4) in Table 5 show that, for family-owned banks
(that we consider as a benchmark), announcement returns are negatively linked to the extent of
related lending in banks' balance sheets (β1 negative and significant). Our results show a
different market reaction when the bank is controlled by the government as opposed to a family
as the coefficient 𝛽 is positive and significant. Wald tests show that announcement returns of
state-owned banks are not significantly related to the importance of related lending (𝛽 𝛽
9 We find similar results when standard errors are clustered at the bank and borrower level.
15
non-significant). Our findings are therefore consistent with hypothesis 1. These results seem to
indicate that even if a risk of expropriation exists when a state is the controlling owner of a
bank, it is mitigated by the “helping hand” effect. Our empirical analysis provides, therefore,
evidence that shareholders do not anticipate being affected by government shareholdings in
banks, while they negatively value the presence of families as controlling shareholders.
[Insert Table 5]
5.2. Impact of the borrowing firm’s type
We further examine whether market reactions to loan announcements of state-owned banks
in comparison to family-owned banks also depend on the type of firms they lend to.10 To
examine this potential impact channel, we augment Equation (4) with terms interacting the ratio
of related loans (RelatedLoans), the dummy variable for government-owned banks
(DLenderGvtOwned), and the dummy variable for government-owned borrowing firms
(DBorrowerGvtOwned); the estimation results are given in Table 6, with Table 7 providing the
associated Wald tests.
Our results in Tables 6 and 7 show that announcement returns are negatively related to the
extent of related lending when the controlling shareholder is a family, but only when loans are
extended to privately-owned firms. In contrast, our results show that announcement returns are
not significantly affected when loans are extended by family-owned banks to state-owned firms.
Our results furthermore show that announcement returns are positively and significantly related
to the extent of related lending when the controlling shareholder is a government, but only when
loans are extended to state-owned firms. We find no significant relationship when loans are
extended to privately-owned firms.
These results taken altogether are consistent with hypothesis 2. Even if a risk of
expropriation exists, the market positively values the government ownership of banks when
loans are extended to state-owned firms as compared to loans extended to privately-owned
firms, and does not negatively value family-ownership when the borrower is state-owned. These
findings support the arguments that when state-owned banks extend loans to SOEs, the twin
“helping hand” effect outweighs the “grabbing hand” effect. For family-owned banks, our
results seem to indicate that when borrowers are SOEs, the market anticipates such banks might
also benefit from a “helping hand” effect that could mitigate the risk of expropriation.
[Insert Tables 6 and 7]
10 As we only have listed firms in our sample of borrowers, they are all profit maximizing.
16
6. Extensions to analysis
We now examine several additional factors that could also have an impact on market
reactions to loan announcements of state-owned banks in comparison to family-owned banks.
Type of government
We first examine whether the valuation effect of loan announcements is different when state-
owned banks are controlled either by the government of Indonesia or by a foreign government.
The market might anticipate that foreign governments are less likely to provide preferential
treatment or to bail-out banks when they are shareholders of banks located in a foreign country,
while they might expropriate shareholders’ wealth for their benefit. We have 8 state-owned
banks controlled by the government of Indonesia and 4 by a foreign government, accounting
for 168 and 43 loan announcements, respectively.11 Table 8 reports the CARs for Indonesian
state-owned banks (Panel A) and foreign state-owned banks (Panel B) with either high or low
levels of related loans. We note that all the foreign state-owned banks have a level of related
loans lower than the median sample. We observe from Panel A that CARs are consistently non-
significant for Indonesian state-owned banks with relatively high and low levels of related
loans, for the threeevent windows we consider. In contrast, we find that announcement returns
of foreign state-owned banks loan agreements are significantly negative. These results indicate
that the negative valuation effect of loan announcement we find for state-owned banks with low
levels of related loans in Table 4 is driven by foreign state-owned banks.
We next compute the two dummy variables DLenderIndGvtOwned and
DLenderForGvtOwned taking the value of one when the largest shareholder is the government
of Indonesia or a foreign government, respectively. We test whether the type of government
affects our results by augmenting Equation (4) with terms interacting the ratio of related loans
and the two dummy variables for Indonesian and foreign state-owned banks.12 The results
provided in Table 9 show that despite the positive and significant coefficient associated with
DLenderIndGvtOwned and the non-significant coefficient of DLenderForGvtOwned, the Wald
tests show that announcement returns of both Indonesian and foreign state-owned banks are not
significantly linked to the importance of related lending. These findings confirm that
shareholders of state-owned banks do not anticipate being affected by government
shareholdings in banks, and this result holds irrespective of the type of government.
11 Two banks are controlled by the government of Malaysia, one by the government of Singapore and one by the government of Qatar. 12 The number of loan announcements for foreign state-owned banks does not allow us to run the regressions when we consider the type of borrowers as in Tables 6 and 7.
17
[Insert Tables 8 and 9]
Co-insurance effect
Concerning privately-owned borrowing firms, an important feature we need to consider is
that borrowers belonging to a pyramidal business group could present lower default risk. The
business groups enable member firms to share risk by reallocating resources from one affiliate
to another firm (Friedman et al., 2003; Khanna and Yafeh, 2005, 2007; Gopalan et al., 2007).
There is some empirical evidence of co-insurance within pyramidal business groups. Chang
and Hong (2000) find that pyramidal business groups in Korea use internal business
transactions for cross-subsidization purposes. Gopalan et al. (2007) further find that group-
affiliated firms in India are less likely to go bankrupt than stand-alone firms. Shareholders of
state-owned banks could therefore benefit from the cumulative effect of the “helping hand” and
co-insurance effects when borrowers belong to a pyramidal business group.
Among the privately-owned borrowers, we identify 115 borrowers belonging to a pyramidal
business group and 11 with a horizontal ownership structure, accounting for 278 and 19 loan
announcements, respectively. We rerun our regressions by differentiating if privately-owned
borrowing firms are affiliated or not to a pyramidal business group; we compute for that the
dummy variable DBorrowerInGroup taking the value of one when the borrower is privately-
owned and belongs to a pyramidal business group, and zero otherwise. The estimation results
are reported in Table 10 and associated Wald tests in Table 11.
Wald tests show that announcement returns of state-owned banks are significantly related to
the importance of related lending when the borrower is government-owned, while we find no
significant relationship when loans are extended to privately-owned firms and irrespective of
whether or not they are affiliated to a business group. For family-owned banks, the potential
co-insurance effect when loans are extended to borrowers affiliated to a pyramidal business
group does not offset the risk of expropriation, but the co-insurance effect contributes to
attenuate the negative market valuation associated with family shareholdings.
[Insert Tables 10 and 11]
Proportion of independent directors
The appointment of independent directors, who are independent from the influence of the
management and controlling shareholders, are considered as an essential tool to mitigate the
risk of resource diversion and transfer of firm value away from minority shareholders (Dahya
and McConnell, 2005; Young et al., 2008). We, therefore, check if the market reaction to bank
18
loan announcements when taking the likelihood of expropriation into account does not depend
on the proportion of independent directors on the board.
The Company Law in Indonesia adopts a two-tier board structure, with a board of directors
(BOD) and a board of commissioners (BOC). The BOD consists of only firms’ executive and
has managerial or day-to-day operational responsibilities, while the BOC is in charge of
ensuring the implementation of the corporate strategy, supervision of management policies, and
advising the BOD. The role of BOC is therefore comparable to that of the board of directors in
a one-tier board structure. Under the Central Bank of Indonesia Regulation No. 8/14/PBI/2006
on the implementation of corporate governance for banks, banks must have a minimum of 50%
of commissioners who are independent since 2006. We have in our sample around 25% of
banks having just the minimum legal of 50% of independent commissioners. We compute the
dummy variable DHighIndepDirectors that takes the value of one when the proportion of
independent commissioners is strictly higher than 50%. We augment Equation (4) with terms
interacting the ratio of related loans, the dummy variable for state-owned banks, and the dummy
variable for banks with a proportion of independent commissioners higher than the minimum
imposed by the regulator. Results provided in Tables 12 and 13 show that the relationships
between abnormal returns and the extent of related loans in state- and family-owned banks do
not depend on the proportion of independent commissioners on the board.
[Insert Tables 12 and 13]
7. Robustness checks
To check the robustness of our results, we conduct several tests.
Alternative event windows and tests for abnormal returns
To determine whether our results are affected by the event-windows we consider, we
compute CARs in [0,+1], [0,+2], and [-1,+2] windows. The results, provided in Table A1 in the
Appendix, show that our main results remain unchanged. Furthermore, as the T-test is not
immune to how abnormal returns are distributed across the event windows, we use alternatively
both Pattel (1976) and Boehmer et al. (1991) tests that consider abnormal returns distribution,
event-induced volatility and serial correlation to tackle this issue. Again, our main results
remain unchanged (see Table A1).
We also rerun regressions of Tables 5 and 6 on the three alternative event windows [0,+1],
[0,+2], and [-1,+2] and find results similar to those of the [-2,+2] event-window. To save space,
19
we only report in Appendix the results when we consider the type of borrowers and when the
dependent variable is the ratio of related loans to total loans (see Tables A2 and A3). Our results
when the lender is a state-owned bank are unchanged. When banks are controlled by a family,
we find that announcement returns are negatively related to the extent of related lending, not
only when loans are extended to privately-owned firms as we previously found, but also to
SOEs for the two event windows [-1,+2] and [0,+1]. Our results indicating that the “helping
hand” effect is also present in family-owned banks when they lend to SOEs is therefore not
robust across all the event windows.
Role of the size of loans
The market reaction to loan announcements might depend on the size of the loan (Kang and
Liu, 2008), especially in our study where we are taking into account the likelihood of
expropriation. We therefore examine whether our results are not driven by a stronger market
reaction for large loans. We create the dummy variable DLargeLoans which takes the value of
one if the loan size is above the median sample. In our sample, the average amount of state-
owned banks loans is relatively high around 412.31 Billion rupiahs compared to family-owned
banks (177.20 Billion rupiahs) (see Table 2). Loans from state-owned banks account therefore
for 62.20% of the loans that we classify as large.
We test whether the size of the loan affects our results by augmenting Equation (4) with
terms interacting the ratio of related loans, the dummy variable for state-owned banks, and the
dummy variable DLargeLoans.13 The results provided in Tables A4 and A5 show that the
relationships between abnormal returns and the extent of related loans in state-owned and
family-owned banks do not depend on the size of the loan.
Several lenders to the same firm
We check if some borrowers benefit from several loans provided by both state-owned banks
and family-owned banks. We have 131 and 77 loan announcements for which the borrowers
get loans only from state-owned or family-owned banks, respectively, with the remainder
borrowings from both state-owned and family-owned banks over time. We verify whether the
market reaction to loan announcements for state-owned banks depends on the other loan
contracts the borrowers have with family-owned banks. We create for that a dummy variable
DLenderGvtOwnedOnly taking the value of one for a borrower with only state-owned banks as
13 We are not able to run regressions when considering the type borrowers banks lends to as it would require including quadruple interaction terms.
20
lenders, and the dummy variable DBothLenders that takes the value of one for a borrower whose
lenders are both state-owned banks and family-owned banks. The results provided in Table A6
show that the results we find hold independently of whether state-owned banks are the sole
lenders of borrowers over time.
Sub-sample analysis
Cheung et al. (2009), who analyze abnormal stock returns at the announcement of related
party transactions for Chinese SOEs, find results consistent with the “helping hand” hypothesis
when the controlling shareholder is the central government, while their results support the
“grabbing hand” hypothesis when SOEs are controlled by local governments. They justify these
results by arguing that local governments might have more opportunities to expropriate as they
have lower visibility to the press and judicial authorities compared to the central government.
In our sample, we only have 2 state-owned banks controlled by local Indonesian governments,
accounting for 6 observations. We cannot therefore examine whether the market reaction to
state-owned banks’ loan announcements depends on the type of government, local or central.
However, we check the robustness of our results by excluding the 6 loan announcements made
by state-owned banks controlled by local governments, and our results remain unchanged (see
Tables A7 to A9).
8. Conclusion
This study examines whether government ownership affects the market valuation of banks
when they extend their activities. We use a unique hand-collected dataset for Indonesia to
analyze the impact of loan announcements on the bank stock returns of state-owned banks when
expropriation is at stake, by taking family-owned banks as a benchmark. While minority
shareholders of state-owned banks might expect a lower return from new loans because of
expropriation (“grabbing hand” effect), they might also perceive them as less risky because of
the higher probability of government bailout (“helping hand” effect). We also investigate
whether the type of the borrowing firm (state-owned firm vs. private firm) makes shareholders
of state-owned banks react more or less strongly to loan announcements.
Our findings show that, as expected, for family-owned banks there is a significant negative
relationship between announcement returns and the extent of expropriation while there is no
such link for state-owned banks. Hence, for similar levels of expropriation in both types of
banks, only the stock prices of family-owned banks suffer from loan announcements. Taken
21
altogether, these findings are consistent with the conjecture that even if a “grabbing hand” effect
is also prevalent in state-owned banks, such a negative impact for shareholders seems to be
offset by the “helping hand” effect. These results hold for banks controlled by either the
government of Indonesia or a foreign government, and irrespective of whether state-owned
banks are the sole lenders of borrowers over time, the size of the loan and the proportion of
independent directors on the board.
Our results further show that the “helping hand” effect at state-owned banks is stronger when
loans are granted to state-owned firms rather than to private firms, and irrespective of whether
or not they are affiliated to a business group. At family-owned banks, stock prices
systematically decline but suffer less when borrowing firms are affiliated to a pyramidal
business group. Taken altogether, these results provide evidence that when state-owned banks
extend loans to SOEs, the expected twin “helping hand” effect outweighs the “grabbing hand”
effect. For family-owned firms, the potential co-insurance effect when loans are extended to
borrowers affiliated to a pyramidal business group does not seem to offset the negative impact
due to expropriation.
Our empirical analysis, therefore, provides evidence that shareholders of state-owned banks
do not anticipate being affected when expropriation is at stake, while in contrast, those of
family-owned banks expect to be negatively affected. Our findings have implications for
governments, financial market authorities and listed companies. Our findings support the view
that shareholders rationally anticipate being exproriated when investing in state-owned banks
in countries with weak shareholder protection, but are willing to accept this higher risk in
exchange for greater stability. The findings also indicate that shareholders believe that
governments will bail out state-owned firms in case of distress. Our results suggest that if
governments maintain controlling positions in many banks in both developing and developed
countries, shareholders will not systematically “punish” them by selling stocks when they make
bad or riskier investments because they feel safe. Such behavior can lead to severe resource
misallocation. However, the implementation of default resolution mechanisms to impose the
losses on majority as well as minority shareholders in both government and private banks could
change the way investors value bank government ownership.
22
References
Bai, Chong-En., Li, David D., Tao, Zhigang., Wang, Yijiang, 2000. A multitask theory of state
enterprise reform. Journal of Comparative Economics 28, 716-738.
Bai, Chong-En., Liu, Qiao., Lu, Joe., Song, Frank M., Zhang, Junxi, 2004. Corporate
governance and market valuation in China. Journal of Comparative Economics 32, 599-
616.
Bailey, Warren, Huang, Wei, Yang, Zhisu, 2011. Bank loans with chinese characteristics: some
evidence on inside debt in a state- controlled banking system. Journal of Financial and
Quantitative Analysist 46, 1795-1830.
Bailey, Warren, Li, Haitao, Mao, Connie X., Zhong, Rui, 2003. Regulation fair disclosure and
earnings information: market, analyst, and corporate responses. Journal of Finance 58,
2487-2514.
Berger, Allen N., Clarke, George R. G., Cull, Robert, Klapper, Leora, Udell, Gregory F, 2005.
Corporate governance and bank performance: a joint analysis of the static, selection, and
dynamic effects of domestic, foreign, and state ownership. Journal of Banking and Finance
29, 2179-2221.
Berger, Allen N., Hasan, Iftekhar., Zhou, Mingming, 2009. Bank ownership and efficiency in
China: what will happen in the world’s largest nation?. Journal of Banking and Finance
33, 113-130.
Boehmer, Ekkehart, Masumeci, Jim, and Poulsen, Annete B., 1991. Event study methodology
under conditions of event-induced variance. Journal of Financial Economics 30, 253-272.
Bonin, John P., Hasan, Iftekhar., Wachtel, Paul, 2005. Bank performance, efficiency and
ownership in transition countries. Journal of Banking & Finance 29, 31-53.
Caprio, Gerard, Laeven, Luc, and Levine, Ross, 2007. Governance and bank valuation. Journal
of Financial Intermediation16, 584-617.
Chang, Sea J., Hong, Jaebum, 2000. Economic performance of group-affiliated companies in
Korea, Intragroup resource sharing and internal business transactions. Academy of
Management Journal 43, 429-448.
Cheung, Yan-Leung, Rau, P. Raghavendra Stouraitis, Aris. 2009. Helping hand or grabbing
hand? Central vs. local government shareholders in Chinese listed firms. Review of
finance 14, 669-694.
Claessens, Stijn, Demirguc-Kunt, Asli, Huizinga, Harry, 1998. How does foreign entry affect
the domestic banking market?. Policy Research Working Paper Series, The World Bank.
Claessens, Stijn, Djankov, Simeon, Fan, Josph P.H., Lang, Larry H.P., 2002. Disentangling the
23
incentive and entrenchment effects of large shareholdings. Journal of Finance 57, 2741-
2771.
Dahya, Jay, McConnell, John J., 2005. Outside directors and corporate board decisions. Journal
of Corporate Finance 11, 37-60.
Dinç, I.Sedar, 2005. Politicians and banks: political influences on government-owned banks in
emerging markets. Journal of Financial Economics 77, 453-479.
Djankov, Simeon, La Porta, Rafael, Lopez-de-Silanes, Florencio, Shleifer, Andrei, 2008. The
law and economics of self-dealing. Journal of Financial Economics 88, 430-465.
Faccio, Mara, Masulis, Ronald W., Mcconnell, John J., 2006. Political connections and
corporate bailouts. Journal of Finance 61, 2597-2635.
Friedman, Eric, Johnson, Simon, Mitton, Todd, 2003. Propping and tunneling. Journal of
Comparatvie Economics 31, 732-750.
Frye, Timothy, Shleifer, Andrei, 1996. The invisible hand and the weightless economy.
American Economic Review 87, 354–358.
Gopalan, Radhakrishnan, Nanda, Vikram, Seru, Amit .2007. Affiliated firms and financial
support: evidence from Indian business groups. Journal of Financial Economics 86, 759-
795.
Gordon, Elizabeth A., Henry, Elaine, Palia, Darius, 2004. Related Party Transactions:
Associations with Corporate Governance and Firm Value. SSRN Electronic Journal.
Available at https://doi.org/10.2139/ssrn.558983.
Huang, Weihua, Schwienbacher, Armin, Zhao, Shan, 2012. When bank loans are bad news:
evidence from market reactions to loan announcements under the risk of expropriation.
Journal of International Financial Markets, Institutions and Money 22, 233-252.
Jiang, Guohua, Lee, Charles M.C., Yue, Heng, 2010. Tunneling through intercorporate loans:
the China experience. Journal of Financial Economics 98, 1-20.
Khanna, Tarun, Yafeh, Yishay, 2007. Business groups in emerging markets: paragons or
parasites?. Journal of Economic Literature 45, 331-372.
Khanna, Tarun, Yafeh, Yishay, 2005. Business groups and risk sharing around the world.
Journal of Business 78, 301-340.
Kang, Jun-Koo, Liu, Wei-Lin, 2008. Bank incentives and suboptimal lending decisions:
evidence from the valuation effect of bank loan announcements in Japan. Journal of
Banking and Finance 32, 915-929.
Khwaja, A.I. and Mian, A. (2005), “Do Lenders Favor Politically Connected”, Quarterly
Journal of Economics, Vol. 120 No. 4, pp. 1371-1411.
24
Kohlbeck, Mark, Mayhew, Brian W., 2010. Valuation of firms that disclose related party
transactions. Journal of Accounting and Public Policy 29, 115-137.
La Porta, Rafael, Lopez-de-Silanes, Florencio, Zamarripa, Guillermo, 2003. Related Lending.
Quarterly Journal of Economics 118, 231-268.
La Porta, Rafael, Lopez-De-Silanes, Florencio, Shleifer, Andrei, 2002. Government ownership
of banks. Journal of Finance 57, 265-301.
La Porta, R., Lopez-de-silanes, F. and Shleifer, A. (Nat. B. of E.R. (1999), “Corporate
Ownership around the World Corporate Ownership Around the World”, The Journal of
Finance, Vol. 54 No. 2, pp. 471-517.
Lepetit, Laetitia., Saghi-Zedek, Nadia, Tarazi, Amine, 2015. Excess control rights, bank capital
structure adjustments, and lending. Journal of Financial Economics 115, 574-591.
Leuz, Christian, Verrecchia, Robert E., 2000. The economic consequences of increased
disclosure. Journal of Accounting Research 38, 91-125.
Lin, Justin Y., Li, Zhiyun, 2008. Policy burden, privatization and soft budget constraint. Journal
of Comparative Economics 36, 90-102.
Maury, Benjamin, 2006. Family ownership and firm performance: empirical evidence from
Western European corporations. Journal of Corporate Finance 12, 321-341.
Megginson, William L., 2005. The economics of bank privatization. Journal of Banking and
Finance 29, 1931-1980.
Mohd, Emad, 2005. Accounting for software development costs and information asymmetry.
The Accounting Review 80, 1211-1231.
Patell, James M., 1976. Corporate forecasts of earnings per share and stock price behavior:
empirical tests. Journal of Accounting Research 14, 246-276.
Peraturan Bank Indonesia, 2005. Regulation Number: 7/3/PBI/2005. Available at
https://www.bi.go.id/id/peraturan/perbankan/Pages/pbi%207305.aspx. BI, Jakarta.
Peraturan Bank Indonesia, 2005. Regulation Number: 7/15/PBI/2005. Available at
https://www.bi.go.id/id/peraturan/perbankan/Pages/pbi%2071505.aspx. BI, Jakarta
Peraturan Bank Indonesia, 2006. Regulation Number: 8/14/PBI/2006 Available at
https://www.bi.go.id/id/peraturan/perbankan/Pages/pbi_81406.aspx. BI, Jakarta
Peraturan Bank Indonesia, 2007. Regulation Number: 8/16/PBI/2006 Available at
https://www.ojk.go.id/en/kanal/perbankan/regulasi/peraturan-bank
indonesia/Pages/bank-indonesia-regulation-number-8-16-pbi-2006.aspx OJK, Jakarta
Peraturan Bapepam Indonesia, 2009. Regulation Number: Kep-412/BL/2009 Available at
https://www.ojk.go.id/id/kanal/pasar-modal/regulasi/klasifikasi-bapepam/emiten-dan-
25
perusahaan-publik/Pages/benturan-kepentingan.aspx OJK, Jakarta
Peraturan Penyajian Standar Akuntansi Keuangan, PSAK No. 7 revision 2009. Available at
http://www.iaiglobal.or.id/v03/standar-akuntansi-keuangan/pernyataan-sak-12-psak-7-
pengungkapan-pihakpihak-berelasi IAI, Jakarta
Rajan, Raghuram G. 1992. Insiders and outsiders : the choice between informed and arm ’ s-
length debt. The Journal of Finance 47, 1367-1400.
Ryngaert, Michael, Thomas, Shawn, 2012. Not all related party transactions (RPTs) are the
same: ex ante versus ex post RPTs. Journal of Accounting Research 50, 845-882.
Sapienza, Paola, 2004. The effects of government ownership on bank lending. Journal of
Financial Economics 72, 357-384.
Shaban, Mohammed, James, Gregory A., 2018. The effects of ownership change on bank
performance and risk exposure: evidence from Indonesia. Journal of Banking & Finance
88, 483–497.
Shleifer, Andrei, Vishny, Robert W., 1998. The Grabbing Hand: Government Pathologies and
Their Cures. Harvard Univ. Press, Cambridge, MA.
Shleifer, Andrei, Vishny, Robert W. 1994. Politicians and firms. Quarterly Journal of
Economics 109, 995-1025.
Tian, Lihui, Estrin, Saul, 2008. Retained state shareholding in Chinese PLCs: does government
ownership always reduce corporate value? . Journal of Comparative Economics 36, 74-89.
Villalonga, Belen, Amit, Raphael, 2006. How do family ownership, control and management
affect firm value?. Journal of Financial Economics 80, 385-417.
Wilcoxon, Frank, 1945. Individual comparisons by ranking methods. Biometrics bulletin 1,
80-83.
Young, Michael N., Peng, Mike W., Bruton, Garry D., and Jiang, Yi, 2008. Corporate
governance in emerging economies: a review of the principal-principal perspective. Journal
of Management Studies 45, 196-220.
26
Table 1. Distribution of the sample by year
Years
Number of loan announcements
Number of borrowing firms
Number of lending banks
2010 92 50 16 2011 66 49 13 2012 64 49 17 2013 63 33 20 2014 57 47 22 Total over the period 342 136 24 This table reports the distribution of loans announcements, number of borrowers and lenders by year over the period 2010 to 2014.
Table 2. Descriptive statistics by category of banks
State-owned banks Family-owned banks Number of banks 12
12
Number of loan announcements
211 131
% of shares of the largest shareholder Mean Min Max Std.
62.94 25.66 96.92 14.60
42.6 15.42 69.9 11.84
% of shares held by minority shareholders Mean Min Max Std.
31.13 2.62 43.25 14.25
38.70 12.16 54.74 13.31
Loan announcement size (Million rupiahs) Mean Min. Max. Std.
412 317.2 2 000
5 670 000 872111.1
177 205
1 000 3 000 000 390397.3
RelatedLoans1 (%) Mean Min. Max. Std.
5.67
0 29.68 7.36
0.9 0
17.19 2.38
Sample median 0.30 This table reports summary statistic by category of banks (state- or family-owned) on the number of loan announcements, the percentage of shares held by the largest shareholder, the percentage of shares held by minority shareholders, the size of loans, and the proportion of related loans. Banks are defined as state-owned or family-owned when their largest shareholder is the government, or a family, respectively. A minority shareholder holds less than 10% of shares. RelatedLoans1 is the ratio of related loans to total loans.
27
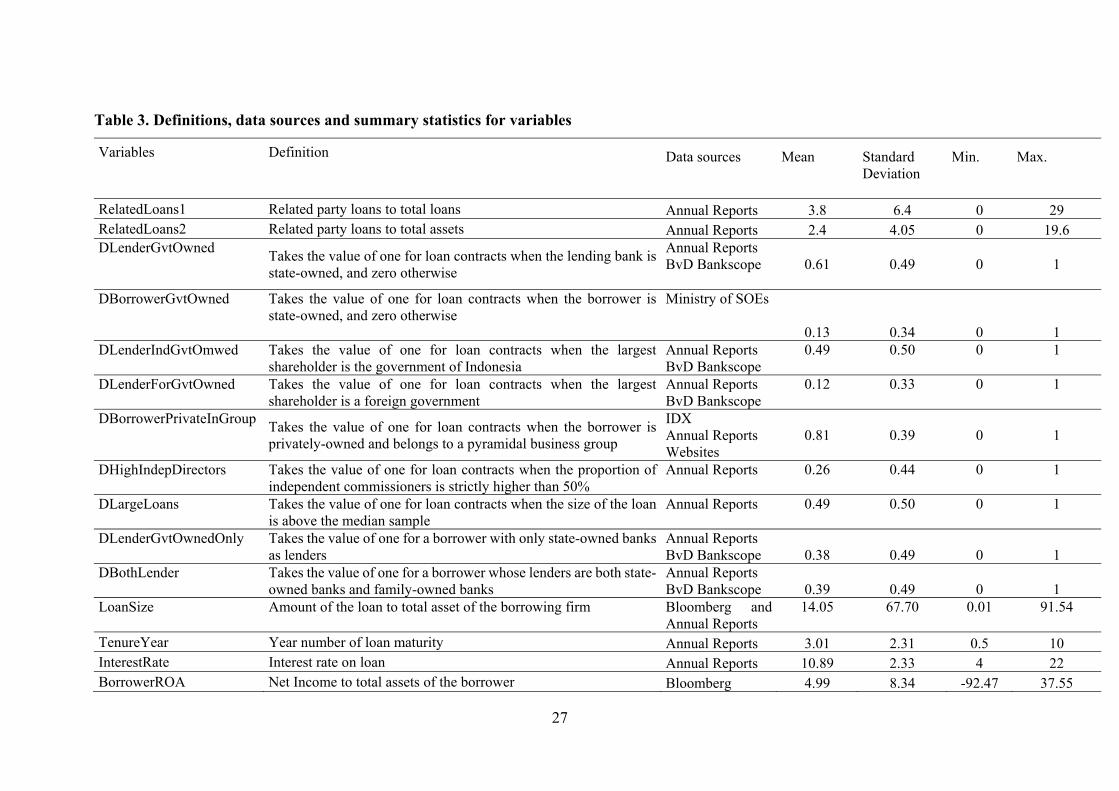
Table 3. Definitions, data sources and summary statistics for variables
Variables
Definition
Data sources
Mean
Standard Deviation
Min.
Max.
RelatedLoans1 Related party loans to total loans Annual Reports 3.8 6.4 0 29 RelatedLoans2 Related party loans to total assets Annual Reports 2.4 4.05 0 19.6 DLenderGvtOwned
Takes the value of one for loan contracts when the lending bank is state-owned, and zero otherwise
Annual Reports BvD Bankscope
0.61
0.49
0
1
DBorrowerGvtOwned
Takes the value of one for loan contracts when the borrower is state-owned, and zero otherwise
Ministry of SOEs 0.13 0.34 0 1
DLenderIndGvtOmwed
Takes the value of one for loan contracts when the largest shareholder is the government of Indonesia
Annual Reports BvD Bankscope
0.49
0.50
0
1
DLenderForGvtOwned
Takes the value of one for loan contracts when the largest shareholder is a foreign government
Annual Reports BvD Bankscope
0.12
0.33
0
1
DBorrowerPrivateInGroup
Takes the value of one for loan contracts when the borrower is privately-owned and belongs to a pyramidal business group
IDX Annual Reports Websites
0.81
0.39
0
1
DHighIndepDirectors
Takes the value of one for loan contracts when the proportion of independent commissioners is strictly higher than 50%
Annual Reports
0.26
0.44
0
1
DLargeLoans
Takes the value of one for loan contracts when the size of the loan is above the median sample
Annual Reports
0.49
0.50
0
1
DLenderGvtOwnedOnly
Takes the value of one for a borrower with only state-owned banks as lenders
Annual Reports BvD Bankscope 0.38 0.49 0 1
DBothLender
Takes the value of one for a borrower whose lenders are both state-owned banks and family-owned banks
Annual Reports BvD Bankscope 0.39 0.49 0 1
LoanSize
Amount of the loan to total asset of the borrowing firm
Bloomberg and Annual Reports
14.05
67.70
0.01
91.54
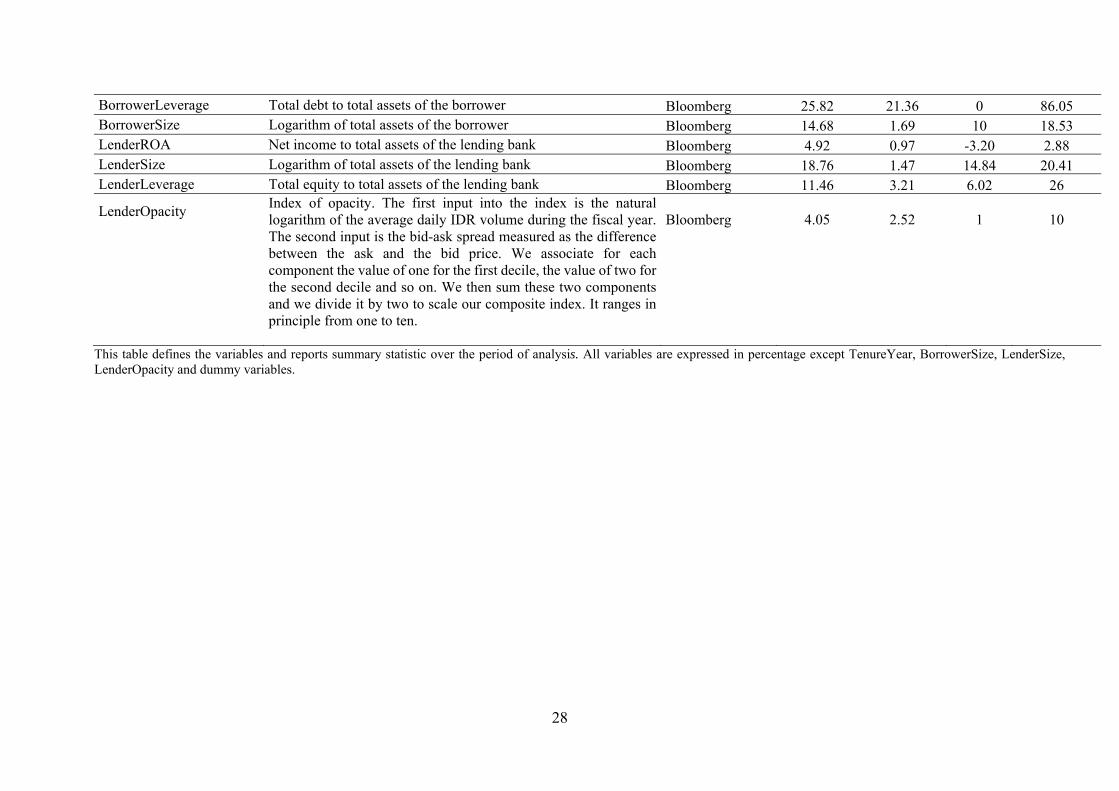
TenureYear Year number of loan maturity Annual Reports 3.01 2.31 0.5 10 InterestRate Interest rate on loan Annual Reports 10.89 2.33 4 22 BorrowerROA Net Income to total assets of the borrower Bloomberg 4.99 8.34 -92.47 37.55
28
BorrowerLeverage Total debt to total assets of the borrower Bloomberg 25.82 21.36 0 86.05 BorrowerSize Logarithm of total assets of the borrower Bloomberg 14.68 1.69 10 18.53 LenderROA Net income to total assets of the lending bank Bloomberg 4.92 0.97 -3.20 2.88 LenderSize Logarithm of total assets of the lending bank Bloomberg 18.76 1.47 14.84 20.41 LenderLeverage Total equity to total assets of the lending bank Bloomberg 11.46 3.21 6.02 26
LenderOpacity
Index of opacity. The first input into the index is the natural logarithm of the average daily IDR volume during the fiscal year. The second input is the bid-ask spread measured as the difference between the ask and the bid price. We associate for each component the value of one for the first decile, the value of two for the second decile and so on. We then sum these two components and we divide it by two to scale our composite index. It ranges in principle from one to ten.
Bloomberg
4.05
2.52
1
10
This table defines the variables and reports summary statistic over the period of analysis. All variables are expressed in percentage except TenureYear, BorrowerSize, LenderSize, LenderOpacity and dummy variables.
29
Table 4. Cumulative abnormal returns surrounding the loan announcement Event windows Mean (%) Wilcoxon Test t-Test Observations (Days) (z-probability) (t-statistic)
Panel A: All Sample [-1,+1] -0,19 0.01** -1.19 342 [-2,+2] -0,30 0.01** -1.90* 342 [-3,+3] -0,46 0.00*** -2.26** 342 Lenders with low levels of related loans [-1,+1] -0,09 0.13 -0.37 164 [-2,+2] -0,4 0.06* -1.73* 164 [-3,+3] -0,45 0.13 -1.32 164 Lenders with high levels of related loans [-1,+1] -0,27 0.04** -1.36 178 [-2,+2] -0,20 0.10 -0.95 178 [-3,+3] -0,48 0.00*** -1.97** 178
Panel B: State-owned banks [-1,+1] -0.29 0.03** -1.64 211 [-2,+2] -0.44 0.01** -2.32** 211 [-3,+3] -0.45 0.05* -1.80* 211 With low levels of related loans [-1,+1] -0.49 0.04** -2.08** 108 [-2,+2] -0.71 0.01** -2.62** 108 [-3,+3] -0.55 0.20 -1.46 108 With high levels of related loans [-1,+1] -0.09 0.34 -0.34 103 [-2,+2] -0.16 0.34 -0.62 103 [-3,+3] -0.34 0.14 -1.06 103
Panel C: Family-owned banks [-1,+1] -0.01 0.17 -0.05 131 [-2,+2] -0.05 0.34 -0.22 131 [-3,+3] -0.48 0.02** -1.37 131 With low levels of related loans [-1,+1] 0.67 0.91 1.24 56 [-2,+2] 0.19 0.98 0.45 56 [-3,+3] -0.24 0.47 -0.36 56 With high levels of related loans [-1,+1] -0.53 0.05* -1.74* 75 [-2,+2] -0.25 0.16 -0.72 75 [-3,+3] -0.66 0.01** -1.83* 75
This table reports the average Cumulative Abnormal Return (CARs) for loan announcements for different estimation windows on the overall sample (Panel A), for state-owned banks (Panel B) and for family-owned banks (Panel C). CARs are computed for the three event windows [-1, +1], [-2, +2] and [-3, +3]. We use the sample median value of the lagged ratio related loans total loans (RelatedLoans1) to distinguish banks with relatively low and high levels of related loans. Significance of average CARs is tested with: (1) the Wilcoxon test (1945) that uses a median test of the null hypothesis to check if the mean return is not unduly influenced by outlier returns; and (2) the standard cross-sectional t-statistic that tests if the average CARs over any given time interval are equal to zero. The asterisks (***), (**) and (*) denote significance at the 0.01, 0.05 and 0.1 levels, respectively.
30
Table 5. Impact of government ownership of banks on cumulative abnormal returns CARs
[-2,+2] CARs [-2,+2]
CARs [-2,+2]
CARs [-2,+2]
(1) (2) (3) (4) RelatedLoans1 (β1) -0.008 -0.165*** (-0.38) (-3.00) RelatedLoans2 (β1) -0.019 -0.247*** (-0.58) (-3.26) RelatedLoans1*DLenderGvtOwned (β2) 0.168*** (2.89) RelatedLoans2*DLenderGvtOwned (β2) 0.244*** (3.06) DLenderGvtOwned -0.007* -0.008** -0.007* -0.008** (-2.06) (-2.47) (-1.99) (-2.35) LoanSize -0.001 -0.001 -0.001 -0.001 (-0.52) (-0.53) (-0.52) (-0.53) TenureYear -0.001* -0.001* -0.001* -0.001* (-1.80) (-1.93) (-1.80) (-1.92) InterestRate -0.000 -0.000 -0.000 -0.000 (-0.08) (-0.13) (-0.06) (-0.09) BorrowerROA -0.000 -0.000 -0.000 -0.000 (-1.71) (-1.67) (-1.71) (-1.69) BorrowerLeverage -0.000** -0.000** -0.000** -0.000** (-2.33) (-2.38) (-2.33) (-2.38) BorrowerSize 0.001 0.001 0.001 0.001 (0.79) (0.73) (0.80) (0.76) LenderROA 0.003* 0.003* 0.003* 0.003* (1.99) (2.02) (2.03) (2.03) LenderLeverage 0.039 0.035 0.039 0.036 (1.15) (1.04) (1.14) (1.10) LenderSize 0.001 0.001 0.001 0.001 (0.50) (0.36) (0.50) (0.38) LenderOpacity -0.001 -0.000 -0.001 -0.000 (-0.35) (-0.31) (-0.35) (-0.31) Constant -0.021 -0.013 -0.021 -0.015 (-0.43) (-0.27) (-0.43) (-0.30) Wald Tests β1+ β2 = 0 -0.0025 -0.0024 (-0.11) (-0.07) Nbr. Of obs. 342 342 342 342 Adjusted R-Squared 0.0261 0.0319 0.0267 0.0316
This table reports ordinary least square estimations of Cumulative Abnormal Returns (CARs) on the proportion of related loans and the type of banks (state- vs. family-owned). We examine whether government ownership affects the market valuation of banks by considering the likelihood of expropriation as measured by the importance of related loans, and by using family-owned banks as a benchmark against which to assess the valuation effect of loan announcements for state-owned banks. Relatedloan1 is the ratio of related loans to total loans. CARs are computed on the event window [-2, +2]. Relatedloan2 is the ratio of related loan and total asset. The dummy variable DLenderGvtOwned takes value of one for loan contracts when the lending bank is state-owned, and zero otherwise.. All variables are defined in Table 3. The t-statistics are in parentheses, with *, **, and *** denoting significance at 10%, 5% and 1% levels.
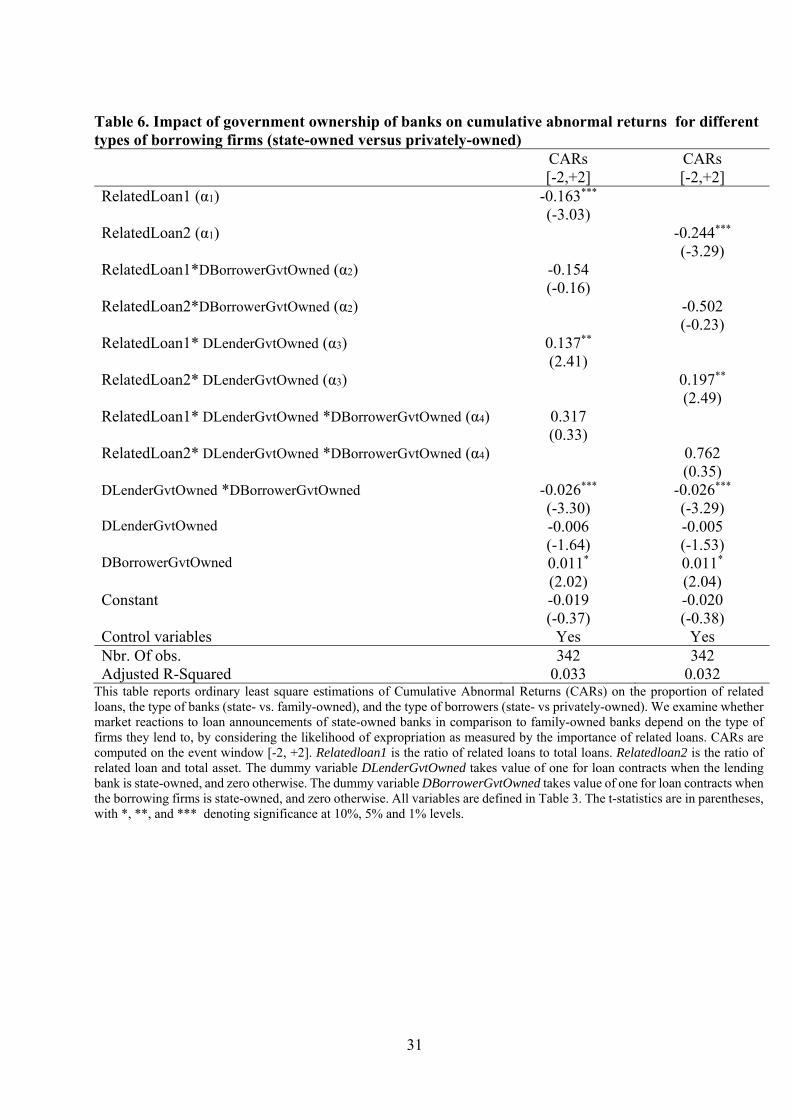
31
Table 6. Impact of government ownership of banks on cumulative abnormal returns for different types of borrowing firms (state-owned versus privately-owned) CARs
[-2,+2] CARs [-2,+2]
RelatedLoan1 (α1) -0.163*** (-3.03) RelatedLoan2 (α1) -0.244*** (-3.29) RelatedLoan1*DBorrowerGvtOwned (α2) -0.154 (-0.16) RelatedLoan2*DBorrowerGvtOwned (α2) -0.502 (-0.23) RelatedLoan1* DLenderGvtOwned (α3) 0.137** (2.41) RelatedLoan2* DLenderGvtOwned (α3) 0.197** (2.49) RelatedLoan1* DLenderGvtOwned *DBorrowerGvtOwned (α4) 0.317 (0.33) RelatedLoan2* DLenderGvtOwned *DBorrowerGvtOwned (α4) 0.762 (0.35) DLenderGvtOwned *DBorrowerGvtOwned -0.026*** -0.026*** (-3.30) (-3.29) DLenderGvtOwned -0.006 -0.005 (-1.64) (-1.53) DBorrowerGvtOwned 0.011* 0.011* (2.02) (2.04) Constant -0.019 -0.020 (-0.37) (-0.38) Control variables Yes Yes Nbr. Of obs. 342 342 Adjusted R-Squared 0.033 0.032
This table reports ordinary least square estimations of Cumulative Abnormal Returns (CARs) on the proportion of related loans, the type of banks (state- vs. family-owned), and the type of borrowers (state- vs privately-owned). We examine whether market reactions to loan announcements of state-owned banks in comparison to family-owned banks depend on the type of firms they lend to, by considering the likelihood of expropriation as measured by the importance of related loans. CARs are computed on the event window [-2, +2]. Relatedloan1 is the ratio of related loans to total loans. Relatedloan2 is the ratio of related loan and total asset. The dummy variable DLenderGvtOwned takes value of one for loan contracts when the lending bank is state-owned, and zero otherwise. The dummy variable DBorrowerGvtOwned takes value of one for loan contracts when the borrowing firms is state-owned, and zero otherwise. All variables are defined in Table 3. The t-statistics are in parentheses, with *, **, and *** denoting significance at 10%, 5% and 1% levels.
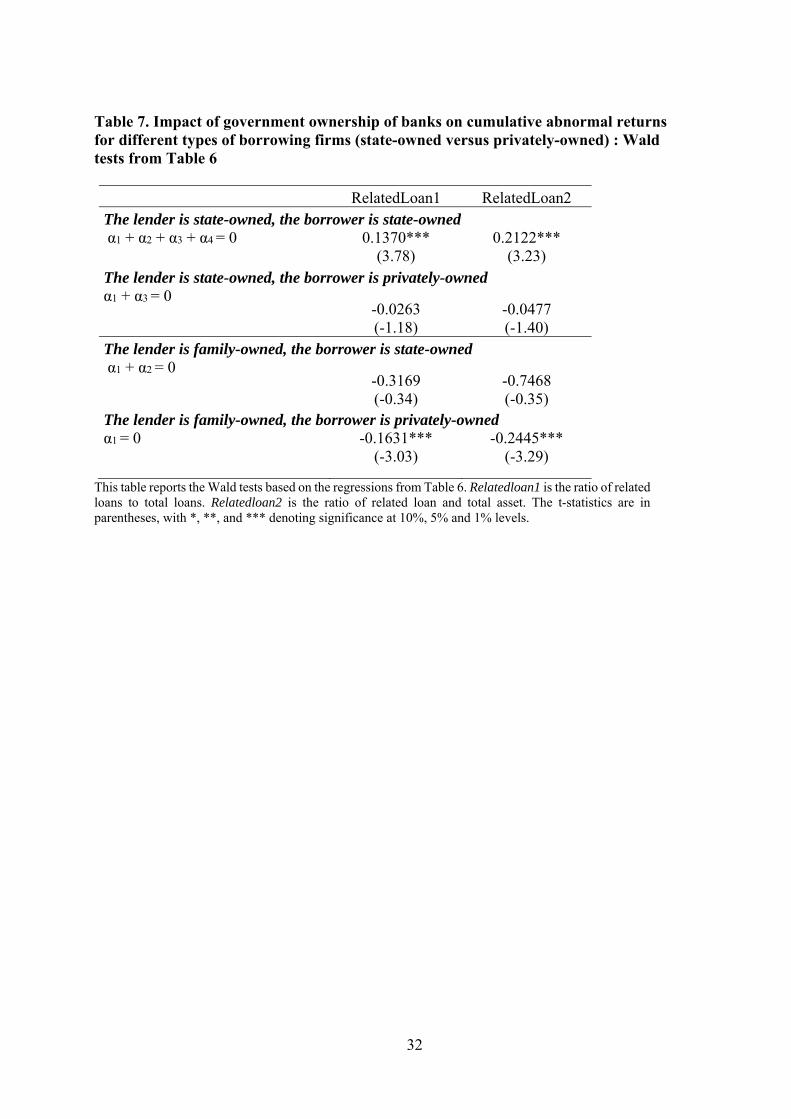
32
Table 7. Impact of government ownership of banks on cumulative abnormal returns for different types of borrowing firms (state-owned versus privately-owned) : Wald tests from Table 6
RelatedLoan1 RelatedLoan2 The lender is state-owned, the borrower is state-owned α1 + α2 + α3 + α4 = 0
0.1370*** (3.78)
0.2122*** (3.23)
The lender is state-owned, the borrower is privately-ownedα1 + α3 = 0
-0.0263 (-1.18)
-0.0477 (-1.40)
The lender is family-owned, the borrower is state-owned α1 + α2 = 0
-0.3169 (-0.34)
-0.7468 (-0.35)
The lender is family-owned, the borrower is privately-ownedα1 = 0
-0.1631*** (-3.03)
-0.2445*** (-3.29)
This table reports the Wald tests based on the regressions from Table 6. Relatedloan1 is the ratio of related loans to total loans. Relatedloan2 is the ratio of related loan and total asset. The t-statistics are in parentheses, with *, **, and *** denoting significance at 10%, 5% and 1% levels.
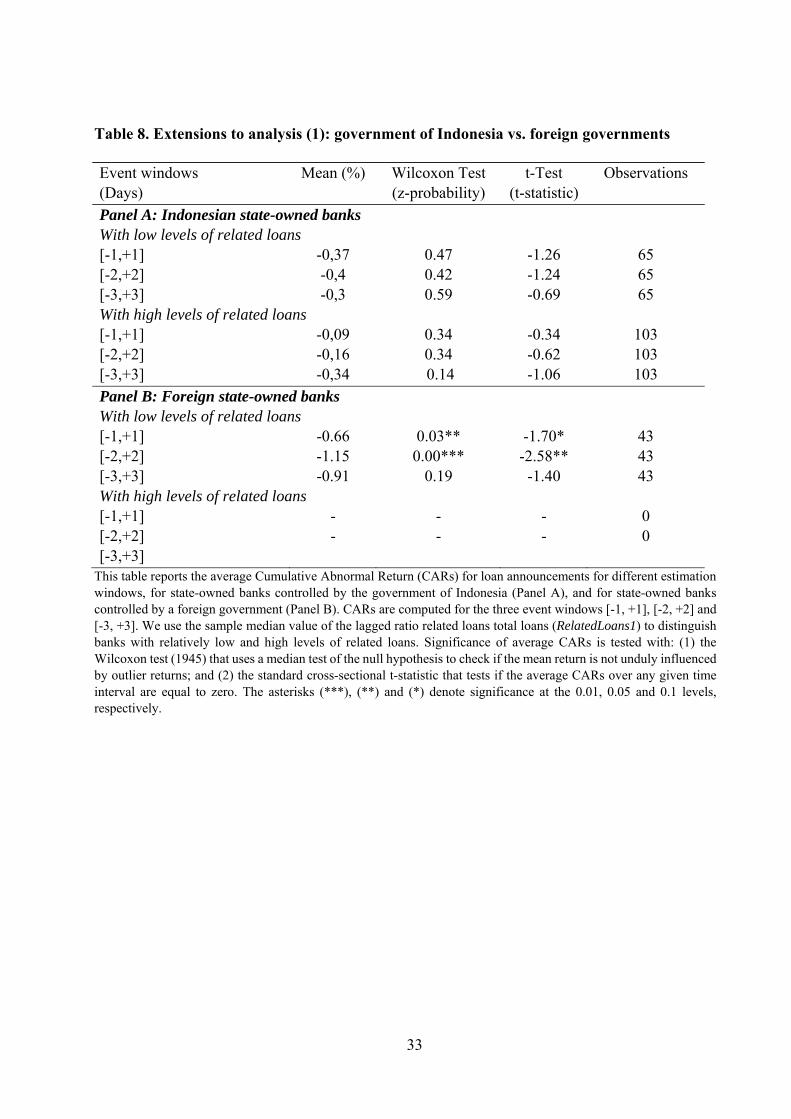
33
Table 8. Extensions to analysis (1): government of Indonesia vs. foreign governments Event windows Mean (%) Wilcoxon Test t-Test Observations (Days) (z-probability) (t-statistic)
Panel A: Indonesian state-owned banks With low levels of related loans [-1,+1] -0,37 0.47 -1.26 65 [-2,+2] -0,4 0.42 -1.24 65 [-3,+3] -0,3 0.59 -0.69 65 With high levels of related loans [-1,+1] -0,09 0.34 -0.34 103 [-2,+2] -0,16 0.34 -0.62 103 [-3,+3] -0,34 0.14 -1.06 103
Panel B: Foreign state-owned banks With low levels of related loans [-1,+1] -0.66 0.03** -1.70* 43 [-2,+2] -1.15 0.00*** -2.58** 43 [-3,+3] -0.91 0.19 -1.40 43 With high levels of related loans [-1,+1] - - - 0 [-2,+2] - - - 0 [-3,+3]
This table reports the average Cumulative Abnormal Return (CARs) for loan announcements for different estimation windows, for state-owned banks controlled by the government of Indonesia (Panel A), and for state-owned banks controlled by a foreign government (Panel B). CARs are computed for the three event windows [-1, +1], [-2, +2] and [-3, +3]. We use the sample median value of the lagged ratio related loans total loans (RelatedLoans1) to distinguish banks with relatively low and high levels of related loans. Significance of average CARs is tested with: (1) the Wilcoxon test (1945) that uses a median test of the null hypothesis to check if the mean return is not unduly influenced by outlier returns; and (2) the standard cross-sectional t-statistic that tests if the average CARs over any given time interval are equal to zero. The asterisks (***), (**) and (*) denote significance at the 0.01, 0.05 and 0.1 levels, respectively.
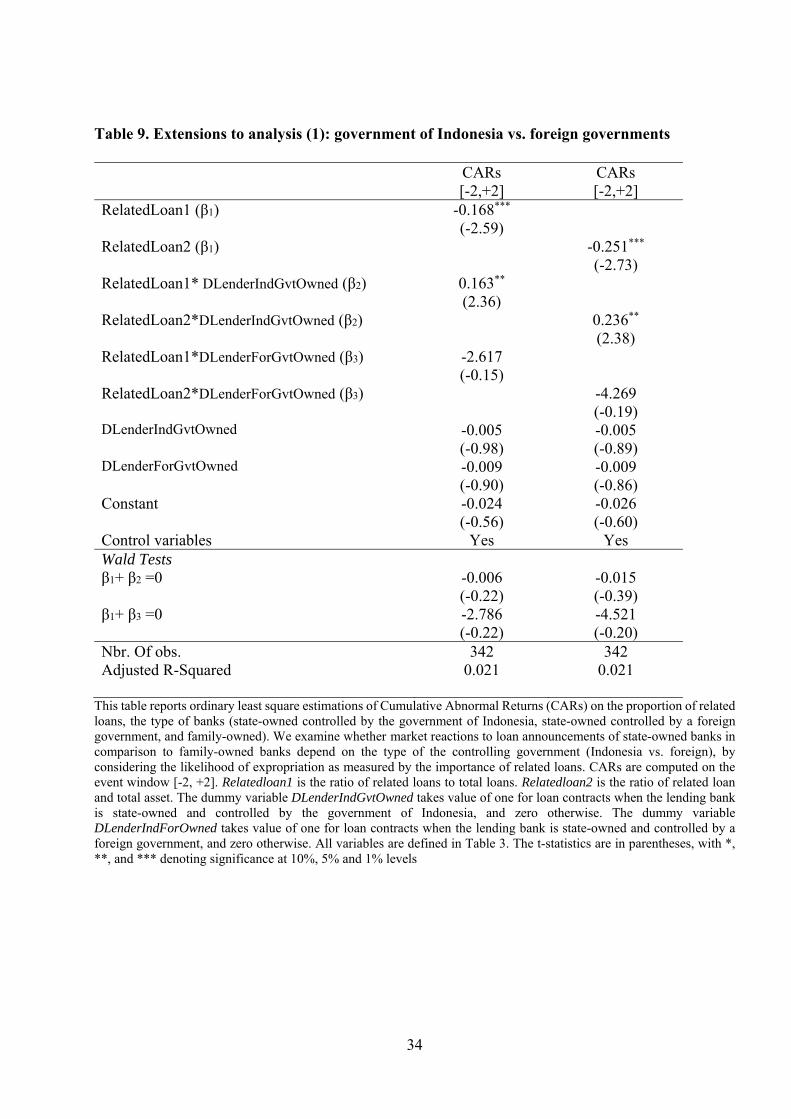
34
Table 9. Extensions to analysis (1): government of Indonesia vs. foreign governments CARs
[-2,+2] CARs [-2,+2]
RelatedLoan1 (β1) -0.168*** (-2.59) RelatedLoan2 (β1) -0.251*** (-2.73) RelatedLoan1* DLenderIndGvtOwned (β2) 0.163** (2.36) RelatedLoan2*DLenderIndGvtOwned (β2) 0.236** (2.38) RelatedLoan1*DLenderForGvtOwned (β3) -2.617 (-0.15) RelatedLoan2*DLenderForGvtOwned (β3) -4.269 (-0.19) DLenderIndGvtOwned -0.005 -0.005 (-0.98) (-0.89) DLenderForGvtOwned -0.009 -0.009 (-0.90) (-0.86) Constant -0.024 -0.026 (-0.56) (-0.60) Control variables Yes Yes Wald Tests β1+ β2 =0 -0.006 -0.015 (-0.22) (-0.39) β1+ β3 =0 -2.786 -4.521 (-0.22) (-0.20) Nbr. Of obs. 342 342 Adjusted R-Squared 0.021 0.021
This table reports ordinary least square estimations of Cumulative Abnormal Returns (CARs) on the proportion of related loans, the type of banks (state-owned controlled by the government of Indonesia, state-owned controlled by a foreign government, and family-owned). We examine whether market reactions to loan announcements of state-owned banks in comparison to family-owned banks depend on the type of the controlling government (Indonesia vs. foreign), by considering the likelihood of expropriation as measured by the importance of related loans. CARs are computed on the event window [-2, +2]. Relatedloan1 is the ratio of related loans to total loans. Relatedloan2 is the ratio of related loan and total asset. The dummy variable DLenderIndGvtOwned takes value of one for loan contracts when the lending bank is state-owned and controlled by the government of Indonesia, and zero otherwise. The dummy variable DLenderIndForOwned takes value of one for loan contracts when the lending bank is state-owned and controlled by a foreign government, and zero otherwise. All variables are defined in Table 3. The t-statistics are in parentheses, with *, **, and *** denoting significance at 10%, 5% and 1% levels
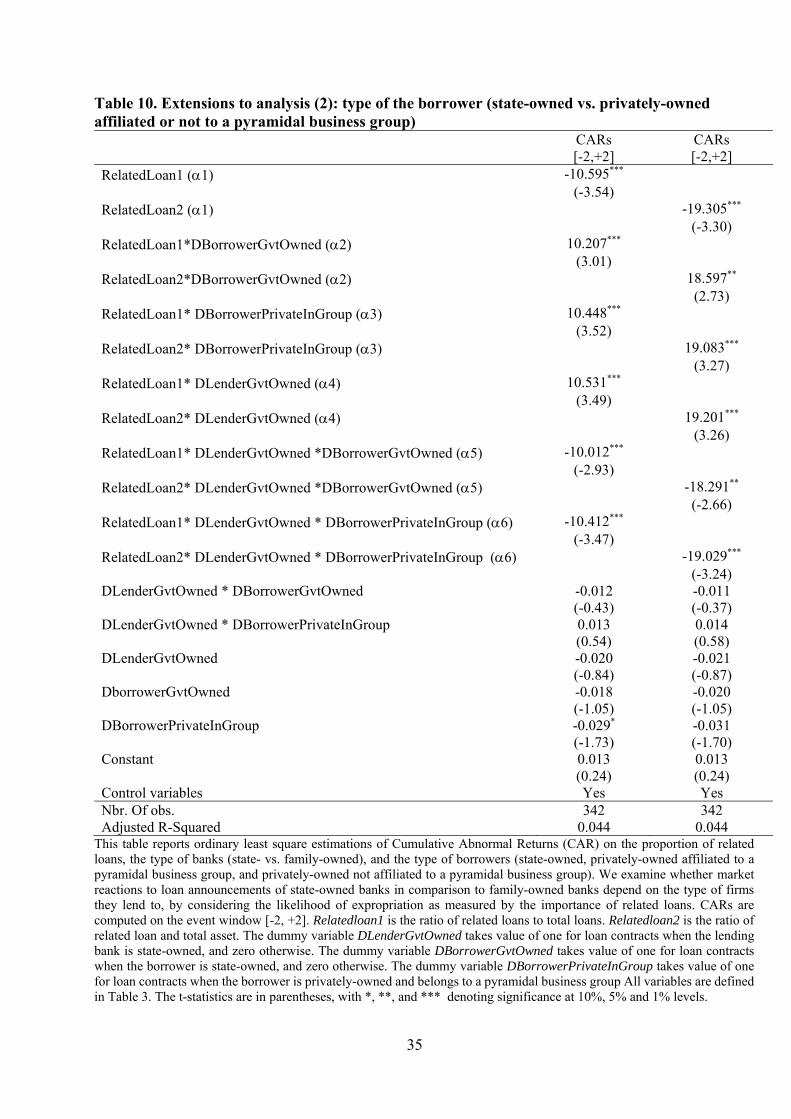
35
Table 10. Extensions to analysis (2): type of the borrower (state-owned vs. privately-owned affiliated or not to a pyramidal business group) CARs
[-2,+2] CARs [-2,+2]
RelatedLoan1 (1) -10.595*** (-3.54) RelatedLoan2 (1) -19.305*** (-3.30) RelatedLoan1*DBorrowerGvtOwned (2) 10.207*** (3.01) RelatedLoan2*DBorrowerGvtOwned (2) 18.597** (2.73) RelatedLoan1* DBorrowerPrivateInGroup (3) 10.448*** (3.52) RelatedLoan2* DBorrowerPrivateInGroup (3) 19.083*** (3.27) RelatedLoan1* DLenderGvtOwned (4) 10.531*** (3.49) RelatedLoan2* DLenderGvtOwned (4) 19.201*** (3.26) RelatedLoan1* DLenderGvtOwned *DBorrowerGvtOwned (5) -10.012*** (-2.93) RelatedLoan2* DLenderGvtOwned *DBorrowerGvtOwned (5) -18.291** (-2.66) RelatedLoan1* DLenderGvtOwned * DBorrowerPrivateInGroup (6) -10.412*** (-3.47) RelatedLoan2* DLenderGvtOwned * DBorrowerPrivateInGroup (6) -19.029*** (-3.24) DLenderGvtOwned * DBorrowerGvtOwned -0.012 -0.011 (-0.43) (-0.37) DLenderGvtOwned * DBorrowerPrivateInGroup 0.013 0.014 (0.54) (0.58) DLenderGvtOwned -0.020 -0.021 (-0.84) (-0.87) DborrowerGvtOwned -0.018 -0.020 (-1.05) (-1.05) DBorrowerPrivateInGroup -0.029* -0.031 (-1.73) (-1.70) Constant 0.013 0.013 (0.24) (0.24) Control variables Yes Yes Nbr. Of obs. 342 342 Adjusted R-Squared 0.044 0.044
This table reports ordinary least square estimations of Cumulative Abnormal Returns (CAR) on the proportion of related loans, the type of banks (state- vs. family-owned), and the type of borrowers (state-owned, privately-owned affiliated to a pyramidal business group, and privately-owned not affiliated to a pyramidal business group). We examine whether market reactions to loan announcements of state-owned banks in comparison to family-owned banks depend on the type of firms they lend to, by considering the likelihood of expropriation as measured by the importance of related loans. CARs are computed on the event window [-2, +2]. Relatedloan1 is the ratio of related loans to total loans. Relatedloan2 is the ratio of related loan and total asset. The dummy variable DLenderGvtOwned takes value of one for loan contracts when the lending bank is state-owned, and zero otherwise. The dummy variable DBorrowerGvtOwned takes value of one for loan contracts when the borrower is state-owned, and zero otherwise. The dummy variable DBorrowerPrivateInGroup takes value of one for loan contracts when the borrower is privately-owned and belongs to a pyramidal business group All variables are defined in Table 3. The t-statistics are in parentheses, with *, **, and *** denoting significance at 10%, 5% and 1% levels.
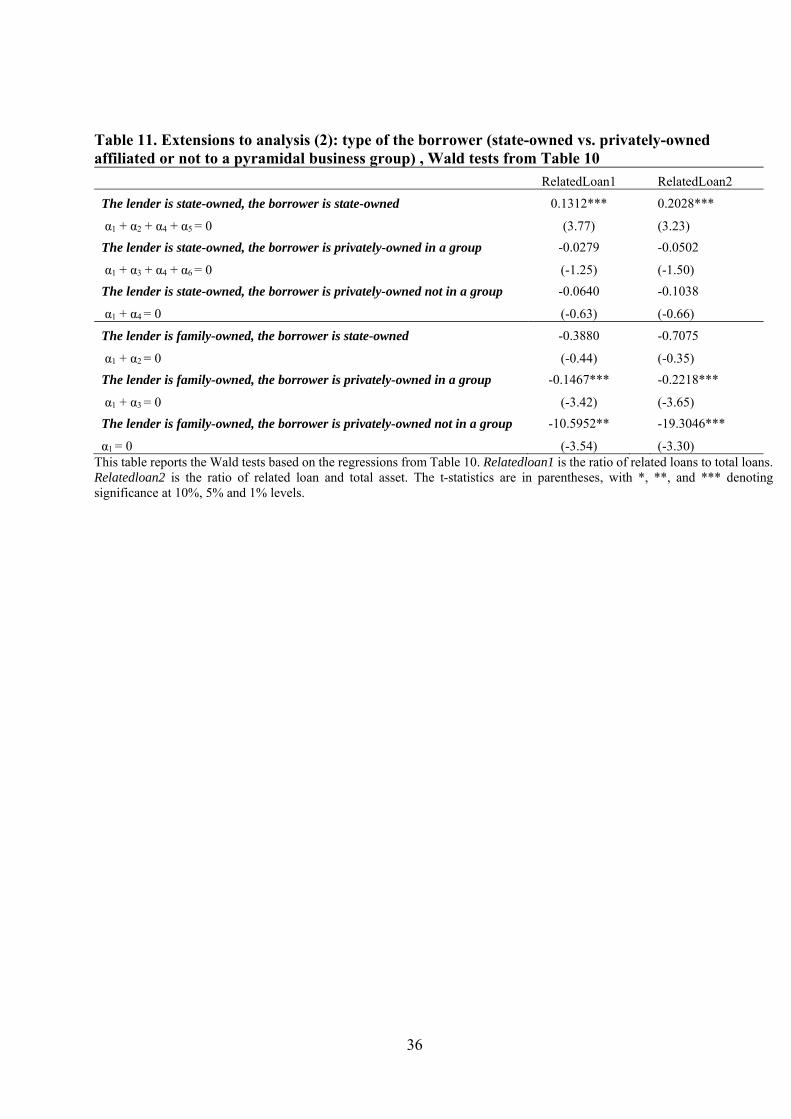
36
Table 11. Extensions to analysis (2): type of the borrower (state-owned vs. privately-owned affiliated or not to a pyramidal business group) , Wald tests from Table 10
RelatedLoan1 RelatedLoan2
The lender is state-owned, the borrower is state-owned 0.1312*** 0.2028***
α1 + α2 + α4 + α5 = 0 (3.77) (3.23)
The lender is state-owned, the borrower is privately-owned in a group -0.0279 -0.0502
α1 + α3 + α4 + α6 = 0 (-1.25) (-1.50)
The lender is state-owned, the borrower is privately-owned not in a group -0.0640 -0.1038
α1 + α4 = 0 (-0.63) (-0.66)
The lender is family-owned, the borrower is state-owned -0.3880 -0.7075
α1 + α2 = 0 (-0.44) (-0.35)
The lender is family-owned, the borrower is privately-owned in a group -0.1467*** -0.2218***
α1 + α3 = 0 (-3.42) (-3.65)
The lender is family-owned, the borrower is privately-owned not in a group -10.5952** -19.3046***
α1 = 0 (-3.54) (-3.30) This table reports the Wald tests based on the regressions from Table 10. Relatedloan1 is the ratio of related loans to total loans. Relatedloan2 is the ratio of related loan and total asset. The t-statistics are in parentheses, with *, **, and *** denoting significance at 10%, 5% and 1% levels.
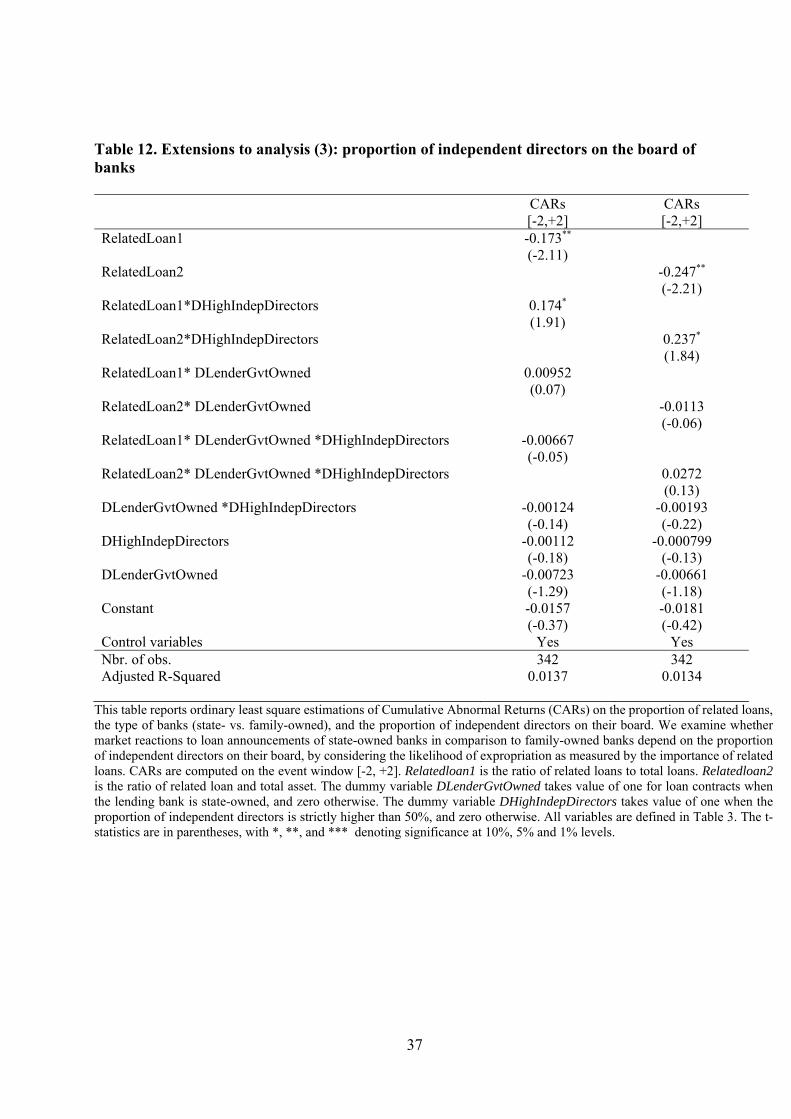
37
Table 12. Extensions to analysis (3): proportion of independent directors on the board of banks CARs
[-2,+2] CARs [-2,+2]
RelatedLoan1 -0.173** (-2.11) RelatedLoan2 -0.247** (-2.21) RelatedLoan1*DHighIndepDirectors 0.174* (1.91) RelatedLoan2*DHighIndepDirectors 0.237* (1.84) RelatedLoan1* DLenderGvtOwned 0.00952 (0.07) RelatedLoan2* DLenderGvtOwned -0.0113 (-0.06) RelatedLoan1* DLenderGvtOwned *DHighIndepDirectors -0.00667 (-0.05) RelatedLoan2* DLenderGvtOwned *DHighIndepDirectors 0.0272 (0.13) DLenderGvtOwned *DHighIndepDirectors -0.00124 -0.00193 (-0.14) (-0.22) DHighIndepDirectors -0.00112 -0.000799 (-0.18) (-0.13) DLenderGvtOwned -0.00723 -0.00661 (-1.29) (-1.18) Constant -0.0157 -0.0181 (-0.37) (-0.42) Control variables Yes Yes Nbr. of obs. 342 342 Adjusted R-Squared 0.0137 0.0134
This table reports ordinary least square estimations of Cumulative Abnormal Returns (CARs) on the proportion of related loans, the type of banks (state- vs. family-owned), and the proportion of independent directors on their board. We examine whether market reactions to loan announcements of state-owned banks in comparison to family-owned banks depend on the proportion of independent directors on their board, by considering the likelihood of expropriation as measured by the importance of related loans. CARs are computed on the event window [-2, +2]. Relatedloan1 is the ratio of related loans to total loans. Relatedloan2 is the ratio of related loan and total asset. The dummy variable DLenderGvtOwned takes value of one for loan contracts when the lending bank is state-owned, and zero otherwise. The dummy variable DHighIndepDirectors takes value of one when the proportion of independent directors is strictly higher than 50%, and zero otherwise. All variables are defined in Table 3. The t-statistics are in parentheses, with *, **, and *** denoting significance at 10%, 5% and 1% levels.
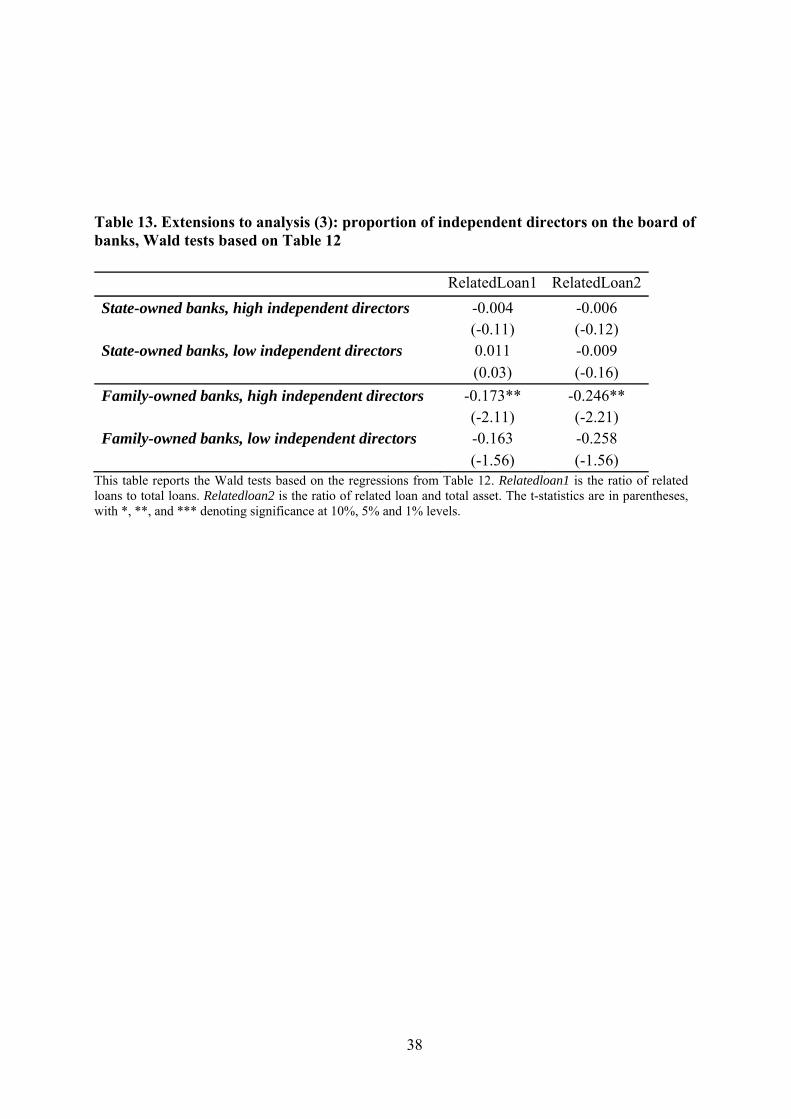
38
Table 13. Extensions to analysis (3): proportion of independent directors on the board of banks, Wald tests based on Table 12
RelatedLoan1 RelatedLoan2
State-owned banks, high independent directors -0.004 -0.006
(-0.11) (-0.12) State-owned banks, low independent directors 0.011 -0.009
(0.03) (-0.16)
Family-owned banks, high independent directors -0.173** -0.246**
(-2.11) (-2.21) Family-owned banks, low independent directors -0.163 -0.258
(-1.56) (-1.56) This table reports the Wald tests based on the regressions from Table 12. Relatedloan1 is the ratio of related loans to total loans. Relatedloan2 is the ratio of related loan and total asset. The t-statistics are in parentheses, with *, **, and *** denoting significance at 10%, 5% and 1% levels.
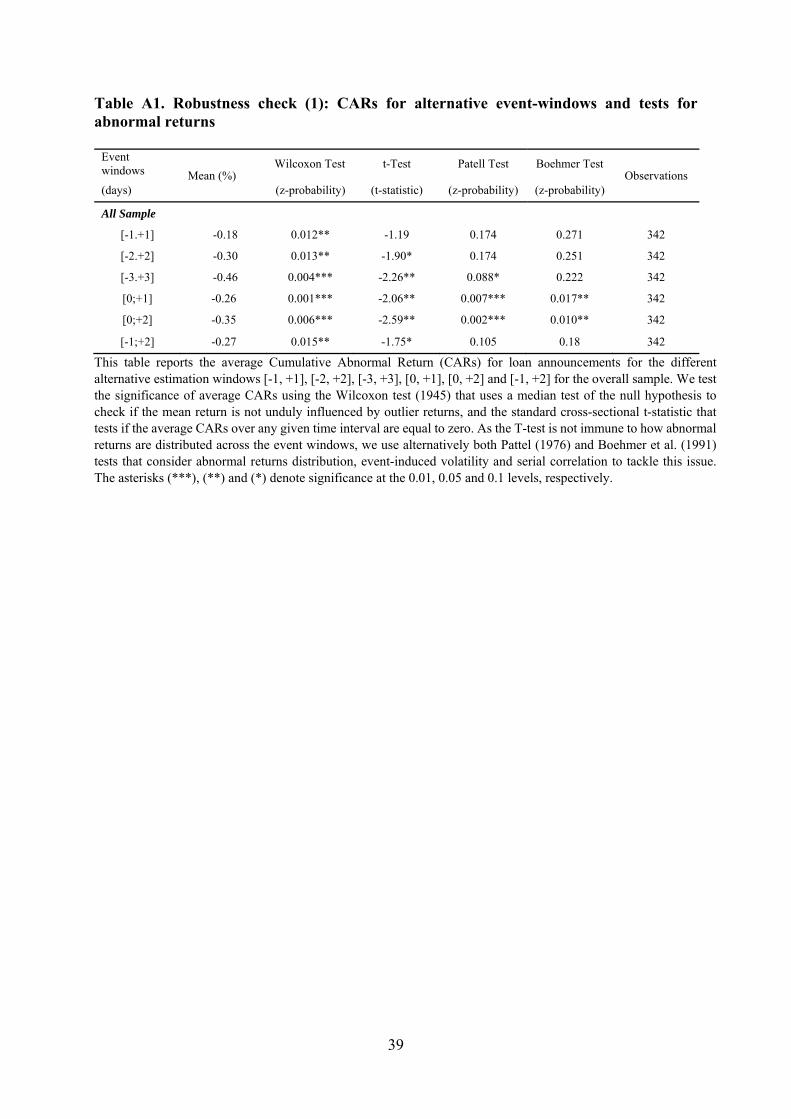
39
Table A1. Robustness check (1): CARs for alternative event-windows and tests for abnormal returns
Event windows Mean (%)
Wilcoxon Test t-Test Patell Test Boehmer Test Observations
(days) (z-probability) (t-statistic) (z-probability) (z-probability)
All Sample
[-1.+1] -0.18 0.012** -1.19 0.174 0.271 342
[-2.+2] -0.30 0.013** -1.90* 0.174 0.251 342
[-3.+3] -0.46 0.004*** -2.26** 0.088* 0.222 342
[0;+1] -0.26 0.001*** -2.06** 0.007*** 0.017** 342
[0;+2] -0.35 0.006*** -2.59** 0.002*** 0.010** 342
[-1;+2] -0.27 0.015** -1.75* 0.105 0.18 342
This table reports the average Cumulative Abnormal Return (CARs) for loan announcements for the different alternative estimation windows [-1, +1], [-2, +2], [-3, +3], [0, +1], [0, +2] and [-1, +2] for the overall sample. We test the significance of average CARs using the Wilcoxon test (1945) that uses a median test of the null hypothesis to check if the mean return is not unduly influenced by outlier returns, and the standard cross-sectional t-statistic that tests if the average CARs over any given time interval are equal to zero. As the T-test is not immune to how abnormal returns are distributed across the event windows, we use alternatively both Pattel (1976) and Boehmer et al. (1991) tests that consider abnormal returns distribution, event-induced volatility and serial correlation to tackle this issue. The asterisks (***), (**) and (*) denote significance at the 0.01, 0.05 and 0.1 levels, respectively.
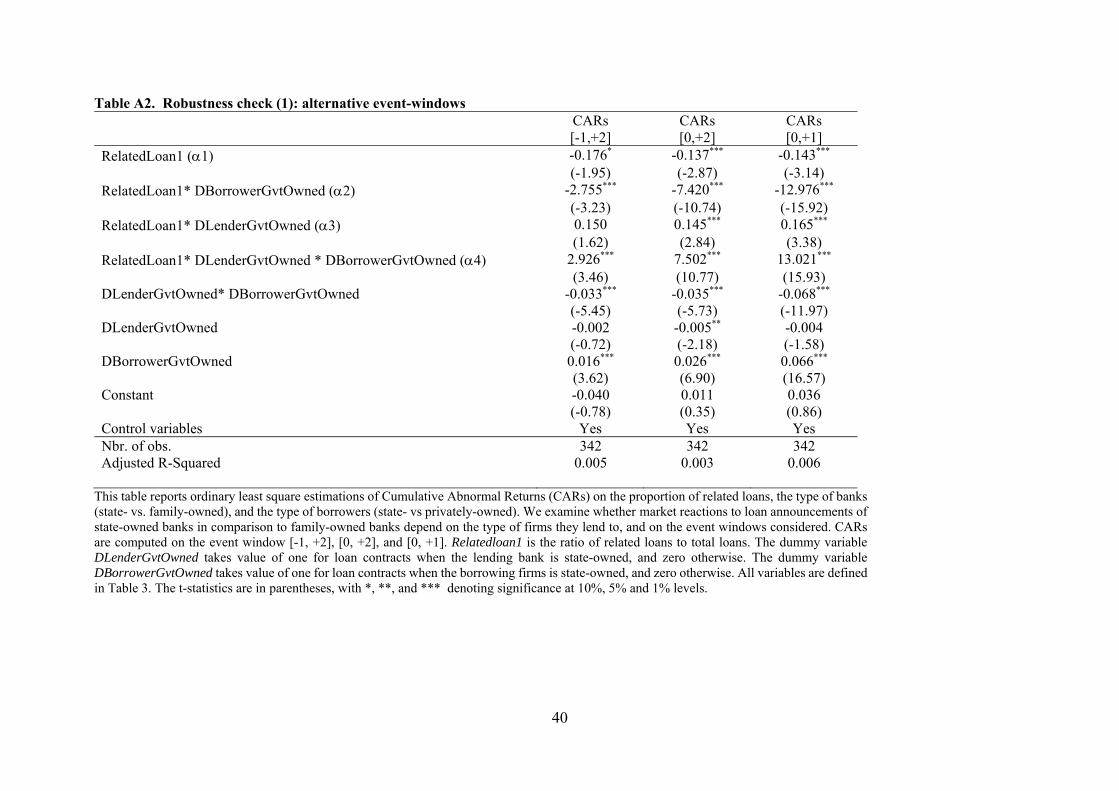
40
Table A2. Robustness check (1): alternative event-windows CARs
[-1,+2] CARs [0,+2]
CARs [0,+1]
RelatedLoan1 (1) -0.176* -0.137*** -0.143*** (-1.95) (-2.87) (-3.14) RelatedLoan1* DBorrowerGvtOwned (2) -2.755*** -7.420*** -12.976*** (-3.23) (-10.74) (-15.92) RelatedLoan1* DLenderGvtOwned (3) 0.150 0.145*** 0.165*** (1.62) (2.84) (3.38) RelatedLoan1* DLenderGvtOwned * DBorrowerGvtOwned (4) 2.926*** 7.502*** 13.021*** (3.46) (10.77) (15.93) DLenderGvtOwned* DBorrowerGvtOwned -0.033*** -0.035*** -0.068*** (-5.45) (-5.73) (-11.97) DLenderGvtOwned -0.002 -0.005** -0.004 (-0.72) (-2.18) (-1.58) DBorrowerGvtOwned 0.016*** 0.026*** 0.066*** (3.62) (6.90) (16.57) Constant -0.040 0.011 0.036 (-0.78) (0.35) (0.86) Control variables Yes Yes Yes Nbr. of obs. 342 342 342 Adjusted R-Squared 0.005 0.003 0.006
This table reports ordinary least square estimations of Cumulative Abnormal Returns (CARs) on the proportion of related loans, the type of banks (state- vs. family-owned), and the type of borrowers (state- vs privately-owned). We examine whether market reactions to loan announcements of state-owned banks in comparison to family-owned banks depend on the type of firms they lend to, and on the event windows considered. CARs are computed on the event window [-1, +2], [0, +2], and [0, +1]. Relatedloan1 is the ratio of related loans to total loans. The dummy variable DLenderGvtOwned takes value of one for loan contracts when the lending bank is state-owned, and zero otherwise. The dummy variable DBorrowerGvtOwned takes value of one for loan contracts when the borrowing firms is state-owned, and zero otherwise. All variables are defined in Table 3. The t-statistics are in parentheses, with *, **, and *** denoting significance at 10%, 5% and 1% levels.
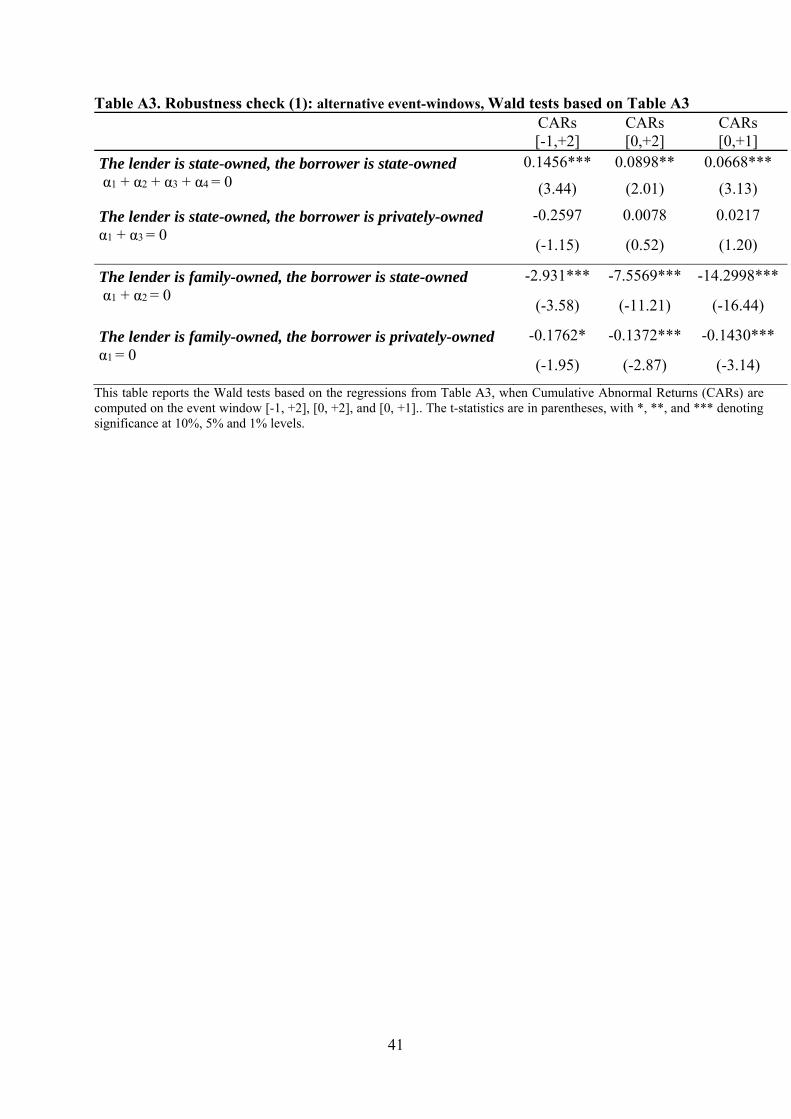
41
Table A3. Robustness check (1): alternative event-windows, Wald tests based on Table A3
CARs [-1,+2]
CARs [0,+2]
CARs [0,+1]
The lender is state-owned, the borrower is state-owned 0.1456*** 0.0898** 0.0668*** α1 + α2 + α3 + α4 = 0
(3.44) (2.01) (3.13)
The lender is state-owned, the borrower is privately-owned -0.2597 0.0078 0.0217 α1 + α3 = 0
(-1.15) (0.52) (1.20)
The lender is family-owned, the borrower is state-owned -2.931*** -7.5569*** -14.2998*** α1 + α2 = 0
(-3.58) (-11.21) (-16.44)
The lender is family-owned, the borrower is privately-owned -0.1762* -0.1372*** -0.1430*** α1 = 0
(-1.95) (-2.87) (-3.14)
This table reports the Wald tests based on the regressions from Table A3, when Cumulative Abnormal Returns (CARs) are computed on the event window [-1, +2], [0, +2], and [0, +1].. The t-statistics are in parentheses, with *, **, and *** denoting significance at 10%, 5% and 1% levels.
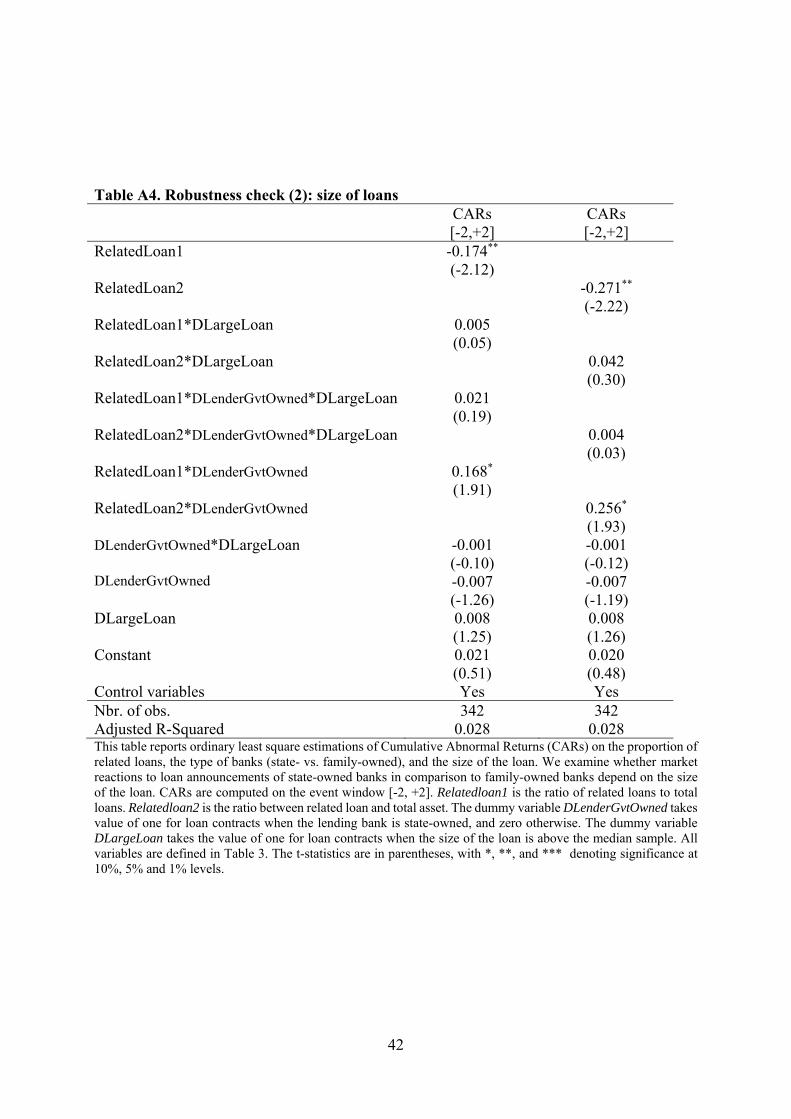
42
Table A4. Robustness check (2): size of loans CARs CARs [-2,+2] [-2,+2] RelatedLoan1 -0.174** (-2.12) RelatedLoan2 -0.271** (-2.22) RelatedLoan1*DLargeLoan 0.005 (0.05) RelatedLoan2*DLargeLoan 0.042 (0.30) RelatedLoan1*DLenderGvtOwned*DLargeLoan 0.021 (0.19) RelatedLoan2*DLenderGvtOwned*DLargeLoan 0.004 (0.03) RelatedLoan1*DLenderGvtOwned 0.168* (1.91) RelatedLoan2*DLenderGvtOwned 0.256* (1.93) DLenderGvtOwned*DLargeLoan -0.001 -0.001 (-0.10) (-0.12) DLenderGvtOwned -0.007 -0.007 (-1.26) (-1.19) DLargeLoan 0.008 0.008 (1.25) (1.26) Constant 0.021 0.020 (0.51) (0.48) Control variables Yes Yes Nbr. of obs. 342 342 Adjusted R-Squared 0.028 0.028 This table reports ordinary least square estimations of Cumulative Abnormal Returns (CARs) on the proportion of related loans, the type of banks (state- vs. family-owned), and the size of the loan. We examine whether market reactions to loan announcements of state-owned banks in comparison to family-owned banks depend on the size of the loan. CARs are computed on the event window [-2, +2]. Relatedloan1 is the ratio of related loans to total loans. Relatedloan2 is the ratio between related loan and total asset. The dummy variable DLenderGvtOwned takes value of one for loan contracts when the lending bank is state-owned, and zero otherwise. The dummy variable DLargeLoan takes the value of one for loan contracts when the size of the loan is above the median sample. All variables are defined in Table 3. The t-statistics are in parentheses, with *, **, and *** denoting significance at 10%, 5% and 1% levels.
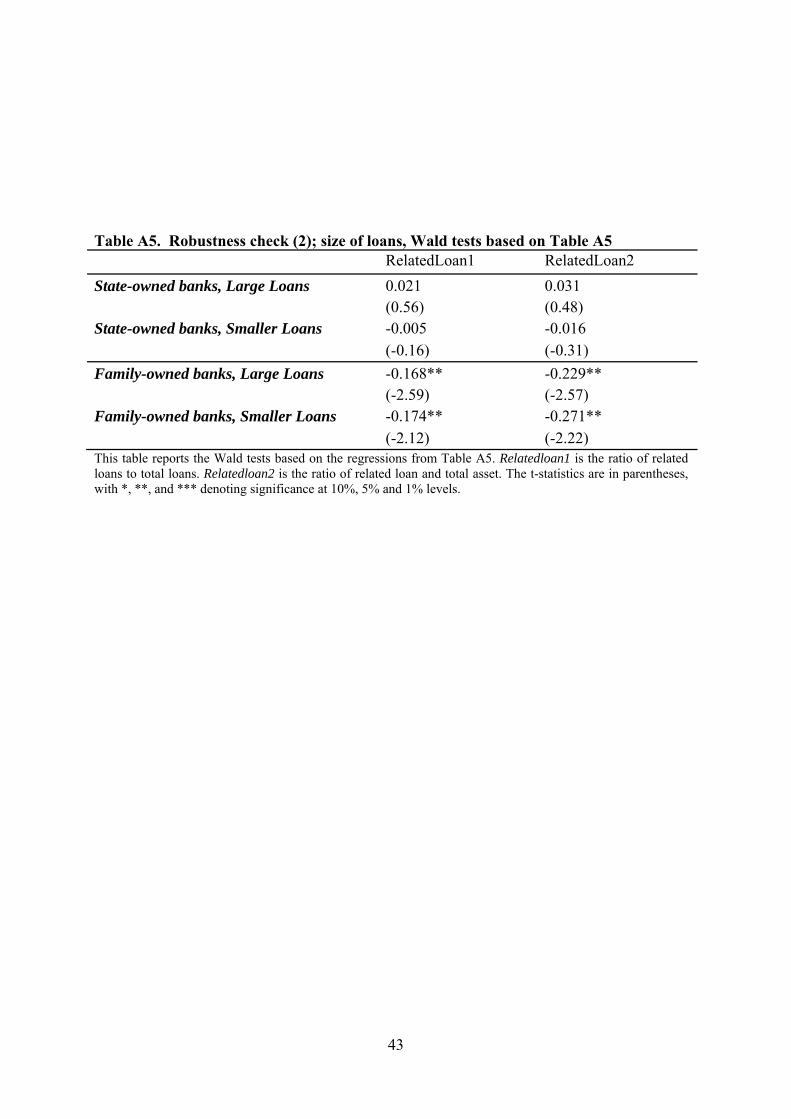
43
Table A5. Robustness check (2); size of loans, Wald tests based on Table A5 RelatedLoan1 RelatedLoan2
State-owned banks, Large Loans 0.021 0.031
(0.56) (0.48) State-owned banks, Smaller Loans -0.005 -0.016
(-0.16) (-0.31)
Family-owned banks, Large Loans -0.168** -0.229**
(-2.59) (-2.57) Family-owned banks, Smaller Loans -0.174** -0.271**
(-2.12) (-2.22) This table reports the Wald tests based on the regressions from Table A5. Relatedloan1 is the ratio of related loans to total loans. Relatedloan2 is the ratio of related loan and total asset. The t-statistics are in parentheses, with *, **, and *** denoting significance at 10%, 5% and 1% levels.
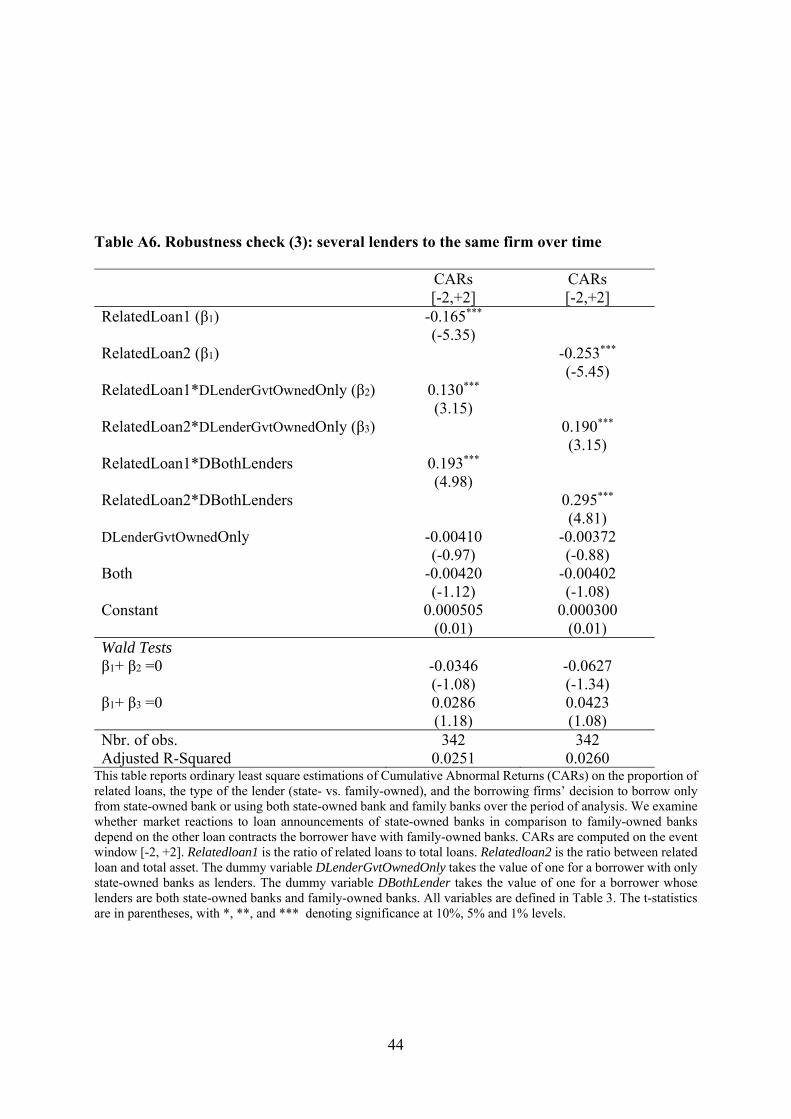
44
Table A6. Robustness check (3): several lenders to the same firm over time CARs
[-2,+2] CARs [-2,+2]
RelatedLoan1 (β1) -0.165*** (-5.35) RelatedLoan2 (β1) -0.253*** (-5.45) RelatedLoan1*DLenderGvtOwnedOnly (β2) 0.130*** (3.15) RelatedLoan2*DLenderGvtOwnedOnly (β3) 0.190*** (3.15) RelatedLoan1*DBothLenders 0.193*** (4.98) RelatedLoan2*DBothLenders 0.295*** (4.81) DLenderGvtOwnedOnly -0.00410 -0.00372 (-0.97) (-0.88) Both -0.00420 -0.00402 (-1.12) (-1.08) Constant 0.000505 0.000300 (0.01) (0.01) Wald Tests β1+ β2 =0 -0.0346 -0.0627 (-1.08) (-1.34) β1+ β3 =0 0.0286 0.0423 (1.18) (1.08) Nbr. of obs. 342 342 Adjusted R-Squared 0.0251 0.0260
This table reports ordinary least square estimations of Cumulative Abnormal Returns (CARs) on the proportion of related loans, the type of the lender (state- vs. family-owned), and the borrowing firms’ decision to borrow only from state-owned bank or using both state-owned bank and family banks over the period of analysis. We examine whether market reactions to loan announcements of state-owned banks in comparison to family-owned banks depend on the other loan contracts the borrower have with family-owned banks. CARs are computed on the event window [-2, +2]. Relatedloan1 is the ratio of related loans to total loans. Relatedloan2 is the ratio between related loan and total asset. The dummy variable DLenderGvtOwnedOnly takes the value of one for a borrower with only state-owned banks as lenders. The dummy variable DBothLender takes the value of one for a borrower whose lenders are both state-owned banks and family-owned banks. All variables are defined in Table 3. The t-statistics are in parentheses, with *, **, and *** denoting significance at 10%, 5% and 1% levels.
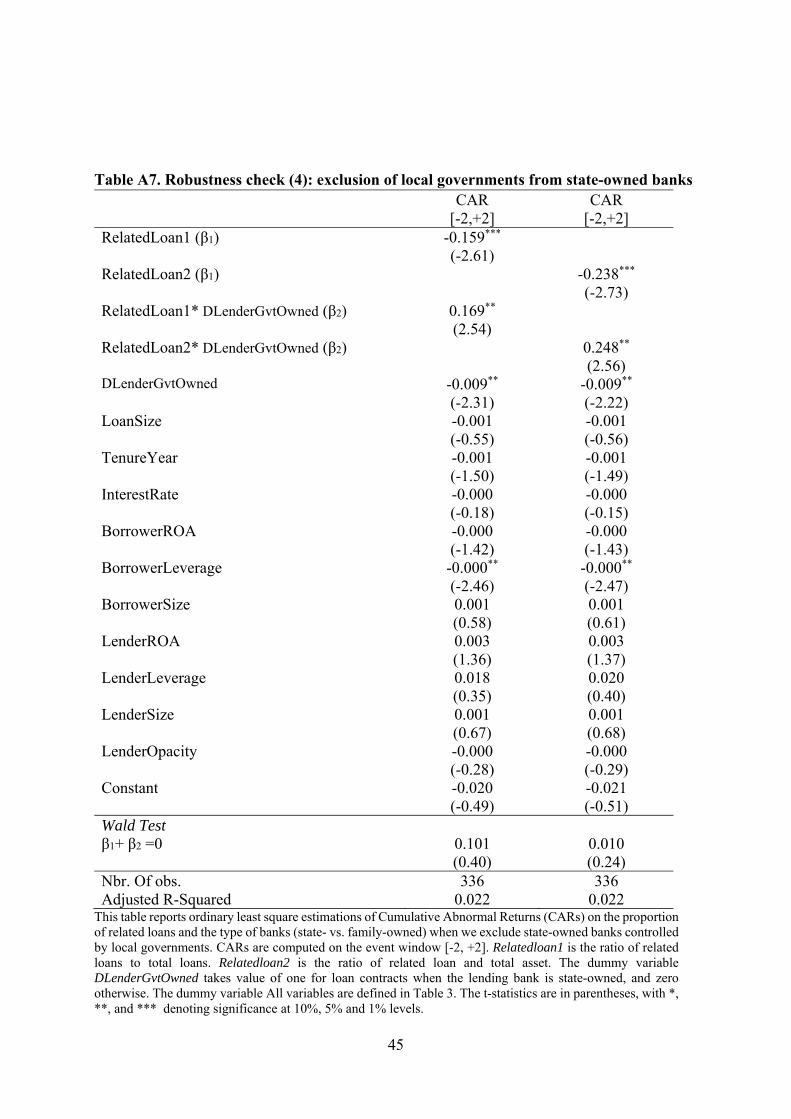
45
Table A7. Robustness check (4): exclusion of local governments from state-owned banks CAR
[-2,+2] CAR
[-2,+2] RelatedLoan1 (β1) -0.159*** (-2.61) RelatedLoan2 (β1) -0.238*** (-2.73) RelatedLoan1* DLenderGvtOwned (β2) 0.169** (2.54) RelatedLoan2* DLenderGvtOwned (β2) 0.248** (2.56) DLenderGvtOwned -0.009** -0.009** (-2.31) (-2.22) LoanSize -0.001 -0.001 (-0.55) (-0.56) TenureYear -0.001 -0.001 (-1.50) (-1.49) InterestRate -0.000 -0.000 (-0.18) (-0.15) BorrowerROA -0.000 -0.000 (-1.42) (-1.43) BorrowerLeverage -0.000** -0.000** (-2.46) (-2.47) BorrowerSize 0.001 0.001 (0.58) (0.61) LenderROA 0.003 0.003 (1.36) (1.37) LenderLeverage 0.018 0.020 (0.35) (0.40) LenderSize 0.001 0.001 (0.67) (0.68) LenderOpacity -0.000 -0.000 (-0.28) (-0.29) Constant -0.020 -0.021 (-0.49) (-0.51) Wald Test β1+ β2 =0 0.101 0.010 (0.40) (0.24) Nbr. Of obs. 336 336 Adjusted R-Squared 0.022 0.022
This table reports ordinary least square estimations of Cumulative Abnormal Returns (CARs) on the proportion of related loans and the type of banks (state- vs. family-owned) when we exclude state-owned banks controlled by local governments. CARs are computed on the event window [-2, +2]. Relatedloan1 is the ratio of related loans to total loans. Relatedloan2 is the ratio of related loan and total asset. The dummy variable DLenderGvtOwned takes value of one for loan contracts when the lending bank is state-owned, and zero otherwise. The dummy variable All variables are defined in Table 3. The t-statistics are in parentheses, with *, **, and *** denoting significance at 10%, 5% and 1% levels.
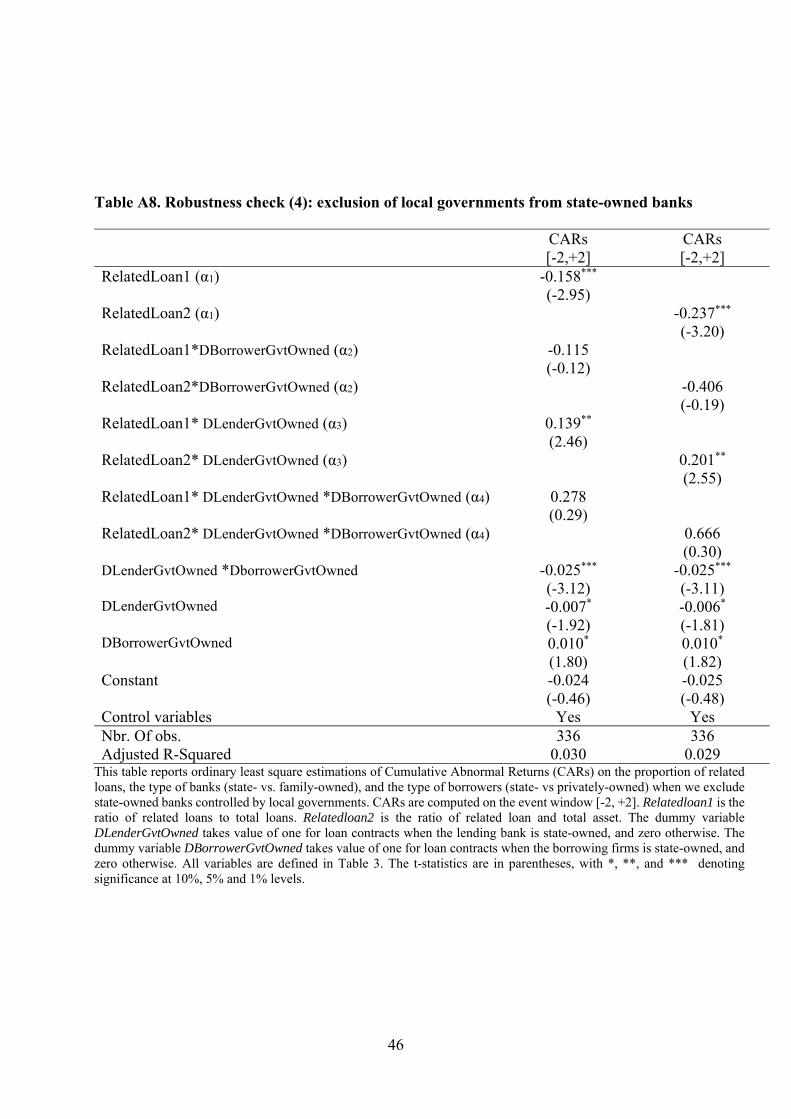
46
Table A8. Robustness check (4): exclusion of local governments from state-owned banks
CARs [-2,+2]
CARs [-2,+2]
RelatedLoan1 (α1) -0.158*** (-2.95) RelatedLoan2 (α1) -0.237*** (-3.20) RelatedLoan1*DBorrowerGvtOwned (α2) -0.115 (-0.12) RelatedLoan2*DBorrowerGvtOwned (α2) -0.406 (-0.19) RelatedLoan1* DLenderGvtOwned (α3) 0.139** (2.46) RelatedLoan2* DLenderGvtOwned (α3) 0.201** (2.55) RelatedLoan1* DLenderGvtOwned *DBorrowerGvtOwned (α4) 0.278 (0.29) RelatedLoan2* DLenderGvtOwned *DBorrowerGvtOwned (α4) 0.666 (0.30) DLenderGvtOwned *DborrowerGvtOwned -0.025*** -0.025*** (-3.12) (-3.11) DLenderGvtOwned -0.007* -0.006* (-1.92) (-1.81) DBorrowerGvtOwned 0.010* 0.010* (1.80) (1.82) Constant -0.024 -0.025 (-0.46) (-0.48) Control variables Yes Yes Nbr. Of obs. 336 336 Adjusted R-Squared 0.030 0.029
This table reports ordinary least square estimations of Cumulative Abnormal Returns (CARs) on the proportion of related loans, the type of banks (state- vs. family-owned), and the type of borrowers (state- vs privately-owned) when we exclude state-owned banks controlled by local governments. CARs are computed on the event window [-2, +2]. Relatedloan1 is the ratio of related loans to total loans. Relatedloan2 is the ratio of related loan and total asset. The dummy variable DLenderGvtOwned takes value of one for loan contracts when the lending bank is state-owned, and zero otherwise. The dummy variable DBorrowerGvtOwned takes value of one for loan contracts when the borrowing firms is state-owned, and zero otherwise. All variables are defined in Table 3. The t-statistics are in parentheses, with *, **, and *** denoting significance at 10%, 5% and 1% levels.
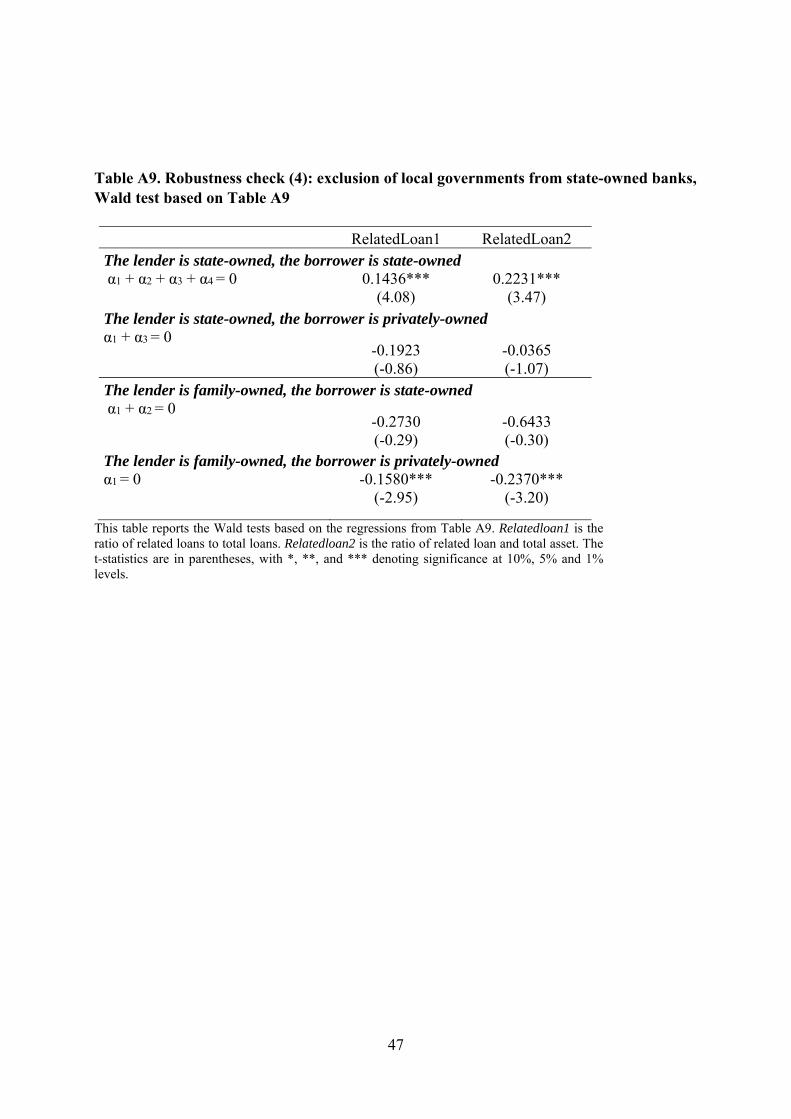
47
Table A9. Robustness check (4): exclusion of local governments from state-owned banks, Wald test based on Table A9
RelatedLoan1 RelatedLoan2 The lender is state-owned, the borrower is state-owned α1 + α2 + α3 + α4 = 0
0.1436*** (4.08)
0.2231*** (3.47)
The lender is state-owned, the borrower is privately-ownedα1 + α3 = 0
-0.1923 (-0.86)
-0.0365 (-1.07)
The lender is family-owned, the borrower is state-owned α1 + α2 = 0
-0.2730 (-0.29)
-0.6433 (-0.30)
The lender is family-owned, the borrower is privately-ownedα1 = 0
-0.1580*** (-2.95)
-0.2370*** (-3.20)
This table reports the Wald tests based on the regressions from Table A9. Relatedloan1 is the ratio of related loans to total loans. Relatedloan2 is the ratio of related loan and total asset. The t-statistics are in parentheses, with *, **, and *** denoting significance at 10%, 5% and 1% levels.