expression of cancer-testis (ct) antigens in...
TRANSCRIPT

Cancer Immun 1424
Cancer Immunity (24 Submitted: 23 May 200
-9634Academy of Cancer Immunology
www.cancerimmunity.org
07061115487888
Article
Expression of cancer-testis (CT) antigens in placenta
Achim A. Jungbluth1, Wilson A. Silva Jr.1, Kristin Iversen1, Denise Frosina1, Bushra Zaidi1, Keren Coplan1, Susannah K.Eastlake-Wade1, Sandra B. Castelli1, Giulio C. Spagnoli2, Lloyd J. Old1 and Martin Vogel31New York Branch, Ludwig Institute for Cancer Research, New York, NY, USA2Department of Surgery, Division of Research, University of Basel, Basel, Switzerland3Institute of Pediatric Pathology and Placentology, Virchow Hospital, Charité, Berlin, Germany
Contributed by: LJ Old
August 2007) Vol. 7, p. 157. Accepted: 25 June 2007.
Copyright © 2007 by Achim A. Jungbluth
Besides their variable presence in fetal and adult germ cells, CT antigens have occasionally been detected in placental tissue. However, these data are scarce and solely based on mRNA analyses; nothing is known about their presence at the protein level. Here, we analyzed the expression of various CT antigens in placental tissues from gestational age week 5 to week 42 using monoclonal antibodies to various antigens of the MAGE-A and -C families, NY-ESO-1, as well as GAGE. We show that CT antigen expression in placenta varies widely for the various antigens, ranging from completely negative to abundant. Since little is known about the function and biology of CT antigens, interpretation of this highly variable expression pattern is purely speculative. However, our data indicate that the various CT antigens have different functions during placental development.
Keywords: human, placenta, CT antigens, immunohistochemistry
IntroductionCancer-testis (CT) antigens are named after their
characteristic pattern of expression, as they are typically observed in various histological types of malignant tumors and, in normal tissues, predominantly in germ cells of the testis (1). Due to this tumor-associated expression pattern and their limited presence in normal tissues, CT antigens appear to be valuable targets for immunotherapy of cancer (2, 3) . However, most expression analyses of CT antigens are based on RT-PCR analyses and less is known regarding their expression at the protein level. Consequently, we and others have generated several monoclonal antibodies (mAbs) to various CT antigens and characterized their reactivity in panels of normal adult and tumor tissues (4-10). Although initial mRNA analyses of normal tissues pointed to CT antigen expression solely in testicular germ cells, further studies revealed the presence of some CT antigens in placenta (11). However, individual attempts to demonstrate their placental expression at the protein level remained negative (4, 6) and a systematic analysis of CT antigen expression at the protein level in placental tissue has not yet been performed. Though little is known about the biological function of CT antigens, knowledge about their presence in placental tissue can have important implications for the understanding of the biology of both placenta and CT antigens.
Consequently, the present study analyzes the protein expression of several CT antigens in a panel of placental tissues of various gestational ages. We demonstrate that CT antigens are expressed in placental tissue at the protein level according to particular patterns, which differ for each antigen. To the best of
our knowledge, this is the first study showing the expression of these tumor-associated antigens in placenta at the protein level.
ResultsA panel of 50 placentas, consisting of placentas from
gestational age of week 5 to week 42, was analyzed. The result of the immunohistochemical staining is shown in Table 1. Our analysis did not include the chorion laeve.
Several specimens revealed strong background staining and were repeated, some with a biotin-free detection system, until satisfactory staining was obtained. Some of the blocks were re-stained after a prolonged time (5 years) and there was a loss of reactivity for some of the antigens. For the morphological assessment of the immunopositive structures, the staining pattern of mAb AE1/AE3 and mAb 4H84 proved helpful. Antibody AE1/AE3 showed intense labeling of all epithelial cells, including various trophoblastic cell types as well as maternal endometrial glands, displaying intense straining of the gland epithelium. For further characterization of the trophoblast, mAb 4H84 to HLA-G was used. Antibody 4H84 stained predominantly the invasive cell type of the extravillous trophoblast and hence was primarily useful to characterize the CT antigen positive cell population in the vicinity of the basal plate.
The immunohistochemical staining revealed a wide spectrum of immunoreactivity for the various anti-CT antigen antibodies. While some antibodies showed quite intense labeling of many placental tissues, other antibodies did not stain at all (Figure 1, Figure 2, and Figure 3).
Most immunostaining was seen with mAb M3H67 which showed immunoreactivity in all placentas of our analysis (Figure 1, Figure 2, Figure 3, and Figure 4). M3H67 reactivity was seen in the villous and extravillous trophoblast, and only rarely was the extent of immunostaining strongly discrepant. No immunoreactivity was present outside the trophoblast cell population, for example in the villous stroma. The immunoreactivity of the cytotrophoblast, as well as the syncytiotrophoblast, could be seen within the same villi or separate from each other in different villi, and transitions of immunopositive to immunonegative areas were present within the same villus. Although it appeared that in some placentas of the first trimester the staining was confined to focal areas resembling a cotyledon, other areas showed a mixture of positive and negative villi within the same area and hence no clear association of immunopositive areas with particular structures could be assigned. In the extravillous cytotrophoblast we did not see any local predilection of staining, but we did not differentiate
1 of 12

Cancer Immunity (24 August 2007) Vol. 7, p. 15
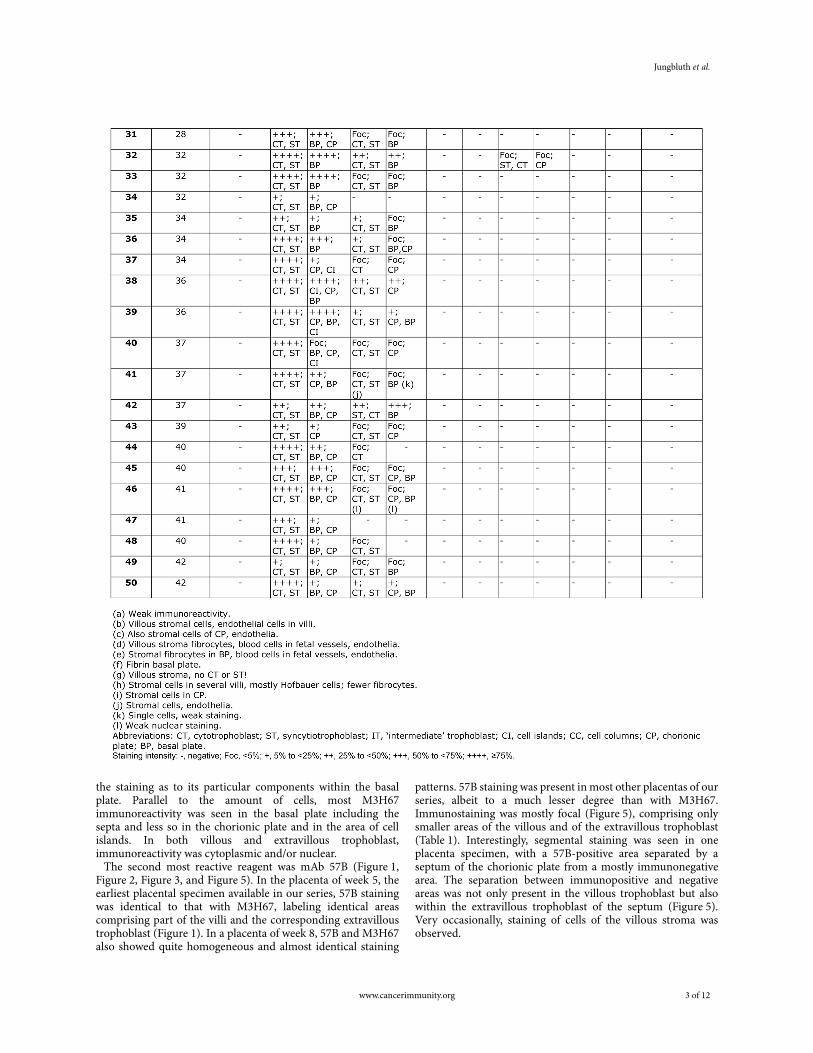
Table 1Immunohistochemical analysis of CT antigen expression in placental tissue specimens gestational age week 5 to term placenta.
2 of 12 www.cancerimmunity.org
Jungbluth et al.
the staining as to its particular components within the basal plate. Parallel to the amount of cells, most M3H67 immunoreactivity was seen in the basal plate including the septa and less so in the chorionic plate and in the area of cell islands. In both villous and extravillous trophoblast, immunoreactivity was cytoplasmic and/or nuclear.
The second most reactive reagent was mAb 57B (Figure 1, Figure 2, Figure 3, and Figure 5). In the placenta of week 5, the earliest placental specimen available in our series, 57B staining was identical to that with M3H67, labeling identical areas comprising part of the villi and the corresponding extravillous trophoblast (Figure 1). In a placenta of week 8, 57B and M3H67 also showed quite homogeneous and almost identical staining
patterns. 57B staining was present in most other placentas of our series, albeit to a much lesser degree than with M3H67. Immunostaining was mostly focal (Figure 5), comprising only smaller areas of the villous and of the extravillous trophoblast (Table 1). Interestingly, segmental staining was seen in one placenta specimen, with a 57B-positive area separated by a septum of the chorionic plate from a mostly immunonegative area. The separation between immunopositive and negative areas was not only present in the villous trophoblast but also within the extravillous trophoblast of the septum (Figure 5). Very occasionally, staining of cells of the villous stroma was observed.
www.cancerimmunity.org 3 of 12
Cancer Immunity (24 August 2007) Vol. 7, p. 15
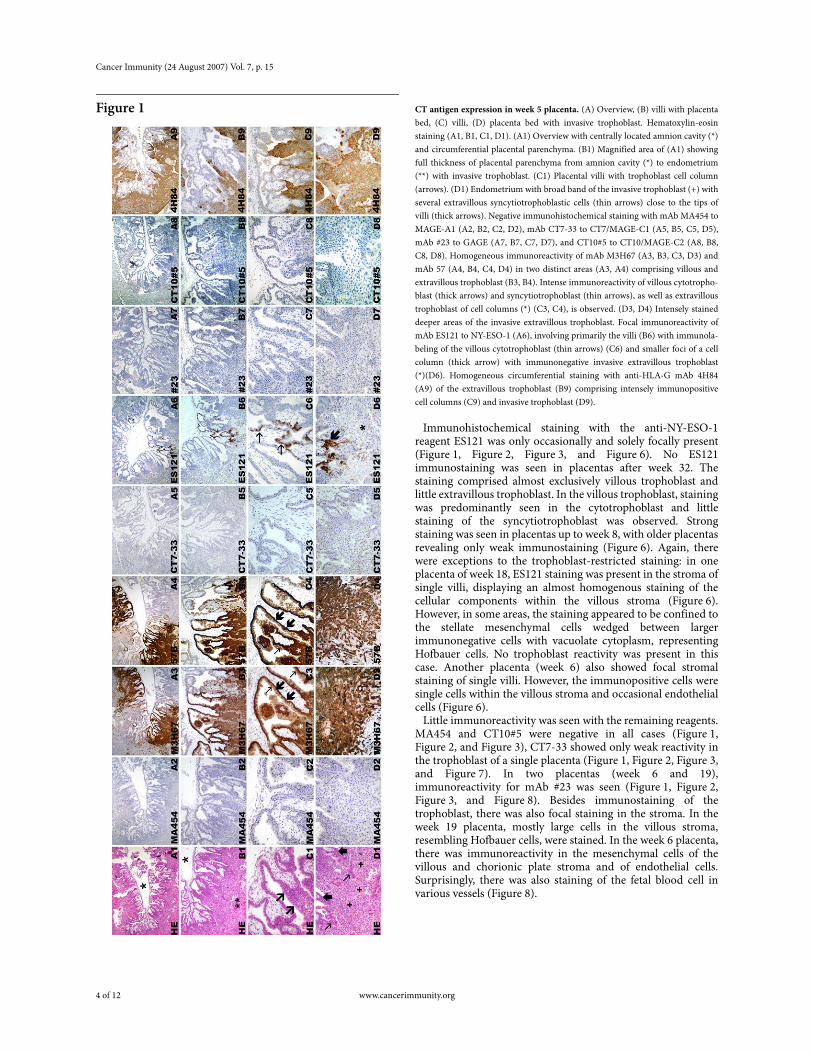
Figure 1 CT antigen expression in week 5 placenta. (A) Overview, (B) villi with placenta bed, (C) villi, (D) placenta bed with invasive trophoblast. Hematoxylin-eosin staining (A1, B1, C1, D1). (A1) Overview with centrally located amnion cavity (*) and circumferential placental parenchyma. (B1) Magnified area of (A1) showing full thickness of placental parenchyma from amnion cavity (*) to endometrium (**) with invasive trophoblast. (C1) Placental villi with trophoblast cell column (arrows). (D1) Endometrium with broad band of the invasive trophoblast (+) with several extravillous syncytiotrophoblastic cells (thin arrows) close to the tips of villi (thick arrows). Negative immunohistochemical staining with mAb MA454 to MAGE-A1 (A2, B2, C2, D2), mAb CT7-33 to CT7/MAGE-C1 (A5, B5, C5, D5), mAb #23 to GAGE (A7, B7, C7, D7), and CT10#5 to CT10/MAGE-C2 (A8, B8, C8, D8). Homogeneous immunoreactivity of mAb M3H67 (A3, B3, C3, D3) and mAb 57 (A4, B4, C4, D4) in two distinct areas (A3, A4) comprising villous and extravillous trophoblast (B3, B4). Intense immunoreactivity of villous cytotropho-blast (thick arrows) and syncytiotrophoblast (thin arrows), as well as extravillous trophoblast of cell columns (*) (C3, C4), is observed. (D3, D4) Intensely stained deeper areas of the invasive extravillous trophoblast. Focal immunoreactivity of mAb ES121 to NY-ESO-1 (A6), involving primarily the villi (B6) with immunola-beling of the villous cytotrophoblast (thin arrows) (C6) and smaller foci of a cell column (thick arrow) with immunonegative invasive extravillous trophoblast (*)(D6). Homogeneous circumferential staining with anti-HLA-G mAb 4H84 (A9) of the extravillous trophoblast (B9) comprising intensely immunopositive cell columns (C9) and invasive trophoblast (D9).
Immunohistochemical staining with the anti-NY-ESO-1 reagent ES121 was only occasionally and solely focally present (Figure 1, Figure 2, Figure 3, and Figure 6). No ES121 immunostaining was seen in placentas after week 32. The staining comprised almost exclusively villous trophoblast and little extravillous trophoblast. In the villous trophoblast, staining was predominantly seen in the cytotrophoblast and little staining of the syncytiotrophoblast was observed. Strong staining was seen in placentas up to week 8, with older placentas revealing only weak immunostaining (Figure 6). Again, there were exceptions to the trophoblast-restricted staining: in one placenta of week 18, ES121 staining was present in the stroma of single villi, displaying an almost homogenous staining of the cellular components within the villous stroma (Figure 6). However, in some areas, the staining appeared to be confined to the stellate mesenchymal cells wedged between larger immunonegative cells with vacuolate cytoplasm, representing Hofbauer cells. No trophoblast reactivity was present in this case. Another placenta (week 6) also showed focal stromal staining of single villi. However, the immunopositive cells were single cells within the villous stroma and occasional endothelial cells (Figure 6).
Little immunoreactivity was seen with the remaining reagents. MA454 and CT10#5 were negative in all cases (Figure 1, Figure 2, and Figure 3), CT7-33 showed only weak reactivity in the trophoblast of a single placenta (Figure 1, Figure 2, Figure 3, and Figure 7). In two placentas (week 6 and 19), immunoreactivity for mAb #23 was seen (Figure 1, Figure 2, Figure 3, and Figure 8). Besides immunostaining of the trophoblast, there was also focal staining in the stroma. In the week 19 placenta, mostly large cells in the villous stroma, resembling Hofbauer cells, were stained. In the week 6 placenta, there was immunoreactivity in the mesenchymal cells of the villous and chorionic plate stroma and of endothelial cells. Surprisingly, there was also staining of the fetal blood cell in various vessels (Figure 8).
4 of 12 www.cancerimmunity.org

Jungbluth et al.
Figure 2 CT antigen expression in week 24 placenta. Hematoxylin-eosin staining (A1, B1, C1, D1). Macroscopic view (A1-A9) of placental parenchyma (B1-B9) with sep-tum (*), villi (C1-C9), and placenta bed with extravillous trophoblast cells (D1-D9). Negative immunohistochemical staining with mAb MA454 to MAGE-A1 (A2, B2, C2, D2), mAb CT7-33 to CT7/MAGE-C1 (A5, B5, C5, D5), mAb ES121 to NY-ESO-1 (A6, B6, C6, D6), mAb #23 to GAGE (A7, B7, C7, D7), and mAb CT10#5 to CT10/MAGE-C2 (A8, B8, C8, D8). Homogeneous mAb M3H67 immunostaining of placental parenchyma (A3), comprising villi and septum (*) (B3), displaying negative villous stroma and intense immunolabeling of villous cytotrophoblast and syncytiotrophoblast (C3) and extravillous trophoblast of the basal plate (D3). Little immunostaining with mAb 57B to MAGE-A4 (A4) involv-ing small villi foci and septal extravillous trophoblast (*) (B4). Staining of the vil-lous trophoblast involving primarily the cytotrophoblast (C4) and focal extravillous trophoblast (D4). Immunolabeling of the extravillous trophoblast with anti-HLA-G mAb 4H84 (A9) in the vicinity of the septum (*) (B9) and basal plate (D9). (C9) 4H84 immunonegative villi.
DiscussionAfter the identification of its prototype MAGE-1 (now
MAGE-A1) (12), more than 40 CT antigen genes and/or gene families have been isolated (13, 14). As their acronymic name implies, CT antigen expression in normal tissues was originally thought to be restricted to germ cells in the adult testis, but subsequent studies revealed the presence of several CT antigens in placenta (11). Based on current gene identification techniques, knowledge about antigen expression is readily available at the mRNA level, while protein analysis depends on the relatively time-consuming generation of serological reagents and consequently lags behind molecular studies. Several mAbs to various CT antigens have been generated recently and a comprehensive picture of their expression pattern in tumors is slowly emerging (4-9, 15-17). As a consequence, it could be demonstrated that CT antigens are not restricted to testicular germ cells but that they are also present in germ cells of the fetal ovary (16, 18).
In the present study, we addressed the question of CT antigen expression in placenta. RT-PCR expression data for several CT antigens exists (11). However this analysis is of limited value as the placental age was not specified, something which appears to be of major importance concerning the presence of particular CT antigens.
Our series consisted of placental tissue from various stages of maturation and a panel of seven mAbs, which were all generated by our group except for one commercial reagent. Consequently, several hundred slides were analyzed by immunohistochemistry to render an initial picture about the presence of CT antigens in placenta. Considering nomenclatural problems, we used a simplified classification to designate immunopositive placental structures for ease of evaluation and understanding.
Our immunohistochemical analysis demonstrates that several CT antigens are regularly expressed in placenta at the protein level. Based on the reactivity of the serological reagents, three different expression patterns can be distinguished. The first pattern, represented by mAb M3H67 and 57B, showed staining in most placentas albeit to a variable degree. Although the immunoreactivity of M3H67 significantly exceeds that of 57B as to the extent of immunopositive areas, 57B was positive in the vast majority of placentas analyzed. Both mAbs are reactive with antigens of the MAGE-A family. Due to the high homology of the members of the MAGE family, some cross-reactivity of the serological reagents cannot be completely ruled out. This is best exemplified by mAb 57B, which was generated to MAGE-A3, later assumed to be a poly-MAGE-A reagent, while a recent
www.cancerimmunity.org 5 of 12

Cancer Immunity (24 August 2007) Vol. 7, p. 15
Figure 3 CT antigen expression in week 42 placenta. Hematoxylin-eosin staining (A1, B1, C1, D1) of villous parenchyma (A1-B9) and basal plate (C1-D9). Negative immu-nohistochemical staining with mAb MA454 to MAGE-A1 (A2, B2, C2, D2), mAb CT7-33 to CT7/MAGE-C1 (A5, B5, C5, D5), mAb ES121 to NY-ESO-1 (A6, B6, C6, D6), mAb #23 to GAGE (A7, B7, C7, D7), and mAb CT10#5 to CT10/MAGE-C2 (A8, B8, C8, D8). Homogeneous mAb M3H67 immunostaining of placental villous parenchyma (A3) comprising cytotrophoblast and syncytiotrophoblast (B3) and circumscript intense labeling of basal plate (arrows) (C3) resembling extravillous trophoblast cells (D3). Heterogeneous immunostaining with mAb 57B to MAGE-A4 (A4) involving small areas of villous cytotrophoblast and syncy-tiotrophoblast (B4) and focal areas of extravillous trophoblast (D4) of the basal plate (C4). Negative mAb 4H84 immunostaining of the villi (A9, B9) is seen next to intense immunoreactivity of the extravillous trophoblast of basal plate (C9, D9).
analysis indicates it to be mainly reactive to MAGE-A4 (8, 19, 20). M3H67 was generated to MAGE-A3 and the immunohistochemical staining pattern of both reagents indicates that both mAbs are reactive with different antigens. The expression data for MAGE-A3 and MAGE-A4 in our study is corroborated at the mRNA level for both antigens by previous RT-PCR analyses, even though no gestational age was given for the placentas that were analyzed (11).
The second staining pattern consisted of very restricted immunostaining in a limited number of tissues. It is best exemplified by mAb ES121, which showed focal immunoreactivity in some of the placentas. No immunoreactivity was detectable in placentas older than 32 weeks. The heterogeneous protein expression pattern and the lack of expression in third trimester placentas most likely explain the negative RT-PCR results for NY-ESO-1 in placenta (21). Significantly less immunoreactivity was seen with mAbs CT7-33 and #23 to GAGE. While CT7-33 showed focal staining in a single placenta of the first trimester, mAb #23 stained one placenta of the first trimester and one of the second trimester, showing very limited expression of GAGE. The various members of the GAGE gene family are highly homologous and the present mAb to GAGE was generated to a consensus region (22). CT7 and all members of the GAGE family were negative by RT-PCR previously, which is complementary to the rare presence of these antigens at the protein level (22-24).
The third group of antigens is exemplified by the immunoreactivity of mAb MA454 to MAGE-A1 and mAb CT10#5 to CT10 (MAGE-C2). Both reagents were completely negative in all tissues tested. This is in concordance with previous RT-PCR studies for both antigens (25, 26).
In the present analysis, immunopositive areas were almost exclusively limited to the trophoblast epithelium. Cytotrophoblast and/or the syncytiotrophoblast were stained to a variable degree and the staining could be present for both in the same area or completely separate. In our study, we distinguished villous from extravillous trophoblast and specified the latter according to its location within the placenta. However, we did not sub-specify the various types of trophoblast types that are present in the basal plate, but rather regarded the trophoblastic cell population in this location as one entity. This simplification facilitated the grading but disregards potential differences in the expression patterns of the various trophoblast subtypes. For the delineation of the trophoblast populations, the use of a pan-cytokeratin marker and a reagent to HLA-G proved very helpful. Anti-HLA-G mAb 4H84 is primarily reactive to the so-called intermediate/invasive type of extravillous trophoblast and aided in the evaluation of the CT antigen positive cell populations in the basal plate, cell columns, cell islands, and chorionic plate (27-30).
6 of 12 www.cancerimmunity.org

Jungbluth et al.
Figure 4
Spectrum of immunohistochemical staining of mAb M3H67 (to MAGE-A3) in placenta of week 6 (A-J) and week 36 (K-O). (A) Villi displaying both immunoposi-tive and immunonegative trophoblast. (B) Villus with negative trophoblast. (C) Villus with immunopositivity of cytotrophoblast (thick arrows) as well as syncytiotropho-blast (thin arrows); note the negative villous stroma (*). (D) Villus with M3H67-positive cytotrophoblast (thick arrows) and M3H67-negative (thin arrows) syncytiotrophoblast. (E) Villus with immunonegative cytotrophoblast (thick arrows) and immunopositive (thin arrows) syncytiotrophoblast. (F) Villus with transition (arrows) from area with immunopositive cytotrophoblast/immunopositive syncytiotrophoblast to area with immunonegative cytotrophoblast/immunopositive syncy-tiotrophoblast. (G) Anchoring villi with immunopositive villous trophoblast and mostly immunopositive cell column with single immunonegative extravillous tropho-blast cells. (H) Anchoring villi with immunonegative villous trophoblast and focal immunostaining of extravillous trophoblast of cell column. Immunonegative (I) and homogenous immunopositive area of proliferating trophoblast of cell column (J). Villous placental tissue of week 36 (K-O), with immunopositive (K, L) and immunone-gative (M, N) villous trophoblast, as well as heterogeneous M3H67 immunoreactivity of the extravillous trophoblast of the basal plate (O).
Staining of non-trophoblastic tissue components was observed in very few tissues. This was solely observed with mAbs ES121, #23, and 57B. The positive cell population was further characterized by additional immunostaining for vimentin, desmin, actin, and LCA. The CT antigen positive cells were endothelia and fixed stromal cells, except for #23 which showed immunoreactivity of the Hofbauer cells and of fetal blood cells. We have no explanation for the immunopositivity of these non-trophoblastic components in these few placenta samples.
The fact that the trophoblast is the main cell type expressing CT antigen is perhaps not so surprising. Trophoblastic cells share several properties with other CT antigen expressing cells. Like CT antigen expressing germ cells, the trophoblast lacks polymorphic MHC class I and II molecules, rendering them 'immune privileged', but expresses certain types of non-polymorphic MHC molecules such as HLA-G (31-33). There are abundant similarities between tumors and placenta, and trophoblastic cells are often referred to as 'pseudo-tumorigenic' [reviewed in (34), (35)] . Interestingly, CT antigen expression is almost exclusively present in trophoblastic cells, of which the invasive extravillous subtype shows the most prevalent tumor-like features. However, in our analysis, we did not find any dominance of CT antigen expression in the invasive extravillous trophoblast. In fact we did not find a general pattern of CT antigen expression within the placenta at all. In one placenta of week 5, M3H67 and 57B immunostaining (Figure 1) was intense and comprised two distinct segmental areas involving the villous and extravillous, especially the invasive, trophoblast in a similar fashion. Another placenta of week 32 showed 'segmental' 57B immunostaining, with the stained area separated by a septa from the neighboring (mostly) immunonegative area. Interestingly, the border line between stained and unstained
cells was in the middle of the septum displaying stained cells in one half and immunonegative cells in the opposite half (Figure 5B). But these regionally confined staining patterns were the exceptions and the vast majority of placentas appeared to display immunostaining that was not prevalent in a particular location.
Placental CT antigen expression is not fully paralleled by its presence in the fetal germ cells (18, 36, 37). The immunoreactivity of mAbs 57B, ES121, and M3H67 in fetal ovary concurs with its placental presence for the most part, although the high placental immunoreactivity of M3H67 in the last trimester is paralleled by only focal staining in the fetal ovary of similar gestational age (18). A striking discrepancy is the intense and consistent presence of CT7 in fetal ovary between week 13 and 31 and its almost complete absence in placenta (18). Presence of MAGE-A1 was detected by consistent (albeit low) immunoreactivity for MA454 in fetal ovary and testis. However, no MA454 reactivity was present in our placenta series (16). The consistent expression of GAGE during fetal development was not congruent with its only occasional presence in placenta (16).
Though knowledge about biology and function is still scarce, recent studies implicate direct or indirect interactions of CT antigens with proteins involved in transcription (38), the cell cycle (39), apoptosis (40), proliferation (41) and susceptibility to cytokine effects in tumor cells (42). Since placenta is an organ that is required to support the growth and maturation of the fetus in a very limited time, it needs to rapidly adapt to changing demands employing the very same functional processes CT antigens appear to participate in. However, the exact interaction of CT antigens with these various biological processes in the placenta needs further extensive analysis.
www.cancerimmunity.org 7 of 12
Cancer Immunity (24 August 2007) Vol. 7, p. 15
Figure 5
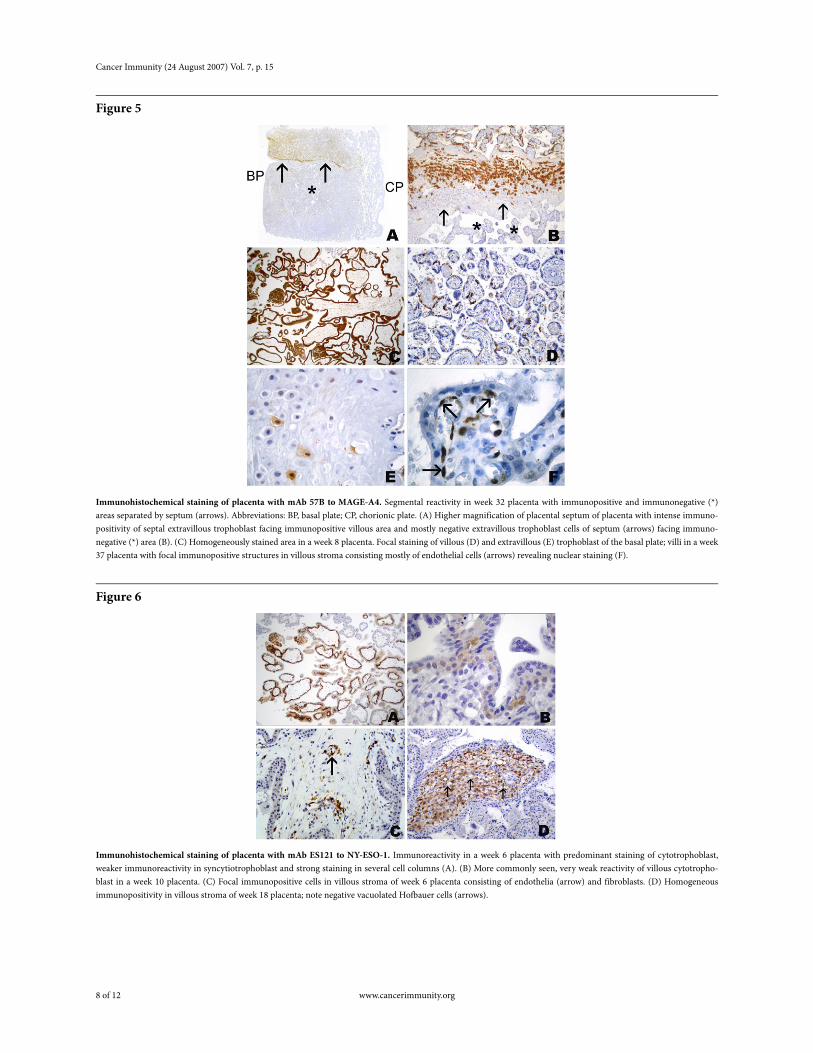
Immunohistochemical staining of placenta with mAb 57B to MAGE-A4. Segmental reactivity in week 32 placenta with immunopositive and immunonegative (*) areas separated by septum (arrows). Abbreviations: BP, basal plate; CP, chorionic plate. (A) Higher magnification of placental septum of placenta with intense immuno-positivity of septal extravillous trophoblast facing immunopositive villous area and mostly negative extravillous trophoblast cells of septum (arrows) facing immuno-negative (*) area (B). (C) Homogeneously stained area in a week 8 placenta. Focal staining of villous (D) and extravillous (E) trophoblast of the basal plate; villi in a week 37 placenta with focal immunopositive structures in villous stroma consisting mostly of endothelial cells (arrows) revealing nuclear staining (F).
Figure 6
Immunohistochemical staining of placenta with mAb ES121 to NY-ESO-1. Immunoreactivity in a week 6 placenta with predominant staining of cytotrophoblast, weaker immunoreactivity in syncytiotrophoblast and strong staining in several cell columns (A). (B) More commonly seen, very weak reactivity of villous cytotropho-blast in a week 10 placenta. (C) Focal immunopositive cells in villous stroma of week 6 placenta consisting of endothelia (arrow) and fibroblasts. (D) Homogeneous immunopositivity in villous stroma of week 18 placenta; note negative vacuolated Hofbauer cells (arrows).
8 of 12 www.cancerimmunity.org

Jungbluth et al.
Figure 7
Immunohistochemical staining of placenta with mAb CT7-33 to CT7/MAGE-C1. (A, B) Weak immunoreactivity of the cytotrophoblast of a week 8 placenta.
Figure 8
Immunohistochemical staining of placenta week 19 (A-C) and week 6 (D-F) with mAb #23 to GAGE. (A) Predominant cytotrophoblast staining (syncytiotrophoblast staining in other areas). (B) Intense immunostaining of Hofbauer cells in villus stroma. (C) Focal immunopositive extravillous trophoblast of basal plate. (D) Immuno-reactivity of villous cytotrophoblast and extravillous cytotrophoblast of a cell column. (E) Stromal staining with labeling of endothelial cells (arrow) and focal fibroblasts. (F) Positive fetal hematopoetic cells (arrow) in villous vessel.
In conclusion, our immunohistochemical study in placenta demonstrates consistent, albeit variable, expression of several CT antigens almost exclusively in the trophoblast.
AbbreviationsCT, cancer-testis
AcknowledgementsPart of this study was presented at the 2001 Annual Meeting of
the Deutsche Gesellschaft für Pathologie (German Society of Pathology) in Muenster, Germany and at the 2004 Annual Meeting of the United States and Canadian Society of Pathology (USCAP) in Vancouver, Canada.
References1. Boon T, Old LJ. Cancer Tumor antigens. Curr Opin Immunol 1997;
9: 681-683. (PMID: 9438857)
2. Boon T, Coulie PG, Van den Eynde BJ, van der Bruggen P. Human T cell responses against melanoma. Annu Rev Immunol 2006; 24: 175-208. (PMID: 16551247)
3. Jager D, Knuth A. Antibodies and vaccines--hope or illusion? Breast2005; 14: 631-635. (PMID: 16242931)
4. Jungbluth AA, Busam KJ, Kolb D, Iversen K, Coplan K, Chen YT, Spagnoli GC, Old LJ. Expression of MAGE-antigens in normal tis-sues and cancer. Int J Cancer 2000; 85: 460-465. (PMID: 10699915)
5. Jungbluth AA, Stockert E, Chen YT, Kolb D, Iversen K, Coplan K, Williamson B, Altorki N, Busam KJ, Old LJ. Monoclonal antibody MA454 reveals a heterogeneous expression pattern of MAGE-1 antigen in formalin-fixed paraffin embedded lung tumours. Br J Cancer 2000; 83: 493-497. (PMID: 10945497)
6. Jungbluth AA, Chen YT, Stockert E, Busam KJ, Kolb D, Iversen K, Coplan K, Williamson B, Altorki N, Old LJ. Immunohistochemical analysis of NY-ESO-1 antigen expression in normal and malignant human tissues. Int J Cancer 2001; 92: 856-860. (PMID: 11351307)
7. Jungbluth AA, Chen YT, Busam KJ, Coplan K, Kolb D, Iversen K, Williamson B, Van Landeghem FK, Stockert E, Old LJ. CT7 (MAGE-C1) antigen expression in normal and neoplastic tissues.Int J Cancer 2002; 99: 839-845. (PMID: 12115486)
www.cancerimmunity.org 9 of 12

Cancer Immunity (24 August 2007) Vol. 7, p. 15
8. Kocher T, Schultz-Thater E, Gudat F, Schaefer C, Casorati G, JureticA, Willimann T, Harder F, Heberer M, Spagnoli GC. Identification and intracellular location of MAGE-3 gene product. Cancer Res1995; 55: 2236-2239. (PMID: 7757970)
9. Schultz-Thater E, Noppen C, Gudat F, Durmuller U, Zajac P, Kocher T, Heberer M, Spagnoli GC. NY-ESO-1 tumour associated antigen is a cytoplasmic protein detectable by specific monoclonal antibodies in cell lines and clinical specimens. Br J Cancer 2000; 83: 204-208. (PMID: 10901371)
10. Juretic A, Spagnoli GC, Schultz-Thater E, Sarcevic B. Cancer/testis tumour-associated antigens: immunohistochemical detection with monoclonal antibodies. Lancet Oncol 2003; 4: 104-109. (PMID: 12573352)
11. De Plaen E, Arden K, Traversari C, Gaforio JJ, Szikora JP, De SmetC, Brasseur F, van der Bruggen P, Lethe B, Lurquin C, Brasseur R, Chomez P, De Backer O, Cavenee W, Boon T. Structure, chromo-somal localization, and expression of 12 genes of the MAGE family.Immunogenetics 1994; 40: 360-369. (PMID: 7927540)
12. van der Bruggen P, Traversari C, Chomez P, Lurquin C, De Plaen E, Van den Eynde B, Knuth A, Boon T. A gene encoding an antigen recognized by cytolytic T lymphocytes on a human melanoma.Science 1991; 254: 1643-1647. (PMID: 1840703)
13. Scanlan MJ, Simpson AJ, Old LJ. The cancer/testis genes: review, standardization, and commentary. Cancer Immun 2004; 4: 1. URL: http://www.cancerimmunity.org/v4p1/031220.htm
14. Simpson AJ, Caballero OL, Jungbluth A, Chen YT, Old LJ. Cancer/testis antigens, gametogenesis and cancer. Nat Rev Cancer 2005; 5: 615-625. (PMID: 16034368)
15. Schultz-Thater E, Juretic A, Dellabona P, Luscher U, Siegrist W, Harder F, Heberer M, Zuber M, Spagnoli GC. MAGE-1 gene pro-duct is a cytoplasmic protein. Int J Cancer 1994; 59: 435-439. (PMID: 7927954)
16. Gjerstorff MF, Kock K, Nielsen O, Ditzel HJ. MAGE-A1, GAGE and NY-ESO-1 cancer/testis antigen expression during human gonadal development. Hum Reprod 2007; 22: 953-960. (PMID: 17208940)
17. Zhuang R, Zhu Y, Fang L, Liu XS, Tian Y, Chen LH, Ouyang WM, Xu XG, Jian JL, Gure AO, Fortunato S, Ritter G, Old LJ, Simpson AJ, Chen YT, Jin B, Jungbluth AA. Generation of monoclonal antibo-dies to cancer/testis (CT) antigen CT10/MAGE-C2. Cancer Immun2006; 6: 7. URL: http://www.cancerimmunity.org/v6p7/060106.htm
18. Nelson PT, Zhang PJ, Spagnoli GC, Tomaszewski JE, Pasha TL, Fro-sina D, Caballero OL, Simpson AJ, Old LJ, Jungbluth AA. Cancer/testis (CT) antigens are expressed in fetal ovary. Cancer Immun2007; 7: 1. URL: http://www.cancerimmunity.org/v7p1/061214.htm
19. Landry C, Brasseur F, Spagnoli GC, Marbaix E, Boon T, Coulie P, Godelaine D. Monoclonal antibody 57B stains tumor tissues that express gene MAGE-A4. Int J Cancer 2000; 86: 835-841. (PMID: 10842198)
20. Rimoldi D, Salvi S, Schultz-Thater E, Spagnoli GC, Cerottini JC. Anti-MAGE-3 antibody 57B and anti-MAGE-1 antibody 6C1 can be used to study different proteins of the MAGE-A family. Int J Can-cer 2000; 86: 749-751. (PMID: 10797302)
21. Chen YT, Scanlan MJ, Sahin U, Tureci O, Gure AO, Tsang S, Will-iamson B, Stockert E, Pfreundschuh M, Old LJ. A testicular antigen aberrantly expressed in human cancers detected by autologous anti-body screening. Proc Natl Acad Sci U S A 1997; 94: 1914-1918. (PMID: 9050879)
22. De Backer O, Arden KC, Boretti M, Vantomme V, De Smet C, Czekay S, Viars CS, De Plaen E, Brasseur F, Chomez P, Van den Eynde B, Boon T, van der Bruggen P. Characterization of the GAGE genes that are expressed in various human cancers and in normal testis. Cancer Res 1999; 59: 3157-3165. (PMID: 10397259)
23. Chen YT, Gure AO, Tsang S, Stockert E, Jager E, Knuth A, Old LJ. Identification of multiple cancer/testis antigens by allogeneic anti-body screening of a melanoma cell line library. Proc Natl Acad Sci U S A 1998; 95: 6919-6923. (PMID: 9618514)
24. Van den Eynde B, Peeters O, De Backer O, Gaugler B, Lucas S, BoonT. A new family of genes coding for an antigen recognized by auto-logous cytolytic T lymphocytes on a human melanoma. J Exp Med1995; 182: 689-698. (PMID: 7544395)
25. Gure AO, Stockert E, Arden KC, Boyer AD, Viars CS, Scanlan MJ, Old LJ, Chen YT. CT10: a new cancer-testis (CT) antigen homolo-gous to CT7 and the MAGE family, identified by representational-difference analysis. Int J Cancer 2000; 85: 726-732. (PMID: 10699956)
26. Lucas S, De Plaen E, Boon T. MAGE-B5, MAGE-B6, MAGE-C2, and MAGE-C3: four new members of the MAGE family with tumor-specific expression. Int J Cancer 2000; 87: 55-60. (PMID: 10861452)
27. Blaschitz A, Hutter H, Dohr G. HLA Class I protein expression in the human placenta. Early Pregnancy 2001; 5: 67-69. (PMID: 11753519)
28. Hunt JS. Stranger in a strange land. Immunol Rev 2006; 213: 36-47. (PMID: 16972895)
29. McMaster M, Zhou Y, Shorter S, Kapasi K, Geraghty D, Lim KH, Fisher S. HLA-G isoforms produced by placental cytotrophoblasts and found in amniotic fluid are due to unusual glycosylation. J Immunol 1998; 160: 5922-5928. (PMID: 9637505)
30. Singer G, Kurman RJ, McMaster MT, Shih I. HLA-G immunoreac-tivity is specific for intermediate trophoblast in gestational tropho-blastic disease and can serve as a useful marker in differential diagnosis. Am J Surg Pathol 2002; 26: 914-920. (PMID: 12131159)
31. Guillaudeux T, Gomez E, Onno M, Drenou B, Segretain D, AlbertiS, Lejeune H, Fauchet R, Jegou B, Le Bouteiller P. Expression of HLA class I genes in meiotic and post-meiotic human spermatoge-nic cells. Biol Reprod 1996; 55: 99-110. (PMID: 8793064)
32. Hunt JS, Langat DK, McIntire RH, Morales PJ. The role of HLA-G in human pregnancy. Reprod Biol Endocrinol 2006; 4 Suppl 1: S10. (PMID: 17118165)
33. Hutter H, Hammer A, Blaschitz A, Hartmann M, Ebbesen P, DohrG, Ziegler A, Uchanska-Ziegler B. Expression of HLA class I mole-cules in human first trimester and term placenta trophoblast. Cell Tissue Res 1996; 286: 439-447. (PMID: 8929346)
10 of 12 www.cancerimmunity.org

Jungbluth et al.
34. Soundararajan R, Rao AJ. Trophoblast 'pseudo-tumorigenesis': sig-nificance and contributory factors. Reprod Biol Endocrinol 2004; 2: 15. (PMID: 15043753)
35. Wilczynski JR. Cancer and pregnancy share similar mechanisms of immunological escape. Chemotherapy 2006; 52: 107-110. (PMID: 16612052)
36. Takahashi K, Shichijo S, Noguchi M, Hirohata M, Itoh K. Identifica-tion of MAGE-1 and MAGE-4 proteins in spermatogonia and pri-mary spermatocytes of testis. Cancer Res 1995; 55: 3478-3482. (PMID: 7627949)
37. Satie AP, Rajpert-De Meyts E, Spagnoli GC, Henno S, Olivo L, Jacobsen GK, Rioux-Leclercq N, Jegou B, Samson M. The cancer-testis gene, NY-ESO-1, is expressed in normal fetal and adult testes and in spermatocytic seminomas and testicular carcinoma in situ.Lab Invest 2002; 82: 775-780. (PMID: 12065688)
38. Laduron S, Deplus R, Zhou S, Kholmanskikh O, Godelaine D, De Smet C, Hayward SD, Fuks F, Boon T, De Plaen E. MAGE-A1 inter-acts with adaptor SKIP and the deacetylase HDAC1 to repress tran-scription. Nucleic Acids Res 2004; 32: 4340-4350. (PMID: 15316101)
39. Nagao T, Higashitsuji H, Nonoguchi K, Sakurai T, Dawson S, MayerRJ, Itoh K, Fujita J. MAGE-A4 interacts with the liver oncoprotein gankyrin and suppresses its tumorigenic activity. J Biol Chem 2003; 278: 10668-10674. (PMID: 12525503)
40. Cilensek ZM, Yehiely F, Kular RK, Deiss LP. A member of the GAGE family of tumor antigens is an anti-apoptotic gene that con-fers resistance to Fas/CD95/APO-1, Interferon-gamma, taxol and gamma-irradiation. Cancer Biol Ther 2002; 1: 380-387. (PMID: 12432251)
41. Duan Z, Duan Y, Lamendola DE, Yusuf RZ, Naeem R, Penson RT, Seiden MV. Overexpression of MAGE/GAGE genes in paclitaxel/doxorubicin-resistant human cancer cell lines. Clin Cancer Res2003; 9: 2778-2785. (PMID: 12855658)
42. Park JH, Kong GH, Lee SW. hMAGE-A1 overexpression reduces TNF-alpha cytotoxicity in ME-180 cells. Mol Cells 2002; 14: 122-129. (PMID: 12243341)
43. Castellucci M, Kaufmann P. Basic structure of the villous tree. In: Pathology of the human placenta. 5th edition. Benirschke K, Kauf-mann P, Baergen RN. (Eds.) Heidelberg (Germany): Springer-Verlag; 2006; 50-99.
44. Frank HG, Kaufmann P. Nonvillous parts and trophoblast inva-sion. In: Pathology of the human placenta. 5th edition. Benirschke K, Kaufmann P, Baergen RN. (Eds.) Heidelberg (Germany): Springer-Verlag; 2006; 191-287.
Materials and methodsTissue samples
Formalin-fixed paraffin embedded (FFPE) placental tissue was retrieved from the archives of the Department of Pediatric Pathology and Placentology of the Virchow Campus, Charité Hospital (Berlin, Germany) in accordance with local legal regulations. Hematoxylin-eosin stained slides were re-examined and representative blocks were chosen for
immunohistochemical analysis. The tissue panel consisted of placentas with normal maturation status and placentas with pathomorphological changes such as hydatiform moles. For normal tissues, placentas with known clinical gestational age and matching morphology were chosen for further analysis.
ImmunohistochemistryFor the analysis of CT antigens, the following mAbs were used:
MA454 (to MAGE-A1), M3H67 (to MAGE-A3/6), 57B (to MAGE-A4), CT7-33 (to CT7/MAGE-C1), E978 (to NY-ESO-1), CT10#5 (to CT10/MAGE-C2), and mAb clone #23 (to GAGE). Except for the mAb to GAGE which is a commercially available reagent (Transduction Labs, Lexington, KY), the remaining anti-CT reagents were previously generated by our group. For the delineation of particular placental cellular and tissue components, additional mAbs to the following antigens were employed: pancytokeratin (AE1/AE3, DAKO-Cytomation, Carpinteria, CA), HLA-G (4H84, Santa Cruz, Santa Cruz, CA), vimentin (V9, DAKO), desmin (D33, DAKO), alpha-smooth-muscle actin (1A4, DAKO-Cytomation), and CD45RA/LCA (2B11, DAKO-Cytomation). As a positive control for the anti-CT reagents, testis tissue with preserved spermatogenesis was used.
Immunohistochemical staining was performed as described previously (4, 5, 7). Briefly, paraffin cuts (5 µm) were applied to slides for immunohistochemistry (Superfrost Plus, Menzel, Braunschweig, Germany) and heated overnight at 60°C. Slides were de-paraffinized and rehydrated in a series of graded alcohols. Antigen retrieval was performed by placing the slides in buffer solution and heating for 30 minutes in a steamer (Sunbeam-Oster, Fort Lauderdale, FL). EDTA buffer (1 mM, pH 8.0) was used as antigen retrieval solution for all mAbs except for CT7-33, which was heated in citrate buffer (10 mM, pH 6), and ES121, for which a DAKO hipH retrieval solution was employed (DAKO-Cytomation). All primary antibodies were incubated overnight at 4°C. ES121 was detected using the Envision-plus secondary reagent (DAKO-Cytomation) while for all other primary antibodies a biotinylated horse anti-mouse secondary antibody (1:200, Vector, Burlingame, CA) was used, followed by an avidin-biotin complex system (ABC-Elite, Vector). In tissues with strong background staining, the assay was repeated using the Envision-plus reagent. For all assays, 3,3'-diaminobenzidine tetrahydrochloride (DAB, Biogenex, San Ramon, CA) served as a chromogen and Gill's hematoxylin as counterstain.
The extent of staining was estimated and graded as follows: -, negative; focal, <5%; +, 5% to <25%; ++ 25% to <50%, +++, 50% to <75%; ++++, 75% or more. For the morphological evaluation of the placenta specimens, we adhered to the description and the nomenclature described previously (43, 44). Since most immunostaining was seen in the trophoblastic epithelium, a simplified classification of the trophoblast was employed: We distinguish villous from extravillous trophoblast (Table 1) and graded both groups separately. The cellular components of each group were graded as one entity to avoid extended sub-grouping. Nevertheless, the immunopositive structures were specified in Table 1. For the villi, cytotrophoblast (CT) was distinguished from syncytiotrophoblast (ST). All trophoblastic structures outside the villi proper were regarded as extravillous trophoblast, and were also graded as one entity. However, based on the localization, staining of the extravillous trophoblast was further specified as to its location in the chorionic plate (CP), basal plate (BP), cell islands (CI) and/or cell columns (CC). For ease of classification, we did not further distinguish the
www.cancerimmunity.org 11 of 12

Cancer Immunity (24 August 2007) Vol. 7, p. 15
trophoblast cell types of the basal plate (e.g. endovascular trophoblast, small spindle shaped intermediate trophoblast, etc.) but rather regarded the basal plate and its trophoblastic population as one cell population. We also regarded the septa as part of the basal plate and did not separate the immunoreactivity of its trophoblast population from the remainder of basal plate. Similar structures without connection to the basal plate were regarded as cell islands. At the chorionic plate, the extravillous trophoblast consisted primarily of cells located on the maternal side between the villi. The extravillous trophoblast proliferations on the tips of the villi connecting with the basal plate and giving rise to the invasive trophoblast population were referred to as cell columns. Chorion laeve was not included in this analysis.
ContactAddress correspondence to:
Achim A. Jungbluth M.D.Ludwig Institute for Cancer Research atMemorial Sloan-Kettering Cancer Center1275 York Avenue, Box 32New York, NY 10021USATel.: + 1 646 888-2340Fax: + 1 646 422-0492E-mail: [email protected]
Supplemental dataSupplementary Figure 1. High resolution version of Figure 1.Download from http://www.cancerimmunity.org/v7p15/070611_suppl_fig1.pdf (4.4 MB PDF file).
Supplementary Figure 2. High resolution version of Figure 2.Download from http://www.cancerimmunity.org/v7p15/070611_suppl_fig2.pdf (3.8 MB PDF file).
Supplementary Figure 3. High resolution version of Figure 3.Download from http://www.cancerimmunity.org/v7p15/070611_suppl_fig3.pdf (3.8 MB PDF file).
Entire supplemental data set.Download from http://www.cancerimmunity.org/v7p15/070611_suppl_data.zip (12 MB WinZip file).
12 of 12 www.cancerimmunity.org