exposure and dosimetry considerations for adverse outcome ... · exposure and dosimetry...
TRANSCRIPT
Office of Research and Development
Exposure and Dosimetry Considerations for Adverse Outcome Pathways
John Wambaugh National Center for Computational Toxicology
Adverse Outcome Pathways: From Research to Regulation
Bethesda, Maryland, USA September 3-5, 2014
Office of Research and Development U.S. Environmental Protection Agency
Research Triangle Park, NC 27711
Office of Research and Development 2 of 23
Introduction
• Risk is a function of both of hazard and exposure
• Toxicokinetic (TK) models can determine whether chemical exposures produce potentially hazardous tissue concentrations
• Whether or not an AOP initial molecular event (MIE) occurs depends on both exposure and TK
• As high throughput screening (HTS) identifies putative MIEs and key events, chemical-specific TK and exposure data will be needed to make prioritizations based on risk
Office of Research and Development 3 of 23
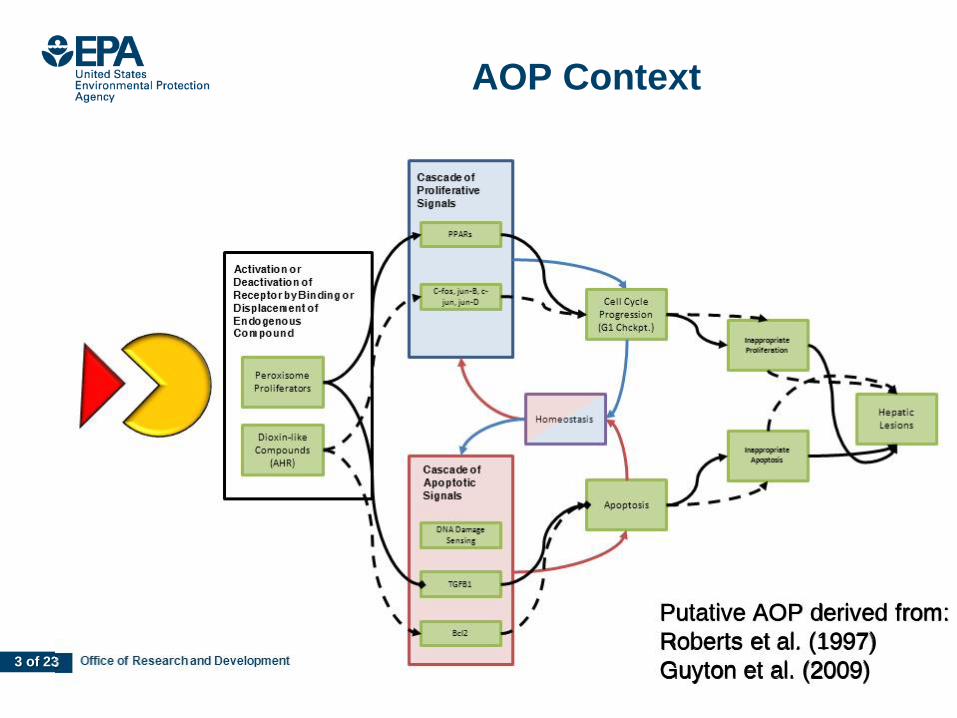
AOP Context
Putative AOP derived from: Roberts et al. (1997) Guyton et al. (2009)
Office of Research and Development 4 of 23
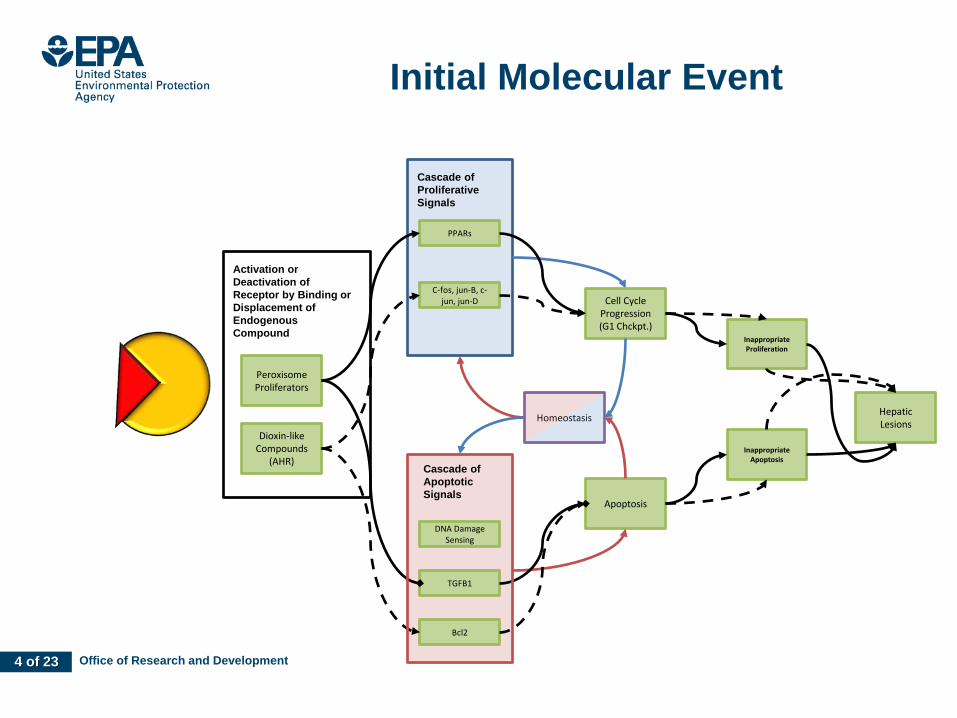
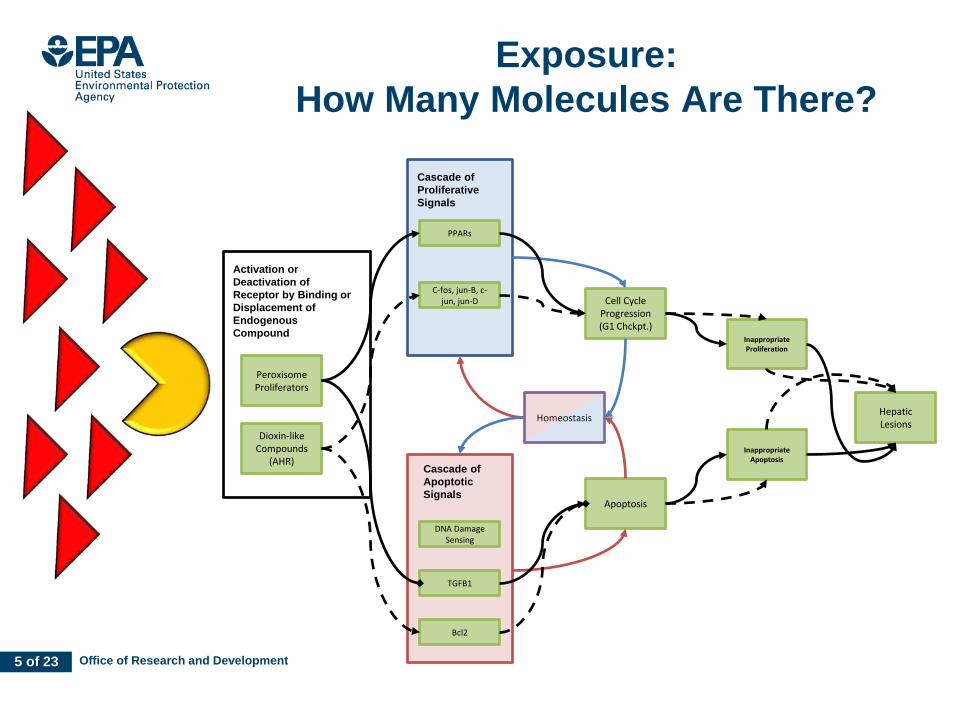
Initial Molecular Event
PPARs
TGFB1
Inappropriate Apoptosis
Inappropriate Proliferation
Hepatic Lesions
Peroxisome Proliferators
Activation or Deactivation of Receptor by Binding or Displacement of Endogenous Compound
Cell Cycle Progression (G1 Chckpt.)
Apoptosis
Cascade of Proliferative Signals
Cascade of Apoptotic Signals
DNA Damage Sensing
C-fos, jun-B, c-jun, jun-D
Dioxin-like Compounds
(AHR)
Bcl2
Homeostasis
Office of Research and Development
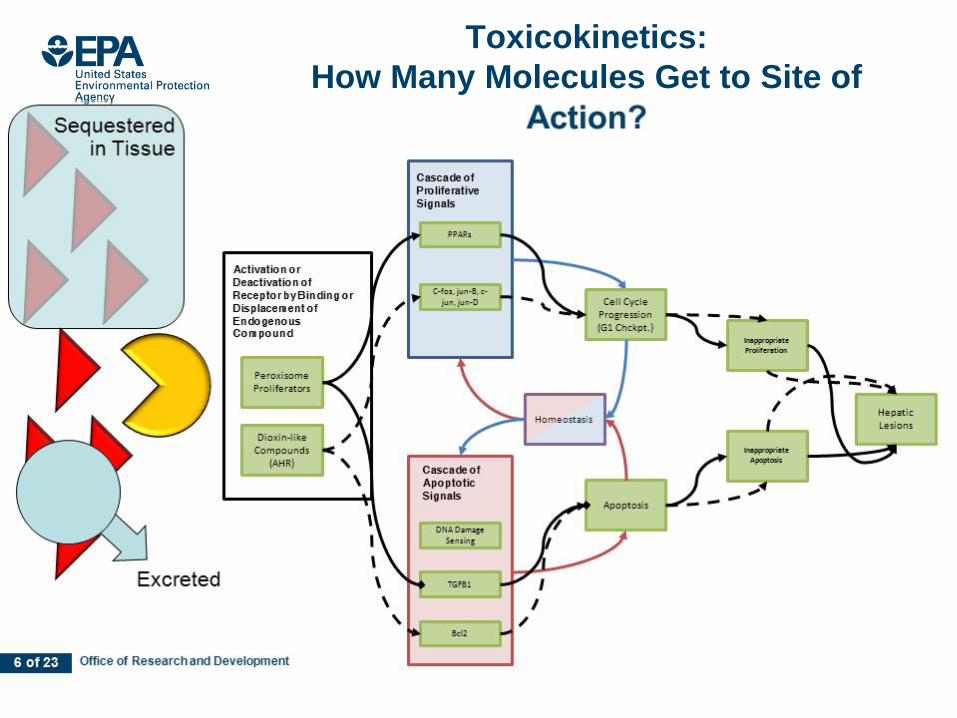
PPARs
TGFB1
Inappropriate Apoptosis
Inappropriate Proliferation
Hepatic Lesions
Peroxisome Proliferators
AcDeReDiEnCo
tivation or activation of ceptor by Binding or splacement of dogenous mpound
Cell Cycle Progression (G1 Chckpt.)
Apoptosis
Cascade of Proliferative Signals
Cascade of Apoptotic Signals
DNA Damage Sensing
C-fos, jun-B, c-jun, jun-D
Dioxin-like Compounds
(AHR)
Bcl2
Homeostasis
5 of 23
Exposure: How Many Molecules Are There?
Office of Research and Development 6 of 23
Toxicokinetics: How Many Molecules Get to Site of
Action?
Office of Research and Development 7 of 23
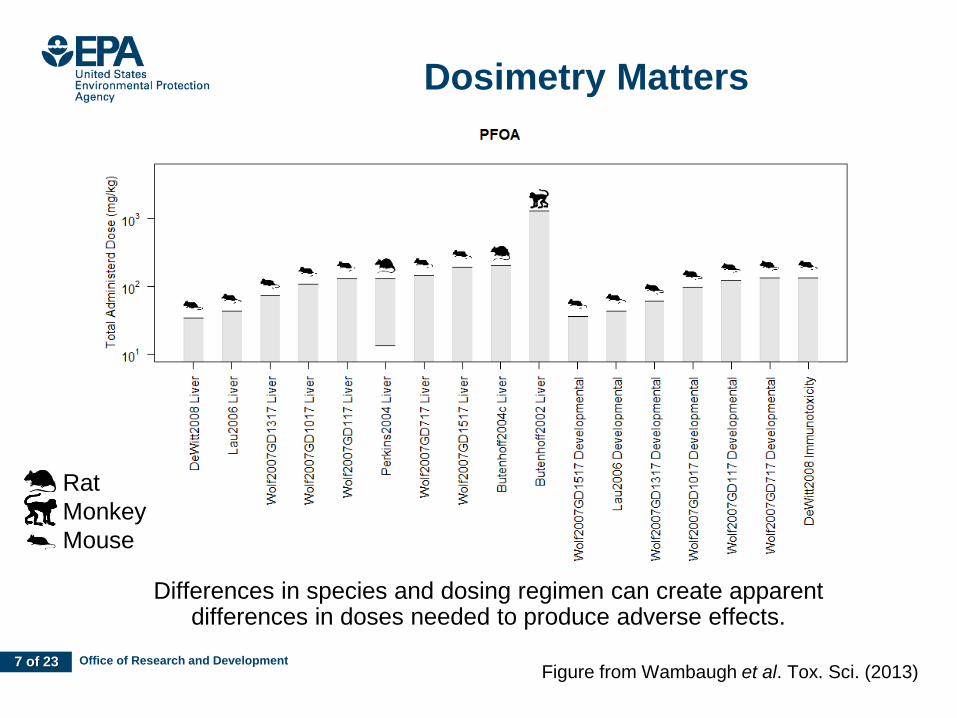
Dosimetry Matters
Differences in species and dosing regimen can create apparent differences in doses needed to produce adverse effects.
Figure from Wambaugh et al. Tox. Sci. (2013)
Rat Monkey Mouse
Office of Research and Development 8 of 23
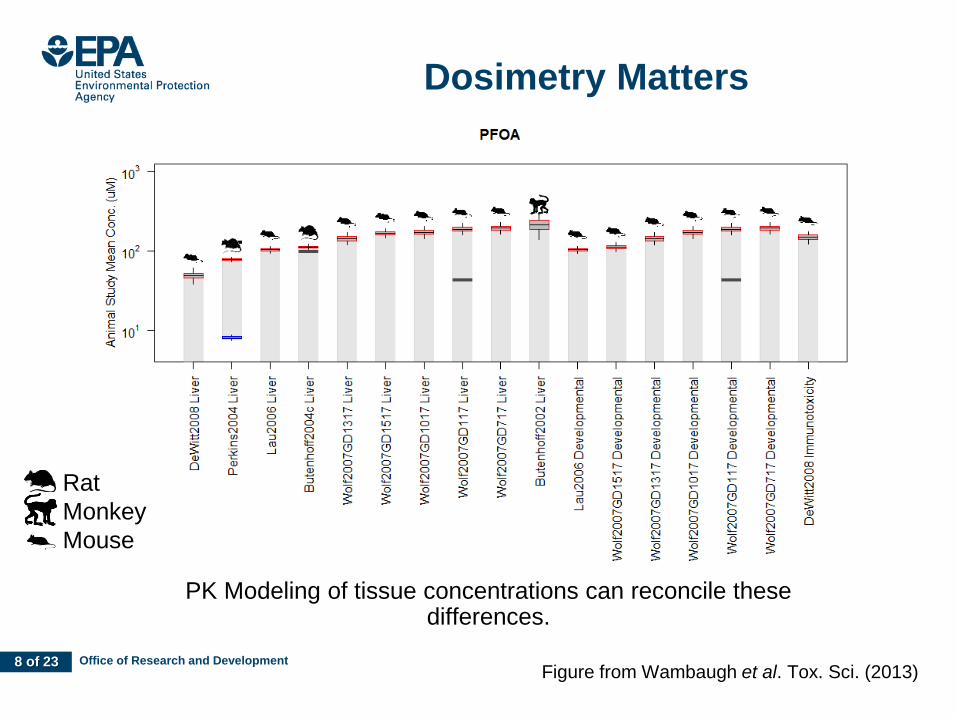
Dosimetry Matters
PK Modeling of tissue concentrations can reconcile these differences.
Figure from Wambaugh et al. Tox. Sci. (2013)
Rat Monkey Mouse
Office of Research and Development 9 of 23
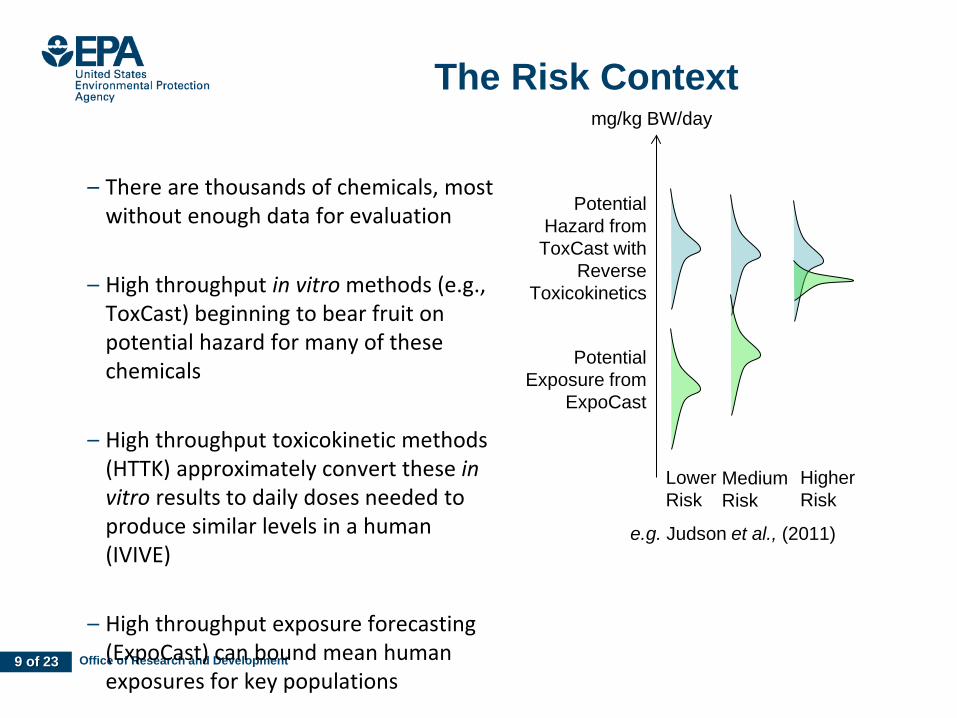
The Risk Context
– There are thousands of chemicals, most without enough data for evaluation
– High throughput in vitro methods (e.g., ToxCast) beginning to bear fruit on potential hazard for many of these chemicals
– High throughput toxicokinetic methods (HTTK) approximately convert these in vitro results to daily doses needed to produce similar levels in a human (IVIVE)
– High throughput exposure forecasting (ExpoCast) can bound mean human exposures for key populations
mg/kg BW/day
Lower Risk
Medium Risk
Higher Risk
PotentialExposure from
ExpoCast
PotentialHazard from
ToxCast withReverse
Toxicokinetics
e.g. Judson et al., (2011)
Office of Research and Development 10 of 23
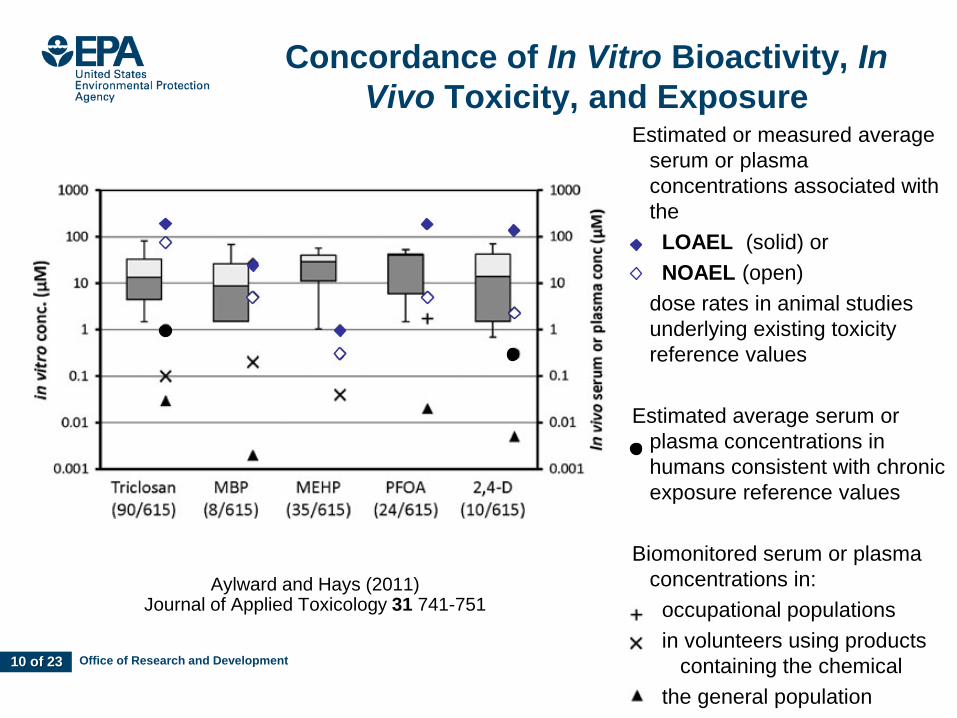
Concordance of In Vitro Bioactivity, In Vivo Toxicity, and Exposure
Estimated or measured average serum or plasma concentrations associated with the
LOAEL (solid) or NOAEL (open)
dose rates in animal studies underlying existing toxicity reference values
Estimated average serum or
plasma concentrations in humans consistent with chronic exposure reference values
Biomonitored serum or plasma
concentrations in: occupational populations in volunteers using products
containing the chemical the general population
Aylward and Hays (2011) Journal of Applied Toxicology 31 741-751
Office of Research and Development 11 of 23
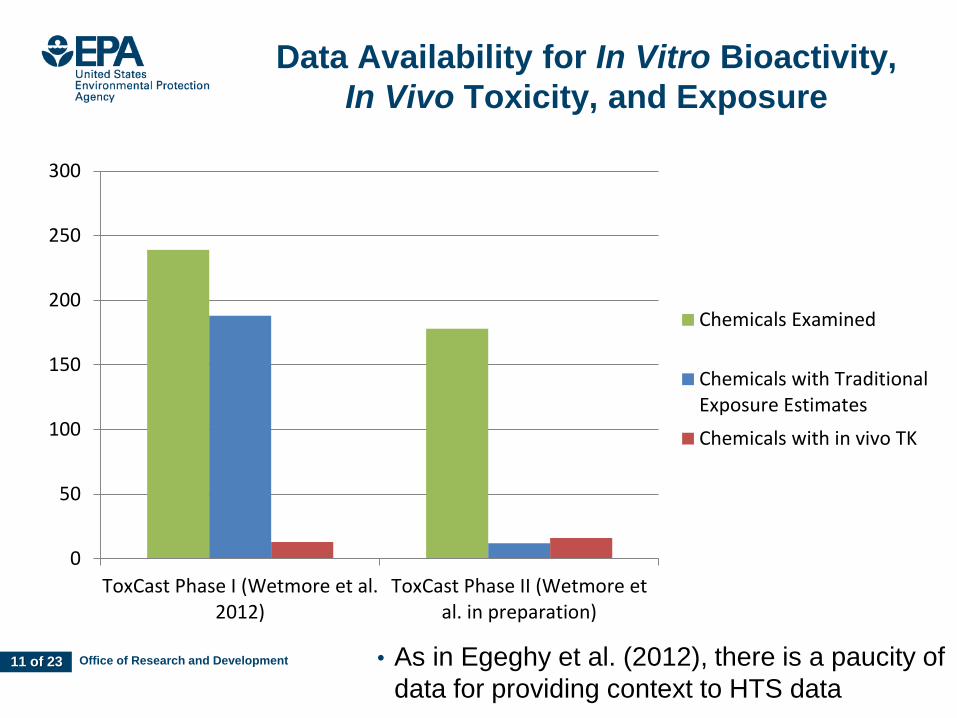
Data Availability for In Vitro Bioactivity, In Vivo Toxicity, and Exposure
• As in Egeghy et al. (2012), there is a paucity of data for providing context to HTS data
0
50
100
150
200
250
300
ToxCast Phase I (Wetmore et al.2012)
ToxCast Phase II (Wetmore etal. in preparation)
Chemicals Examined
Chemicals with TraditionalExposure EstimatesChemicals with in vivo TK
Office of Research and Development 12 of 23
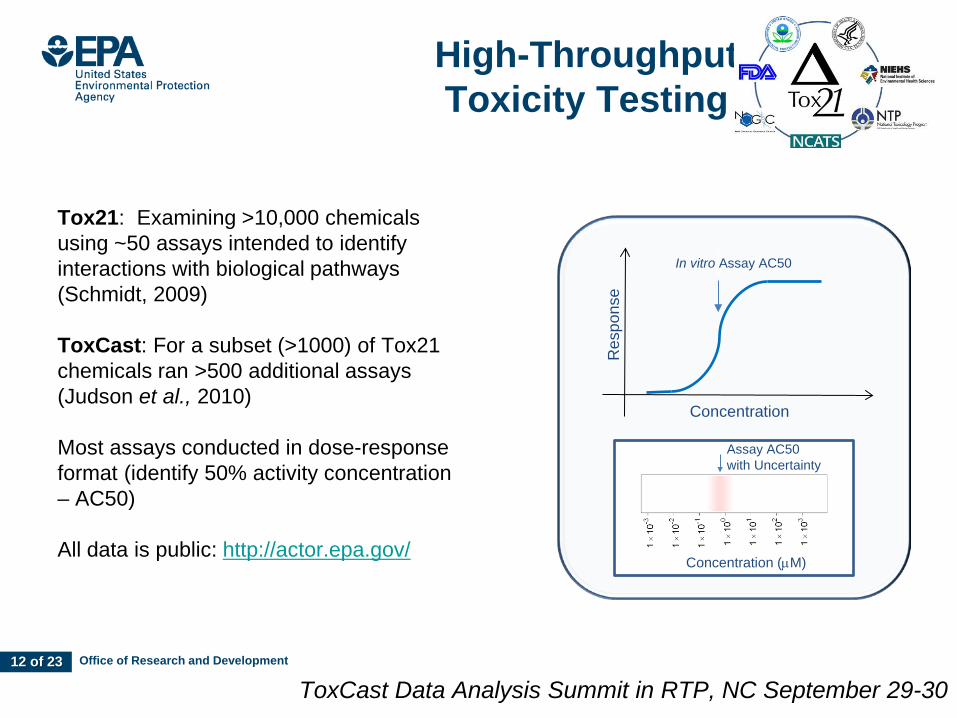
High-Throughput Toxicity Testing
Tox21: Examining >10,000 chemicals using ~50 assays intended to identify interactions with biological pathways (Schmidt, 2009) ToxCast: For a subset (>1000) of Tox21 chemicals ran >500 additional assays (Judson et al., 2010) Most assays conducted in dose-response format (identify 50% activity concentration – AC50) All data is public: http://actor.epa.gov/
Concentration
Res
pons
e
In vitro Assay AC50
Concentration (µM)
Assay AC50 with Uncertainty
ToxCast Data Analysis Summit in RTP, NC September 29-30
Office of Research and Development 13 of 23
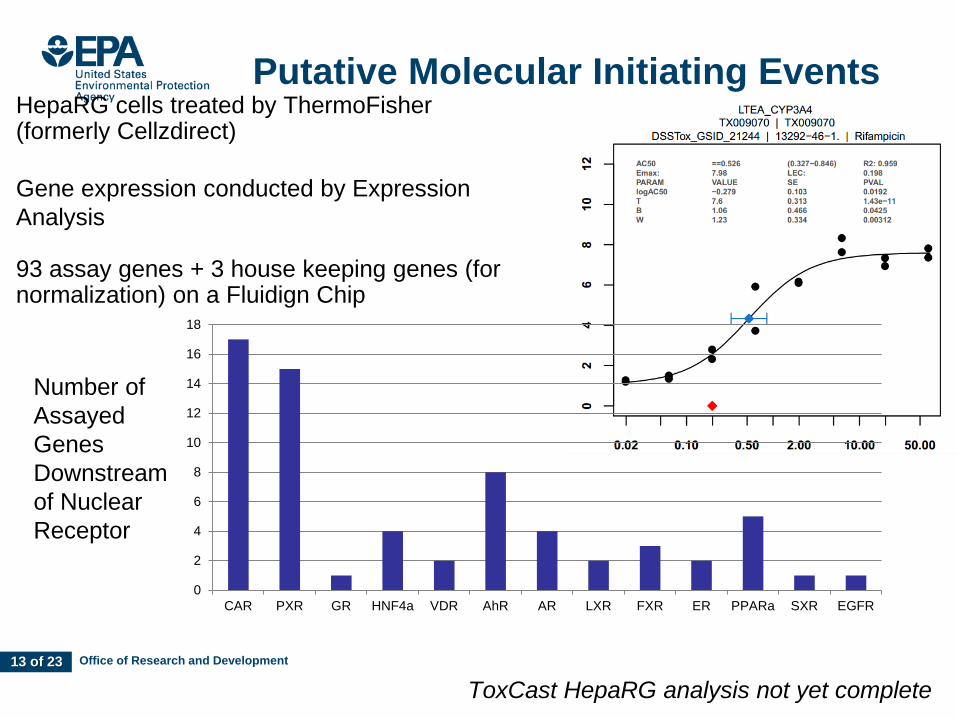
Putative Molecular Initiating Events
HepaRG cells treated by ThermoFisher (formerly Cellzdirect) Gene expression conducted by Expression Analysis 93 assay genes + 3 house keeping genes (for normalization) on a Fluidign Chip
ToxCast HepaRG analysis not yet complete
Number of Assayed Genes Downstream of Nuclear Receptor
0
2
4
6
8
10
12
14
16
18
CAR PXR GR HNF4a VDR AhR AR LXR FXR ER PPARa SXR EGFR
Office of Research and Development 14 of 23
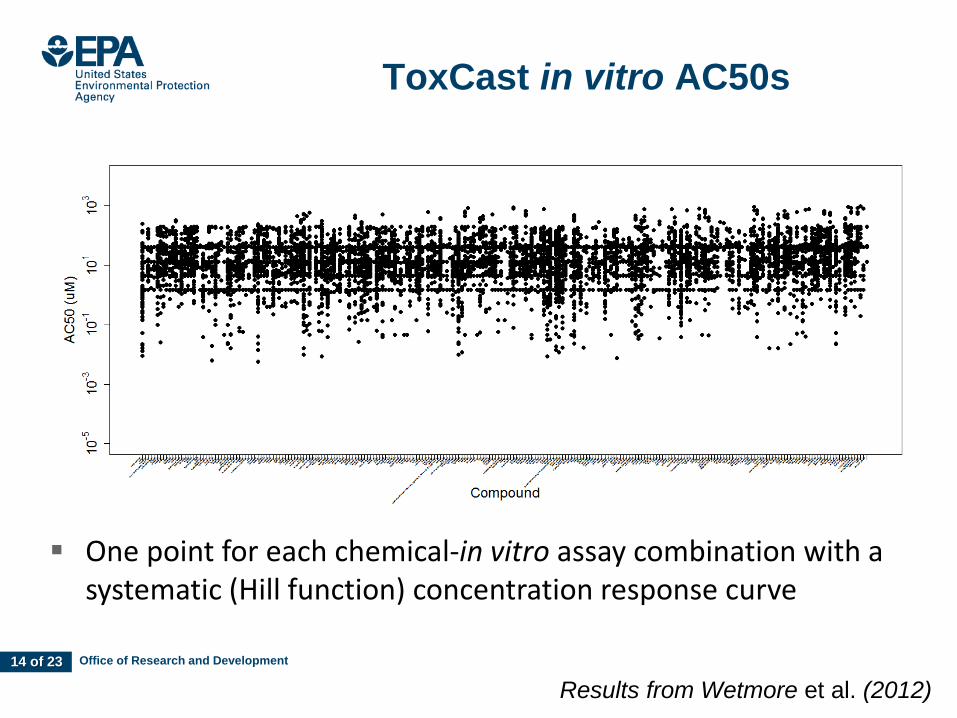
ToxCast in vitro AC50s
One point for each chemical-in vitro assay combination with a systematic (Hill function) concentration response curve
Results from Wetmore et al. (2012)
Office of Research and Development 15 of 23
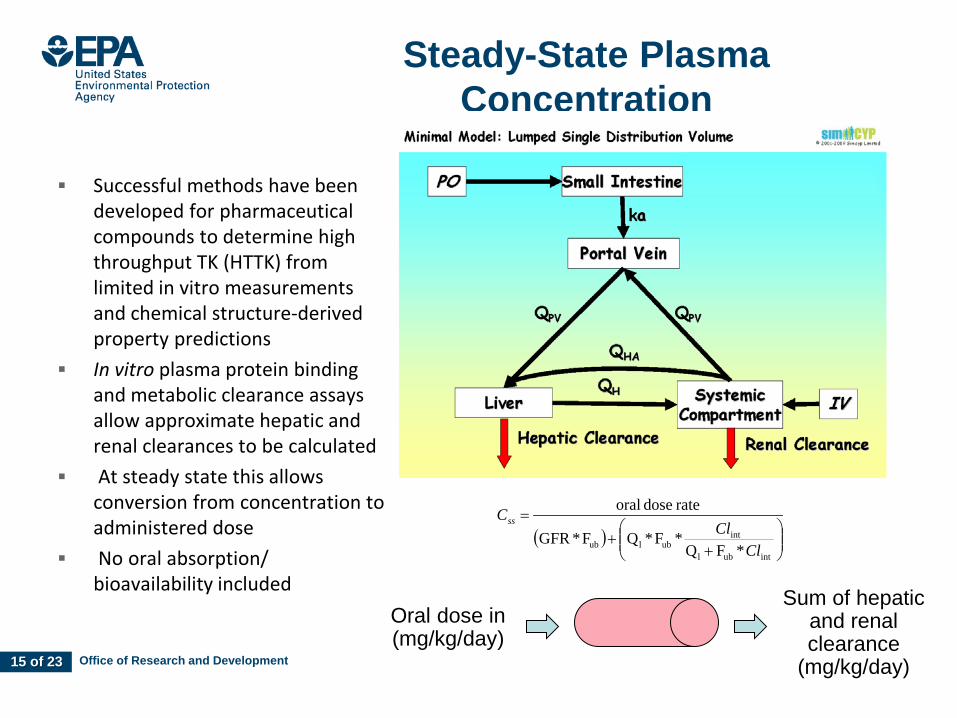
Steady-State Plasma Concentration
Successful methods have been developed for pharmaceutical compounds to determine high throughput TK (HTTK) from limited in vitro measurements and chemical structure-derived property predictions
In vitro plasma protein binding and metabolic clearance assays allow approximate hepatic and renal clearances to be calculated
At steady state this allows conversion from concentration to administered dose
No oral absorption/ bioavailability included
Oral dose in (mg/kg/day)
Sum of hepatic and renal clearance
(mg/kg/day)
( )
+
+=
intubl
intublub *FQ
*F*QF*GFR
rate dose oral
ClCl
Css
Office of Research and Development 16 of 23
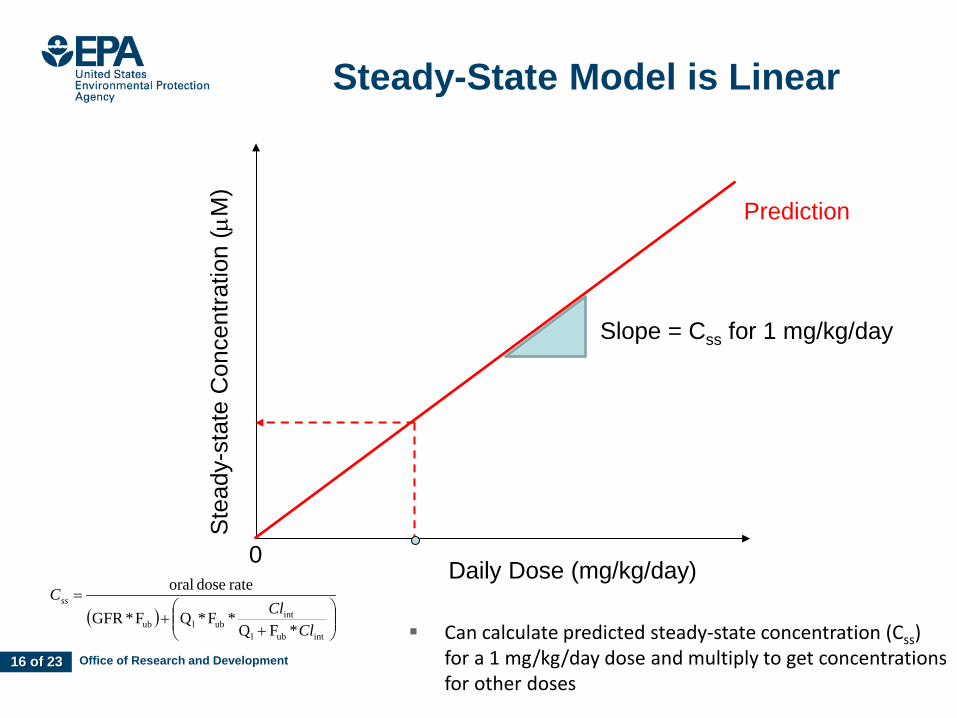
Steady-State Model is Linear
Ste
ady-
stat
e C
once
ntra
tion
(µM
)
Daily Dose (mg/kg/day) 0
Prediction
( )
+
+=
intubl
intublub *FQ
*F*QF*GFR
rate dose oral
ClCl
Css
Can calculate predicted steady-state concentration (Css) for a 1 mg/kg/day dose and multiply to get concentrations for other doses
Slope = Css for 1 mg/kg/day
Office of Research and Development 17 of 23
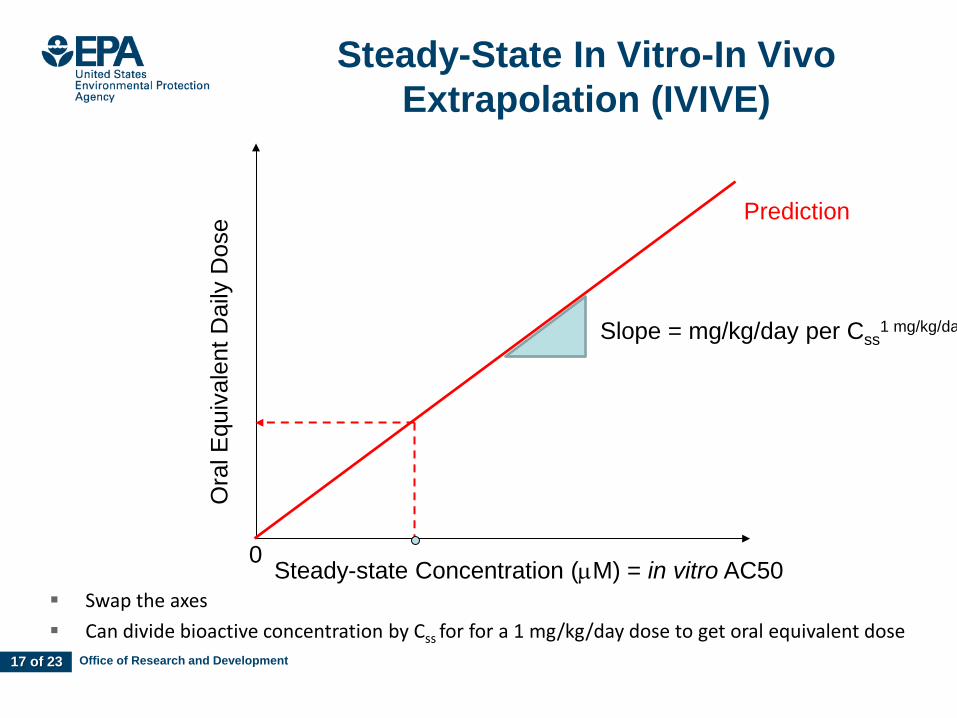
Steady-State In Vitro-In Vivo Extrapolation (IVIVE)
Ora
l Equ
ival
ent D
aily
Dos
e
Steady-state Concentration (µM) = in vitro AC50 0
Prediction
Swap the axes Can divide bioactive concentration by Css for for a 1 mg/kg/day dose to get oral equivalent dose
Slope = mg/kg/day per Css1 mg/kg/da
Office of Research and Development 18 of 23
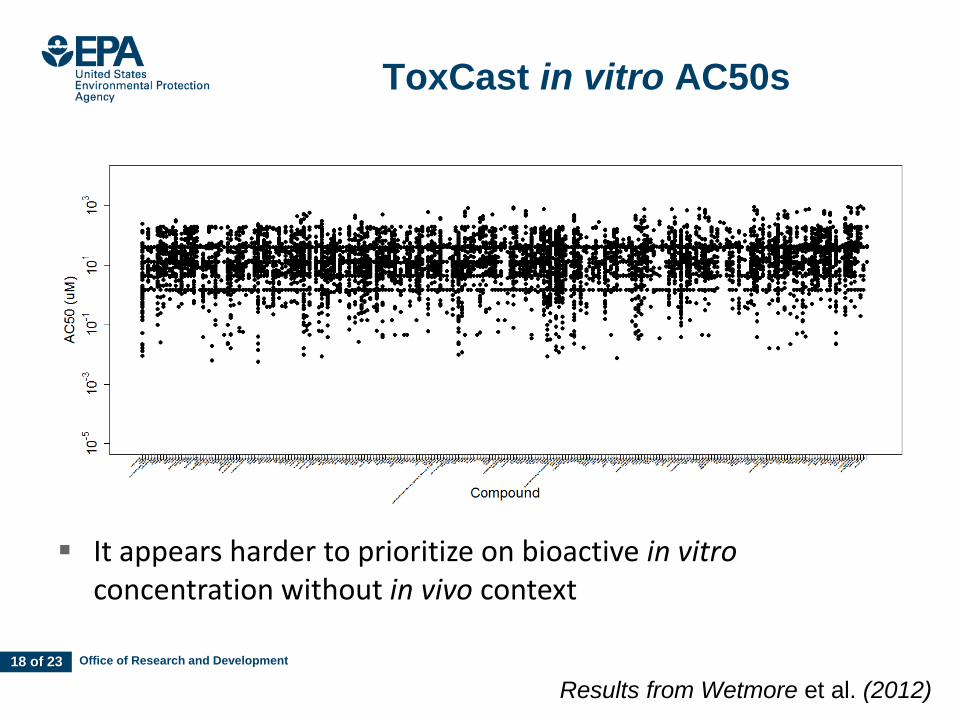
ToxCast in vitro AC50s
It appears harder to prioritize on bioactive in vitro concentration without in vivo context
Results from Wetmore et al. (2012)
Office of Research and Development 19 of 23
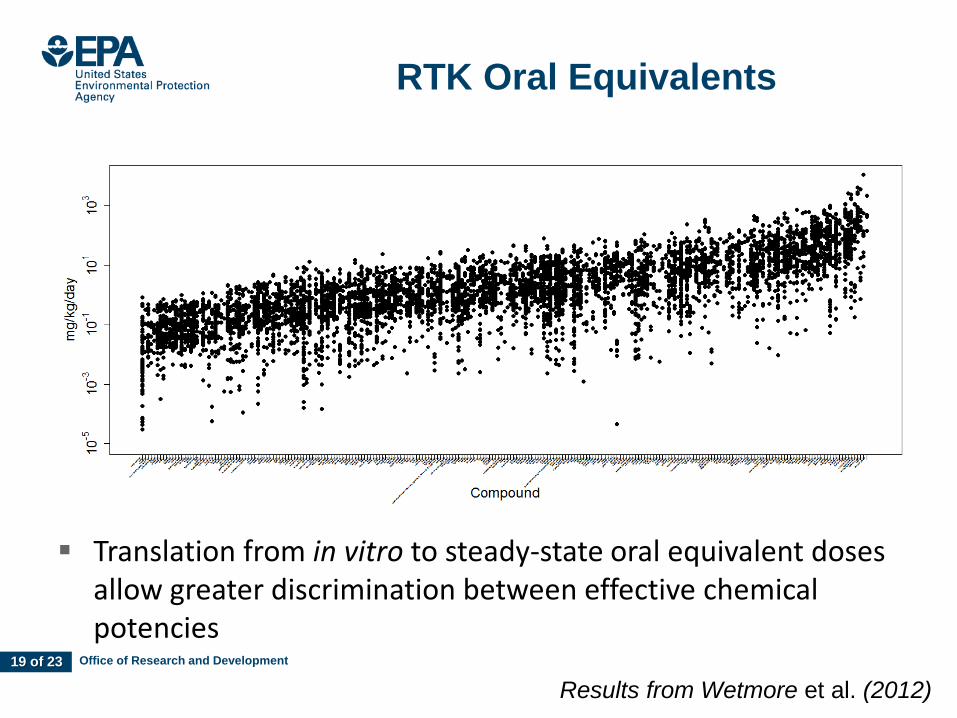
RTK Oral Equivalents
Translation from in vitro to steady-state oral equivalent doses allow greater discrimination between effective chemical potencies
Results from Wetmore et al. (2012)
Office of Research and Development 20 of 23
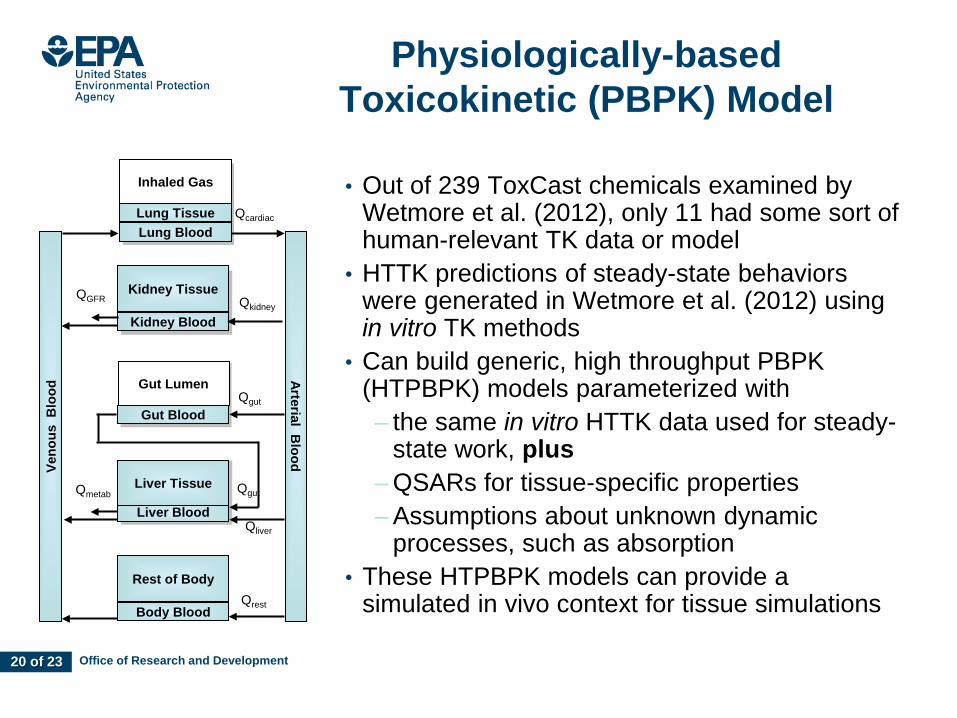
Physiologically-based Toxicokinetic (PBPK) Model
Inhaled Gas
Qliver
Qgut
Qgut
Kidney Blood
Gut Blood
Gut Lumen
QGFR Kidney Tissue
Liver Blood
Liver Tissue
Qrest
Lung Blood Lung Tissue Qcardiac
Qmetab
Body Blood
Rest of Body
Qkidney
Arterial Blood Ve
nous
Blo
od
• Out of 239 ToxCast chemicals examined by Wetmore et al. (2012), only 11 had some sort of human-relevant TK data or model
• HTTK predictions of steady-state behaviors were generated in Wetmore et al. (2012) using in vitro TK methods
• Can build generic, high throughput PBPK (HTPBPK) models parameterized with – the same in vitro HTTK data used for steady-
state work, plus – QSARs for tissue-specific properties – Assumptions about unknown dynamic
processes, such as absorption • These HTPBPK models can provide a
simulated in vivo context for tissue simulations
20
Office of Research and Development 21 of 23
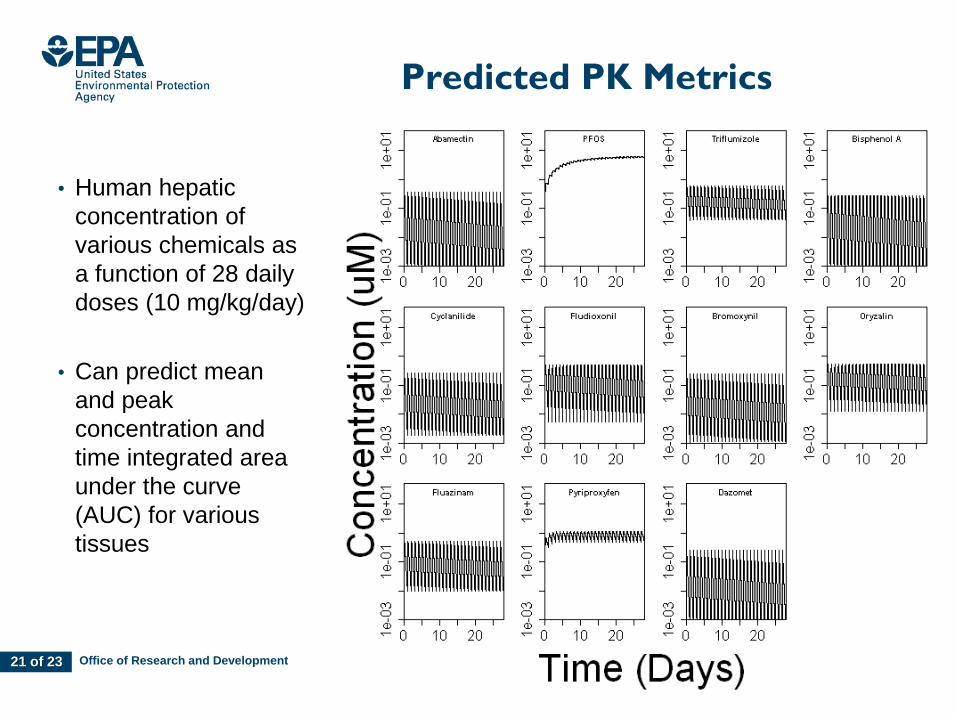
Predicted PK Metrics
• Human hepatic concentration of various chemicals as a function of 28 daily doses (10 mg/kg/day)
• Can predict mean and peak concentration and time integrated area under the curve (AUC) for various tissues
Office of Research and Development 22 of 23
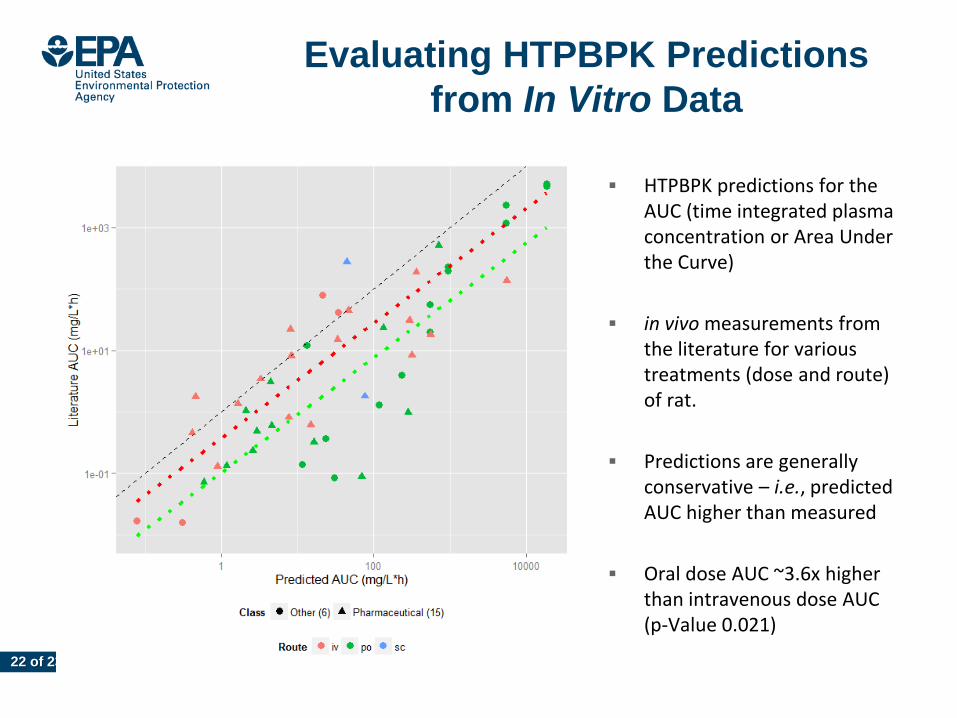
Evaluating HTPBPK Predictions from In Vitro Data
HTPBPK predictions for the AUC (time integrated plasma concentration or Area Under the Curve)
in vivo measurements from the literature for various treatments (dose and route) of rat.
Predictions are generally conservative – i.e., predicted AUC higher than measured
Oral dose AUC ~3.6x higher than intravenous dose AUC (p-Value 0.021)
22
Office of Research and Development 23 of 23
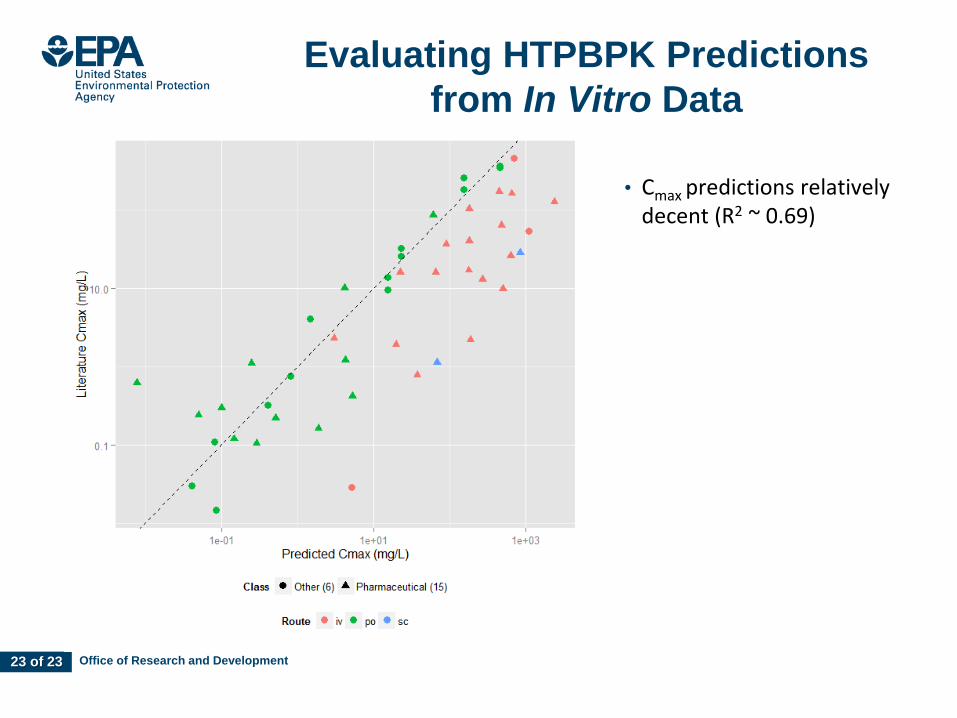
Evaluating HTPBPK Predictions from In Vitro Data
• Cmax predictions relatively decent (R2 ~ 0.69)
23
Office of Research and Development 24 of 23
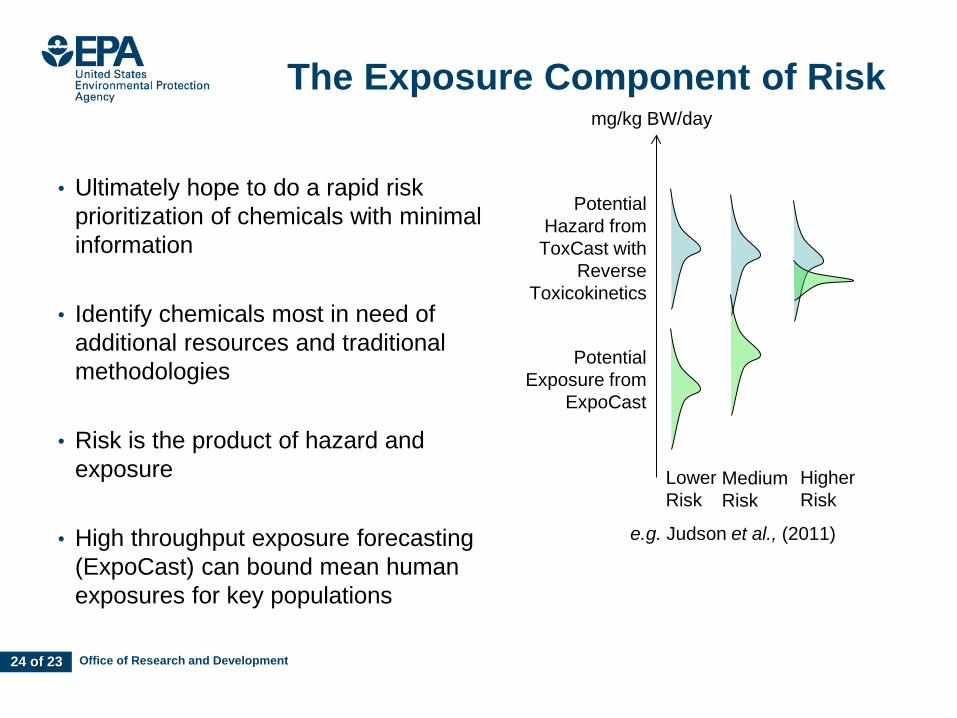
e.g. Judson et al., (2011)
The Exposure Component of Risk
• Ultimately hope to do a rapid risk prioritization of chemicals with minimal information
• Identify chemicals most in need of additional resources and traditional methodologies
• Risk is the product of hazard and exposure
• High throughput exposure forecasting (ExpoCast) can bound mean human exposures for key populations
Potential Exposure from
ExpoCast
mg/kg BW/day
Potential Hazard from
ToxCast with Reverse
Toxicokinetics
Lower Risk
Medium Risk
Higher Risk
Office of Research and Development 25 of 23
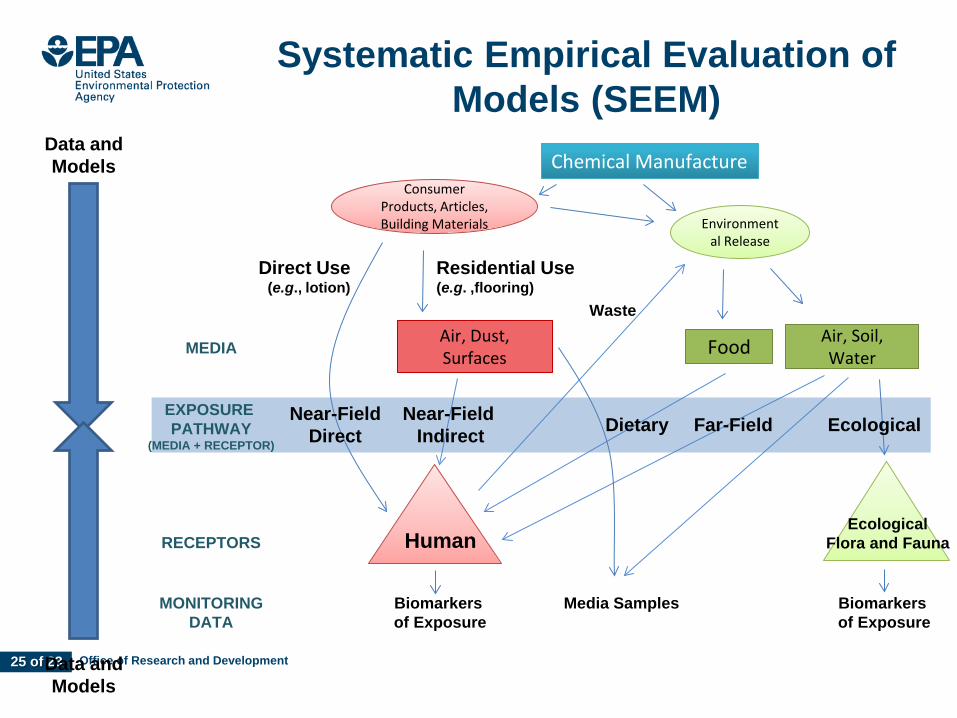
Systematic Empirical Evaluation of Models (SEEM)
Chemical Manufacture Consumer
Products, Articles, Building Materials Environment
al Release
Food Air, Soil, Water
Air, Dust, Surfaces
Near-Field Direct
Near-Field Indirect
Human Ecological
Flora and Fauna
Dietary Far-Field
Direct Use (e.g., lotion)
Residential Use (e.g. ,flooring)
MONITORING DATA
RECEPTORS
MEDIA
EXPOSURE PATHWAY
(MEDIA + RECEPTOR)
Biomarkers of Exposure
Biomarkers of Exposure
Media Samples
Ecological
Waste
Data and Models
Data and Models
26 of 2
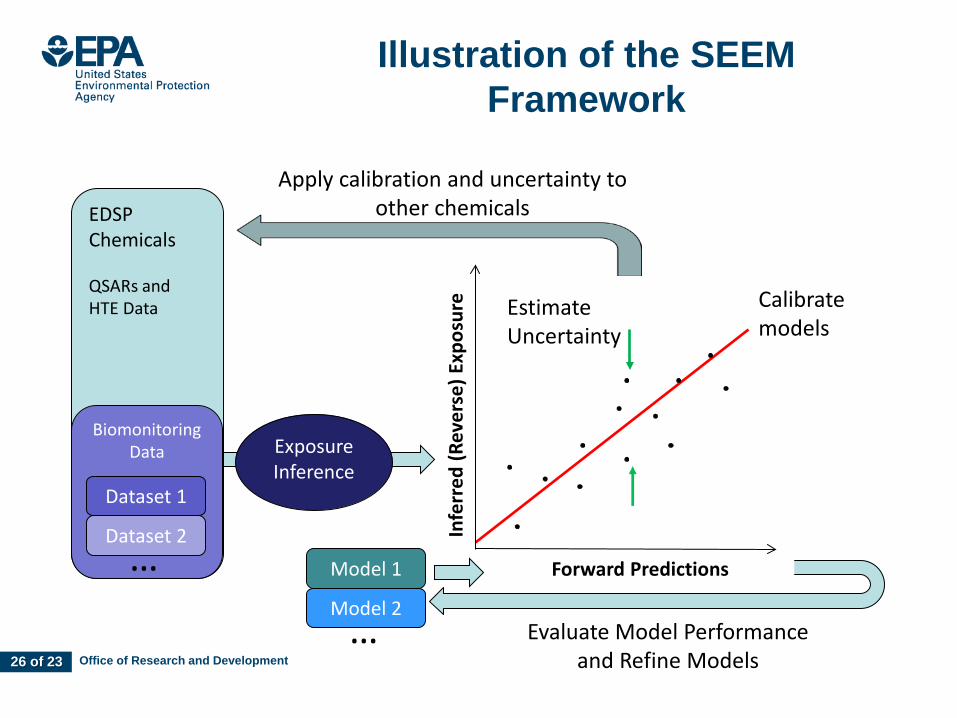
Illustration of the SEEM Framework
Office of Research and Development 3
Estimate Uncertainty
EDSP Chemicals QSARs and HTE Data
Biomonitoring Data
Infe
rred
(Rev
erse
) Exp
osur
e
Model 1
Model 2 …
Calibrate models
Apply calibration and uncertainty to other chemicals
Evaluate Model Performance and Refine Models
Forward Predictions
Exposure Inference
Dataset 1
Dataset 2 …
Office of Research and Development 27 of 23
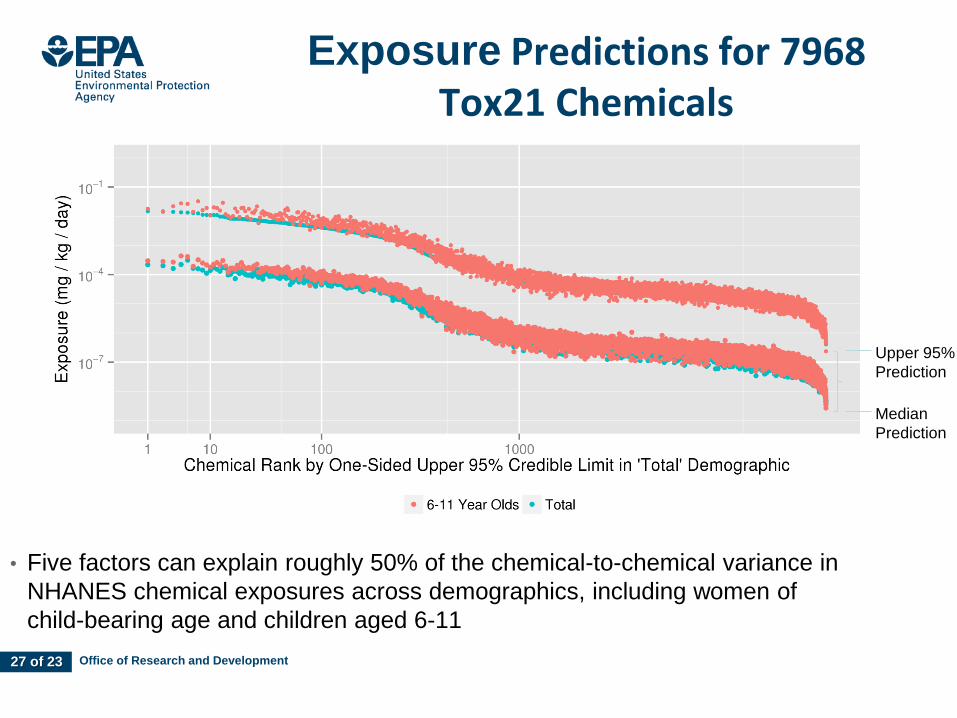
Exposure Predictions for 7968 Tox21 Chemicals
• Five factors can explain roughly 50% of the chemical-to-chemical variance in NHANES chemical exposures across demographics, including women of child-bearing age and children aged 6-11
Upper 95% Prediction
Median Prediction
Office of Research and Development 28 of 23
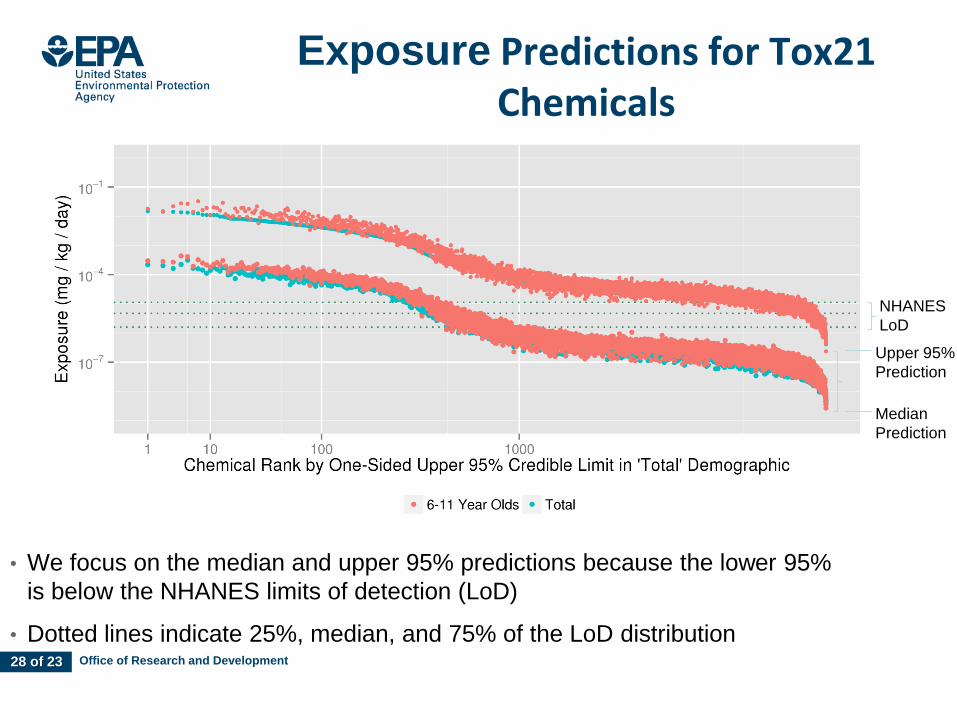
Exposure Predictions for Tox21 Chemicals
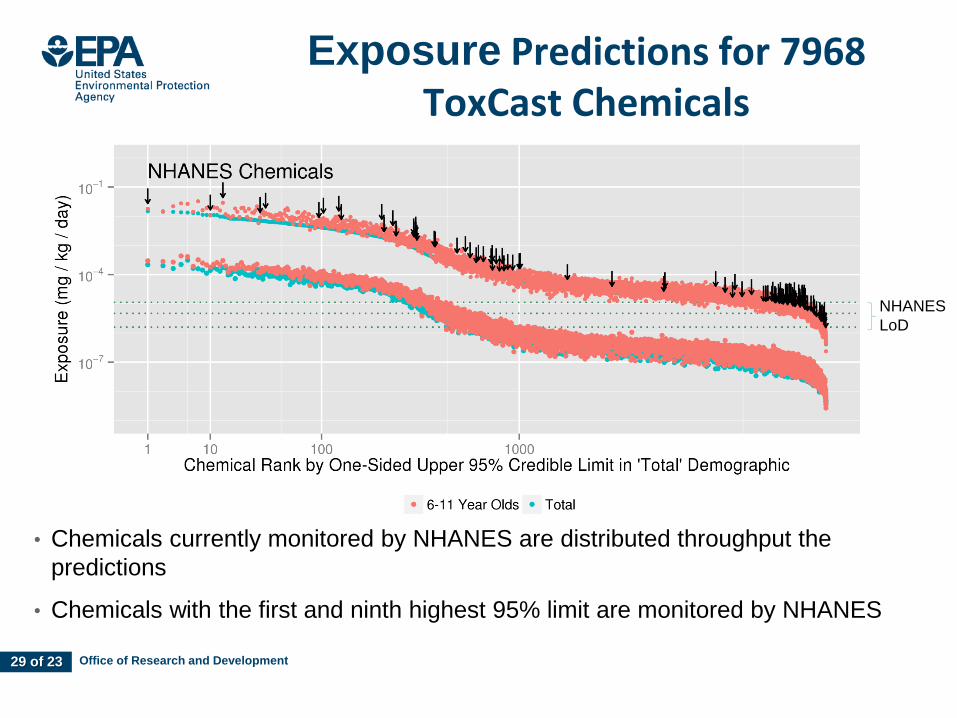
• We focus on the median and upper 95% predictions because the lower 95% is below the NHANES limits of detection (LoD)
• Dotted lines indicate 25%, median, and 75% of the LoD distribution
Upper 95% Prediction
Median Prediction
NHANES LoD
Office of Research and Development 29 of 23
Exposure Predictions for 7968 ToxCast Chemicals
• Chemicals currently monitored by NHANES are distributed throughput the predictions
• Chemicals with the first and ninth highest 95% limit are monitored by NHANES
NHANES LoD
Office of Research and Development 30 of 23
Conclusion
• Using in vitro TK methods developed for pharmaceuticals, we can parameterize HTPBPK models
• We can model the difference between in vivo measurements and HTTK predictions (i.e., the residuals or errors)
• We can connect HTPBPK models to tissue simulations to provide simulated in vivo context for assessing the impact of chemical perturbations identified by high throughput screening assays
Office of Research and Development
Rapid Exposure and Dosimetry
The views expressed in this presentation are those of the author and do not necessarily reflect the views or policies of the U.S. EPA
EPA Office of Research and Development Chemical Safety for Sustainability Research Plan
Indiana UJames Slu
Nethefor ApResearch
niver
(TN
ds O
d Sc ri
ore
y of rolina, Chapel Hillykh*
sity
ganisation entific
O)
ka
rlanplie
Hamner Institutes Barbara Wetm
UniversitNorth Ca Alexander SedAlex Tropsha
Sieto Bosgra
NERL Craig Barber Peter Egeghy Kristin Isaacs Jon Sobus Mark Strynar Rogelio-Torero Velez Daniel Vallero
*Post-Docs / Trainees
NCCT Chantel Nicolas Robert Pearce James Rabinowitz Woody Setzer Cory Strope Anran Wang (NCSU)
*
*
*
ToxCast HepaRG Assay
NRMRL Xiaoyu Liu
NHEERL Hisham El-Masri Jane Ellen Simmons Marina Evans
Jessica Bonzo (ThermoFisher) Stephen Ferguson Jill Franzosa John Jack (NCSU) Parth Kothiya Susan Hester Keith Houck
Patrick Hurban (Expression Analysis)
April Lake Jie Liu Stephen Siferd (EA)
*
* * *