exploring soil sample characteristics you will create a data set from analyzing soil samples. this...
TRANSCRIPT
Exploring Soil Sample Characteristics
You will create a data set from analyzing soil samples.
This is a hands-on activity that will require you to process, prepare, measureDescribe and identify different characteristics between the soils samples.
Starting directions
Newspaper on tableLayout materials provided
Cup of waterPaper towels
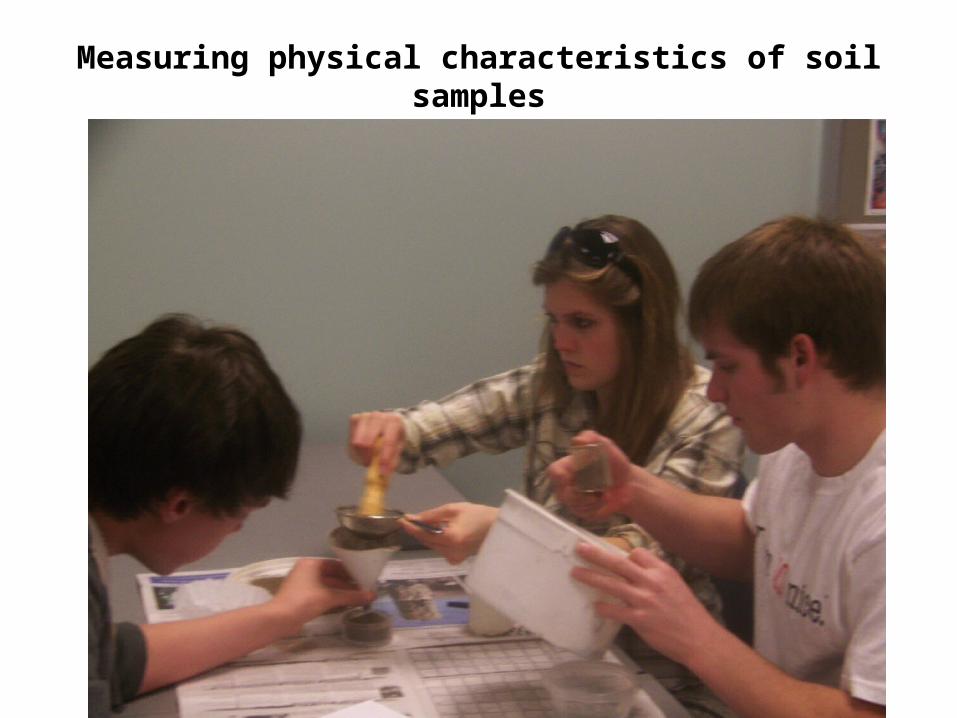
Measuring physical characteristics of soil samples
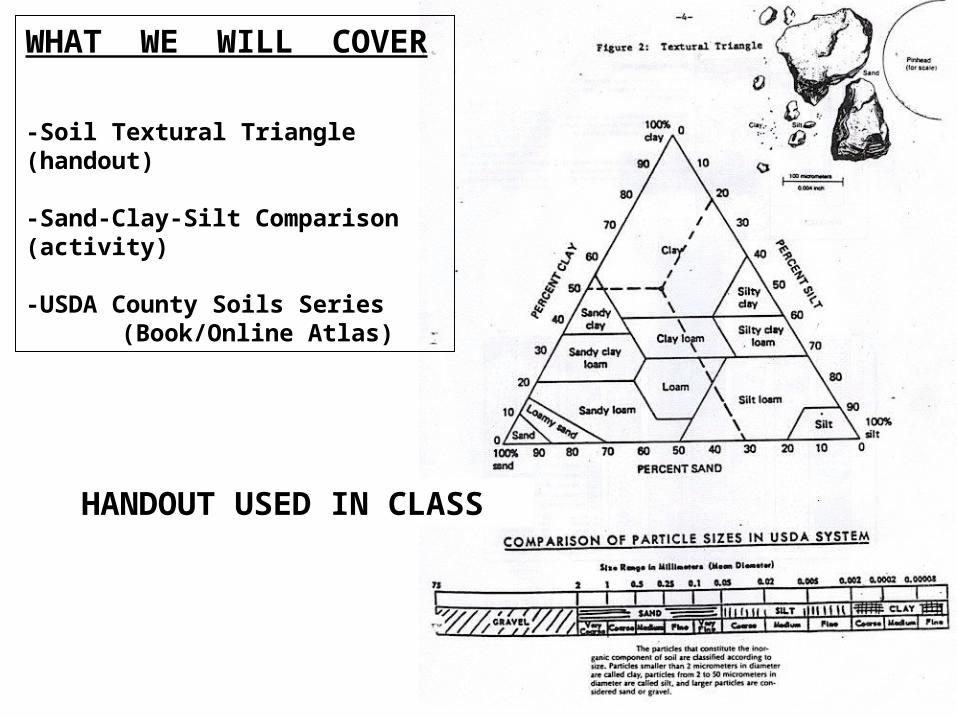
WHAT WE WILL COVER
-Soil Textural Triangle (handout)
-Sand-Clay-Silt Comparison (activity)
-USDA County Soils Series (Book/Online Atlas)
HANDOUT USED IN CLASS

-Do all your work on top of newspapers for easy clean-up-Grind soil sample with wooden dowel in the pail-You will need around one cup of loose material
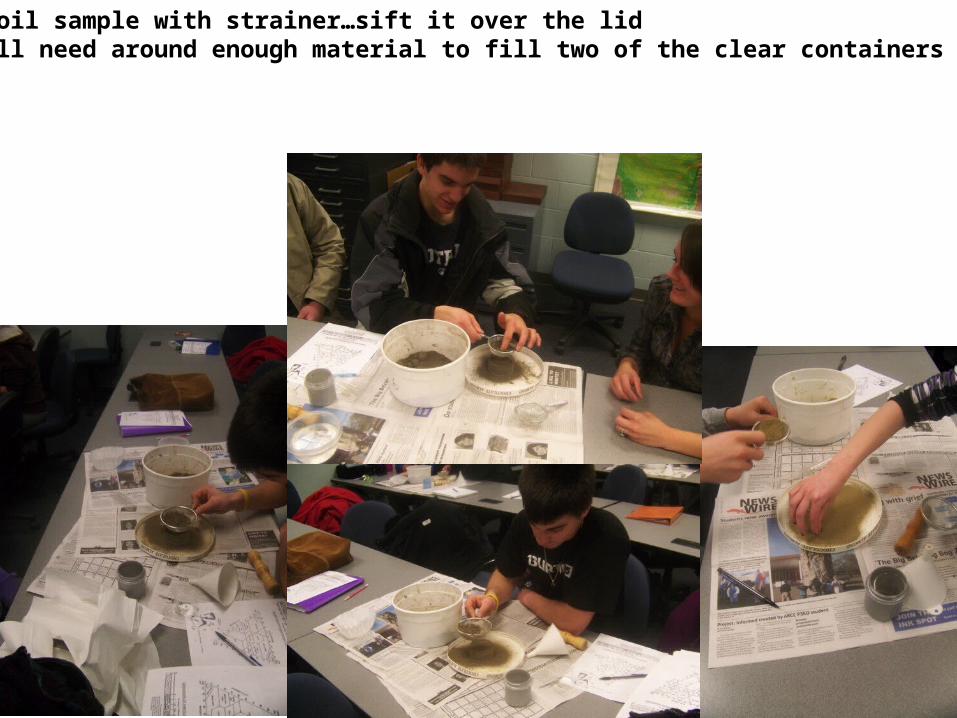
-Sift soil sample with strainer…sift it over the lid-You will need around enough material to fill two of the clear containers
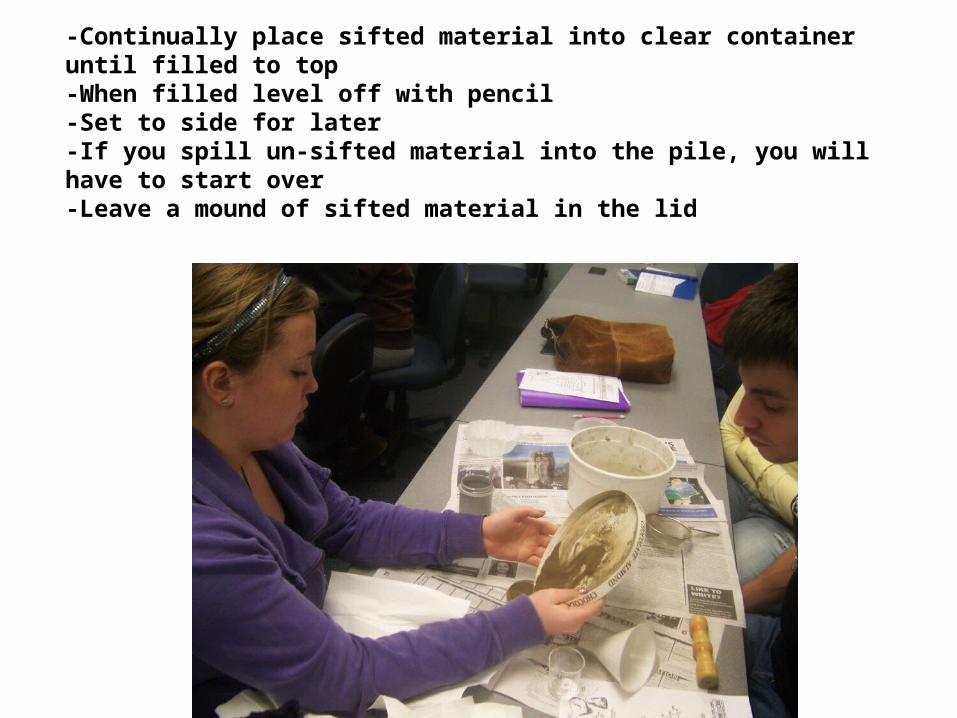
-Continually place sifted material into clear container until filled to top-When filled level off with pencil-Set to side for later-If you spill un-sifted material into the pile, you will have to start over-Leave a mound of sifted material in the lid
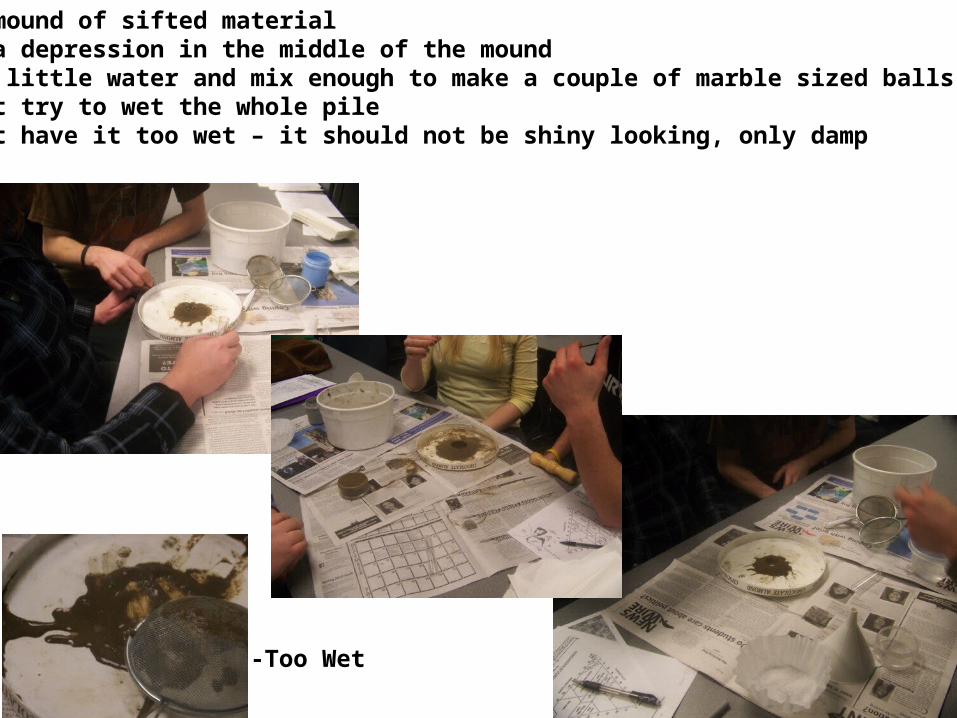
-Make mound of sifted material-Make a depression in the middle of the mound-Add a little water and mix enough to make a couple of marble sized balls-Do not try to wet the whole pile-Do not have it too wet – it should not be shiny looking, only damp
-Too Wet
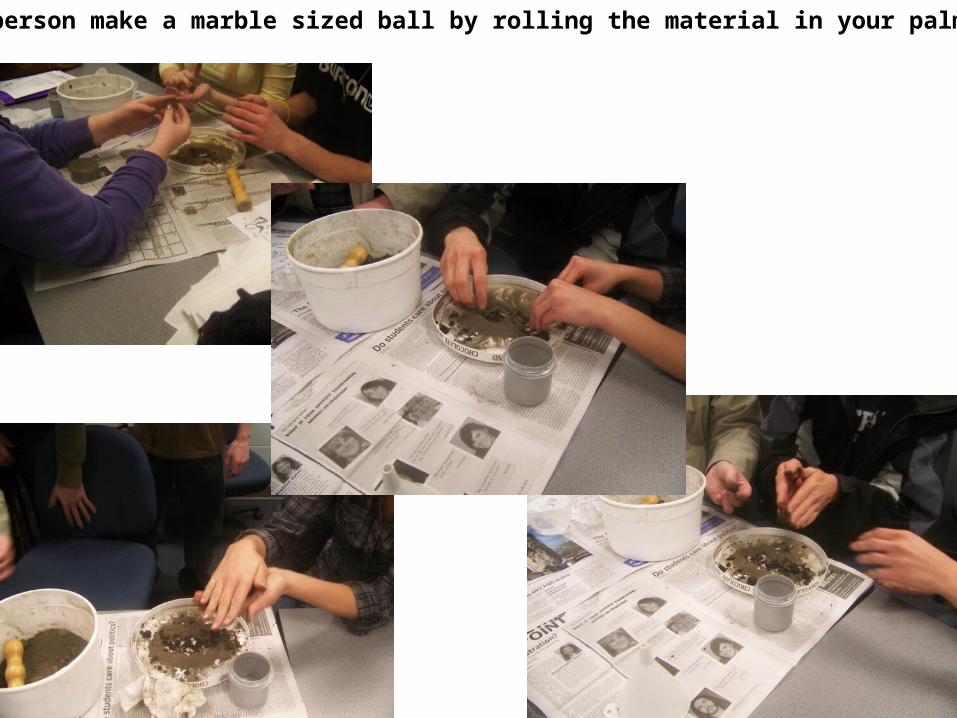
-Each person make a marble sized ball by rolling the material in your palms
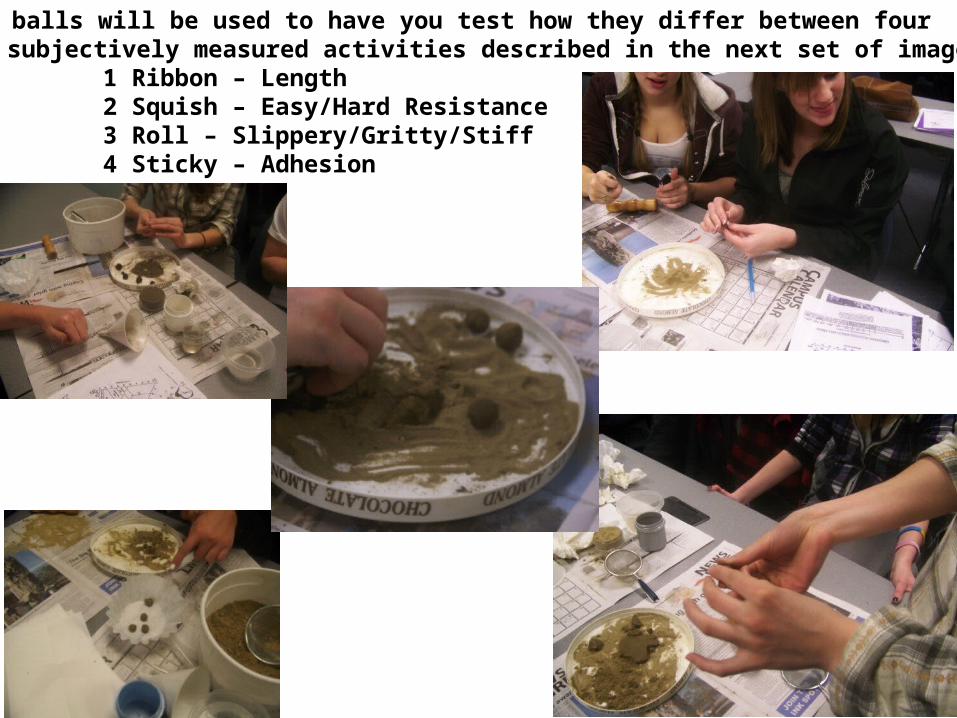
-These balls will be used to have you test how they differ between foursubjectively measured activities described in the next set of images
1 Ribbon – Length2 Squish – Easy/Hard Resistance3 Roll – Slippery/Gritty/Stiff4 Sticky – Adhesion
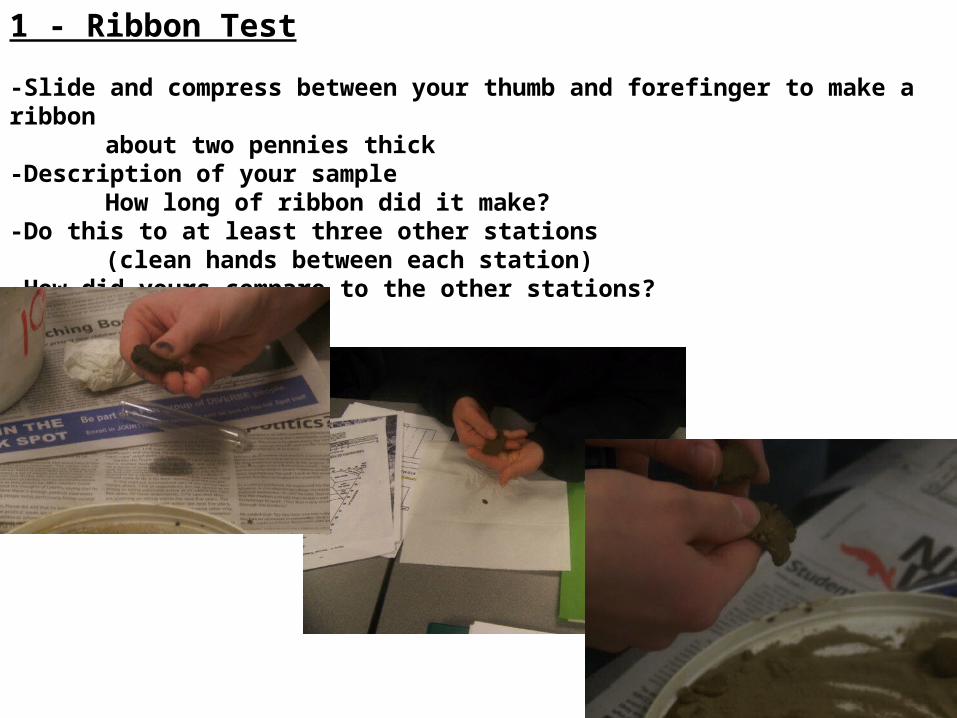
1 - Ribbon Test
-Slide and compress between your thumb and forefinger to make a ribbon about two pennies thick
-Description of your sampleHow long of ribbon did it make?
-Do this to at least three other stations(clean hands between each station)
-How did yours compare to the other stations?
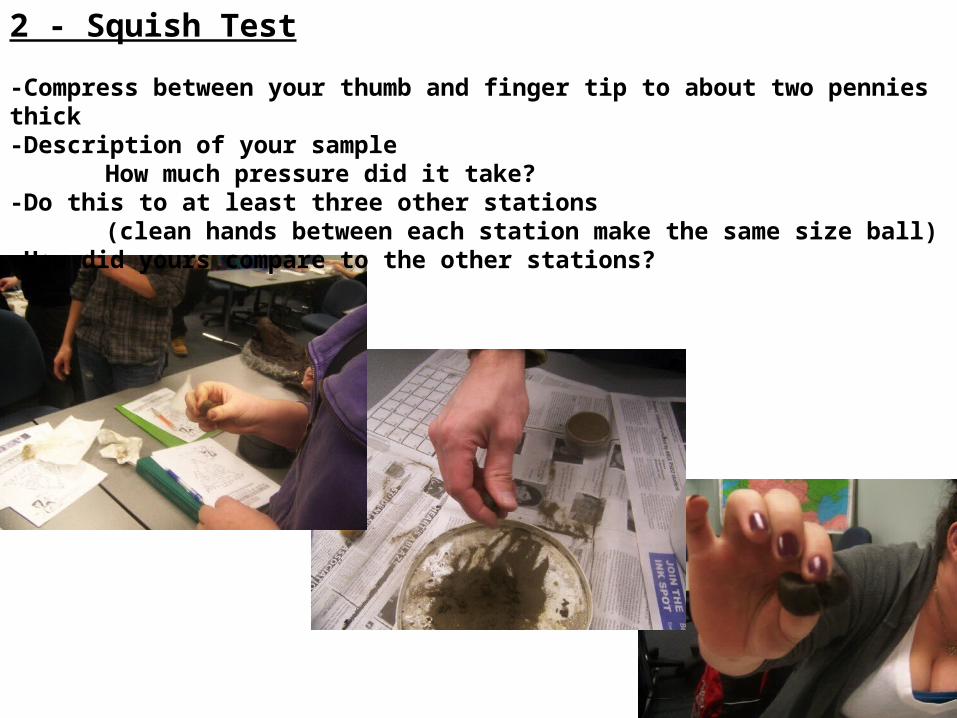
2 - Squish Test
-Compress between your thumb and finger tip to about two pennies thick-Description of your sample
How much pressure did it take?-Do this to at least three other stations
(clean hands between each station make the same size ball)-How did yours compare to the other stations?
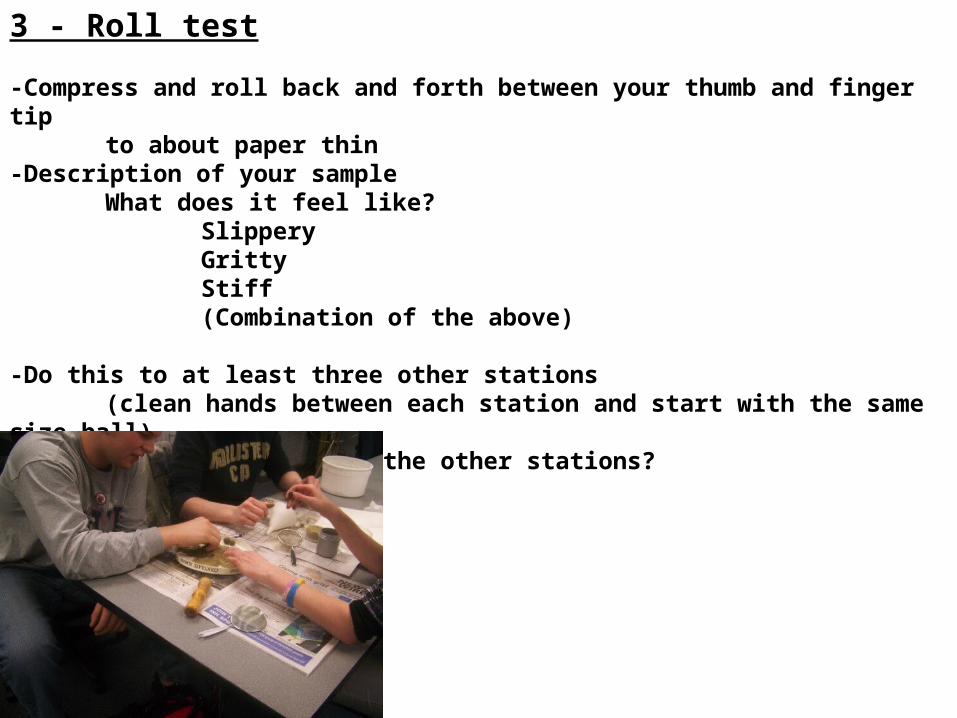
3 - Roll test
-Compress and roll back and forth between your thumb and finger tip to about paper thin
-Description of your sampleWhat does it feel like?
SlipperyGrittyStiff(Combination of the above)
-Do this to at least three other stations (clean hands between each station and start with the same size ball)
-How did yours compare to the other stations?
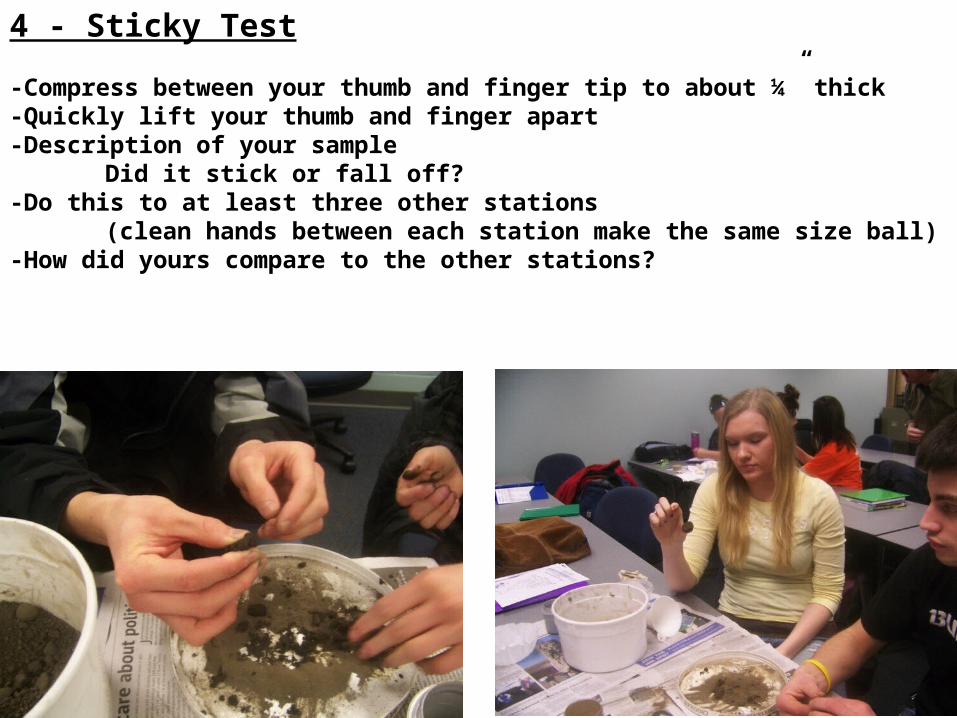
4 - Sticky Test
-Compress between your thumb and finger tip to about ¼” thick-Quickly lift your thumb and finger apart-Description of your sample
Did it stick or fall off?-Do this to at least three other stations
(clean hands between each station make the same size ball)-How did yours compare to the other stations?
Measuring physical characteristics of soil samples
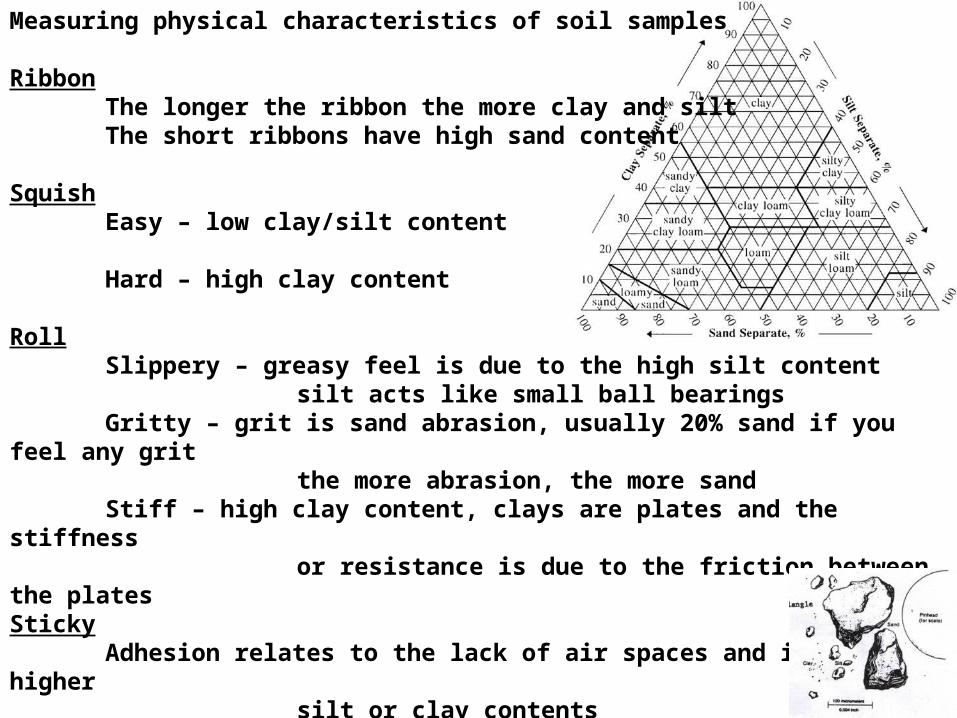
RibbonThe longer the ribbon the more clay and siltThe short ribbons have high sand content
SquishEasy – low clay/silt content
Hard – high clay content
RollSlippery – greasy feel is due to the high silt content
silt acts like small ball bearingsGritty – grit is sand abrasion, usually 20% sand if you feel any grit
the more abrasion, the more sandStiff – high clay content, clays are plates and the stiffness
or resistance is due to the friction between the platesSticky
Adhesion relates to the lack of air spaces and infers higher silt or clay contents
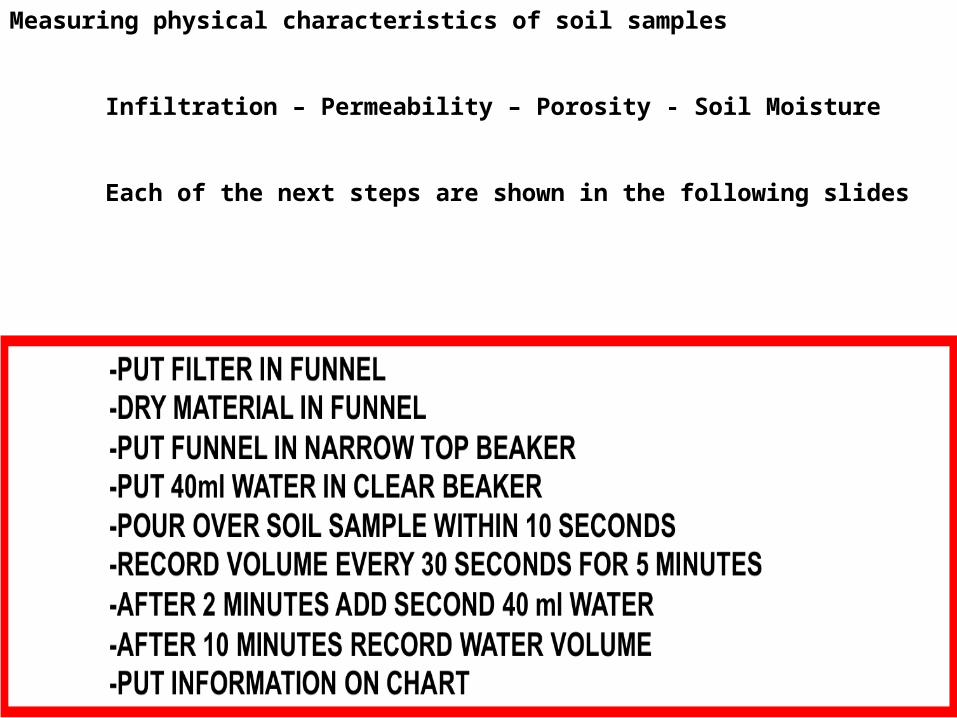
Measuring physical characteristics of soil samples
Infiltration – Permeability – Porosity - Soil Moisture
Each of the next steps are shown in the following slides
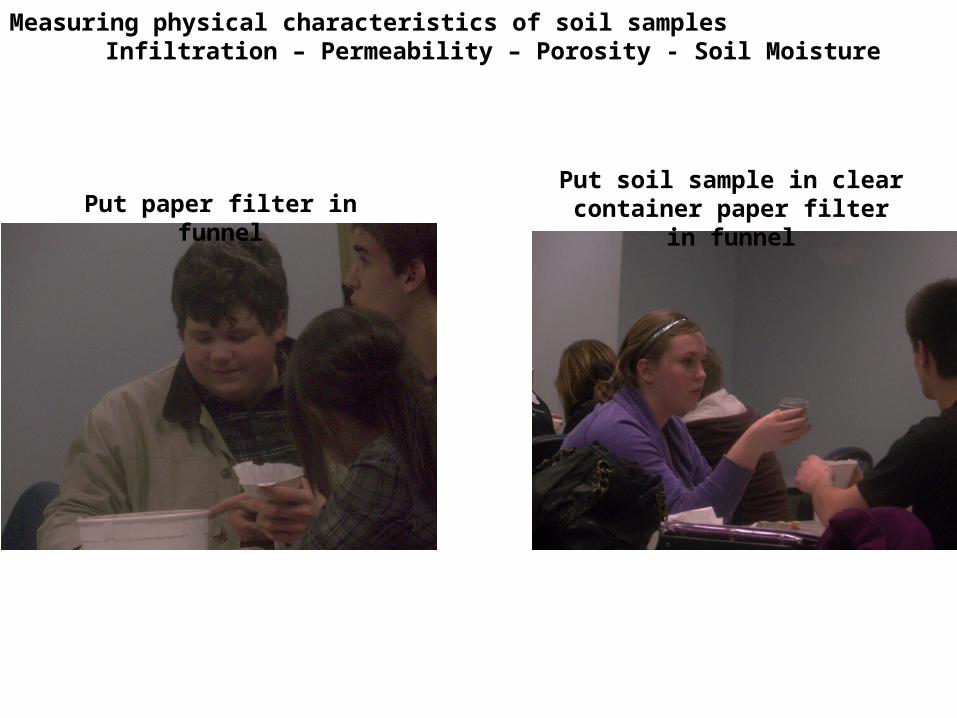
Measuring physical characteristics of soil samplesInfiltration – Permeability – Porosity - Soil Moisture
Put paper filter in funnelPut soil sample in clear
container paper filter in funnel
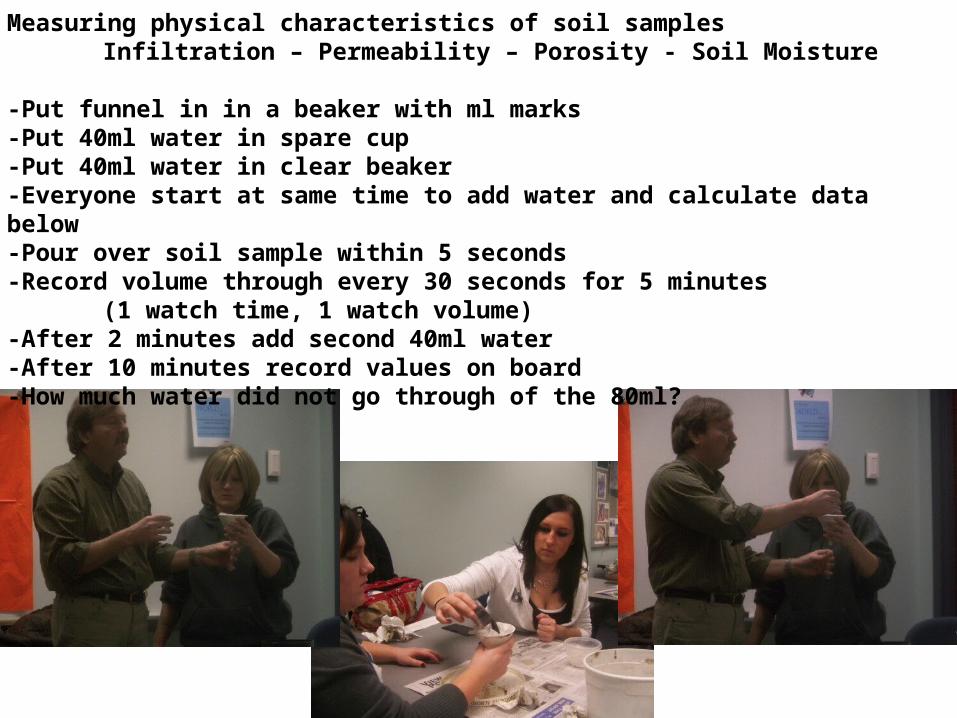
Measuring physical characteristics of soil samplesInfiltration – Permeability – Porosity - Soil Moisture
-Put funnel in in a beaker with ml marks-Put 40ml water in spare cup-Put 40ml water in clear beaker-Everyone start at same time to add water and calculate data below-Pour over soil sample within 5 seconds -Record volume through every 30 seconds for 5 minutes
(1 watch time, 1 watch volume)-After 2 minutes add second 40ml water-After 10 minutes record values on board-How much water did not go through of the 80ml?
Measuring physical characteristics of soil samplesInfiltration – Permeability – Porosity - Soil Moisture
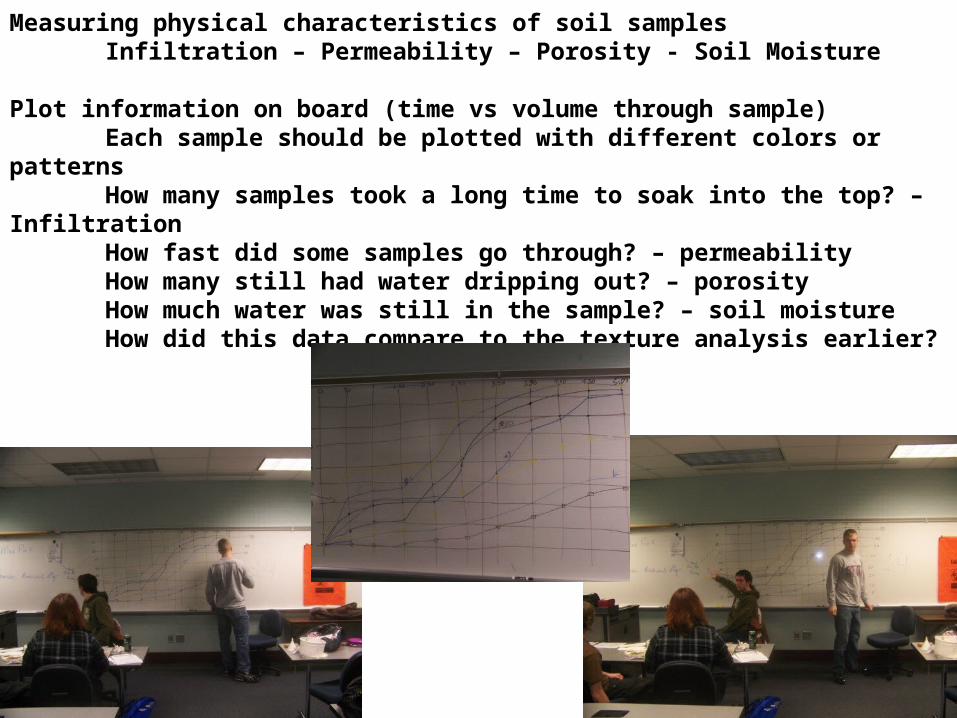
Plot information on board (time vs volume through sample)Each sample should be plotted with different colors or patternsHow many samples took a long time to soak into the top? –InfiltrationHow fast did some samples go through? – permeabilityHow many still had water dripping out? – porosityHow much water was still in the sample? – soil moistureHow did this data compare to the texture analysis earlier?
When done
-Put dry and wet soil samples back in pail-Do not put lid on pail-Wipe off all materials used-Throw away paper filter
Do not eat the leftovers
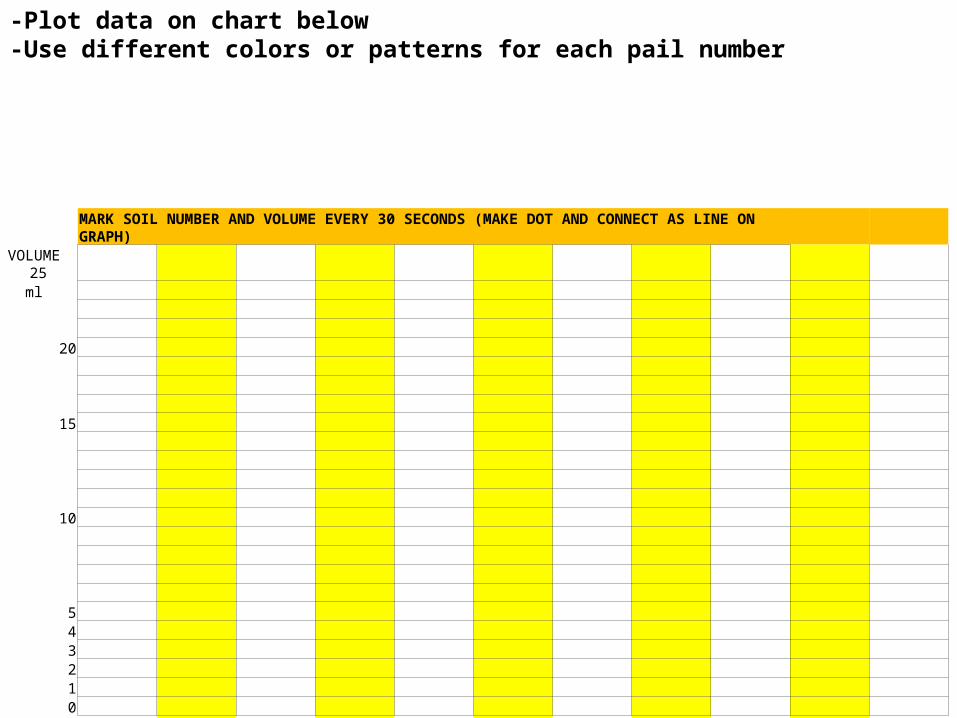
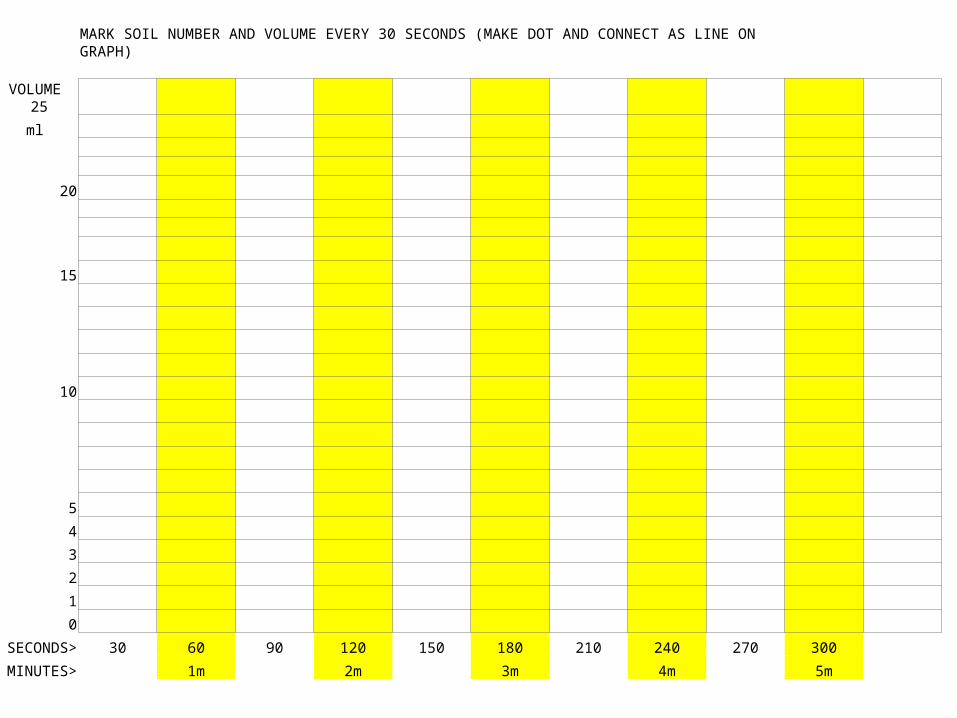
MARK SOIL NUMBER AND VOLUME EVERY 30 SECONDS (MAKE DOT AND CONNECT AS LINE ON GRAPH)VOLUME 25
ml
20
15
10
5
4
3
2
1
0
SECONDS> 30 60 90 120 150 180 210 240 270 300MINUTES> 1m 2m 3m 4m 5m
-Plot data on chart below-Use different colors or patterns for each pail number
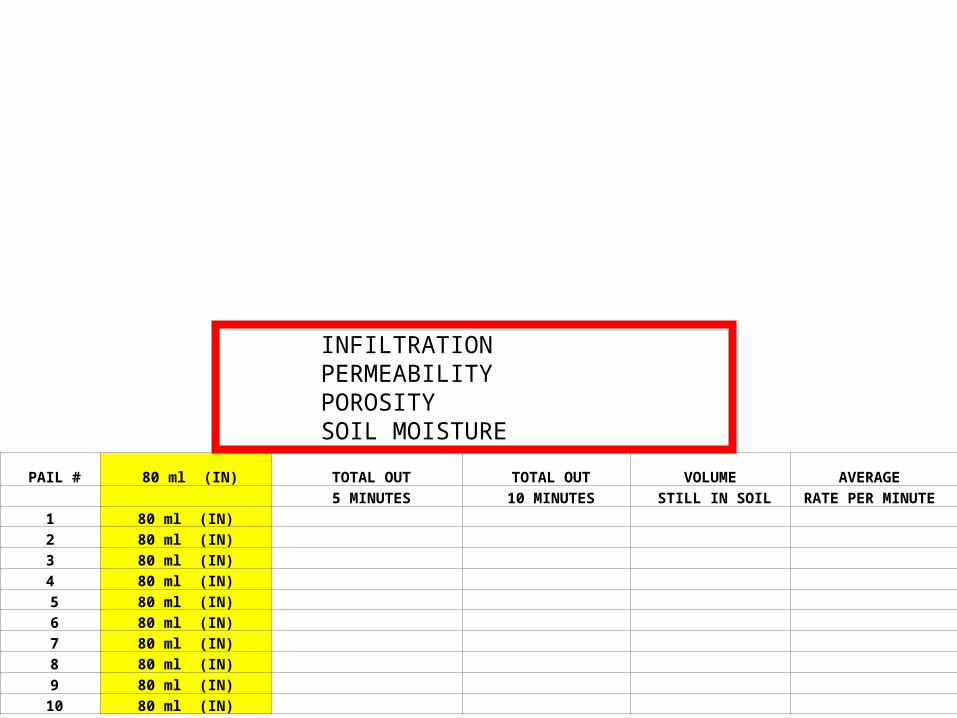
PAIL # 80 ml (IN) TOTAL OUT TOTAL OUT VOLUME AVERAGE 5 MINUTES 10 MINUTES STILL IN SOIL RATE PER MINUTE 1 80 ml (IN)2 80 ml (IN)3 80 ml (IN)4 80 ml (IN) 5 80 ml (IN) 6 80 ml (IN) 7 80 ml (IN) 8 80 ml (IN) 9 80 ml (IN)
10 80 ml (IN)
INFILTRATIONPERMEABILITYPOROSITYSOIL MOISTURE
MARK SOIL NUMBER AND VOLUME EVERY 30 SECONDS (MAKE DOT AND CONNECT AS LINE ON GRAPH)
VOLUME 25
ml
20
15
10
5
4
3
2
1
0
SECONDS> 30 60 90 120 150 180 210 240 270 300
MINUTES> 1m 2m 3m 4m 5m

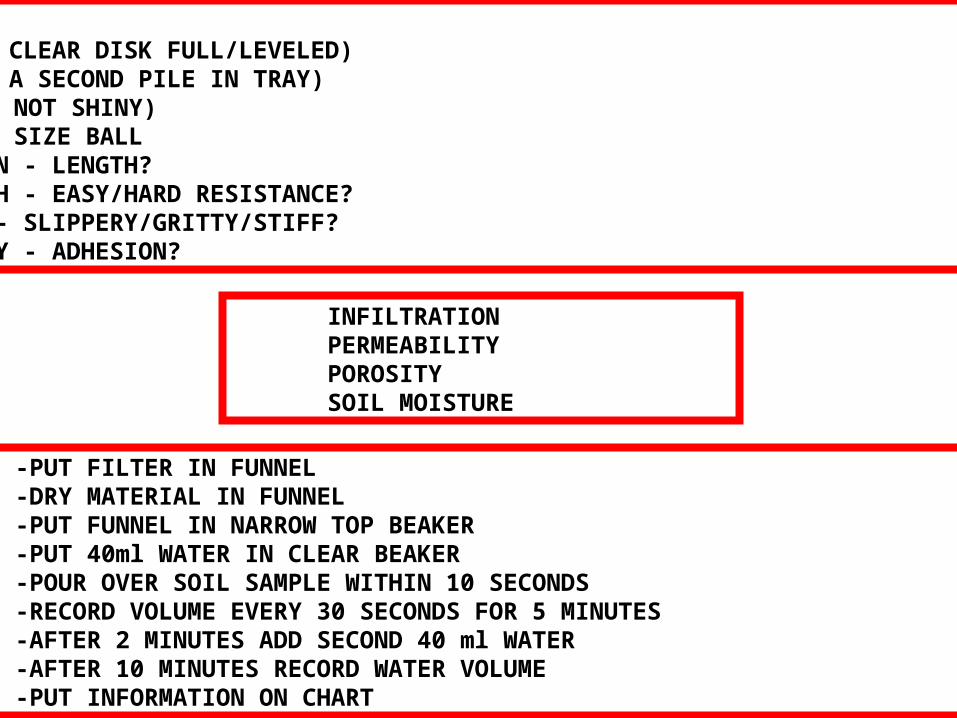
-PUT FILTER IN FUNNEL-DRY MATERIAL IN FUNNEL-PUT FUNNEL IN NARROW TOP BEAKER
-PUT 40ml WATER IN CLEAR BEAKER -POUR OVER SOIL SAMPLE WITHIN 10 SECONDS -RECORD VOLUME EVERY 30 SECONDS FOR 5 MINUTES -AFTER 2 MINUTES ADD SECOND 40 ml WATER
-AFTER 10 MINUTES RECORD WATER VOLUME-PUT INFORMATION ON CHART
INFILTRATIONPERMEABILITYPOROSITYSOIL MOISTURE
-GRIND -SIFT (FILL CLEAR DISK FULL/LEVELED)
(MAKE A SECOND PILE IN TRAY) -DAMPEN (WET NOT SHINY) -MAKE MARBLE SIZE BALL
RIBBON - LENGTH?SQUISH - EASY/HARD RESISTANCE?ROLL - SLIPPERY/GRITTY/STIFF?STICKY - ADHESION?