exploring ocean features activities question · pdf file"exploring ocean features"...
TRANSCRIPT
USC Sea Grant Island Explorers
"EXPLORING OCEAN FEATURES" ACTIVITIES
QUESTIONWhat does the land under the sea look like?How do we show land forms on a map?
UNDERLYING CONCEPTUnderwater topography can vary widely, from smooth slopes to elaborate canyons, valleys, andmountains. This topography is not visible at the ocean surface and is usually too deep to easilyexplore, therefore scientists have created special measuring methods to map the ocean bottom.
SKILLS• Using a grid• Problem solving• Measuring
METHODSStudents will create an "ocean bottom" in a shoe box and use measuring skills to decipher whatthe underlying structures look like when not visible (from the ocean surface). Additionally,students will use this model in an activity in which they will create simple topographic maps.
OBJECTIVES :Students will be able to:
• create a model of the ocean bottom• use a grid• measure the "landforms" in their model• draw a simple topographical map
TIME NEEDED• Approximately 2-3 days
MATERIALS NEEDED• non-clear plastic shoe boxes (one per group)• clay or modeling putty• ruler, tape, probes (pipe cleaners, sharp pencil, etc.)• cardboard, scissors, pen/pencil, paper
VOCABULARYbathymetric mapping: the measurement of depths of water in oceans, seas, and lakescontinental shelf: the under water border of a continent or an islandsea mount: a high hill under the seaisland: land surrounded by water and smaller than a continenttrench: long cut in the groundvolcano: a hill or mountain composed wholly, or in part, of ejected material from within the
earth. This material is often, but not always, in the form of lava.
2
USC Sea Grant Island Explorers
BACKGROUND INFORMATIONSea floors have a variety of features including smooth gradual slopes, mountain ranges,volcanoes, trenches, and sea mounts. On the east coast of the United States the continental shelfgenerally extends in a gentle slope under the ocean, however the West Coast, especially off ofSouthern California, is quite different. Here the near shore land under the sea contains deepsubmarine canyons, underwater mountain ranges, deep trenches and valleys. The submarinecanyons look like canyons cut by rivers on land....which they once were! Although CatalinaIsland is only 21 miles across the San Pedro Channel from the Southern California coast, deeptrenches and canyons in the Channel might reach 490 fathoms (2940 feet)...or over a half-miledeep! The underwater topography of this area is complex and fascinating. Since most studentsthink of a simple sloping sandy bottom under the ocean, it is helpful for them to understand thevariety of land forms possible, in terms of geological and geographical knowledge, as well aspotential habitat variations.
Measuring and mapping the land under water is called bathymetric mapping. Prior to the 1920'soceanographers measured the depth of the ocean using long lines with weights attached that weremarked at regular intervals (meters or feet) with knots. The lines were lowered into the oceanuntil the weight touched the bottom and the depth was noted by the knot mark. Currently,oceanographers use sonar, or sound waves, to measure the ocean bottom. Sound waves are sentfrom the bottom of a ship toward the ocean floor. By measuring the time it takes the sound toreturn to the ship (received by a recording device), the ocean depth can be calculated because thespeed at which sound travels through water is known (1,454 meters per second). In thefollowing activity the student will do some simplified versions of bathymetric mapping using"depth lines", as well as some simple topographical mapping.
ACTIVITIES:
Activity #1 : "SHOE BOX ACTIVITY"
Into:Review different types of ocean features or introduce them by directinstruction/discussion.-What are some notable features you have investigated?-Where are these features located in the ocean?-If you were an oceanographer, how would you know where these features were located?
Activity:1) Using clay or modeling putty, students will work in small groups to construct an ocean bottom
inside a shoe box. They need to include at least three different features.2) When construction is completed, students should cut a card board lid to fit the top of the shoe
box.3) Students draw lines one inch apart on the card board lid in two dimensions to create a grid
pattern.4) Next, tape the lid on top of the shoe box so that other groups cannot see their features.5) Students will exchange their shoe box for a shoe box from another group to prepare for Part II
of this activity.
3
USC Sea Grant Island Explorers
6) Students will create holes at each 1" intersection along one line of the grid pattern. Insert apipe cleaner ("depth line") into the holes to determine what "the ocean floor" in the shoe boxlooks like by calculating how deep they can extend the probe. They will be able to deciphervarious heights of the "underwater topography." They will draw on paper their idea of theshoe box "ocean floor" based on the information on the probes. (Multiple lines of the gridcan be probed to get a three-dimensional picture of the ocean bottom.)
7) Remove the lid of shoe box to see if their drawing matches the contour in the shoe box.8) Return the shoe box to the group which created.9) Save shoe box ocean floors for topographical mapping activities.
* Note: Students should understand that not every area can be measured and therefore need tocreate an efficient design for measuring. (This simulates real world scientific research.)
Activity #2 : "TOPO MAPS"Create topographical maps from the previous activity.
1) Place clear plastic overlay to top of shoe box2) Pour colored water to depth of 1" and trace the "contour lines" of the water onto the overlay.3) Continue to add water 1" at a time until they have drawn a simple contour map at 1"intervals.
Beyond/Extensions:Have a topographical map of Catalina Island (or any topographical map of an area they know orwill be visiting) and a list of features to identify. Have students identify valleys, mountains,hills, etc., on the topographical map. Or they can make their own list of formations that they canidentify on the map.
Investigative thought question:How can one tell if a feature on a topographic map is an incline or a decline?
(Students should study a topographic map to find the answer)
USC Sea Grant Island Explorers
"SAND AND SOIL STUDIES"
QUESTIONWhere does sand come from? How is it the same or different from soil?
UNDERLYING CONCEPTSand is created from the break down of larger rocks. The type of sand present, for example at abeach, is determined by the geological make-up of the region.
SKILLS• Observing• Problem solving• Measuring• Comparing
METHODSStudents will collect different samples of sand and soil. They will perform a variety of tests onthese samples to learn more about them, especially, how they are alike and different.
OBJECTIVES :Students will be able to:
• Observe various fragments and particular make-up of sand• Determine if iron is present in a sand sample• Compare sand and soil samples
TIME NEEDED• Approximately 1 class period.
MATERIALS NEEDED• Samples of coastal sand from a local area• Samples of topsoil from a school yard• Black or white construction paper depending on samples• Hand lenses• A quart jar and lid• Water• Magnets• Scoop or large spoon• Pen or pencil• Activity Sheet 1 and 2
VOCABULARYSand: Particles smaller than gravel, but more coarse than silt. Materials are from disintegrated
rocksSoil: The upper layer of the earth which may be dug or plowed and in which plants grow.Erosion: The process through which a material is gnawed away.
2
USC Sea Grant Island Explorers
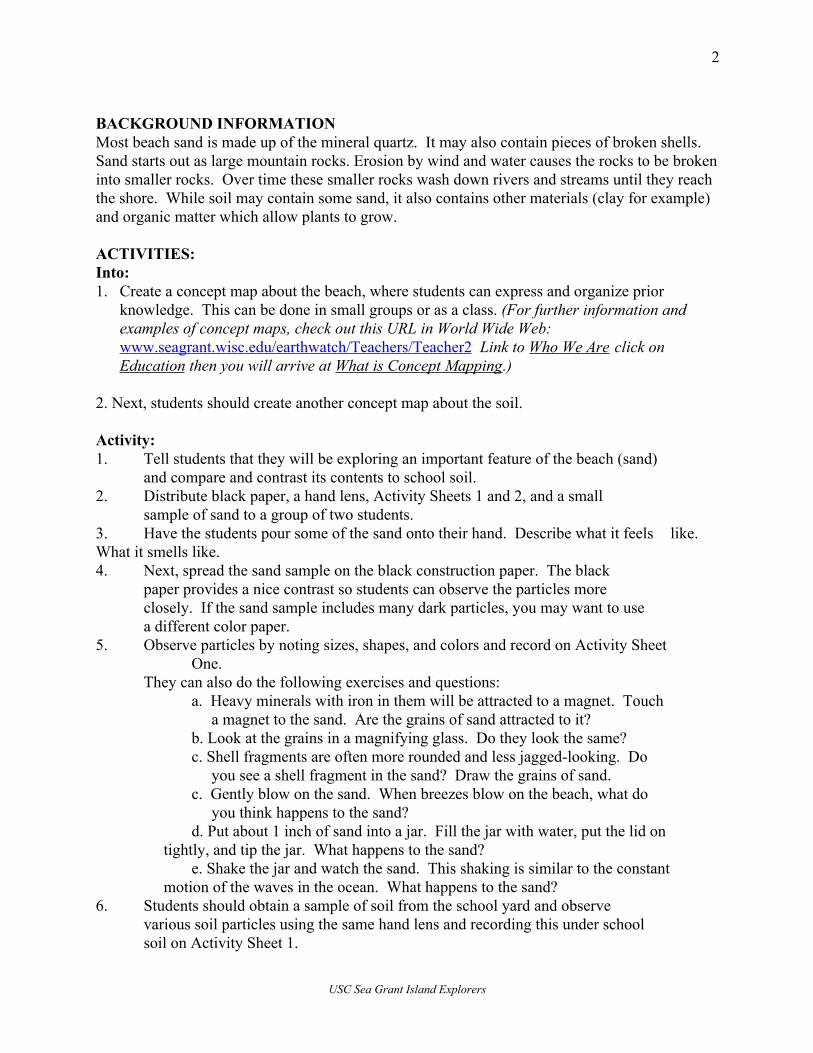
BACKGROUND INFORMATIONMost beach sand is made up of the mineral quartz. It may also contain pieces of broken shells.Sand starts out as large mountain rocks. Erosion by wind and water causes the rocks to be brokeninto smaller rocks. Over time these smaller rocks wash down rivers and streams until they reachthe shore. While soil may contain some sand, it also contains other materials (clay for example)and organic matter which allow plants to grow.
ACTIVITIES:Into:1. Create a concept map about the beach, where students can express and organize prior
knowledge. This can be done in small groups or as a class. (For further information andexamples of concept maps, check out this URL in World Wide Web:www.seagrant.wisc.edu/earthwatch/Teachers/Teacher2 Link to Who We Are click onEducation then you will arrive at What is Concept Mapping.)
2. Next, students should create another concept map about the soil.
Activity:!1. Tell students that they will be exploring an important feature of the beach (sand)
and compare and contrast its contents to school soil.2. Distribute black paper, a hand lens, Activity Sheets 1 and 2, and a small
sample of sand to a group of two students.3. Have the students pour some of the sand onto their hand. Describe what it feels like.What it smells like.4. Next, spread the sand sample on the black construction paper. The black
paper provides a nice contrast so students can observe the particles moreclosely. If the sand sample includes many dark particles, you may want to usea different color paper.
5. Observe particles by noting sizes, shapes, and colors and record on Activity Sheet One.
They can also do the following exercises and questions:a. Heavy minerals with iron in them will be attracted to a magnet. Touch a magnet to the sand. Are the grains of sand attracted to it?b. Look at the grains in a magnifying glass. Do they look the same?
c. Shell fragments are often more rounded and less jagged-looking. Do you see a shell fragment in the sand? Draw the grains of sand.c. Gently blow on the sand. When breezes blow on the beach, what do you think happens to the sand?
d. Put about 1 inch of sand into a jar. Fill the jar with water, put the lid on tightly, and tip the jar. What happens to the sand?
e. Shake the jar and watch the sand. This shaking is similar to the constant motion of the waves in the ocean. What happens to the sand?
6. Students should obtain a sample of soil from the school yard and observevarious soil particles using the same hand lens and recording this under schoolsoil on Activity Sheet 1.
3
USC Sea Grant Island Explorers
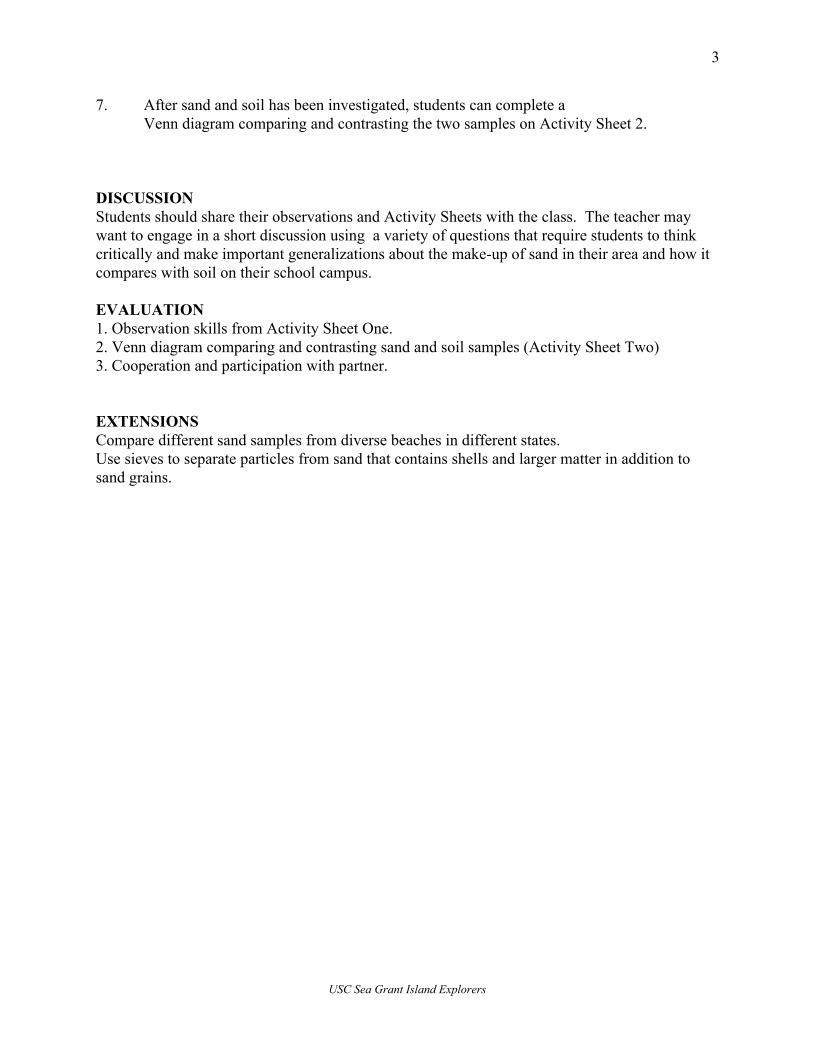
7. After sand and soil has been investigated, students can complete aVenn diagram comparing and contrasting the two samples on Activity Sheet 2.
DISCUSSIONStudents should share their observations and Activity Sheets with the class. The teacher maywant to engage in a short discussion using a variety of questions that require students to thinkcritically and make important generalizations about the make-up of sand in their area and how itcompares with soil on their school campus.
EVALUATION1. Observation skills from Activity Sheet One.2. Venn diagram comparing and contrasting sand and soil samples (Activity Sheet Two)3. Cooperation and participation with partner.
EXTENSIONSCompare different sand samples from diverse beaches in different states.Use sieves to separate particles from sand that contains shells and larger matter in addition tosand grains.
4
USC Sea Grant Island Explorers
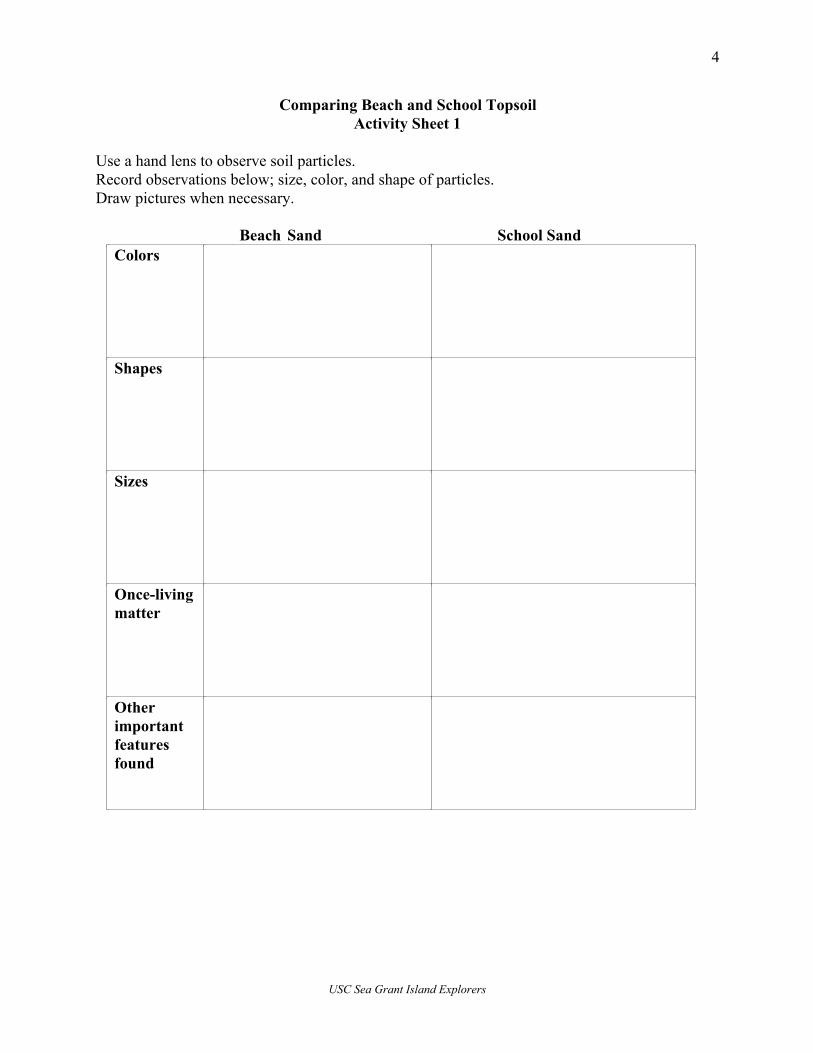
Comparing Beach and School TopsoilActivity Sheet 1
Use a hand lens to observe soil particles.Record observations below; size, color, and shape of particles.Draw pictures when necessary.
Beach Sand School SandColors
Shapes
Sizes
Once-livingmatter
Otherimportantfeaturesfound
5
USC Sea Grant Island Explorers
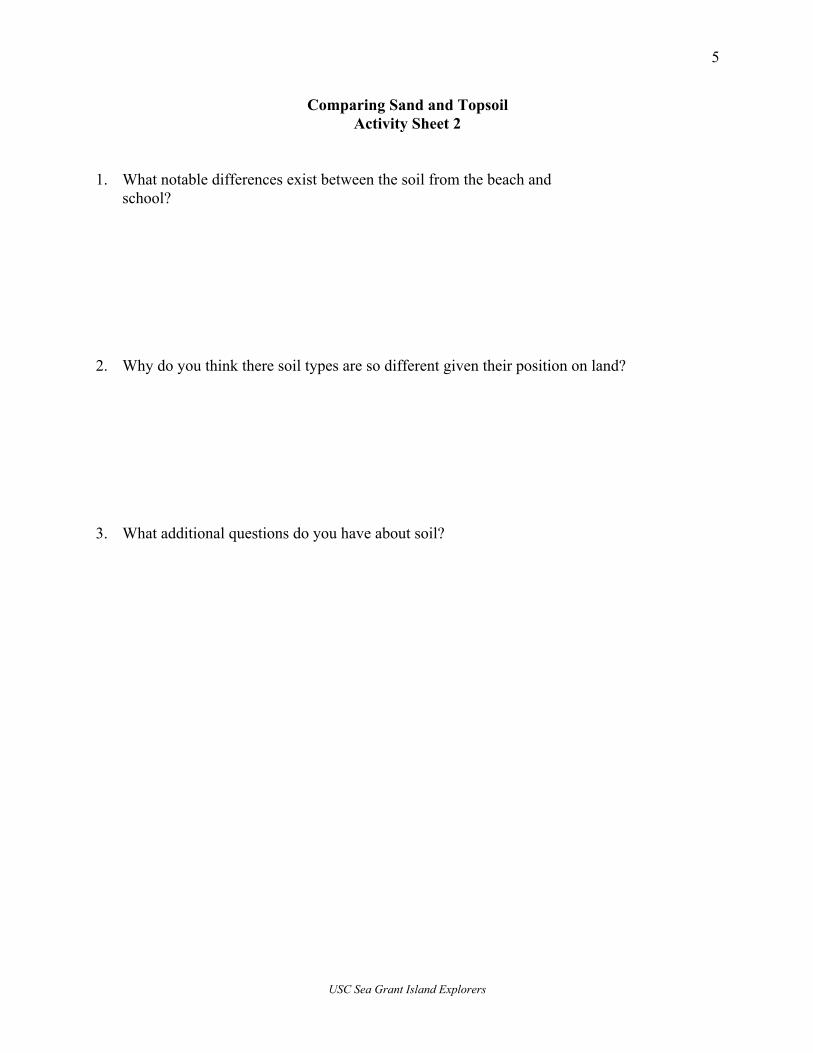
Comparing Sand and TopsoilActivity Sheet 2
1. What notable differences exist between the soil from the beach andschool?
2. Why do you think there soil types are so different given their position on land?
3. What additional questions do you have about soil?
Adapted from Oceans
RIDE THE WAVES
QUESTIONHow do waves move across the ocean surface?
UNDERLYING CONCEPT• The water in any given wave moves up and down, but it doesn’t move forward.• The wave’s energy, not the water’s is transferred along.
SKILLS• Modeling• Labeling• Measuring
OBJECTIVESStudents will be able to;
• Make a human model of ocean waves• Use the model to demonstrate how waves behave
TIME NEEDED• 20 minutes
MATERIALS NEEDED• Picture or video of waves
VOABULARYCrest: The highest point of a waveTrough (trawf): The lowest point of a waveWavelength: The distance between two wave crests or troughsWave height: The distance from a wave’s trough to its crest
BACKGROUNDMost waves are caused by winds blowing the surface of the water. How long the wind blows,how hard, and over how big of an area all affect the size of the waves it will produce. Mostwaves are less than 4 meters (12 feet) high, but much larger waves can form during severe storms.
The highest point on a wave is the crest, and the lowest point is called the trough, as shown here.The distance between two crests is the wavelength. The distance from the trough to the crest isthe wave height.
When waves reach shallower regions, the wave troughs drag along the shoreline, but the crestskeep going. As a result, the waves jam up, shortening their wavelength and increasing in height.At some point, the wave becomes too tall to hold itself up, and it curls over or “breaks” on theshore.
Underwater earthquakes and volcanoes can result in long, high-speed waves called tsunamis.(These waves are sometimes called tidal waves, although they have nothing to do with tides.)
2
Adapted from Oceans
Such waves can have a wavelength measuring 160 kilometers (100 miles) and speeds up to 800kilometers per hour (500 miles per hour). Since tsunami’s wavelength is so long, the timebetween waves hitting the shore can be as long as 15-20 minutes. In the open sea, these wavesmay be only a half-meter (1.5 feet) tall, but when they build up along a shoreline, they reachheights over 30 meters (100 feet) and have great destructive power. Tsunamis occur most oftenin Japan, Hawaii, and Alaska, due to earthquakes and volcanic activity in the Pacific Ocean.
INTO1. Have you seen waves at the beach or in a lake?2. What do you think causes waves?
Wind, earthquakes
ACTIVITY1. Line up your students, side by side, in an open space where they are free to move. Ask them
if they have seen people at a sporting event move in sequence to make a “wave.” (The firstperson starts in a crouching position, then stands, reaches high, and crouches down again.Each subsequent person before them in line has partially completed the motions. The resultis a rippling wave that runs down the line.) Invite the class to try it. Tell them that theyhave just become a model of ocean waves.
2. Have the class try different variations, such as fast, slow, high, and low. You might set upscenarios, such as having them imagine a storm is raging at sea, which would suggest that theymake fast, high waves.
3. Have them create a wave, and then freeze the motion while you point out different parts ofthe wave, as described in the Background information (crest, trough, wavelength, waveheight). You might have the class line up along the chalkboard, trace the shape of the waveand label it. Have a volunteer make some rough measurements as your wave model tries outdifferent wavelengths and wave heights.
4. Ask: Have you ever noticed that as you make your wave movements, you don’t move alongsideways? How is that similar to the way an ocean works? Help students see that the waterin any given wave moves up and down, but it doesn’t move forward. The wave’s energy, notthe water, is transferred along.
5. Finish the modeling activity by exploring why waves break on the shore and splash up on thebeach. You might have students at one end of the line try it by standing on a slightly raisedground (best done outside), crowding the line closer together, reaching the wave crests higherand tipping over (carefully!)
6. Have students make a labeled sketch of a wave. Close by showing the class dramatic picturesor a video of waves in motion, or by demonstrating wave motion in a large shallow pan ofwater. Float a few small objects remain in position rather than move in the direction of thewaves.
3
Adapted from Oceans
EXTENTIONS1. Demonstrate how a wave works by having two students hold opposite ends of a long rope
and ripple the rope to make waves.
2. Invite students to find out more about big waves produced by severe winds.
Background information adapted from the Los Marineros Curriculum Guide (1995) , published by the Santa BarbaraMuseum of Natural History (805) 682-4711
“HOW DOES THE MOON AFFECT THE TIDES?”
QUESTIONHow does the moon’s path affect the tides?
UNDERLYING CONCEPTTides are caused by the gravitational pull among the sun, moon, and earth. The size of the tidesdepends on where the sun and moon are in relation to the earth.
SKILLS• Observation
OBJECTIVES• Students will experience with movement the relationship between the moon and the high
and low tides.
TIME NEEDED• 55 minutes
MATERIALS NEEDED• None
VOCABULARYTide- The periodic rise and fall of the ocean’s water level due to the pull of the gravity from the
sun and the moon.Low tide-The two points in the day when the ocean’s level is lowest.High tide-The two points of the day when the ocean’s level is highest.
BACKGROUNDTides are caused by a gravitational tug-of-war between the sun, moon, and earth. All objectsexert gravitational pull on each other. The closer they are, or the larger they are, the greater thepull. All of the planets exert some gravitational pull on the earth. However, the pull of the moonand sun are most noticeable because the moon is so close to us and the sun is so big. It takes theearth 365 days to revolve around the sun. As it revolves around the sun, it spins, or rotates onits axis once every 24 hours. At the same time, the moon revolves around the earth once every29 days. The gravitational pull of the sun holds the earth in orbit, while the gravitational pull ofthe earth keeps the moon in orbit.
As a result of this gravitational attraction between the earth and the moon, the side of the earthfacing the moon is pulled towards it. Solid objects like the ground and buildings are not distortedas much as liquids like the ocean. A bulge of water occurs on the side of the earth facing themoon. As the earth rotates around the sun, centrifugal force causes an equal bulge of water on theopposite side of the earth. Water is pulled away from these two sides of the earth to form thesebulges, or high tides. This leaves a depression, or low spot, in the oceans between. These are theareas of low tides.
2
Background information adapted from the Los Marineros Curriculum Guide (1995) , published by the Santa BarbaraMuseum of Natural History (805) 682-4711
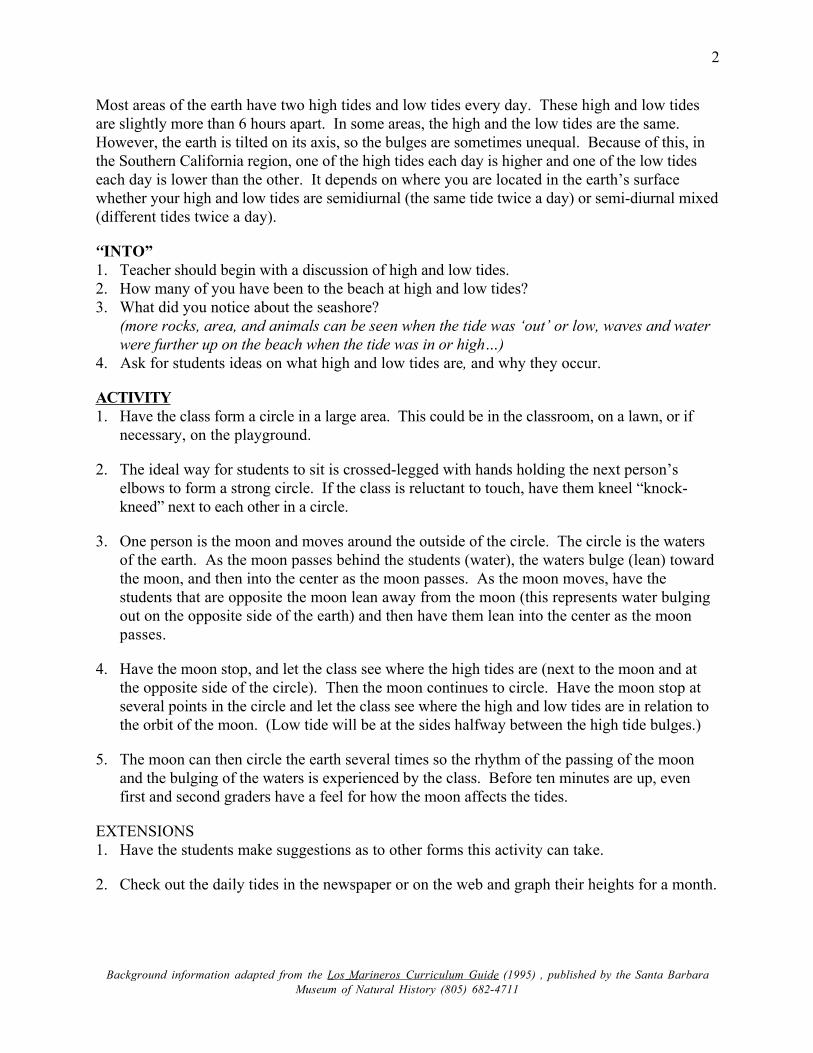
Most areas of the earth have two high tides and low tides every day. These high and low tidesare slightly more than 6 hours apart. In some areas, the high and the low tides are the same.However, the earth is tilted on its axis, so the bulges are sometimes unequal. Because of this, inthe Southern California region, one of the high tides each day is higher and one of the low tideseach day is lower than the other. It depends on where you are located in the earth’s surfacewhether your high and low tides are semidiurnal (the same tide twice a day) or semi-diurnal mixed(different tides twice a day).
“INTO”1. Teacher should begin with a discussion of high and low tides.2. How many of you have been to the beach at high and low tides?3. What did you notice about the seashore?
(more rocks, area, and animals can be seen when the tide was ‘out’ or low, waves and waterwere further up on the beach when the tide was in or high…)
4. Ask for students ideas on what high and low tides are, and why they occur.
ACTIVITY1. Have the class form a circle in a large area. This could be in the classroom, on a lawn, or if
necessary, on the playground.
2. The ideal way for students to sit is crossed-legged with hands holding the next person’selbows to form a strong circle. If the class is reluctant to touch, have them kneel “knock-kneed” next to each other in a circle.
3. One person is the moon and moves around the outside of the circle. The circle is the watersof the earth. As the moon passes behind the students (water), the waters bulge (lean) towardthe moon, and then into the center as the moon passes. As the moon moves, have thestudents that are opposite the moon lean away from the moon (this represents water bulgingout on the opposite side of the earth) and then have them lean into the center as the moonpasses.
4. Have the moon stop, and let the class see where the high tides are (next to the moon and atthe opposite side of the circle). Then the moon continues to circle. Have the moon stop atseveral points in the circle and let the class see where the high and low tides are in relation tothe orbit of the moon. (Low tide will be at the sides halfway between the high tide bulges.)
5. The moon can then circle the earth several times so the rhythm of the passing of the moonand the bulging of the waters is experienced by the class. Before ten minutes are up, evenfirst and second graders have a feel for how the moon affects the tides.
EXTENSIONS1. Have the students make suggestions as to other forms this activity can take.
2. Check out the daily tides in the newspaper or on the web and graph their heights for a month.
Reprinted from Project Earth Science: Physical Oceanography with permission from the National Science Teachers Association, 1840 WilsonBoulevard, Arlington, VA 22201-3000. For more information on this book and other educational resources, please visit the National Science
Teachers Association Web site at www.nsta.org
“OCEAN LAYERS”
QUESTIONWhat happens when ocean water, brackish water, and river water contact one another?
UNDERLYING CONCEPTThe density difference between two volumes of water can prevent them from easily mixing.Water containing the most dissolved salt tends to form the bottom layer while the less densewater will remain on top of the more dense water.
SKILLS• observation• prediction• analysis
OBJECTIVES• Students will be able to predict results and analyze what happens when water of differing
densities come into contact.
TIME NEEDED• One 55 minute class period
MATERIALS NEEDEDFor the preparation of the colored solutions:
1. 150 ml of pickling salt (pure NaCl)2. 100 ml graduated cylinder3. 500 ml graduated cylinder4. 600 ml beakers (or jars that will hold more than 500 ml of liquid)5. food coloring (three colors: blue, red, green)6. stirring rod (or spoon)7. marker for labeling beakers8. tap water (about 2 liters)9. towels or rags for cleanup
For each group:1. Cafeteria tray2. Slice of clay 3 cm thick3. Clear plastic straw (about 10 cm long)4. Three 250 ml clear plastic cups containing 25 ml each of the colored solutions5. 250 ml clear plastic cup (waste container for used solutions)6. Three medicine droppers or plastic pipettes7. One or two sheets of white paper8. Towels or rags for cleanup9. Data sheet
2
Reprinted from Project Earth Science: Physical Oceanography with permission from the National Science Teachers Association, 1840 WilsonBoulevard, Arlington, VA 22201-3000. For more information on this book and other educational resources, please visit the National Science
Teachers Association Web site at www.nsta.org
VOCABULARYBrackish water- The type of water found where fresh water and salt water mix. The salt contentof the water usually varies and the water is considered neither fresh or salt.Estuary- A partially enclosed area most often near the mouth of a river or other fresh watersource, where fresh and salt water mix.
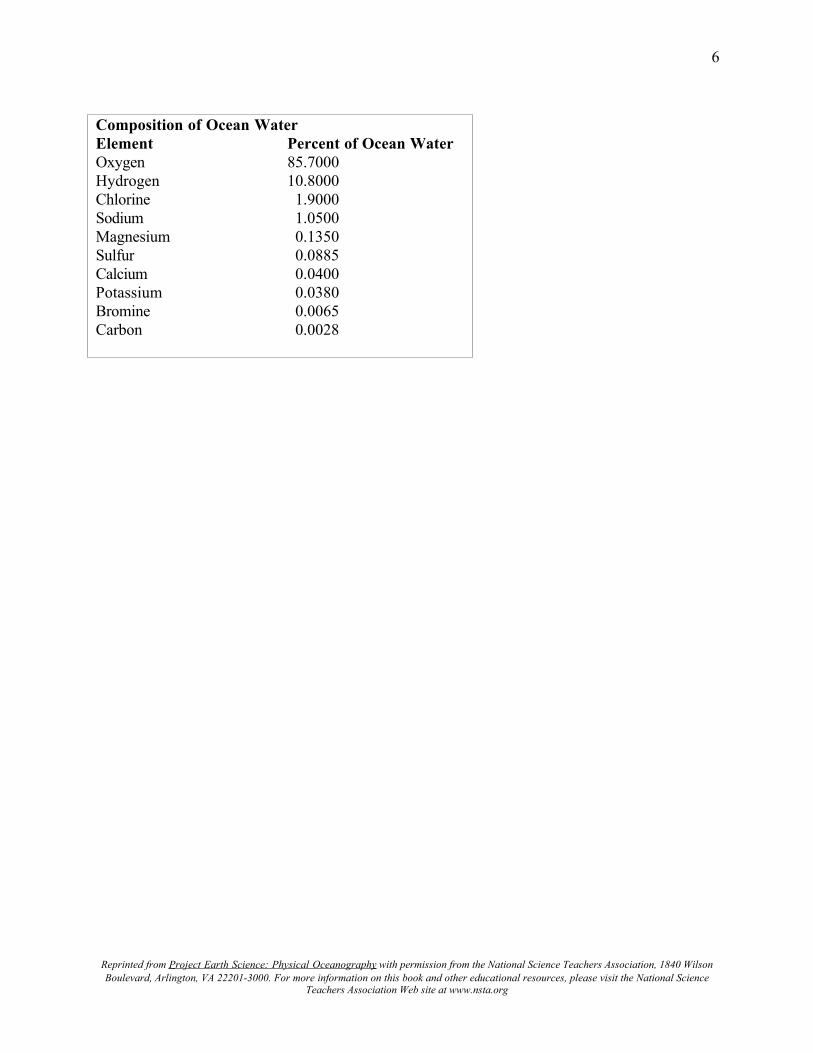
BACKGROUND INFORMATIONWater is the most abundant chemical on the surface of Earth. Because so many substances
dissolve in it, liquid water is almost never found in pure form, except in laboratories. Oceanwater, for example, is a complex solution of about 96 percent pure water, 3.0 percent NaCl(common salt), and smaller amounts of many other chemicals (Table 1).
The amount of dissolved salts is not constant from place to place or from time to timethroughout the ocean. As a consequence, different regions of water within the ocean can havevery different properties. Density of ocean water, for example, is strongly affected by watertemperature and amount of dissolved salts. As a result, density varies from place to place. Astemperature decreases, density increases until it reaches a maximum at 4°C. Below thistemperature, the density begins to decrease. Additionally, as more salts dissolve in water, thewater becomes more dense. This trend can continue until the water becomes saturated with salts.Each factor contributes to the variation in ocean water from place to place.
One obvious consequence of differing densities in ocean water is layering, which results infairly distinct layers of ocean water as depth increases. A less obvious consequence is theformation of density currents. At Earth’s poles, the water is both very salty and very cold.These conditions make for very dense water. This water sinks and flows towards the equatoralong the ocean bottom. Water at the equator flows toward the poles near the surface to replacethe sinking water, contributing to global circulation patterns.
Colored solutions are used in this activity to represent three common types of water:ocean (salt) water, brackish water (a mixture of salt and fresh), and river (fresh) water. Theamount of salt dissolved in each is by no means the only difference among these three kinds ofwater. The different concentrations of salt lead to differing densities among these types of water.Fluids having different densities tend to form layers.
Since ocean water contains large amounts of common salt (NaCl) and other dissolvedmaterials, ocean water is more dense than river water. Under certain conditions, river waterflowing into brackish estuaries can form a separate layer on top of the more dense ocean water.
Currents, wind conditions, water temperature, and other factors, affect the ways freshand ocean water mix or form discrete layers. In this activity, students will discover the effects ofamount of dissolved substances on water density and layering.
INTOMake sure that the following concepts are clear to students before the activity begins:1. The colored solutions are models for demonstrating how river water, brackish water, and
ocean water mix or form layers. Water from natural sources has a greater range of dissolvedsubstances than the solutions in this activity.
2. When layers form in the ocean, the water containing the most dissolved salt tends to form thebottom layer. The water having the least amount of salt is usually on top, because it is theleast dense.
3. As more solids are dissolved in water, the water becomes more dense.
3
Reprinted from Project Earth Science: Physical Oceanography with permission from the National Science Teachers Association, 1840 WilsonBoulevard, Arlington, VA 22201-3000. For more information on this book and other educational resources, please visit the National Science
Teachers Association Web site at www.nsta.org
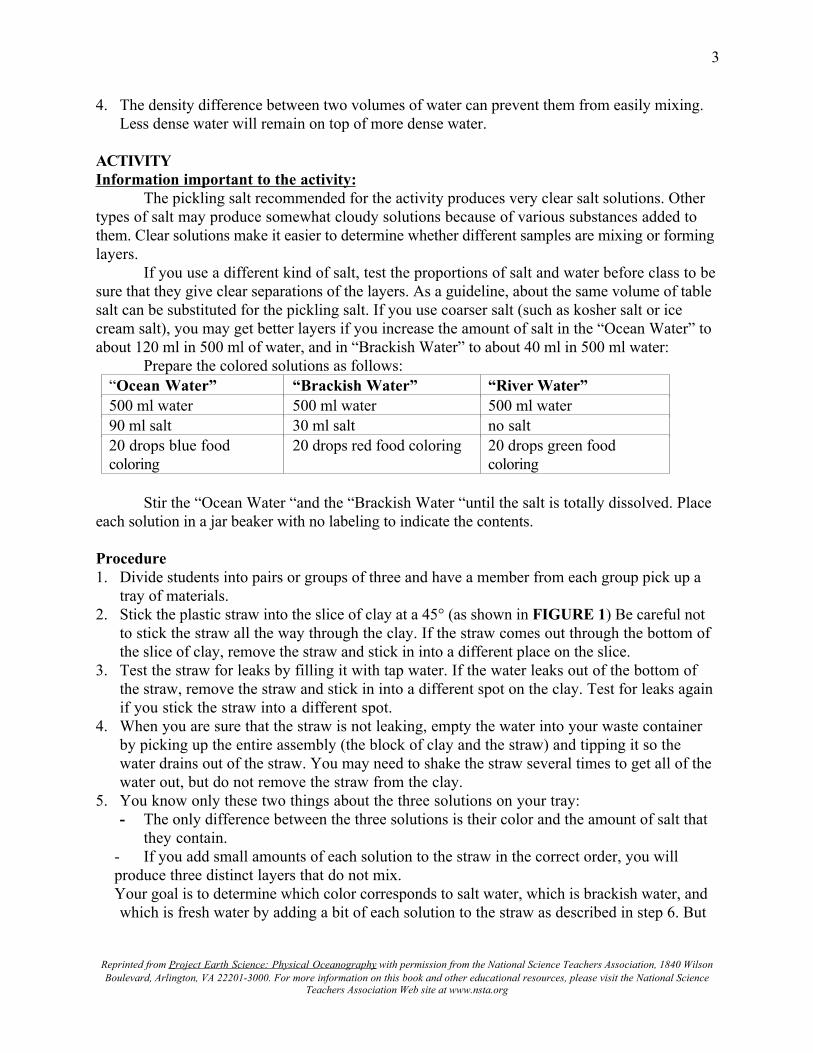
4. The density difference between two volumes of water can prevent them from easily mixing.Less dense water will remain on top of more dense water.
ACTIVITYInformation important to the activity:
The pickling salt recommended for the activity produces very clear salt solutions. Othertypes of salt may produce somewhat cloudy solutions because of various substances added tothem. Clear solutions make it easier to determine whether different samples are mixing or forminglayers.
If you use a different kind of salt, test the proportions of salt and water before class to besure that they give clear separations of the layers. As a guideline, about the same volume of tablesalt can be substituted for the pickling salt. If you use coarser salt (such as kosher salt or icecream salt), you may get better layers if you increase the amount of salt in the “Ocean Water” toabout 120 ml in 500 ml of water, and in “Brackish Water” to about 40 ml in 500 ml water:
Prepare the colored solutions as follows:“Ocean Water” “Brackish Water” “River Water”500 ml water 500 ml water 500 ml water90 ml salt 30 ml salt no salt20 drops blue foodcoloring
20 drops red food coloring 20 drops green foodcoloring
Stir the “Ocean Water “and the “Brackish Water “until the salt is totally dissolved. Placeeach solution in a jar beaker with no labeling to indicate the contents.
Procedure1. Divide students into pairs or groups of three and have a member from each group pick up a
tray of materials.2. Stick the plastic straw into the slice of clay at a 45° (as shown in FIGURE 1) Be careful not
to stick the straw all the way through the clay. If the straw comes out through the bottom ofthe slice of clay, remove the straw and stick in into a different place on the slice.
3. Test the straw for leaks by filling it with tap water. If the water leaks out of the bottom ofthe straw, remove the straw and stick in into a different spot on the clay. Test for leaks againif you stick the straw into a different spot.
4. When you are sure that the straw is not leaking, empty the water into your waste containerby picking up the entire assembly (the block of clay and the straw) and tipping it so thewater drains out of the straw. You may need to shake the straw several times to get all of thewater out, but do not remove the straw from the clay.
5. You know only these two things about the three solutions on your tray:- The only difference between the three solutions is their color and the amount of salt that
they contain.- If you add small amounts of each solution to the straw in the correct order, you willproduce three distinct layers that do not mix.Your goal is to determine which color corresponds to salt water, which is brackish water, andwhich is fresh water by adding a bit of each solution to the straw as described in step 6. But
4
Reprinted from Project Earth Science: Physical Oceanography with permission from the National Science Teachers Association, 1840 WilsonBoulevard, Arlington, VA 22201-3000. For more information on this book and other educational resources, please visit the National Science
Teachers Association Web site at www.nsta.org
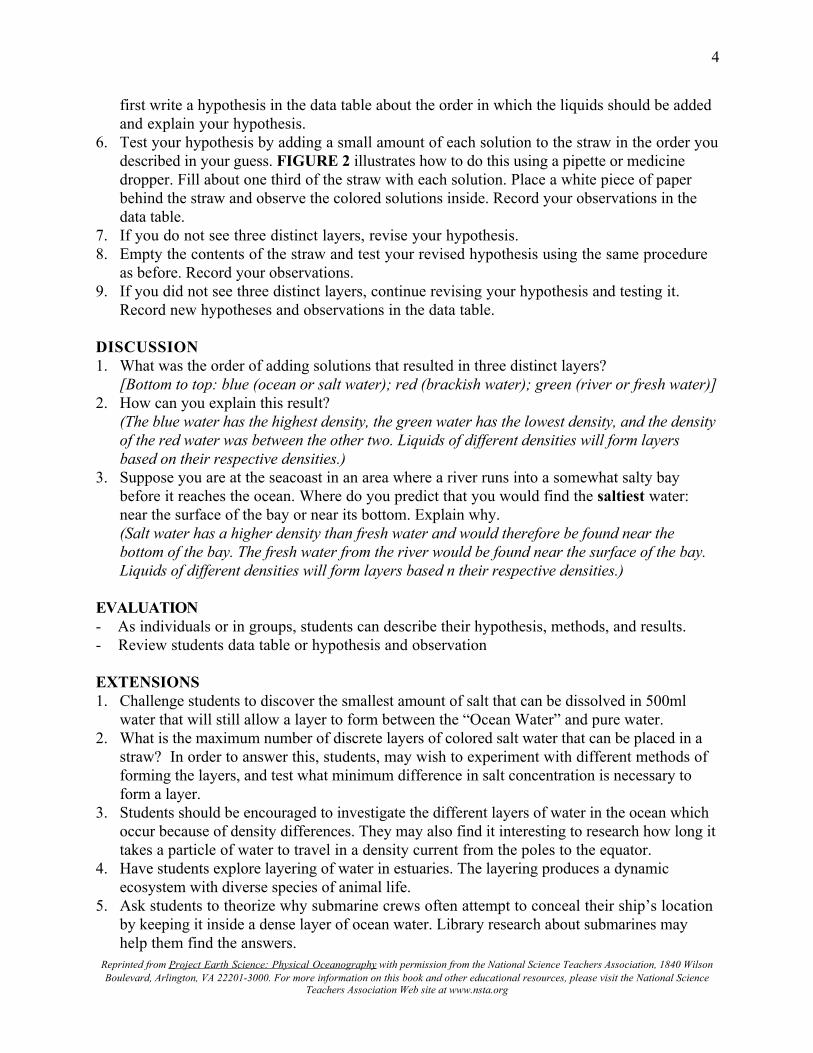
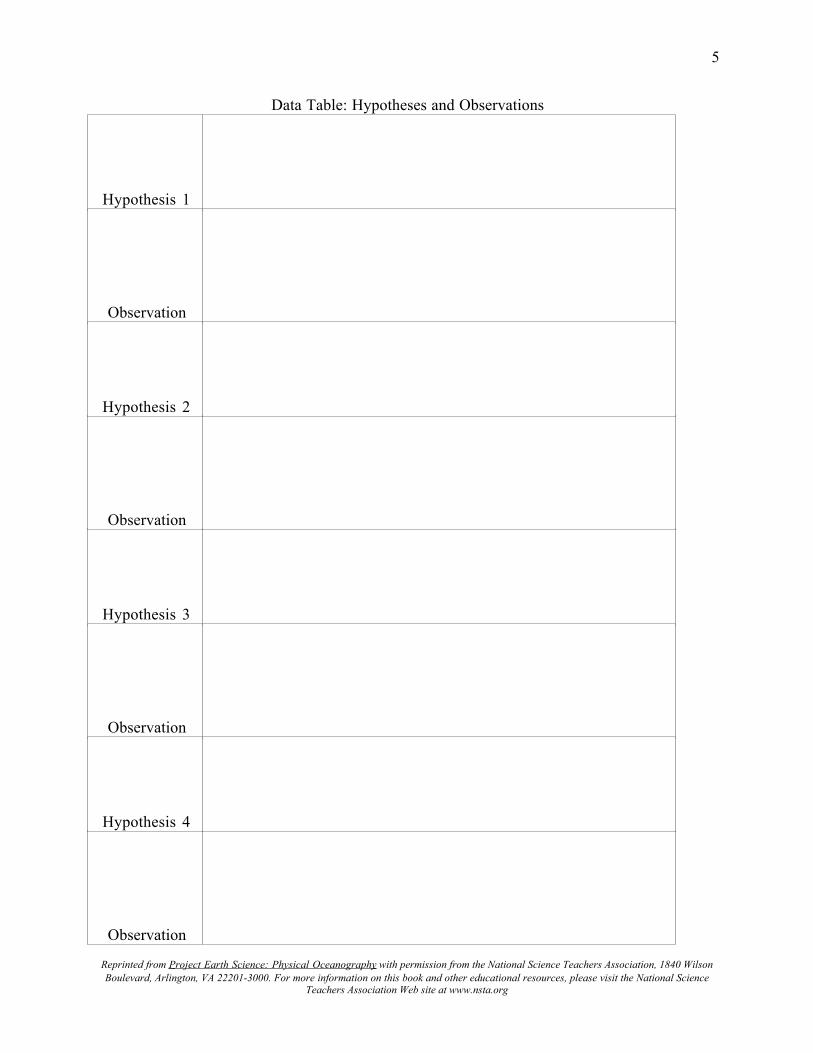
first write a hypothesis in the data table about the order in which the liquids should be addedand explain your hypothesis.
6. Test your hypothesis by adding a small amount of each solution to the straw in the order youdescribed in your guess. FIGURE 2 illustrates how to do this using a pipette or medicinedropper. Fill about one third of the straw with each solution. Place a white piece of paperbehind the straw and observe the colored solutions inside. Record your observations in thedata table.
7. If you do not see three distinct layers, revise your hypothesis.8. Empty the contents of the straw and test your revised hypothesis using the same procedure
as before. Record your observations.9. If you did not see three distinct layers, continue revising your hypothesis and testing it.
Record new hypotheses and observations in the data table.
DISCUSSION1. What was the order of adding solutions that resulted in three distinct layers?
[Bottom to top: blue (ocean or salt water); red (brackish water); green (river or fresh water)]2. How can you explain this result?
(The blue water has the highest density, the green water has the lowest density, and the densityof the red water was between the other two. Liquids of different densities will form layersbased on their respective densities.)
3. Suppose you are at the seacoast in an area where a river runs into a somewhat salty baybefore it reaches the ocean. Where do you predict that you would find the saltiest water:near the surface of the bay or near its bottom. Explain why.(Salt water has a higher density than fresh water and would therefore be found near thebottom of the bay. The fresh water from the river would be found near the surface of the bay.Liquids of different densities will form layers based n their respective densities.)
EVALUATION- As individuals or in groups, students can describe their hypothesis, methods, and results.- Review students data table or hypothesis and observation
EXTENSIONS1. Challenge students to discover the smallest amount of salt that can be dissolved in 500ml
water that will still allow a layer to form between the “Ocean Water” and pure water.2. What is the maximum number of discrete layers of colored salt water that can be placed in a
straw? In order to answer this, students, may wish to experiment with different methods offorming the layers, and test what minimum difference in salt concentration is necessary toform a layer.
3. Students should be encouraged to investigate the different layers of water in the ocean whichoccur because of density differences. They may also find it interesting to research how long ittakes a particle of water to travel in a density current from the poles to the equator.
4. Have students explore layering of water in estuaries. The layering produces a dynamicecosystem with diverse species of animal life.
5. Ask students to theorize why submarine crews often attempt to conceal their ship’s locationby keeping it inside a dense layer of ocean water. Library research about submarines mayhelp them find the answers.
5
Reprinted from Project Earth Science: Physical Oceanography with permission from the National Science Teachers Association, 1840 WilsonBoulevard, Arlington, VA 22201-3000. For more information on this book and other educational resources, please visit the National Science
Teachers Association Web site at www.nsta.org
Data Table: Hypotheses and Observations
Hypothesis 1
Observation
Hypothesis 2
Observation
Hypothesis 3
Observation
Hypothesis 4
Observation
6
Reprinted from Project Earth Science: Physical Oceanography with permission from the National Science Teachers Association, 1840 WilsonBoulevard, Arlington, VA 22201-3000. For more information on this book and other educational resources, please visit the National Science
Teachers Association Web site at www.nsta.org
Composition of Ocean WaterElement Percent of Ocean WaterOxygen 85.7000Hydrogen 10.8000Chlorine 1.9000Sodium 1.0500Magnesium 0.1350Sulfur 0.0885Calcium 0.0400Potassium 0.0380Bromine 0.0065Carbon 0.0028