exploratory laboratory study of lateral turbulent diffusion at the
TRANSCRIPT
Exploratory Laboratory Study of Lateral Turbulent Diffusion at the Surface of an Alluvial Channel
x\\\
GEOLOGICAL SURVEY CIRCULAR 484
Exploratory Laboratory Study ofLateral Turbulent Diffusion at the
Surface of an Alluvial Channel
By W. W. Sayre and A. R. Chamberlain
GEOLOGICAL SURVEY CIRCULAR 484
Washington 7964
United States Department of the InteriorSTEWART L. UDALL, SECRETARY
Geological SurveyTHOMAS B. NOLAN, DIRECTOR
Frw» on application to the U.S. G«oJogkaf Survey, Washington, D. C 20242
CONTENTS
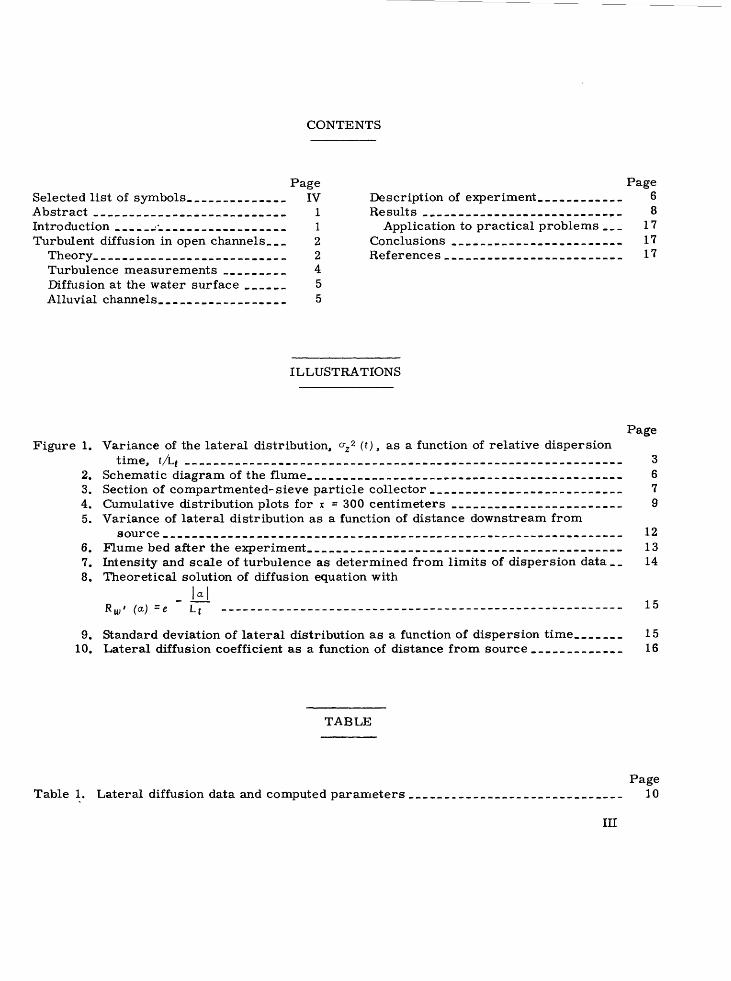
Page PageSelected list of symbols___________ IV Description of experiment,___________ 6Abstract ___________________________ 1 Results ____________________________ 8Introduction.___________________ 1 Application to practical problems ___ 17Turbulent diffusion in open channels.__ 2 Conclusions ________________________ 17
Theory___________________________ 2 References _________________________ 17Turbulence measurements _________ 4Diffusion at the water surface ______ 5Alluvial channels...___________ 5
ILLUSTRATIONS
Page Figure 1. Variance of the lateral distribution, °"2 2 (t), as a function of relative dispersion
time, t/Lt ________________________________________ ___________________ 32. Schematic diagram of the flume.___________________________________________ 63. Section of compartmented-sieve particle collector ___________________________ 74. Cumulative distribution plots for x = 300 centimeters ________________________ 95. Variance of lateral distribution as a function of distance downstream from
source ________________________________________________________________ 126. Flume bed after the experiment.___________________________________________ 137. Intensity and scale of turbulence as determined from limits of dispersion data__ 148. Theoretical solution of diffusion equation with
HRU,' (a) =e L t ------- - 15
9. Standard deviation of lateral distribution as a function of dispersion time____ _ 1510. Lateral diffusion coefficient as a function of distance from source __________ _ 16
TABLE
Page Table 1. Lateral diffusion data and computed parameters ______________________________ 10
III
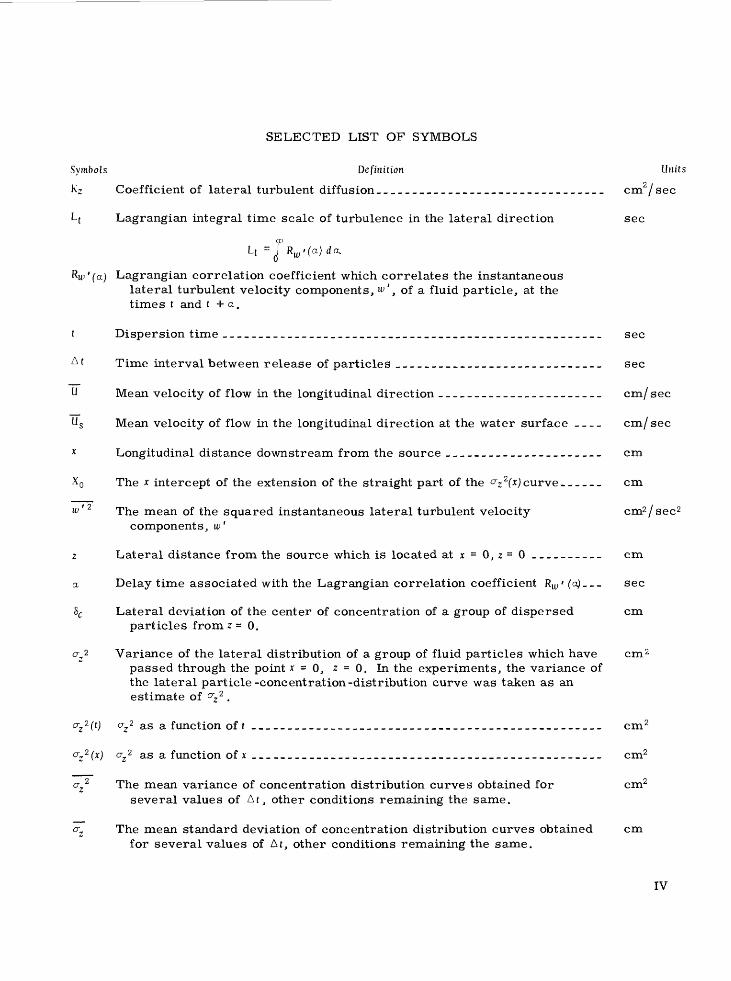
SELECTED LIST OF SYMBOLS
Symbols Definition Units
K'~ Coefficient of lateral turbulent diffusion.. ______________________________ cm2 / sec
L[ Lagrangian integral time scale of turbulence in the lateral direction sec
RW'(CL) Lagrangian correlation coefficient which correlates the instantaneous lateral turbulent velocity components, w' , of a fluid particle, at the times t and t + a,
t Dispersion time _____________________________________________________ sec
A t Time interval between release of particles _____________________________ sec
U Mean velocity of flow in the longitudinal direction _______________________ cm/ sec
U s Mean velocity of flow in the longitudinal direction at the water surface ____ cm/ sec
x Longitudinal distance downstream from the source ______________________ cm
XQ The x intercept of the extension of the straight part of the az 2 (x) curve ______ cm
w ' 2 The mean of the squared instantaneous lateral turbulent velocity cm2 / sec 2 components, w'
z Lateral distance from the source which is located at x = 0, z = 0 __________ cm
a Delay time associated with the Lagrangian correlation coefficient Rw > (o)___ sec
&c Lateral deviation of the center of concentration of a group of dispersed cm particles f rom z = 0.
0,2 Variance of the lateral distribution of a group of fluid particles which have cm 2 passed through the point x - 0, z = 0. In the experiments, the variance of the lateral particle -concentration -distribution curve was taken as an estimate of °~z 2 .
cr_2(tj o-2 2 as a function of t _________________________________________________ cm 2
o, 2 (xj crz 2 as a function of x _________________________________________________ cm2
crz 2 The mean variance of concentration distribution curves obtained for cm2 several values of At, other conditions remaining the same.
o-. The mean standard deviation of concentration distribution curves obtained cm for several values of At, other conditions remaining the same.
IV
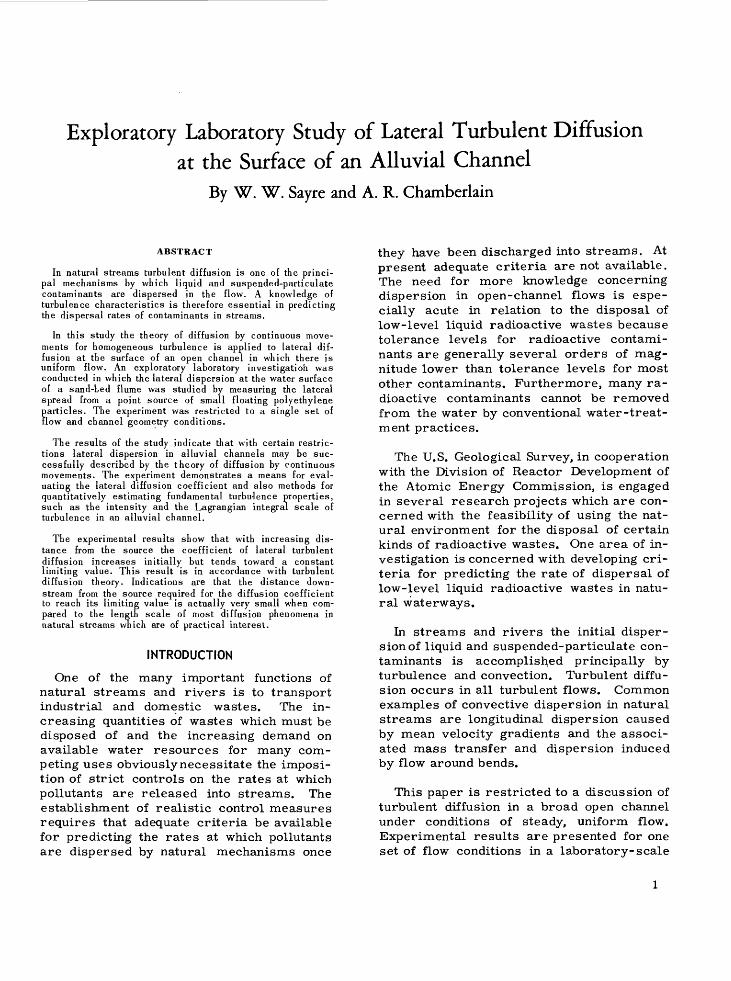
Exploratory Laboratory Study of Lateral Turbulent Diffusion at the Surface of an Alluvial Channel
By W. W. Sayre and A. R. Chamberlain
ABSTRACT
In natural streams turbulent diffusion is one of the princi pal mechanisms by which liquid and suspended-particulate coDtaminants are dispersed in the flow. A knowledge of turbulence characteristics is therefore essential in predicting the dispersal rates of contaminants in streams.
In this study the theory of diffusion by continuous move ments for homogeneous turbulence is applied to lateral dif fusion at the surface of an open channel in which there is uniform flow. An exploratory laboratory investigation was conducted in which the lateral dispersion at the water surface of a sand-Led flume was studied by measuring the lateral spread from a point source of small floating polyethylene particles. The experiment was restricted to a single set of flow and channel geometry conditions.
The results of the study indicate that with certain restric tions lateral dispersion in alluvial channels may be suc cessfully described by the theory of diffusion by continuous movements. The experiment demonstrates a means for eval uating the lateral diffusion coefficient and also methods for quantitatively estimating fundamental turbulence properties, such as the intensity and the Lagrangian integral scale of turbulence in an alluvial channel.
The experimental results show that with increasing dis tance from the source the coefficient of lateral turbulent diffusion increases initially but tends toward a constant limiting value. This result is in accordance with turbulent diffusion theory. Indications are that the distance down stream from the source required for the diffusion coefficient to reach its limiting value is actually very small when com pared to the length scale of most diffusion phenomena in natural streams which are of practical interest.
INTRODUCTION
One of the many important functions of natural streams and rivers is to transport industrial and domestic wastes. The in creasing quantities of wastes which must be disposed of and the increasing demand on available water resources for many com peting uses obviously necessitate the imposi tion of strict controls on the rates at which pollutants are released into streams. The establishment of realistic control measures requires that adequate criteria be available for predicting the rates at which pollutants are dispersed by natural mechanisms once
they have been discharged into streams. At present adequate criteria are not available. The need for more knowledge concerning dispersion in open-channel flows is espe cially acute in relation to the disposal of low-level liquid radioactive wastes because tolerance levels for radioactive contami nants are generally several orders of mag nitude lower than tolerance levels for most other contaminants. Furthermore, many ra dioactive contaminants cannot be removed from the water by conventional water-treat ment practices.
The U.S. Geological Survey, in cooperation with the Division of Reactor Development of the Atomic Energy Commission, is engaged in several research projects which are con cerned with the feasibility of using the nat ural environment for the disposal of certain kinds of radioactive wastes. One area of in vestigation is concerned with developing cri teria for predicting the rate of dispersal of low-level liquid radioactive wastes in natu ral waterways.
In streams and rivers the initial disper sion of liquid and suspended-particulate con taminants is accomplished principally by turbulence and convection. Turbulent diffu sion occurs in all turbulent flows. Common examples of convective dispersion in natural streams are longitudinal dispersion caused by mean velocity gradients and the associ ated mass transfer and dispersion induced by flow around bends.
This paper is restricted to a discussion of turbulent diffusion in a broad open channel under conditions of steady, uniform flow. Experimental results are presented for one set of flow conditions in a laboratory-scale
EXPLORATORY LABORATORY STUDY OF LATERAL TURBULENT DIFFUSION AT THE SURFACE OF AN ALLUVIAL CHANNEL
alluvial channel. The experiment was ex ploratory and conducted for the purpose of determining whether certain experimental techniques which have been successfully ap plied to the study of turbulence and diffusion in rigid-boundary open channels could be similarly applied to alluvial-channel studies.
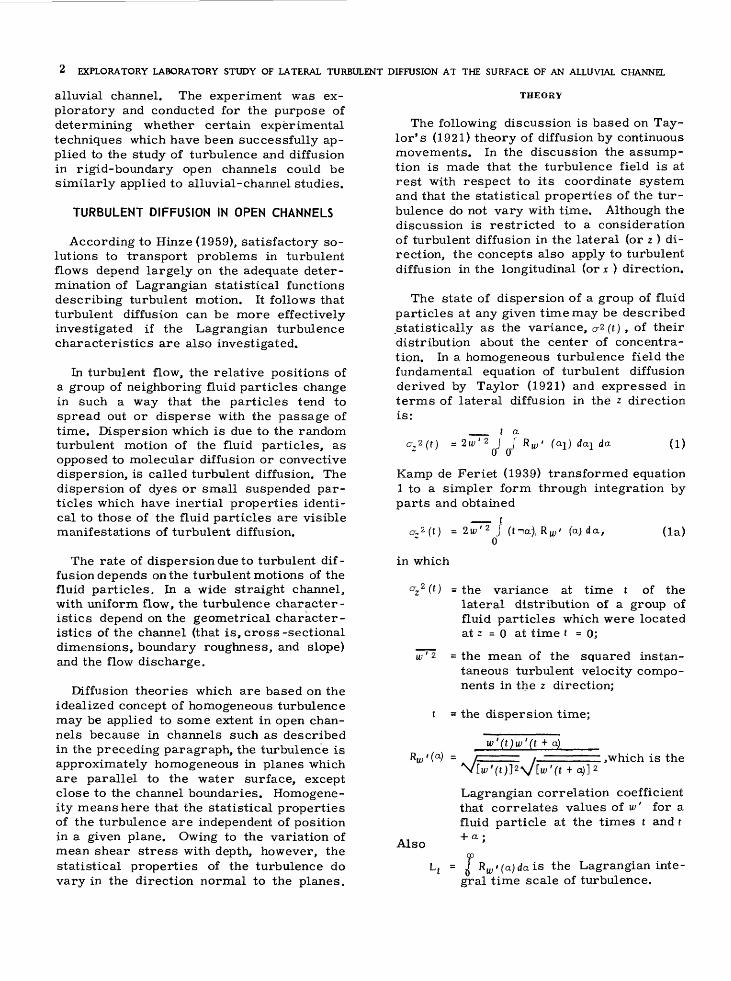
TURBULENT DIFFUSION IN OPEN CHANNELS
According to Hinze (1959), satisfactory so lutions to transport problems in turbulent flows depend largely on the adequate deter mination of Lagrangian statistical functions describing turbulent motion. It follows that turbulent diffusion can be more effectively investigated if the Lagrangian turbulence characteristics are also investigated.
In turbulent flow, the relative positions of a group of neighboring fluid particles change in such a way that the particles tend to spread out or disperse with the passage of time. Dispersion which is due to the random turbulent motion of the fluid particles, as opposed to molecular diffusion or convective dispersion, is called turbulent diffusion. The dispersion of dyes or small suspended par ticles which have inertial properties identi cal to those of the fluid particles are visible manifestations of turbulent diffusion.
The rate of dispersion due to turbulent dif fusion depends on the turbulent motions of the fluid particles. In a wide straight channel, with uniform flow, the turbulence character istics depend on the geometrical character istics of the channel (that is, cross-sectional dimensions, boundary roughness, and slope) and the flow discharge.
Diffusion theories which are based on the idealized concept of homogeneous turbulence may be applied to some extent in open chan nels because in channels such as described in the preceding paragraph, the turbulence is approximately homogeneous in planes which are parallel to the water surface, except close to the channel boundaries. Homogene ity means here that the statistical properties of the turbulence are independent of position in a given plane. Owing to the variation of mean shear stress with depth, however, the statistical properties of the turbulence do vary in the direction normal to the planes.
THEORY
The following discussion is based on Tay- lor's (1921) theory of diffusion by continuous movements. In the discussion the assump tion is made that the turbulence field is at rest with respect to its coordinate system and that the statistical properties of the tur bulence do not vary with time. Although the discussion is restricted to a consideration of turbulent diffusion in the lateral (or z ) di rection, the concepts also apply to turbulent diffusion in the longitudinal (or x ) direction.
The state of dispersion of a group of fluid particles at any given time may be described .statistically as the variance, 0-2 ft), of their distribution about the center of concentra tion. In a homogeneous turbulence field the fundamental equation of turbulent diffusion derived by Taylor (1921) and expressed in terms of lateral diffusion in the 2 direction is:
0-2 t a
= 2w '2 I f R. da (1)
Kamp de Feriet (1939) transformed equation 1 to a simpler form through integration by parts and obtained
__ t a, 2 ft) = 2u;' 2 / (t-n), R w > (a; da, (la )
0
in which
°2 2 f t ) = the variance at time t of the lateral distribution of a group of fluid particles which were located at 2 = o at time t = 0;
w' 2 = the mean of the squared instan taneous turbulent velocity compo nents in the 2 direction;
t = the dispersion time;
w'(t)w'(t + a)
Also
; ,which is the
Lagrangian correlation coefficient that correlates values of w' for a fluid particle at the times t and t+ 0. ;
TL t ~ i R w '(a)dais the Lagrangian inte gral time scale of turbulence.
TURBULENT DIFFUSION IN OPEN CHANNELS
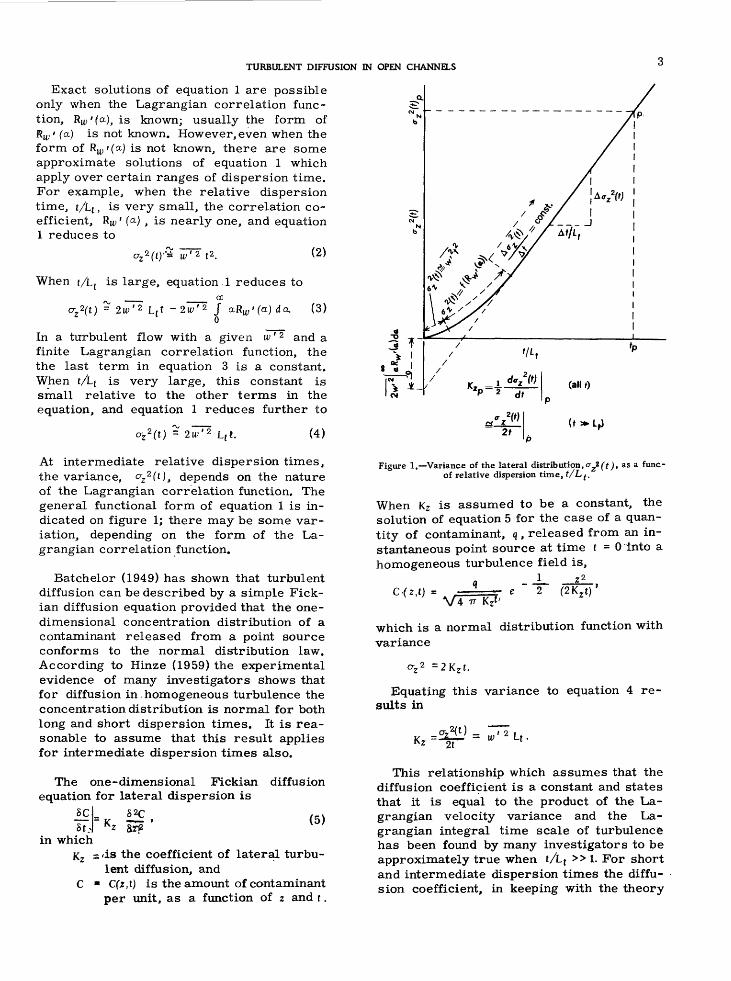
Exact solutions of equation 1 are possible only when the Lagrangian correlation func tion, Rw'(a), is known; usually the form of Rw > (a.) is not known. However, even when the form of Rw >(a) is not known, there are some approximate solutions of equation 1 which apply over certain ranges of dispersion time. For example, when the relative dispersion time, t/Li, is very small, the correlation co efficient, Rw ' fa) t is nearly one, and equation 1 reduces to
o-2t"3 T^tz. (2)
When t/L f is large, equation. 1 reduces to___ 00
>'2 J aRw '(a) da. (3)= 2w' z L t t
In a turbulent flow with a given w ' 2 and a finite Lagrangian correlation function, the the last term in equation 3 is a constant. When t/L t is very large, this constant is small relative to the other terms in the equation, and equation 1 reduces further to
cr2 2 (t) = 2w' z L t t. (4)
At intermediate relative dispersion times, the variance, Crz 2 f0, depends on the nature of the Lagrangian correlation function. The general functional form of equation 1 is in dicated on figure 1; there may be some var iation, depending on the form of the La grangian correlation function.
Batchelor (1949) has shown that turbulent diffusion can be described by a simple Fick- ian diffusion equation provided that the one- dimensional concentration distribution of a contaminant released from a point source conforms to the normal distribution law. According to Hinze (1959) the experimental evidence of many investigators shows that for diffusion in .homogeneous turbulence the concentration distribution is normal for both long and short dispersion times. It is rea sonable to assume that this result applies for intermediate dispersion times also.
The one-dimensional Fickian equation for lateral dispersion is
sclSt-l K2
diffusion
(5)
in whichKz = 'is the coefficient of lateral turbu
lent diffusion, andC « C(z,t) is the amount of contaminant
per unit, as a function of 2 and t.
Figure 1. Variance of the lateral distribution, ^zz (t), as a func- of relative dispersion time, t/Lf.
When Kz is assumed to be a constant, the solution of equation 5 for the case of a quan tity of contaminant, q , released from an in stantaneous point source at time t = 0 into a homogeneous turbulence field is,
--L. z 2 C-(z.t) = - e 2 (2Kzt)'
which is a normal distribution function with variance
o-2 2 =2K 2 t.
Equating this variance to equation 4 re sults in
This relationship which assumes that the diffusion coefficient is a constant and states that it is equal to the product of the La grangian velocity variance and the La grangian integral time scale of turbulence has been found by many investigators to be approximately true when t/L t » 1. For short and intermediate dispersion times the diffu sion coefficient, in keeping with the theory
EXPLORATORY LABORATORY STUDY OF LATERAL TURBULENT DIFFUSION AT THE SURFACE OF AN ALLUVIAL CHANNEL
of diffusion by continuous movements, is usually defined as
"* 2 dt
and is in general a function of dispersion time.
Solutions of equation 5 for this and vari ous other initial and boundary conditions are available in the literature (for example, Frenkiel, 1953; Hinze, 1959; and Scull and Mickelsen, 1957).
The foregoing discussion of turbulent dif fusion pertains to a turbulence field which is stationary with respect to its coordinate system. However, with the transformation
x - Utthe theory applies also to a homogeneous turbulence field which is being transported bodily at a constant velocity, U, in the x di rection. The. discussion has also been sim plified to the extent that complicating fac tors such as confining boundaries and veloc ity gradients, which influence the diffusion process in open channels, have not been con sidered. In spite of these simplifications, the concepts presented constitute a theoret ical framework for studying turbulent diffu sion in open channels.
TURBULENCE MEASUREMENTS
In experimental fluid mechanics, studies of turbulence in water have lagged consider ably behind corresponding studies in air. The lag is partially due to the fact that in struments such as the hot-wire anemometer, Which has proven satisfactory for turbulence measurements in air, have not been devel oped to the level of adequacy required for turbulence measurements in water. Without such instruments, measurements of disper sion afford one of the most promising means by which fundamental turbulence character istics can be quantitatively estimated. Spe cifically, the intensity and the integral scale of turbulence can be determined, and the Lagrangian correlation coefficient can be estimated on the basis of a statistical anal ysis of dispersion data. Baldwin and Mickel sen (1962) have demonstrated that these La grangian properties can be related empiri cally to the corresponding Eulerian proper ties which are usually obtained from ane mometer measurements.
If the lateral diffusion in the xz plane of a contaminant released from a point source in a uniform flow has a uniform mean velocity, u~ = x/t, the intensity of turbulence is given by: __
lim(6)
The Lagrangian integral time scale of turbu lence is given by
L t = U(7)
Once u/sT is known, the Lagrangian corre lation coefficient can be estimated graphi cally by successive differentiations of a o-2 2 (t)curve, since by applying Leibnitz' rule to equation 1 and differentiating twice,
lV(t)=4= ^ az2(t) . (8) 2w' 2 dt 2
If the form of the Lagrangian correlation function is known or assumed in advance, and is integrable, the intensity and scale of tur bulence can be determined from diffusion data obtained at intermediate values of t/Lt , say (0.1<t/L t < 10). This technique is useful when, as is often the case, it is difficult or impossible to obtain diffusion data at the limiting conditions specified by equations 6 and 7.
There is experimental evidence (Ippen and Raichlen, 1957) that at large Reynolds num bers the correlation coefficient may be ap proximated reasonably well by an equation of the form
_ M!V(a) = e
(9)
=71 -2 * /Lt r'/Lt-«,
By converting equation 1 to the dimension- less form
(10)
and by making the substitution indicated by equation 9, Frenkiel (1953) obtained the fol lowing approximate solutions to equation 10. If 0<t/L t ^0.030,
(10a)
TURBULENT DIFFUSION IN OPEN CHANNELS
if 0.030 <t/L ( ^3.63,
if 3.63 <t/L t <
^llil = 2 (t/L ( -l);and
if 101 <t/Lt,
= 2t/L t
(10b)
(10c)
(10d)
The intensity and scale of turbulence can now be determined graphically by superim posing a cr2 (t) curve, based on experimental data and represented on logarithmic coordi nates, on the theoretical az / t
curve as determined from equations 10 a d, so that the curves match. The ratios of the respective ordinates and abscissas then define the ratios t/(t/L t ) and az (t)
from which Lf and may be evaluated.
The corresponding parameters describing the longitudinal turbulence characteristics may be obtained in an analogous manner by observing the longitudinal diffusion in the xz plane of a contaminant released instantane ously from a point source or a line source which is parallel to the z axis.
Application of these and similar techniques to the determination of turbulence charac teristics in open channels has been pioneered by Kalinske and Pien (1944) and Orlob (1959). Kalinske and Pien (1944) obtained measure ments of the lateral diffusion of a hydrochlo ric acid-alcohol mixture (spgr = l) in a three- dimensional turbulence field in a laboratory flume. Orlob (1959) studied the lateral dif fusion of small polyethylene particles (spgr=0.975)in a two-dimensional turbulence field defined by the water surface in a labo ratory flume.
DIFFUSION AT THE WATER SURFACE
The water surface (or a plane parallel thereto) of a wide channel in which there is
uniform flow constitutes a two-dimensional nondecaying turbulence field in which the turbulence may be assumed to be statisti cally homogeneous except in regions very close to the sidewalls. These conditions conform approximately to the restrictions by which diffusion theory for homogeneous turbulence is limited. Therefore, the water surface of a channel such as the one defined above is a good medium for the quantitative determination of turbulence characteristics from dispersion observations. Furthermore, measurements of dispersion on the water surface of a laboratory flume may be easily and accurately obtained, as Orlob (1959) has demonstrated.
The extent t«a which the diffusion patterns at the water surface reflect the diffusion process and turbulence characteristics be neath the surface is questionable, particu larly in alluvial channels. The experimental results of Kalinske and Pien (1944), however, tend to confirm the Reynolds analogy that the local diffusion coefficient, K(y), and the kine matic eddy viscosity,e, in the equation
T - ep dudy
are virtually equivalent, equation
In the preceding
r = rfYl- ] is the mean intensity of the
local shear, where TQ is the mean in tensity of shear at the bed and D is the mean depth of flow,
p = the mass density of the fluid, and u = the mean velocity at distance, y, above
the bed.If the Reynolds analogy is indeed a reason able approximation, measured velocity pro files could be used to predict K(y), and per haps other turbulence characteristics, as functions of y.
ALLUVIAL CHANNELS
In general, diffusion phenomena in open alluvial channels should be similar to the corresponding phenomena in rigid-boundary open channels. Owing to the differences in the mechanics of flow associated with the two types of channels, however, certain differ ences are to be expected. For example, in alluvial channels there is a mutual interac tion between the boundary form and both the
6 EXPLORATORY LABORATORY STUDY OF LATERAL TURBULENT DIFFUSION AT THE SURFACE OF AN ALLUVIAL CHANNEL
turbulence characteristics and the velocity distribution (the flow characteristics deter mine the bed form and vice versa);.in rigid- boundary channels, the form and roughness of the boundary influence the turbulence characteristics and the velocity distribution, but there is no reciprocal effect. Another important difference is that the individual ripples and dunes, which usually make up the dominant roughness elements in alluvial channels, migrate in the direction of flow and undergo continuous transformation in shape and size, although a certain statistical constancy prevails. The extent to which fac tors such as these affect the diffusion proc ess and the turbulence characteristics in open alluvial channels has not been system atically investigated.
DESCRIPTION OF EXPERIMENT
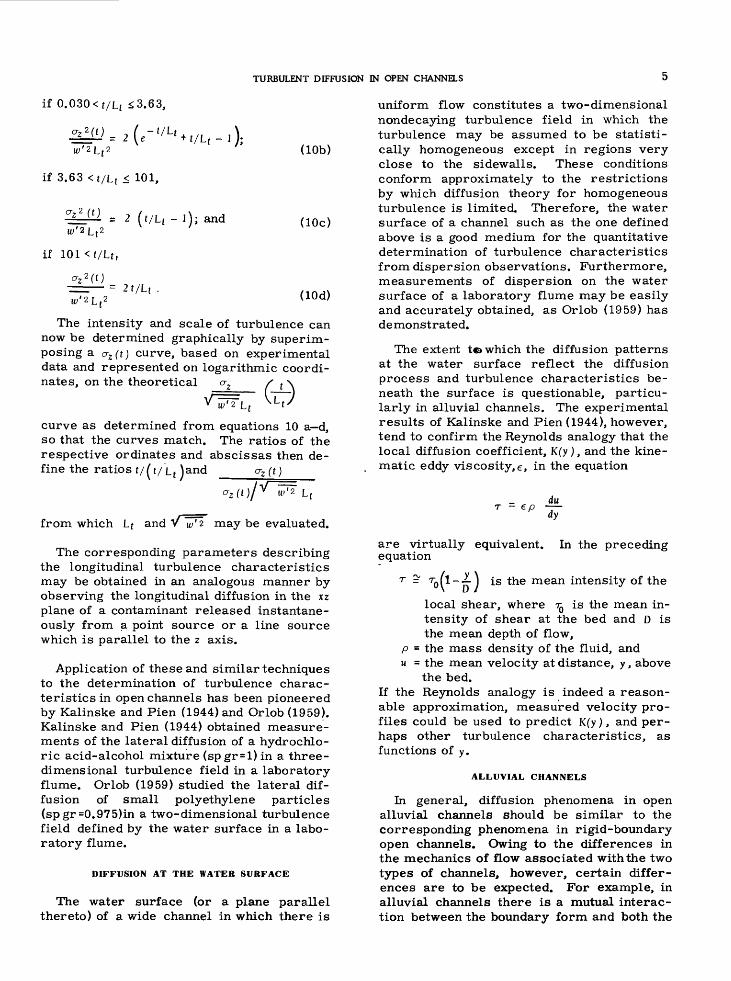
An exploratory experiment was conducted in an 8-foot-wide, 150-foot-long, laboratory flume at Colorado State University. The bed of the flume was covered with sand to a depth of about 8 inches. A schematic dia gram of the flume circulation system is shown in figure 2.
Diffusion data were obtained for one set of flow conditions. Data describing the flow conditions are as follows:
Discharge, 7.41 cubic feet per secondAverage depth, 0.58 feetAverage water-surface and bed slope,
0.00071Water temperature, 17.4°CTotal sediment concentration, 63 parts
per millionBed configuration, small dunes:
Average dune length, 2.8 feet Average dune height, 0.029 feet Average dune velocity, 0.067 feet per
minuteBed material:
Median fall diameter, 0.93 mm
Gradation coefficient,__ /_5£_ + 2 Wjq Q = 1.53
The equipment and procedures employed in obtaining data on the flow conditions are described by Simons, Richardson and Albert- son (1961).
The experimental techniques for studying lateral diffusion were similar to those em ployed by Orlob (1959). Polyethylene parti cles were released one at a time from a point source located on the water surface on the center line of the flume, 30 feet down stream from the head box. As the particles floated down the flume, their paths, which
Figure 2. Schematic diagram of the flume, a, pumping units; 6j, \) z , orifices; C, head-box and diffuser; d, baffles and screens; e, flume (8 ft x 2 ft x 150 ft);_f, tailgate; .g, total load sampler; h, tail-box; ,-'. jacks supporting the flume. After Simons and others (1961, fig. 1).
DESCRIPTION OF EXPERIMENT
tended to diverge, defined a lateral disper sion pattern. The dispersion pattern was determined by intercepting the particles at definite distances downstream from the source and noting their lateral positions.
The polyethylene particles were dis-shaped and had a diameter of 1/8 inch and a thick ness of 1/16 inch. The specific gravity of the particles was approximately 0.96. Therefore, there was little density effect in the inertial response of the particles to tur bulent impulses. The particles were suffi ciently large to eliminate any appreciable effect due to molecular diffusion but proba bly not too large to trace the motions of the larger turbulent eddies at the water surface. The effect of particle size was not investi gated in this study. However, recent and as yet unpublished data obtained by the senior author in the same flume and at about the same Reynolds number indicate that there is little difference in the lateral' dispersion patterns of 1/8 inch polyethylene particles dispersing on the surface and Rhodamine-B dye dispersing beneath the surface. This would indicate that the particles were not too large.
The particles were released into the flow through a funnel which was mounted on a point-gage assembly. The 3/16 inch diame ter tip of the funnel was located just above the water surface. The particles were ejected sequentially in lots of 100 into the funnel at a constant rate from a manually- operated dispenser. In order to detect any effect due to periodicity in the turbulence, the experiment was repeated for sevferal lots at different rates of release by varying the time interval, At , from 1 to 5 seconds. No periodicity effect was detected. The particle-introduction methods simulated continuous release from a point source in a 2-dimensional system or, if diffusion in the y direction is neglected, from a vertical line source in a 3-dimensional system.
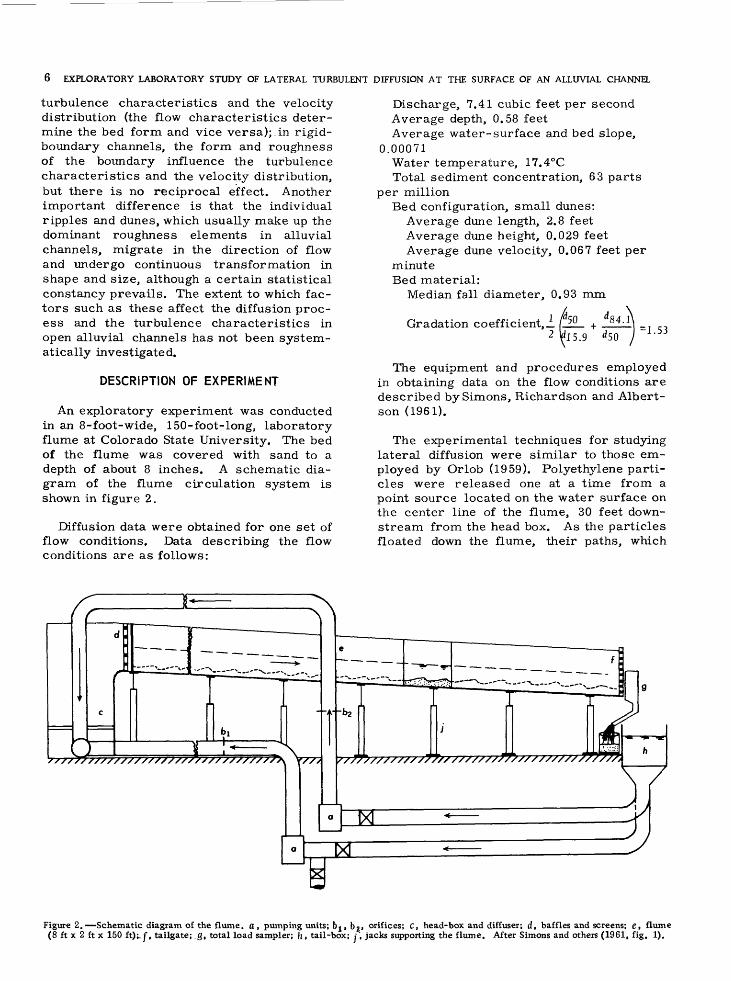
The particles were caught in a compart - mented sieve which was inserted in the flow, normal to the flow direction. The collector extended across the entire width of the flume. The collector was divided into 1- centimeter compartments as shown in figure 3, and each compartment was numbered. Because only the bottom 1/2 inch, or less, of the collector was immersed in the flow, disturbance to the flow was assumed to be
Sheet-metal dividers Spaced at 1-cm intervals
Window-screen covering on bottom and back
Figure 3. Section of compartmented-sieve particle collector.
negligible. The lateral distribution of parti cle paths for each 100-particle lot was de termined by counting and recording the num ber of particles trapped in each compart ment. Lateral distributions of 3 to 5 lots of 100 particles were determined in this man ner for source-to-collector distances of 15, 30, 48, 60, 120, 240,300,450, 600, 900; 1500, 1950, 2400, 2850, and 3300 centimeters.
The diffusion theory discussed in the pre vious section is based on the Lagrangian reference system in which attention is fo cused on the displacement histories of indi vidual particles with respect to time. If the data had been obtained in strict accordance with the theory, the lateral position of each particle at a specified dispersion time, t , following release would have been deter mined, and the extent of dispersion would be described as the variance, o-z z (t), of the lat eral distribution of particles about the mean lateral position at time t. Actually the lat eral position of each particle was deter mined at a specified distance, x, downstream from the source rather than at a specified time, t, and the" extent of dispersion was de scribed asca-2 2(x j. Because the flow was uni form (x = Ut) and x was large compared to the lateral deviations from the mean path, z , it seemed reasonable to assume that o-z 2(t)|= crz 2(x ),In the analysis which follows,no distinction between crz ^(i) and \o~z 2 (x) is made, and o-z 2 is substituted foro-^fx^
8 EXPLORATORY LABORATORY STUDY OF LATERAL TURBULENT DIFFUSION AT THE SURFACE OF AN ALLUVIAL CHANNEL
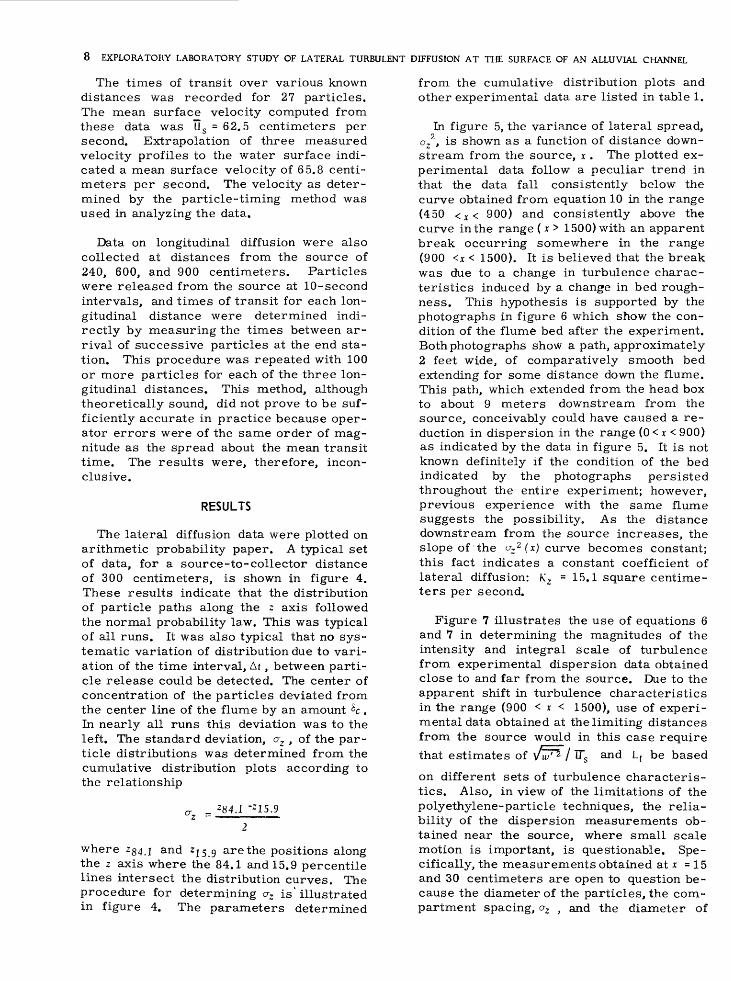
The times of transit over various known distances was recorded for 27 particles. The mean surface velocity computed from these data was U s = 62.5 centimeters per second. Extrapolation of three measured velocity profiles to the water surface indi cated a mean surface velocity of 65.8 centi meters per second. The velocity as deter mined by the particle-timing method was used in analyzing the data.
Data on longitudinal diffusion were also collected at distances from the source of 240, 600, and 900 centimeters. Particles were released from the source at 10-second intervals, and times of transit for each lon gitudinal distance were determined indi rectly by measuring the times between ar rival of successive particles at the end sta tion. This procedure was repeated with 100 or more particles for each of the three lon gitudinal distances. This method, although theoretically sound, did not prove to be suf ficiently accurate in practice because oper ator errors were of the same order of mag nitude as the spread about the mean transit time. The results were, therefore, incon clusive.
RESULTS
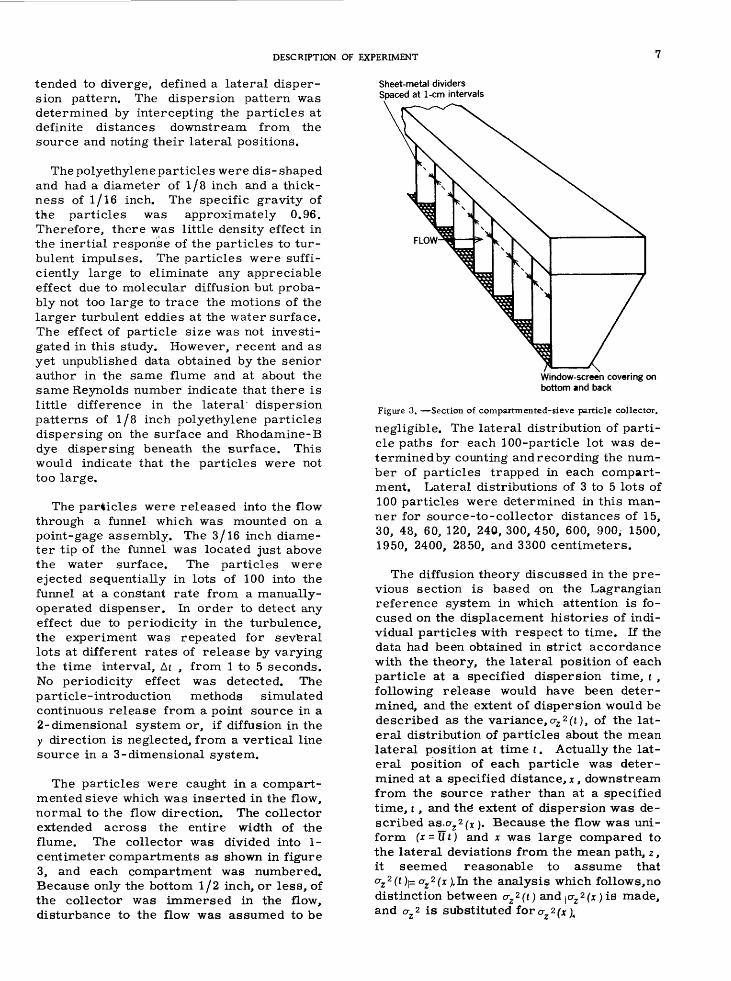
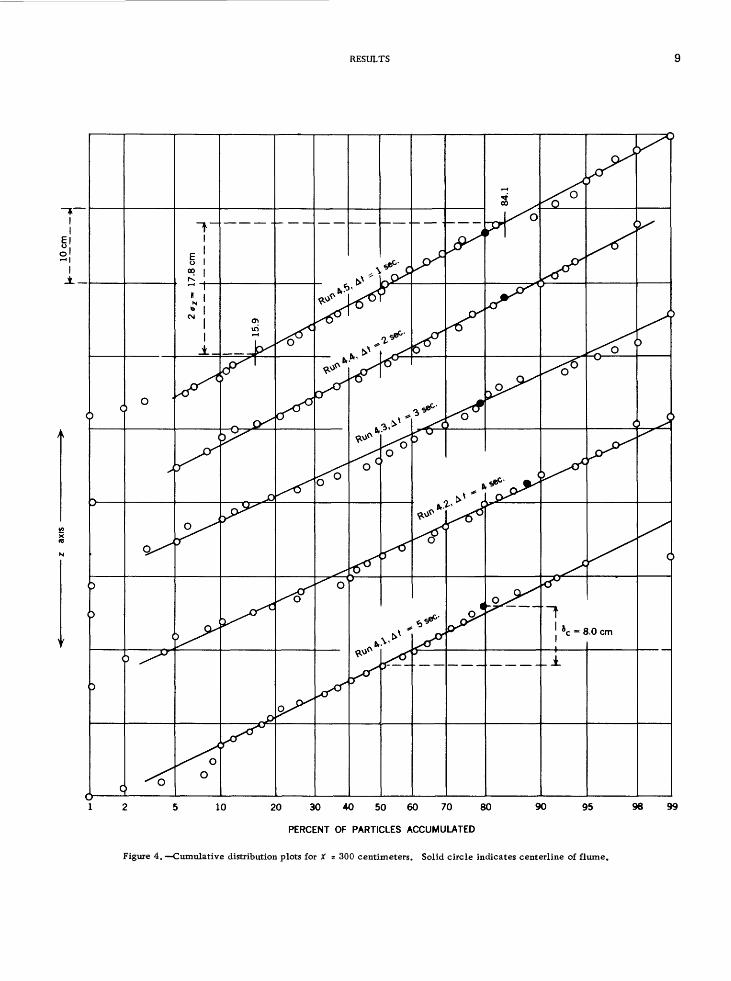
The lateral diffusion data were plotted on arithmetic probability paper. A typical set of data, for a source-to-collector distance of 300 centimeters, is shown in figure 4. These results indicate that the distribution of particle paths along the z axis followed the normal probability law. This was typical of all runs. It was also typical that no sys tematic variation of distribution due to vari ation of the time interval, At, between parti cle release could be detected. The center of concentration of the particles deviated from the center line of the flume by an amount %c , In nearly all runs this deviation was to the left. The standard deviation, a2 , of the par ticle distributions was determined from the cumulative distribution plots according to the relationship
r _ Z 84.1 -"15.9z -
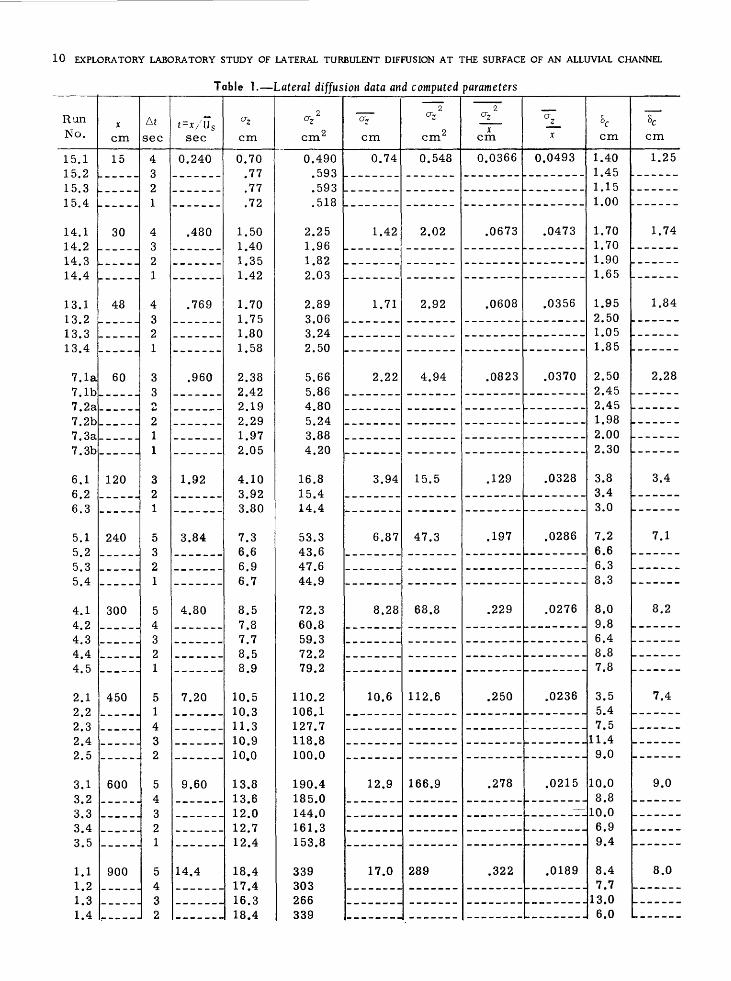
from the cumulative distribution plots and other experimental data are listed in table 1.
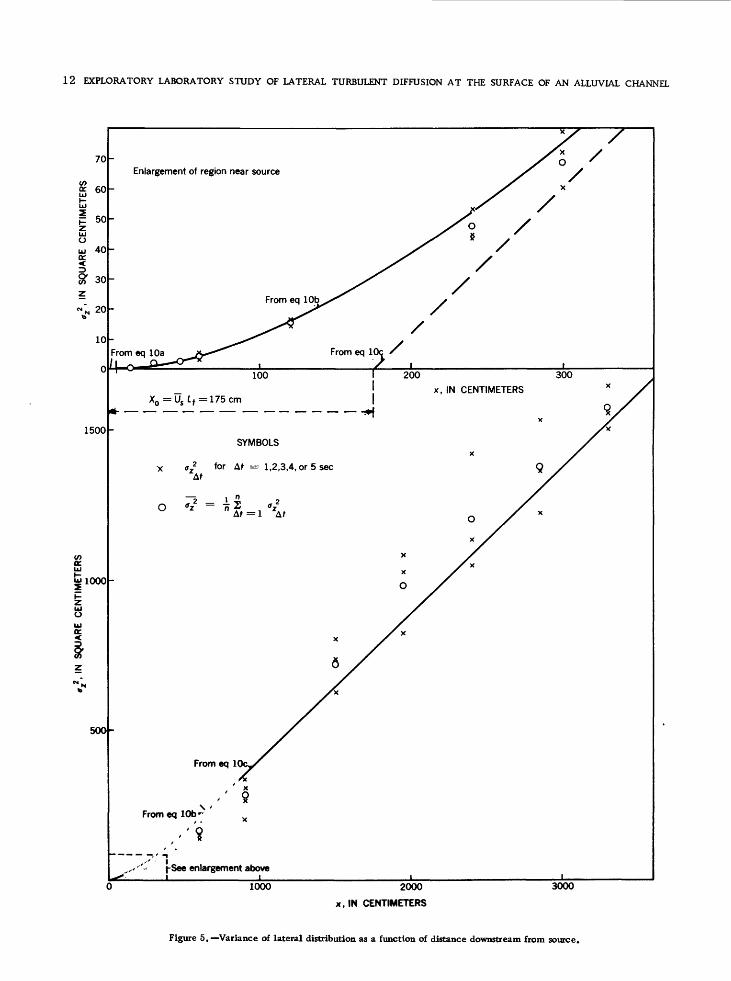
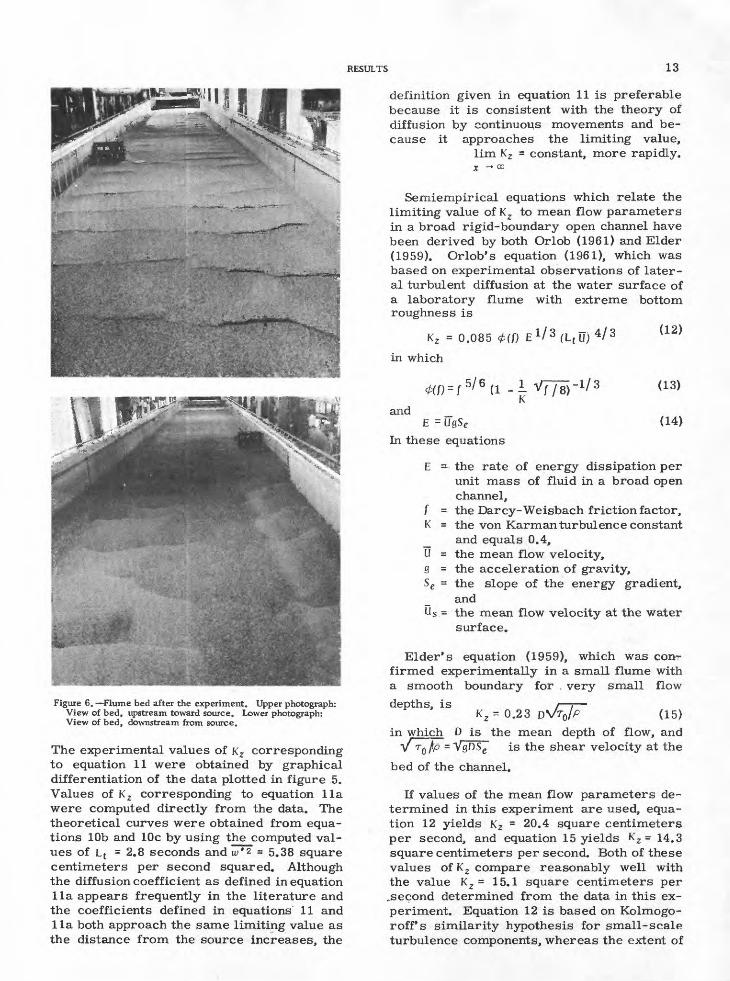
In figure 5, the variance of lateral spread, a,2 , is shown as a function of distance down stream from the source, \ . The plotted ex perimental data follow a peculiar trend in that the data fall consistently below the curve obtained from equation 10 in the range (450 < x < 900) and consistently above the curve in the range ( x > 1500) with an apparent break occurring somewhere in the range (900 <x < 1500). It is believed that the break was due to a change in turbulence charac teristics induced by a change in bed rough ness. This hypothesis is supported by the photographs in figure 6 which show the con dition of the flume bed after the experiment. Both photographs show a path, approximately 2 feet wide, of comparatively smooth bed extending for some distance down the flume. This path, which extended from the head box to about 9 meters downstream from the source, conceivably could have caused a re duction in dispersion in the range (0< x < 900) as indicated by the data in figure 5. It is not known definitely if the condition of the bed indicated by the photographs persisted throughout the entire experiment; however, previous experience with the same flume suggests the possibility. As the distance downstream from the source increases, the slope of the v: 2 (x) curve becomes constant; this fact indicates a constant coefficient of lateral diffusion: K 2 = 15.1 square centime ters per second.
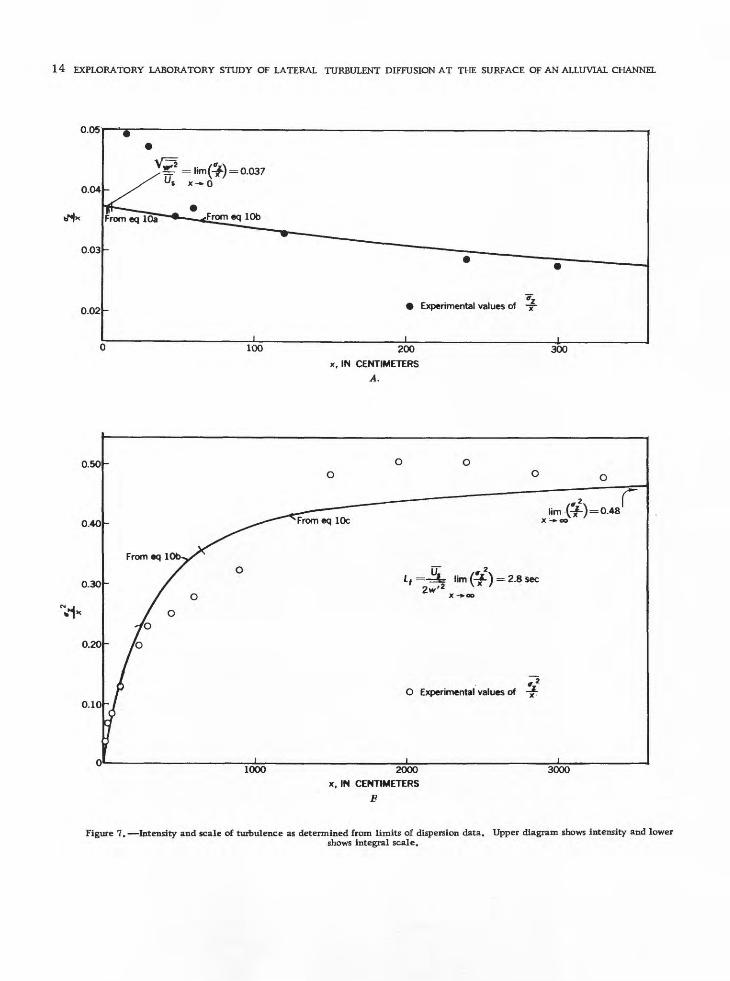
Figure 7 illustrates the use of equations 6 and 7 in determining the magnitudes of the intensity and integral scale of turbulence from experimental dispersion data obtained close to and far from the source. Due to the apparent shift in turbulence characteristics in the range (900 < x < 1500), use of experi mental data obtained at the limiting distances from the source would in this case require
that estimates of U"s and L t be based
where z 8 4j and Zj 5 9 are the positions along the z axis where the 84.1 and 15.9 percentile lines intersect the distribution curves. The procedure for determining crz is'illustrated in figure 4. The parameters determined
on different sets of turbulence characteris tics. Also, in view of the limitations of the polyethylene-particle techniques, the relia bility of the dispersion measurements ob tained near the source, where small scale motion is important, is questionable. Spe cifically, the measurements obtained at * =15 and 30 centimeters are open to question be cause the diameter of the particles, the com partment spacing, az t and the diameter of
RESULTS
JL_
20 30 40 50 60 70 80
PERCENT OF PARTICLES ACCUMULATED
90 95 98 99
Figure 4. Cumulative distribution plots for Jt = 300 centimeters. Solid circle indicates centerline of flume.
10 EXPLORATORY LABORATORY STUDY OF LATERAL TURBULENT DIFFUSION AT THE SURFACE OF AN ALLUVIAL CHANNEL
Table 1. Lateral diffusion data and computed parameters
RanNo.
15.1 1 R 91 ^i ^
1 R 4
14.1
149
1 4 q
14 4
13.11 ^ 9
1 ^ ^
1^4
7. la 7.1b7 2a7 9h
7 ^a
7.3b
6.1 6.26.3
5.1 5 2^i 3
^1 4
4.1 4 94 *3
4.44 ^
2.19 9
9 ^
9 4
2 K
3.1^ 9
3 ^*3 4
3 ^i
1.1 1 9
1 q
1.4
X
cm
15
30
48
60
120
240
300
450
600
900
At sec
4q
0
1
4 3
1
4Q
o
1
3Q
0
O
1
1
3 9
1
5Q
0
1
54 3
o
1
5 14qo
5 4q
9
1
5 4q
2
t = x/U s sec
0.240
.480
.769
.960
1.92
3.84
4.80
7.20
9.60
14.4
az
cm
0.70 .77.7779
1.50 1.401 Ti
1 49
1.70 1 751.801.58
2.38 9 499 1 Q
9 99
1 Q79 0^
4.10 *3 Q9
3.80
7.3 6.6fi q
6.7
8.5 7.87.78 ^i
8 Q
10.5 10 3
U Q
1 n Q10.0
13.8 13.61 9 n12 7lo 4
18.4 17.416.318.4
2 ^Z
cm 2
0.490 ^IQ?
.593
.518
2.25 1 Qfi1.829 0*3
2.89 3.069 94
9 ^10
5.66 5.864.80R 94
3.884 90
16.8 1 c; 4
14.4
53.3 43 fi
47.644 Q
72.3 60.859.379 27Q 9
110.2 106.1m 7
118.8100.0
190.4 185.0144.0161.3153.8
339 303266339
°~z
cm
0.74
1.42
1.71
2.22
3.94
6.87
8.28
10.6
12.9
17.0
2 CT,
cm2
0.548
2.02
2.92
4.94
15.5
47.3
68.8
112.6
166.9
289
2 °Z
Xcm
0.0366
.0673
.0608
.0823
.129
.197
.229
.250
.278
.322
a_z_
X
0.0493
.0473
.0356
.0370
.0328
.0286
.0276
.0236
.0215
.0189
bc cm
1.40 1.451.151.00
1.70 1.701.901.65
1.95 2.501.051.85
2.50 2.452.451.982.002.30
3.8 3.43.0
7.2 6.66.38.3
8.0 9.86.48.87.8
3.55.47.5
11.49.0
10.0 8.8
10.06.99.4
8.4 7.7
13.06.0
8C
cm
1.25
1.74
1.84
2.28
3.4
7.1
8.2
7.4
9.0
8.0
RESULTS
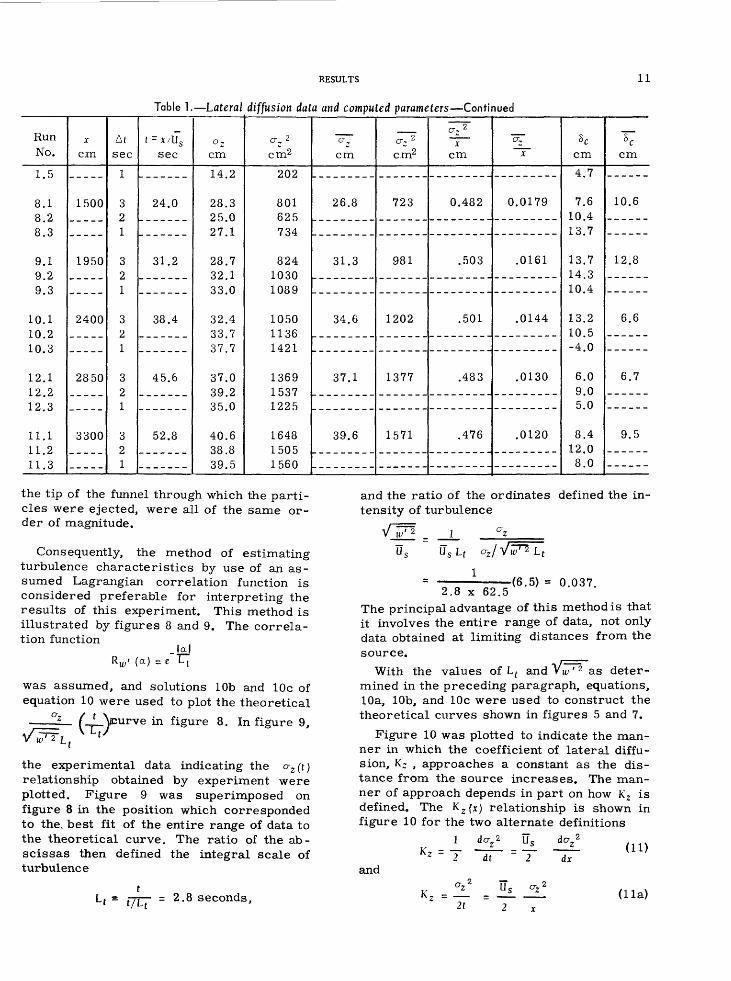
Table 1. Lateral diffusion data and computed parameters Continued
11
RunNo.
1.5
8.18 9
8 0
9.1n 9
Q 3
10.1 i n 9in s
12.11 9 91 9 °.
11.1 i i 2
1 1 °.
X
c.m
1500
1950
2400
2850
3300
At sec
1
3 o
1
3 9
1
39
1
3 9
1
3 9
1
sec
24.0
31.2
38.4
45.6
52.8
cm
1 4 9
28.3 9 n97 1
28.7
33 0
32.4
Q7 7
37.0on 9
350
40.6 38.8
cr, 2
cm2
909
801 6257°.4
824 10301089
1050 11361421
1369
1 99 R
1648 15051560
cr,
cm
26.8
31.3
34.6
37.1
39.6
<^ 2 cm2
723
981
1202
1377
1571
X
cm
0.482
.503
.501
.483
.476
X
0.0179
.0161
.0144
.0130
.0120
cm
4.7
7.6 10.413.7
13.7 14.310.4
13.2 10.5-4.0
6.0 9.05.0
8.4 12.08.0
cm
10.6
12.8
6.6
6.7
9.5
the tip of the funnel through which the parti cles were ejected, were all of the same or der of magnitude.
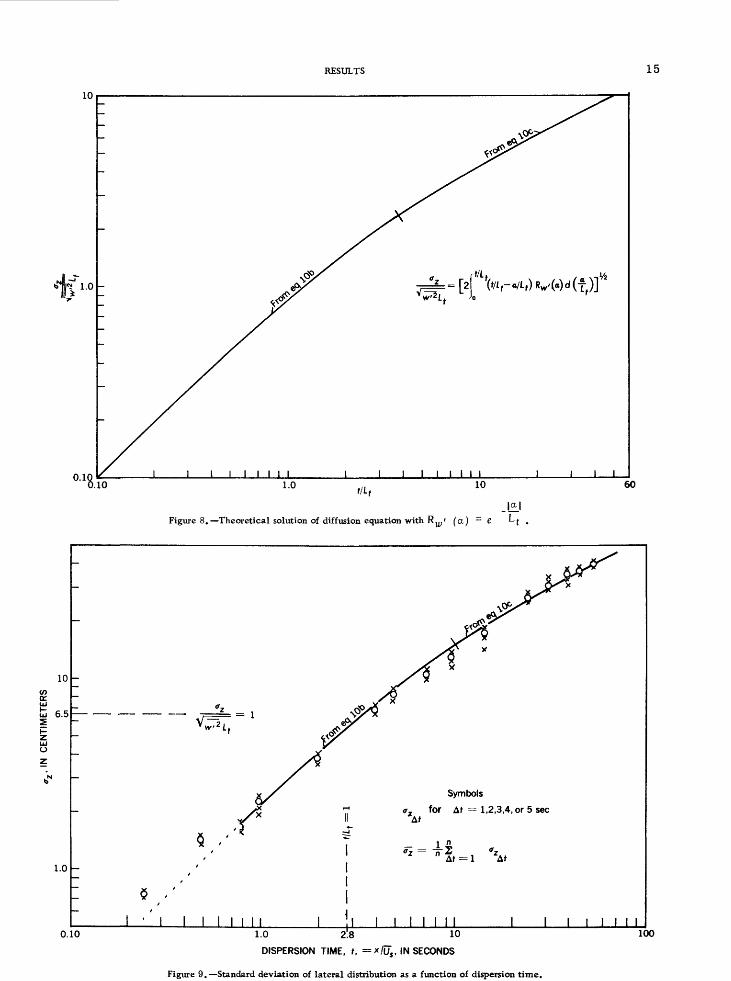
Consequently, the method of estimating turbulence characteristics by use of an as sumed Lagrangian correlation function is considered preferable for interpreting the results of this experiment. This method is illustrated by figures 8 and 9. The correla tion function _io|
R w > (a) = e L t
was assumed, and solutions lOb and lOc of equation 10 were used to plot the theoretical
urve in figure 8. In figure 9,
and the ratio of the ordinates defined the in tensity of turbulence
1-(6.5) = 0.037.
2.8 x 62.5The principal advantage of this method is that it involves the entire range of data, not only data obtained at limiting distances from the source.
With the values of L t and as deter-
the experimental data indicating the vz (t) relationship obtained by experiment were plotted. Figure 9 was superimposed on figure 8 in the position which corresponded to the, best fit of the entire range of data to the theoretical curve. The ratio of the ab scissas then defined the integral scale of turbulence
(-TJT- = 2.8 seconds,
mined in the preceding paragraph, equations, lOa, lOb, and lOc were used to construct the theoretical curves shown in figures 5 and 7.
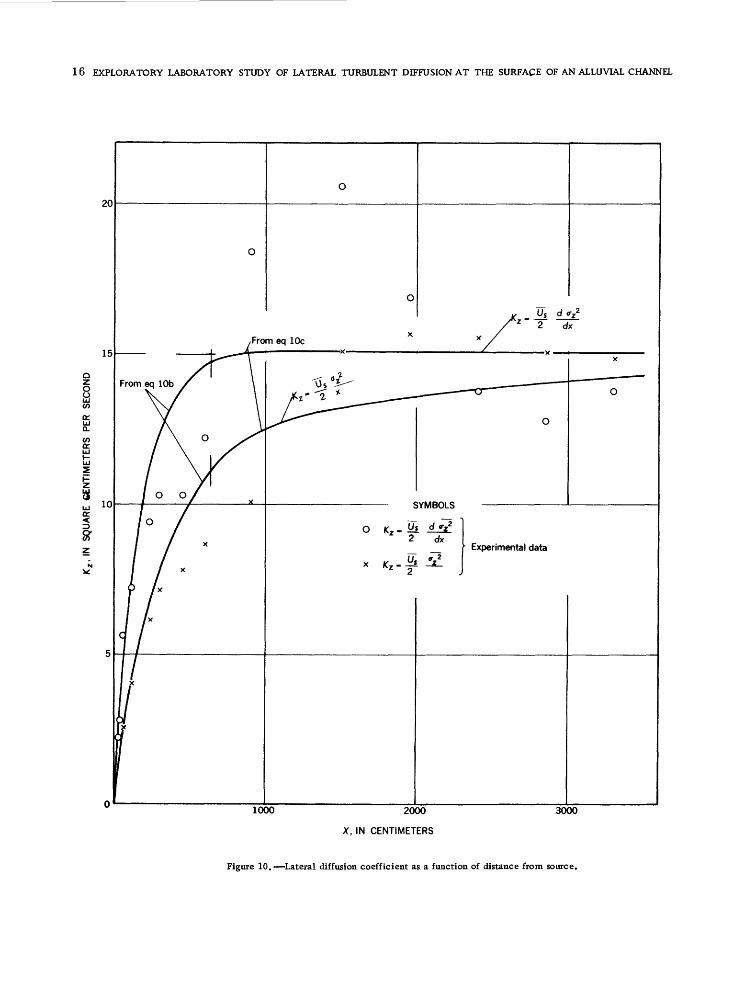
Figure 10 was plotted to indicate the man ner in which the coefficient of lateral diffu sion, K~ , approaches a constant as the dis tance from the source increases. The man ner of approach depends in part on how Kz is defined. The K z (X ) relationship is shown in figure 10 for the two alternate definitions
1K, = -r
dxand
2 TT
(11)
(lla)
12 EXPLORATORY LABORATORY STUDY OF LATERAL TURBULENT DIFFUSION AT THE SURFACE OF AN ALLUVIAL CHANNEL
c 50
u 40
|£ 30z
'N 20to
10
0
1500
Enlargement of region near source
From eq lOc /
100
= US L, = 175 cm
200 300
x, IN CENTIMETERS
SYMBOLS
x cr,2 for Af = 1,2,3,4, or 5 sec Af
500-
|-See enlargement above
1000 2000
x, IN CENTIMETERS
3000
Figure 5. Variance of lateral distribution as a function of distance downstream from source.
RESULTS 13
Figure 6. Flume bed after the experiment. Upper photograph: View of bed, upstream toward source. Lower photograph: View of bed, downstream from source.
The experimental values of Kz corresponding to equation 11 were obtained by graphical differentiation of the data plotted in figure 5. Values of K 2 corresponding to equation lla were computed directly from the data. The theoretical curves were obtained from equa tions lOb and lOc by using the computed val ues of L t = 2.8 seconds and w"2- = 5.38 square centimeters per second squared. Although the diffusion coefficient as defined inequation lla appears frequently in the literature and the coefficients defined in equations 11 and lla both approach the same limiting value as the distance from the source increases, the
definition given in equation 11 is preferable because it is consistent with the theory of diffusion by continuous movements and be cause it approaches the limiting value,
lim K2 = constant, more rapidly.
Semiempirical equations which relate the limiting value of K 2 to mean flow parameters in a broad rigid-boundary open channel have been derived by both Orlob (1961) and Elder (1959). Or lob's equation (1961), which was based on experimental observations of later al turbulent diffusion at the water surface of a laboratory flume with extreme bottom roughness is
= 0.085 1 / 3 (L t U) 4 / 3
in which
and _E = UgSe
In these equations
(12)
(13)
(14)
E = the rate of energy dissipation perunit mass of fluid in a broad openchannel,
f = the Darcy-We isbach friction factor, K = the von Karman turbulence constant _ and equals 0.4, U = the mean flow velocity, 3 = the acceleration of gravity, S e = the slope of the energy gradient,
and U s = the mean flow velocity at the water
surface.
Elder's equation (1959), which was conr firmed experimentally in a small flume with a smooth boundary for . very small flow
depths, is(15)
in which D is the mean depth of flow, and "\fr^Jp = VgDSc is the shear velocity at the
bed of the channel.
If values of the mean flow parameters de termined in this experiment are used, equa tion 12 yields K2 = 20.4 square centimeters per second, and equation 15 yields K 2 = 14.3 square centimeters per second. Both of these values of K z compare reasonably well with the value K 2 = 15.1 square centimeters per ^second determined from the data in this ex periment. Equation 12 is based on Kolmogo- roff's similarity hypothesis for small-scale turbulence components, whereas the extent of
K z = 0.23
14 EXPLORATORY LABORATORY STUDY OF LATERAL TURBULENT DIFFUSION AT THE SURFACE OF AN ALLUVIAL CHANNEL
0.05
0.04
0.03
0.02ffz
Experimental values of
100 200x, IN CENTIMETERS
A.
300
0.50
0.40
0.30
0.20
0.10 -
From eq 1
t =-^L: lim (2JL) = 2.8 sec ' 2
O Experimental values of
1000 2000x, IN CENTIMETERS
E
3000
Figure 7. Intensity and scale of turbulence as determined from limits of dispersion data. Upper diagram shows intensity and lowershows integral scale.
RESULTS 15
10
"If1 ' 0
O.K
t/L= [2J Wr^)M«)<KT,
I_______I I 1
3.10 1.0 t/L, 10
FigureS. Theoretical solution of diffusion equation with Rj^' (a) - e
60
10 toQC.LU
LU 6.5
1.0
Symbols
for Af = 1,2,3,4, or 5 sec Af
i ! i i i i i 111 i i i i 110.10 1.0 218 10
DISPERSION TIME, t, =*IUS , IN SECONDS
Figure 9. Standard deviation of lateral distribution as a function of dispersion time.
100
16 EXPLORATORY LABORATORY STUDY OF LATERAL TURBULENT DIFFUSION AT THE SURFACE OF AN ALLUVIAL CHANNEL
1000 2000
X, IN CENTIMETERS
3000
Figure 10. Lateral diffusion coefficient as a function of distance from source.
REFERENCES 17
dispersion at large times is generally be lieved to be controlled mainly by the large- scale components. Owing to this apparent contradiction, there may be conceptual ad vantages to a relationship of the form of equation 15.
APPLICATION TO PRACTICAL PROBLEMS
In order to predict the lateral diffusion pattern in a channel in which the mean flow conditions are known, the first and most im portant requirements is to estimate K 2 by using a relationship such as equation 12 or equation 15. The second requirement is to estimate X 0 (see fig. 5), which defines the point at which an extension of the straight- line portion of the Z 2 (x) curve intersects the x axis. Next, by using 2K Z /U S as a slope and X 0 as an intercept, 0,2 is established as a function of x which is valid for large dis tances from the source. If the Lagrangian correlation function is known, crz z (x) can be established for the range of values of x where K 2 varies. If the correlation function
_|o[R w > (a) - t L t is assumed, then X 0 = U s L t , K 2 is constant for x> 6 X 0 , and equations lOa and lOb may be used to predict the diffusion pattern near the source. When the numerical value of K 2 = if' 2 L t is known, application of equations lOa and lOb requires knowledge of either Lt or * w '2. At present neither Lt nor Vu/2 can be determined for alluvial channels,, except by experiment. For pre dicting dispersion at very large distances from the source, the error introduced by as suming XQ = 0 would generally be small.
CONCLUSIONS
A review of the theory of turbulent diffu sion by continuous movements as applied to open channels coupled with the analysis of experimental diffusion data for one set of flow conditions in a laboratory alluvial chan nel gives rise to the following conclusions:
1. The statistical theory of diffusion by con tinuous movements in a homogeneous tur bulence field appears to have useful appli cation in the study of lateral turbulent dif fusion in alluvial channels.
2. The scale and intensity of the lateral tur bulence components at the surface of an alluvial channel with uniform flow can be
estimated by analyzing observations of the lateral dispersion of small polyethylene particles floating on the surface.
3. The coefficient of lateral diffusion in an alluvial channel reaches a limiting con stant value, in accordance with turbulent diffusion theory, as the distance from the source is increased. Indications are that the distance required for the diffusion co efficient to become constant is quite small in comparison to the length scale of most diffusion phenomena in natural streams which are of practical interest.
4. The assumption that the Lagrangian ve locity correlation function is exponential in form appears to be a useful first approxi mation in considering turbulent diffusion in an alluvial channel. This assumption per mits an approximate prediction of the dif fusion pattern near the source.
5. It appears that it will be possible to de rive for alluvial channels a relationship between the limiting value of the lateral diffusion coefficient and mean flow, chan nel-geometry, and sediment parameters which is analogous to the semi-empirical relationships for rigid-boundary open channels derived by Orlob (1951) and Elder (1959).
REFERENCES
1. . Baldwin, L. V. and Mickelsen, W. R., 1962, Turbulent diffusion and anemometer measurements: Am. Soc. Civil Engi neers Proc., Paper 3095, v. 88, no. EM 2, p. 37-69.
2. Batchelor, G. K., 1949, Diffusion in a field of homogeneous turbulence, I. Eulerian analysis: Australian Jour. Sci. Re search, v. 2, p. 437-450.
3. Elder, J. W., 1959, The dispersion of marked fluid in turbulent shear flow: Jour. Fluid Mechanics, v. 5, no. 4, p. 544-560.
4. Frenkiel, F. N., 1953, Turbulent diffusion: Mean concentration distribution in a flow field of homogeneous turbulence: New York, Acad. Press, Advances Appl. Mechanics, v. 3, p. 61 106.
5. Hinze, J. O., 1959, Turbulence: An intro duction to its mechanism and theory: New York City, MeGraw-Hill Book Co., Inc., 586 p.
18 EXPLORATORY LABORATORY STUDY OF LATERAL TURBULENT DIFFUSION AT THE SURFACE ON AN ALLUVIAL CHANNEL
6. Ippen, A. T. and Raichlen, F., 1957, Tur bulence in civil engineering: Measure ments in free surface streams: Am. Soc. Civil Engineers Proc., Paper 1392, v. 85, no. HY5, 27 p.
7. Kalinske,A. A. and Pien, C. L., 1944, Eddy diffusion: Indus, and Eng. Chemistry, v. 36, p. 220-223.
8. Kamp'e de Feriet, J., 1939, Les fonctions aleatoires stationnaires et la theorie statistique de la turbulence homogene: Soc. Sci. de Bruxelles Annales, ser. 1, v. 59, p. 145-194.
9. Orlob, G. T., 1959, Eddy diffusion in ho mogeneous turbulence: Am. Soc. Civil Engineers Proc., Paper 2950, v. 85, no. HY9, p. 75-101.
10. Orlob, G. T., 1961, Eddy diffusion in ho mogeneous turbulence: Discussion clo sure: Am. Soc. Civil Engineers, v. 87, no. HY1, p. 137-143.
11. Scull, W. E. and Mickelsen, W. R., 1957, Flow and mixing processes in combus tion chambers: Natl. Advisory Comm. Aeronautics TR 1300, chap. 2, p. 32-82.
12. Simons, D. B., Richardson, E. V. and Al- bertson, M. L., 1961, Flume studies using medium sand (0.45 mm): U.S. Geol. Survey Water-Supply Paper 1498-A, 76 p.
13. Taylor, G. I., 1921, Diffusion by continu ous movements: London Math. Soc. Proc., A 20, p. 196-211.
INT.DUP..D.C.64-