prototype underground geologic mapping.' - nrc.gov · nr4 repository stratigraphic sequence nq...
TRANSCRIPT
INFORMATION COPY NV 4 198
PROTOTYPE UNDERGROUND GEOLOGIC MAPF ING
WBS 1.2.6.9and
WBS 1.2.6.9
.4.1.1
.4.1.2
Principal Investigator:
M. H. McKeown (USBR)
Co-Investigators:
C. C. Barton (USGS)S. C. Beason (USBR)0. M. Fairer (USCS)R. A. Thompson (USGS)
Participating Organizations:
U.S. Geological SurveyU.S. Bureau of Reclamation
.: - I I 1 4i C) (. .....) :- ::-: I I l_ : DrR Wed3TE
WMl- 11 FEIC
INFORMATION COPY REV 4 1988
DETAILED TEST PLAN
PROTOTYPE UNDERGROUND GEOLOGIC MAPPING
WBS 1.2.6.9.4.1.1and
WBS 1.2.6.9.4.1.2
Mark H. McKeownPrincipal Investigator
,A .L 5
teven C. Beason aCo-Investigator
istopher C. BartonCo-Investigator
Georgg M. FairerCo-Investigator
at
Ernest E. Glick DateCo-Investigator
Ren A. ThonM4sonCo-Investigator
Date
Richard P. SnyderTechnical Reviewer
5//2/Date DateLarry R.1 Hayes
Chief, Branch of NNWSI
I 1.1-i

I At}{} wk4Wll~l~h~I'
1.1-H j
INFd'AiMA#Ibh it,? ta NOV 4 198b
CONTENTS
Page
Approval Sheet .. .......... ,.,. 1.1-i
1.0 INTRODUCTION .1.1-1
1.1 Purpose . 1.1-11.2 Scope .1.1-11.3 Objectives .1.1-71.4 Present Status of Prototype Tests .1.1-71.5 Schedule .1.1-10
2.0 EQUIPMENT, TESTING, AND DELIVERABLES SUMVARY............. 1.1-12
2.1 Primary ................. 1.1-122.2 Secondary .1.1-16
3.0 DESCRIPTION OF WORK .................. : . . 1.1-17
3.1 Management .. 1-173.2 Experimental Configuration .1.1-173.3 Underground Test Methods .1.1-293.4 Data Analysis . 1.1-32
4.0 QUALITY ASSURANCE LEVEL .1.1-33
5.0 OPERATIONS .1.1-33
5.1 List of Activities .1.1-335.2 Changes in Experimental Procedures .1.1-33
6.0 DATA ACQUISITION SYSTEM .................................. 1.1-34
6.1 Shaft Mapping .1.1-346.2 Drift Mapping .1.1-34
7.0 PERSONNEL QUALIFICATIONS .1.1-35
8.0 NONCONFORMANCE ACTIONS .1.1-35
9.0 DOCUMENTATION .1.1-35
9.1 Field Notebooks .1.1-359.2 Analysis Notebooks................................. 1.1-359.3 Photographs .............. 1.1-359.4 Data Storage .1.1-35
II.1 -iii
NOV 4 1''
10.0 SAFETY ......................... . 1.1-35
11.0 MILESTONES AND REPORTS . 1.1-36
12.0 REFERENCES ......................... 1.1-36
APPENDIX--MAJOR EQUIPMENT LIST FOR PHOTOGRAMMETRICGEOLOGIC MAPPING . 1.1-39
�huiv

NOV 4 1988
1.0 INTRODUCTION
Prototype testing of underground geologic mapping methods isdesigned to test the equipment and methods used to address the needs ofthe Nevada Nuclear Waste Storage Investigations (NNWSI) ProjectPerformance Allocation and the NNWSI Issues and Information Needs. Theseissues and needs require that the geologic character of the repository bedetermined. Also, they require that those geologic factors be determinedthat contribute to prediction of the hydrologic behavior and tectonicstability of the repository for a period of 10,000 yr. Principally, thefractures (joints and faults) and the ithologic sequence (stratigraphy)need to be determined for geologic characterization of the repositoryblock. The fracture network of the repository block must be determinedto predict hydrologic behavior and mechanical stability. Tectonicstability can be determined, in part, by study of the nature of faultsand by measurement of the age of movement on faults.
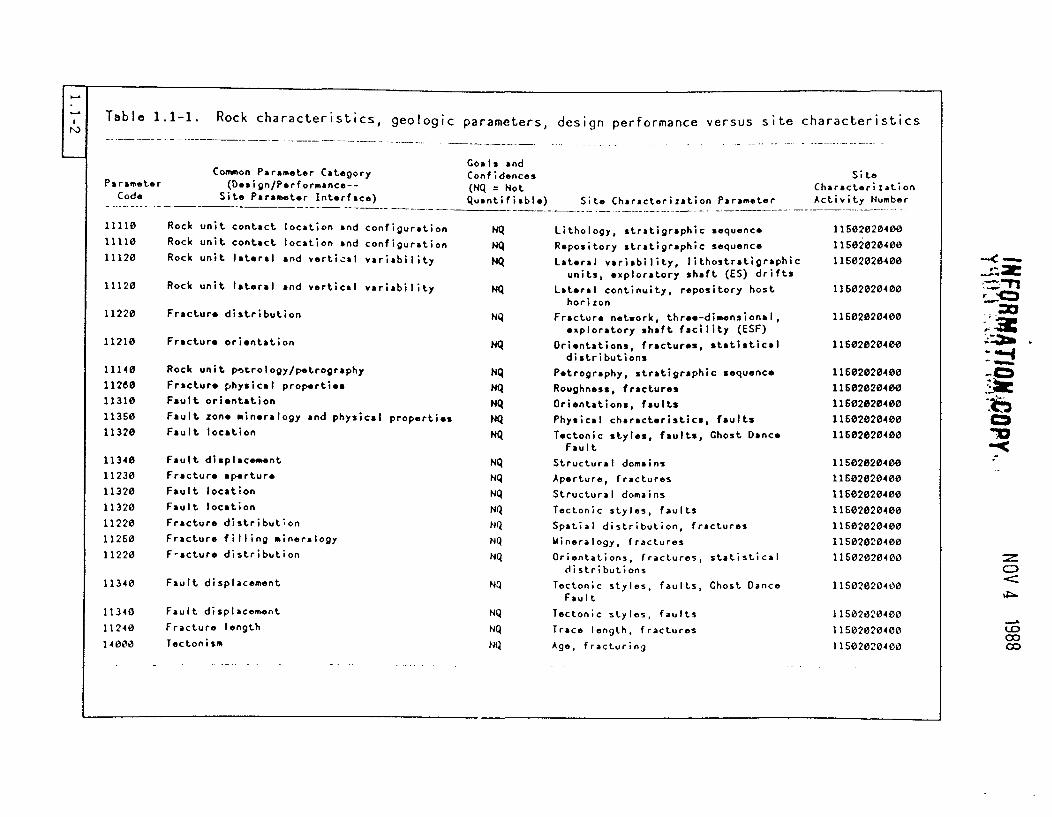
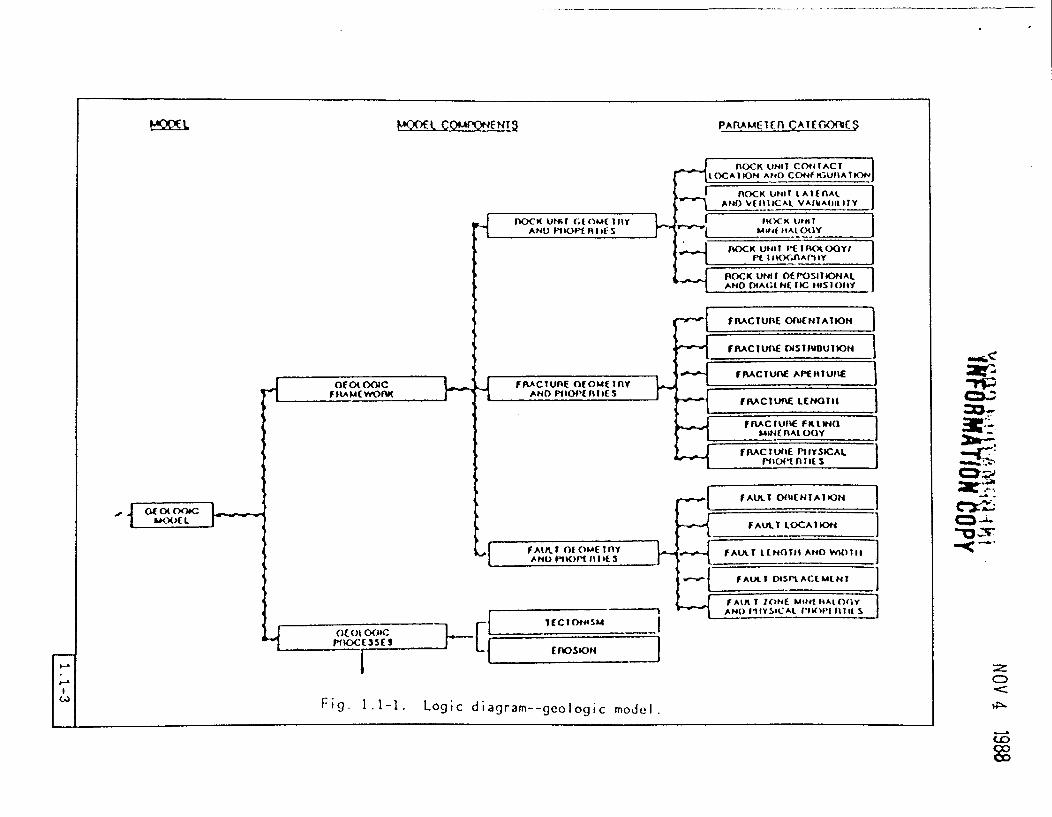
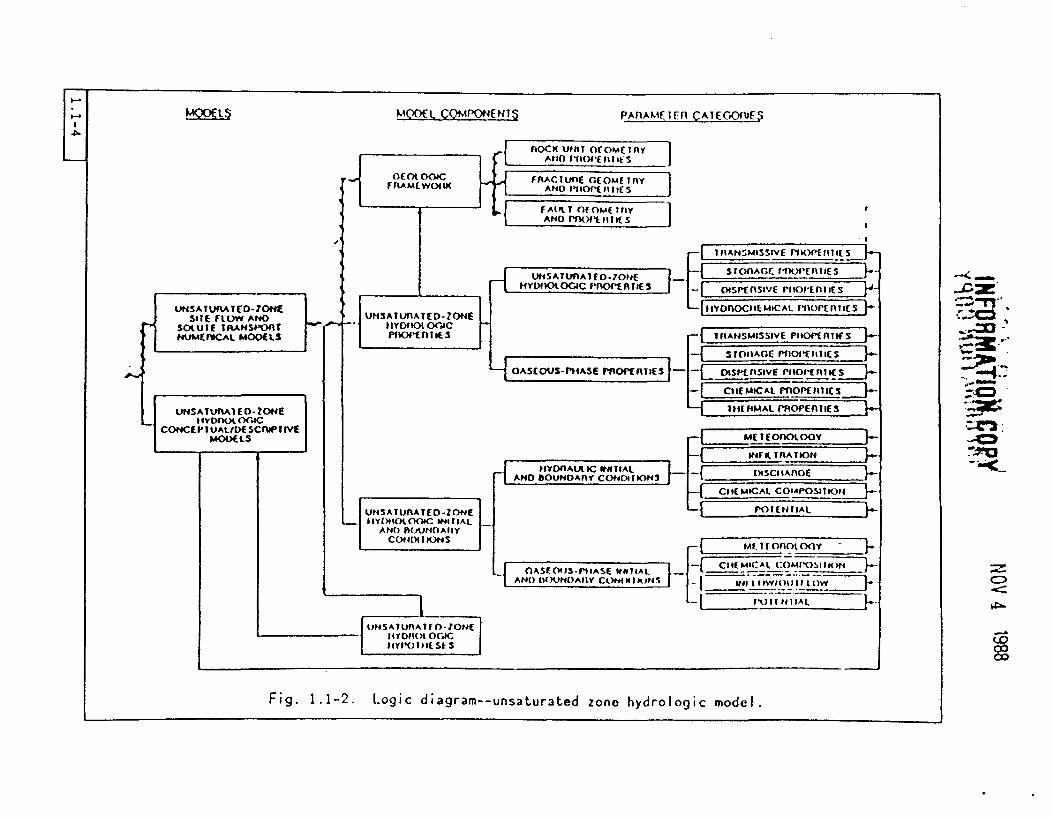
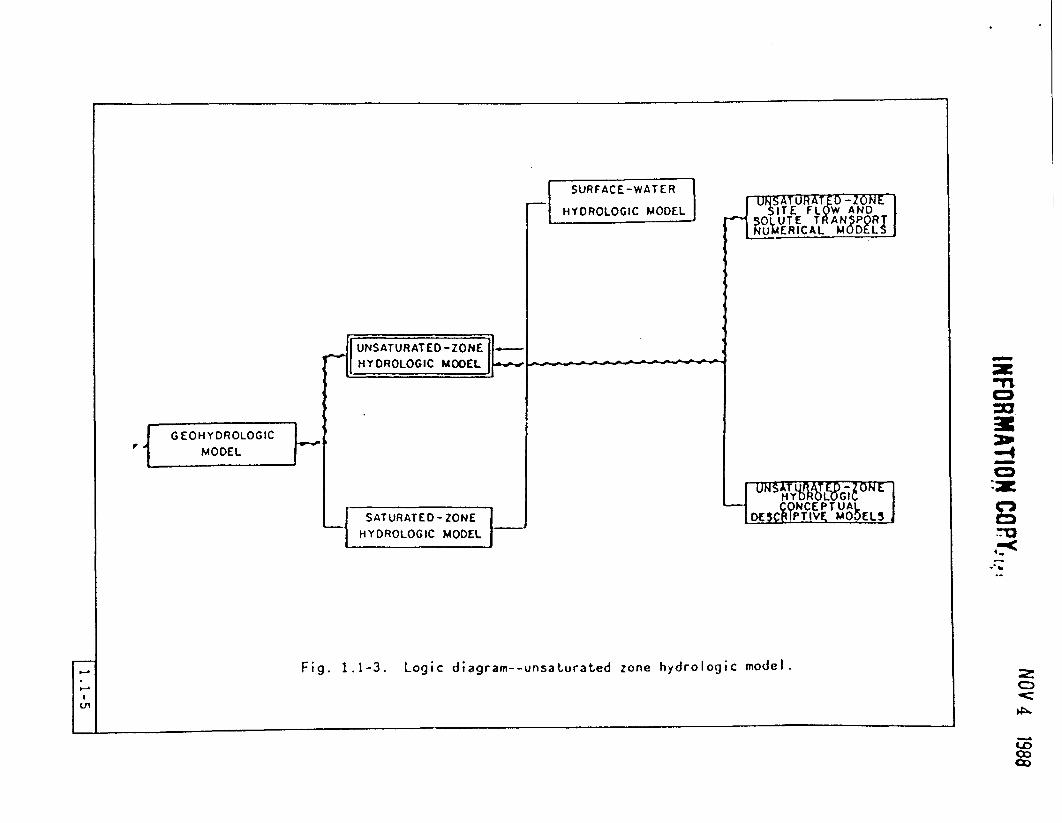
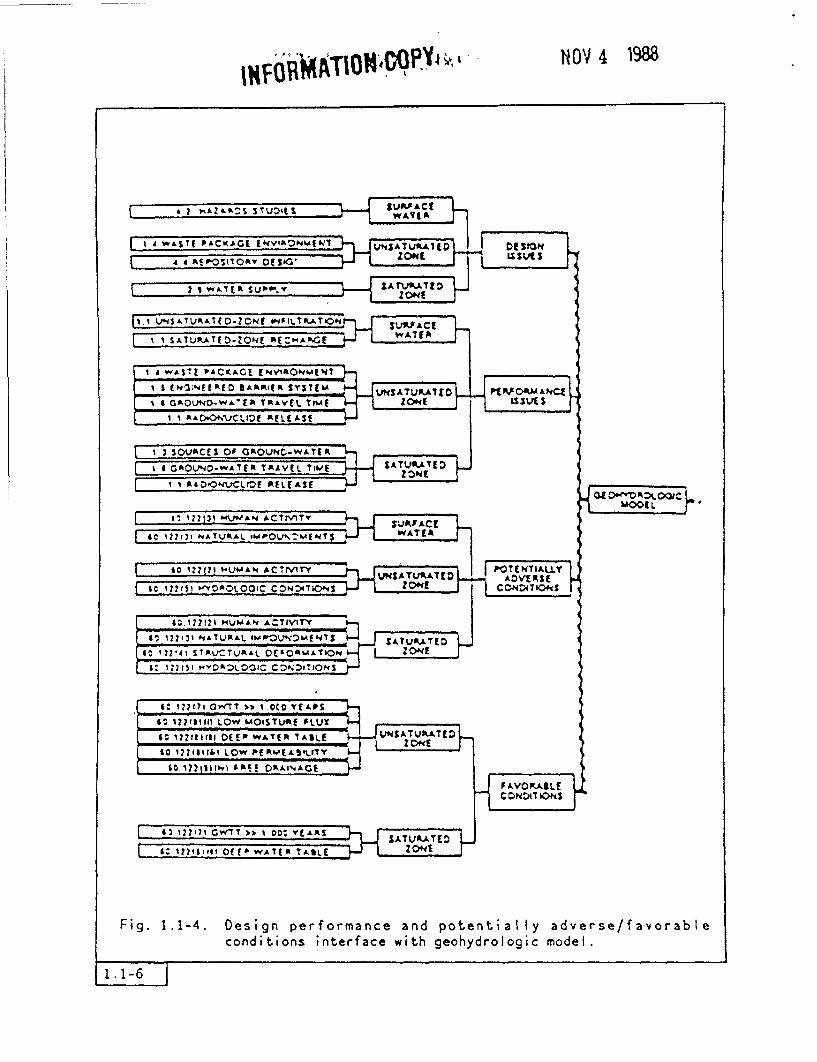
Experimental procedures or equipment tested during prototypetesting will be used to finalize procedures and equipment to be used inthe underground geologic mapping project, Site Characterization ActivityNumber 11502020400. Table 1.1-1 provides a list of all performance anddesign requests for site data on physical rock properties and forinformation related to the geologic framework and geologic processes atthe site. Figure 1.1-1 provides a logic diagram for the derivation ofthe geologic model (diagonal hatching on line). Figure 1.1-2 provides alogic diagram relating the geologic framework to the geohydrologic model,whose logic is shown by Fig. 1.1-3. Finally, Fig. 1.1-4 shows theinterface of the design performance and potentially adverse/favorableconditions with the geohydrologic model. These data needs were derived byapplying performance allocation to the performance and design issuesdescribed in Sections 8.3.2 through 8.3.5 of the Site CharacterizationPlan (SCP).
1.1 Purpose
The purpose of this report is to describe the experimentalprocedures or prototype tests that will be used by the U.S. Bureau ofReclamation (USBR) and the U.S. Geological Survey (USCS) to testunderground geologic mapping methods. Because experimental proceduresfor the shaft (WBS 1.2.6.9.4.1.1) and for the drifts (WBS 1.2.6.9.4.1.2)are similar, descriptions of the procedures for both are combined in thisdocument.
1.1 Scope
The scope of this report is limited by the nature of prototypetesting and by the present stage of the testing. Therefore, this reportis limited to a description of the next step in prototype testing becauseonly the next step in testing can be predicted at any time. Becauseprototype testing drift and shaft mapping methods were begun before this
1.1-1
[ T
1�Table 1.1-1. Rock characteristics, geologic parameters, design performance versus site characteristics
Coats andCommon Parameter Category Confidences Sito
Parameter (Design/Performance-- (NQ = Not CharacterizationCode Site Parameter Interface) Quantifiable) Site Characterization Parameter Activity Number
11110 Rock unit contact location and configuration
11110 Rock unit contact location and configuration
11120 Rock unit lateral and vertical variability
11120 Rock unit lateral and vertical variability
11220 Fractur, distribution
11210 Fracture orientation
11140 Rock unit prology/petrography
11280 Fracture physical properties
11310 Fault orientation
11350 Fault zone mineralogy and physical properties
11320 Fault location
11340 Fault displacement
11230 Fracture aperture
11320 Fault location
11320 Fault location
11220 Fracture distribution
11250 Fracture filling mineralogy
11220 F-acture distribution
NQ Lithology, stratigraphic sequence
Nr4 Repository stratigraphic sequence
NQ Lateral variability, lithostratigraphicunits, exploratory shaft (ES) drifts
NQ Lateral continuity, repository hosthorizon
NQ Fracture network, three-dimensional,exploratory shaft facility (ESF)
NQ Orientations, fractures, statisticaldistributions
NQ Petrography, stratigraphic sequence
NQ Roughness, fractures
NQ Orientations, faults
NQ Physical characteristics, faults
NQ Tectonic styles, faults, Ghost DanceFault
NQ Structural domains
NQ Aperture, fractures
NQ Structural domains
NQ Tectonic styles, faults
NQ Spatial distribution, fractures
NQ Mineralogy, fractures
NQ Orientations, fractures, statisticaldistributions
NQ Tectonic styles, faults, Ghost DanceFault
NQ Tectonic styles, faults
NQ Trace length, fractures
Nil Age, fracturing
11602020400
115602020400
11502020400
11602020400
11502020400
11502020400
11502020400
11502020400
11602020400
11502020400
11502020400
11502020400
11502020400
11502020400
11602020400
11602020400
11502020400
11502020400
11s0220400
11502020400
11502020400
11502020400
I_
. 3C;
--_q
.iac'b
11340 Fault displacement
11340
11240
14000
Fault displacement
Fracture length
Tectonis
MOOE CO"NNTa PARAMEicn CATMG)RS
.-
AN >CKOI I I8 i
:, Ai"D~~~~~~~~~~~~~~~~~~~~e~~~~~finllf5 r~~~~~~~~~~~~~~~~~~~~
nOCK UNT CONIACTLOCA 1ION AND CON PGUFA I�
fnOCK UNI r t A i t nAII1~A~i1IC A VAIWAtIt ll7Y
I flOCK UNIT|'j Mt& IAt OtlY
__ lOCK uNI I iOtOOYIIt I I K nl A tIY
POCK UNIT fi(POSITiONALANO tHAG; NE I iC IS I OIY
FUiRACTUniE Of)EN1ATION-
FRACTUIE DIS1lIBJTION
MFIACTUnM APtIULnE
1 Of(O OOCCFHRAMEWOrb __F_ FrFACtUFE OfOM(IflY
ANO PIKO'A 1 I I SFAACItuff LEMOTif
l-
fnAcIufE FIII4Q1,t fl FAt OOY
-
FAACTUI PlIYSK:AI,-"En ICt S
.<
:.
C_
cz'.i.
0v- <X~i. t. _
1.4
FAUtl OfEiNlAIDON
FAutLT LOCAIK
FAtAT IttGOTIH At4O W1111F A I (t1 omc 1 nYAMEt) HiDC It 11I 5 hi
[ - ,
FAULT OISMtACEMEM -
FAtlt ZONE AINE lAt 0lOYAN) IYSCAL (1901 WII t s II
oc CE(t f)C - I
1ECO0f#SM
t ErOSIoF
_P
(IFig. 1.1-1. Logic diagram--geologic model.
ILA
.,D(L COMAPONENTS PAnAMETn CATEGOPOF5
TifOCC lUNIT OOfM>lTRt
_ f tlOt OC _ G E~i'CenO , f nY -
Ut4SAFftA~o-Z04E %nSAURAEW2O~tE HOYn I I I IC S
SE loff AO I Fly
SlUTE IRATSPO-Zr I_. II IIYI O
NUMEDUCAL M0OELS ~~~~~~~~~~~~~~~~~~~~~~I ANS MISSIVE PXEIIOAI S
UNS A Tun~jf0_0-7E S0FIA6r PIIOf'fIIS
.OHytIA0tOGC PfnOPAIES -| vtS1 flSIvEPf l0 l__S
SIIE_____TED-ZOE _ -Y~nOCSE MICAL IoIPtIFITES j-
UtISATUVIAIED-Z(ff- ISIEPAL- PfAOPDIlIES
gyooTE TAAwon )LYIII.G#MC ODEL |(LS n I |-- o1JANSSVE rFo__nT_____
-*Yf IPA . ic SIAt PnoE 6<,
-lM
_ tATUATED-ZONE [ - POtEAtIlTIIYtlOODC< INIISAL |_
C 0*401 9DOS IIYDCOCCOPIUALNDISYOUNkM fi fAif;OnOt}-
| tIN SAT ItrnA t1r1n0- lONE | _
sr~~~~~flextfYnA~ ICK LIN $A (SD~n
t YI O tO G CStS |L
IIYD'OJDI( St S ~ ~ ~ ~ ~ CI(ICL OAPISIK~
Fig. 1.1-2. Logic diagram--unsaturated zone hydrologic model.
SURFACE-WATER
HYDROLOGIC MODEL
I I~~~~~~~~~~.
_I UNSATURATED-ZONE l HYDROLOGIC MODEL
UNS~URA~'lONESTE FLOW AND~ OLUTE TRANSPOR TERICAMOE
~~~L GI
|H Y CEPTUAI_ O PT VPT UA
DE5 tITIE MODELS,
t � _
GEOHYDROLOGIC_ tMODEL
wn
4
g4-
3310__4-I SATURATED - ZONE
HYDROLOGIC MODEL. .
U'
Fig. 1.1-3. Logic diagram--unsaturated zone hydrologic model.
II
~~~T1ON4O~~~~WY' I1 N OV 4 198
I 'WASTE PACKAGE EVIA DEt I IJ$AUoA1r
ti IOVACES OF O~~OvNCLIPJACE
qI &cf.ATV~AfA.O ONEv W AT'LED
- ---- ZONE I A&D.ONVCLOE IkELES
i1 2717 WVA ACfTY UWAJPA~t
IC 2?r5t Wv6OLtOOC COP4D4TIOAES2 20.ZON
40 I2241 SIV(TV ALOE10V r 0(& - ON
61221%1611I LOW MOISTURAE LVlT
60 i??lIra(I DEP WATRf 1AILE tPSA ONAE£0 177II&I LOW Pfft0[A~j"FlVZYt
"0+^Mk
I nTENTIALLY
-ADcIER'E
FAVOPLA4LEdCONDII*NOS-
I -6iz t2?i CrwTT ),.i 0- YEfAAS
f 9:M41161Off-WAYft ASLE
7'Lj SATVKATED:P j zooNt
Fig. 1.1-4. Design performance and potentially adverse/favorableconditions interface with geohydrologic model.
INFORMATION -COPNOV 4 1988
report was ritten, earlier stages of protrtype testing that have alreadybeen completed will be described enly if appropriate. Ceologicphotogrammetric mapping feasibility studies are discussed in detail.
1.3 Objectives
The objectives of prototype testing the underground geologicmapping equipment and methods are
test the specific mapping methods to be used in the shaft anddrifts, which will provide the basis for describing the geologicframework of the exploratory shaft facility (ESF) and provide partof the basis for extrapolating geologic conditions from the ESFthrough the entire repository block,
* test the specific mapping methods to be used in the drifts, whichwill provide the geologic data to characterize the ESF,
* test the data analysis methods to be used for both shaft and driftgeologic data, and
* determine the role of each subcontractor needed by the geologiststo accomplish the mapping and data analysis goals.
1.4 Present Status of Prototype Tests
Work has begun or has been completed on several aspects of theprototype testing, including fabrication of surveying devices andfracture measurement equipment, development of efficient and specializedsurveying techniques, feasibility investigation of close-rangephotogrammetric techniques, development of conventional mappingtechniques, development of a cost/benefit comparison, and development ofdata analysis software.
The following is a description of the status of each aspect.
1.4.1 Fabrication of Surveying Devices and Fracture Measurement
Fabrication is either complete or under way for the specializedsurveying equipment that will be used in ccrjunction with a commerciallyavai lable laser theodolite to perform much of the surveying and orientingfunctions for mapping. Laser theodolites are presently in standard usein C-tunnel at Rainier Mesa at the Nevada Test Site (NTS). Thespecialized survey equipment has been designed to reduce greatly theamount of time required to set up the camera rail and to locate thep'iotogrammetric survey targets for stereophotography control. Inaddition, items such as a gyroscopic geologic compass, a right-angleprism goniometer, and a strike rail goniometer are being constructed.
l .1-7
INFORMATION COPY 4 t 0 ' NOV 4 1988
1.4.2 Development of Efficient and Specialized Surveying echniques
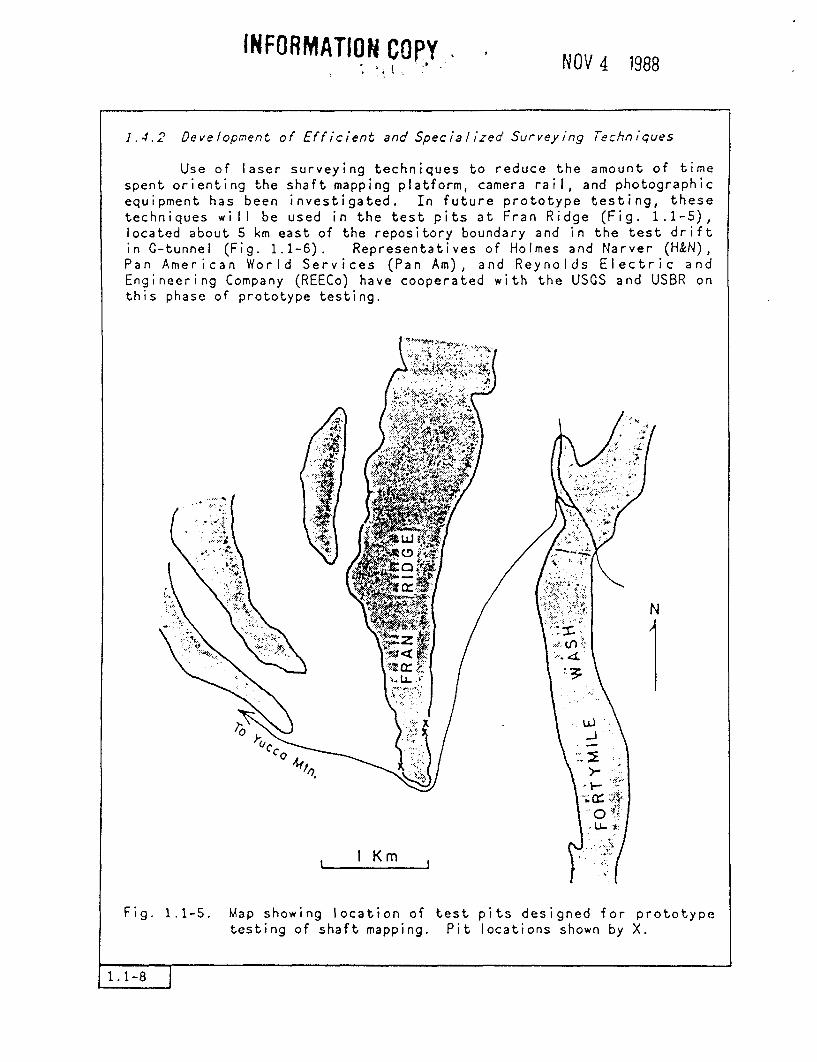
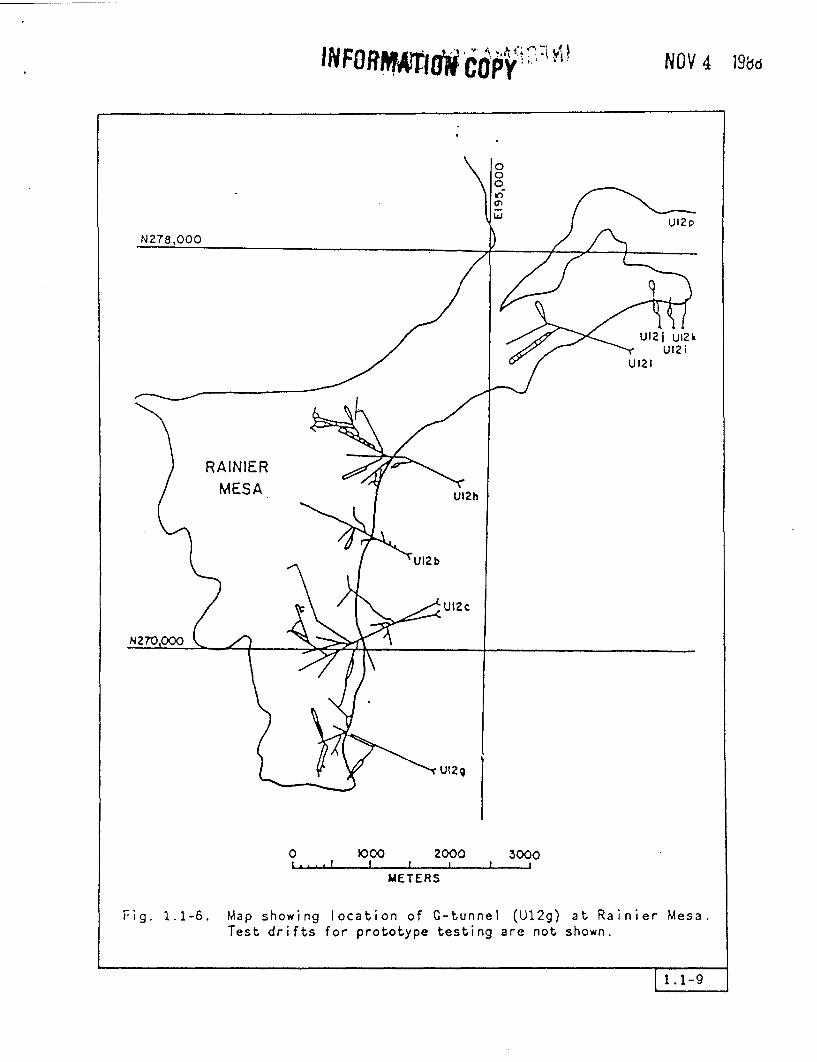
Use of laser surveying techniques to reduce the amount of timespent orienting the shaft mapping platform, camera rail, and photographicequipment has been investigated. In future prototype testing, thesetechniques will be used in the test pits at Fran Ridge (Fig. 1.1-5),located about S km east of the repository boundary and in the test driftin C-tunnel (Fig. 1.1-6). Representatives of Holmes and Narver (H&N),Pan American World Services (Pan Am), and Reynolds Electric andEngineering Company (REECo) have cooperated with the USGS and USBR onthis phase of prototype testing.
Fig. 1.1-5. Map showing location of test pits designed for prototypetesting of shaft mapping. Pit locations shown by X.
INFO R opay OW --COPY - It NOV 4 l98t
U121 U2kUr2 i
u12
RAINIERMESA
U12g
0 1000I . . .. I
2000I I
3000I I
METERS
Fig. 1.1-6. Map showing location of C-tunnel (Ul2g) at Rainier Mesa.Test drifts for prototype testing are not shown.
(1.1-9
1.4.3 Investigation and Development of Close-Range CeologicPho togramme tr ic Techn iques
Close-range photogrammetric geologic mapping has been successfullyused in Europe (Dueholm, 1981; Dueholm et al., 1977; Pillmore et al.,1980). Also, USGS and USBR have done considerable work investigating theuse of close-range photogrammetry as the primary method for mapping offractures and other geologic features exposed on shaft and drift walls inthe exploratory shaft (ES) (Curry, 1986; Dueholm, 1979; Pllmore, 1959;Pillmore et al., 1980).
The USGS and USBR have contracted studies as part of investigatingthe feasibility of close-range geologic photogrammetry in the ES (Curry,1986; included in the Appendix). Vexcel Corporation will be doing anadditional study to further confirm and refine previous work. Items tobe accomplished include production of fracture maps of test pits and C-tunnel sections and evaluation of the relationship between survey controland mapping accuracy.
1.4.4 Back-up MUapping Techniques
An alternate or back-up method of underground geologic mappingwill employ more conventional methods (Brown, 1981; Cregger, 1986;Hatheway, 1982; U.S. Army, 1970). These conventional methods willinclude mapping from a photographic mosaic (Goodman, 1976), augmented bymeasurement and sketching of geologic features on the photographs. Aback-up method is needed to ensure against survey or photographic systemfailure. Minor pro lems, such as analytical plotter failure, computerfailure, or machine malfunction, will result only in temporary delay ofprocessing data but no actual loss. Conventional methods will beprototype tested because they must be tailored to specific mapping needsH.-eated by the conditions in the shaft and drifts and to the data needsof the NNWSI Project. This conventional mapping will be used forcomparison with the photogrammetric mapping method.
1.4.5 Time Study
Time study will compare the time needed for using thephotogrammetric mapping method with the time needed for more conventionalmapping methods.
1.5 Schedule
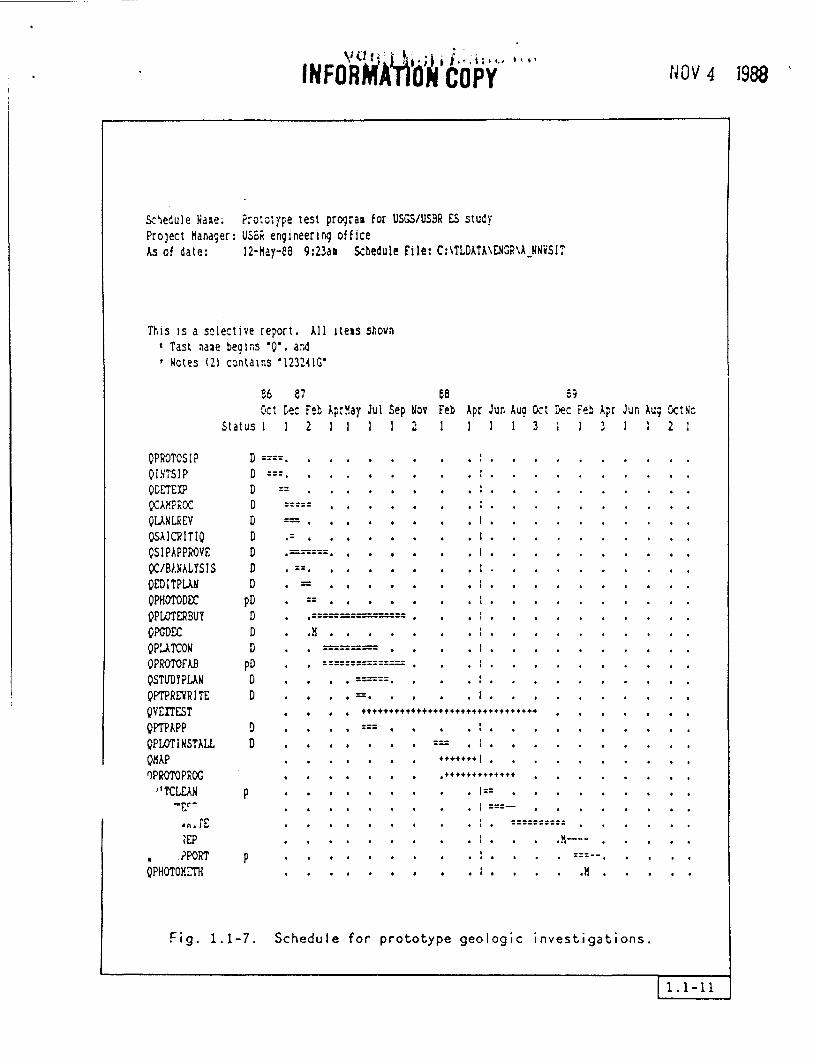
Figure 1.1-7 shows the schedule for prototype geologicinvestigations. Figure 1.1-8 is the key to the chart abbreviations. Thestarting date is an estimated starting time only. Schedule dates andtime intervals will have to be adjusted as prototype testing dictates.The relative time intervals and relationships should remain constant withdate adjustments as appropriate for the actual starting date.
1.1-10
INFRM oyi i I''4 * NOV 4 1988
Schedule Namei Protctype test program for USGS/USBR ES studyPro)ect Manager: US3K engineering officeAs of date: 12-May-88 9:23an Schedule File: C:\TLDATA\ENGR\ANNVSIT
This is a slective report. All tems sovnt Tast naae begins Q, andI Notes (2) contains 123241G'
86 87Oct ec Feb prMay Jul Sep Noy
Status 1 2 1 1 1 1 2
88 :9Feb Apr Jun Aua Oct Dec Feq Apr Jun Aug Oct:N1 1 11 3 I 1 3 1 1 2 1
OPROTOSIP0INTSIPQDETEXPQAKPROCQLANLREVOSAICRITITQSIPAPPROVEQC/B).NALYSISQEDITPLANQPHOTODECQPLOTERBUTQPGDECQP'ATCONQPROTOEA3QSTUDYPL1NQPTPREW RITEQVErTESTQPTPIPPQPLOTINSTALLQMAPOPROTOPROG)'TCLEAR
.EP
?PORTQpHOTOXCrx
D.
.D.… … … … . . . .
D.-. .. ... . . . ... .
D-.. .. ... . fi.
D --= : . . . . 1:. .
D = . . . . . . . . I
D .
D.
upD - . . . . . . .. .
D .- . . . . . . . .
pD. .= .
D . .8 . . . . . . . ' . .
D .. .. -_
pD ~~~~~~~~~~~~ ~~~~~~~~. .======
G .. . . = - -==. . .~, . : I
p.. . .:_=a .
P + X X X * . . ~ ~~~~~~~~~~~~~. . 1:.M-
M.
. .
. .
Fig. 1.1-7. Schedule for prototype geologic investigations.
[11.1-11
INFORMATIqN.~.PyoV9 f 0 lIt js;-§- ) ? k
10V 4 1988
s15 ! a seect:'e rcr- 41 ezs swn'aTat ale e:irs "*. ar.
', Nces ) ccnai .5 '!241'
ask
QIN7S~PQ I!:-, i i ?cc!SIOCAK-PPO;
OLANLREV
CS1PAPRCvEQC/BAKALtSISOED I TPLANQPHOODECgOr LTLi
OPLATCON
OS7UDYPLAND PT -1EV R I TEQVEX7ESTQPT PAPPOPLOT INSTALLQFA?DPROMP2CXQPILANQPLATTESTQHAMR I ,EOSHArTPEPVNNSUPPORTOPHTMm
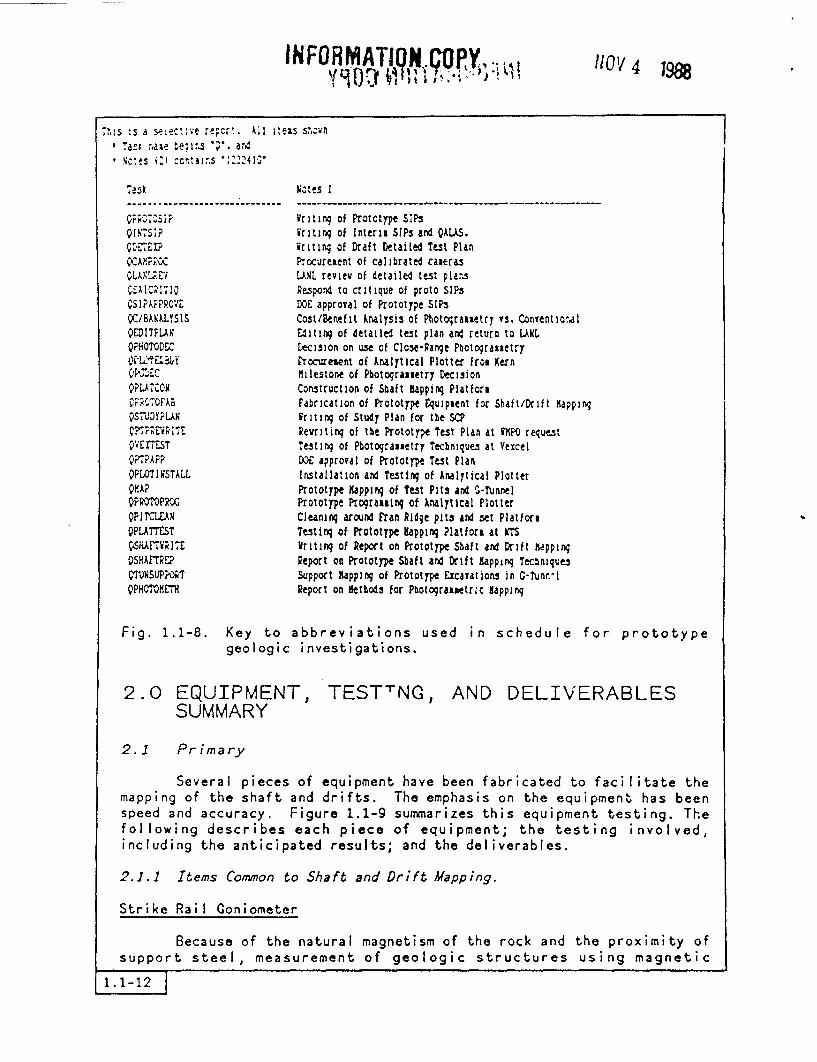
Fig. 1.1-8.
kites I
Writing of Prototype SIPsVriting of Interis SiPs and ALS.iriting of Draft Detailed Test PlanProcurement of calibrated cameras.ANL review of detailed test pla sRespond to critique of proto SPsDOE approval of Prototype SPsCost/Benefit nalysis of Potogratietry vs. ConventionalEditing of detailed test plan and return to LAKLDecision on use of Close-Range PctograssetryProcuresent of Analytical Plotter from KernMilestone of Potogramuetry DecisionConstruction of Shaft apping PlatformFabrication of Prototype Equipment for Shaft/Drift appingWriting of Study Plan for te SCPRevritinq of the Prototype Test Plan at fMP0 requestTesting of Photograssetry Techniques at VexcelDOE approval of Prototype Test PlanInstallation and Testing of Analytical PlotterPrototype Mapping of est Pits and -tunrelPrototype Programing of nalytical PlotterCleaning around Fran Ridge pits and set PlatformTesting of Prototype apping Platform at ITSWriting of Report on Prototype Shaft and Drift Ma.ppingReport on Prototype Shaft and Drift apping TechniquesSupport Mapping of Prototype xcavations in G-?unr. lReport on Methods for Potograimetric apping
Key to abbreviations used in schedule for prototypegeologic investigations.
V
2.0 EQUIPMENT,SUMMARY
TEST TNG, AND DELIVERABLES
2.1 Pr imary
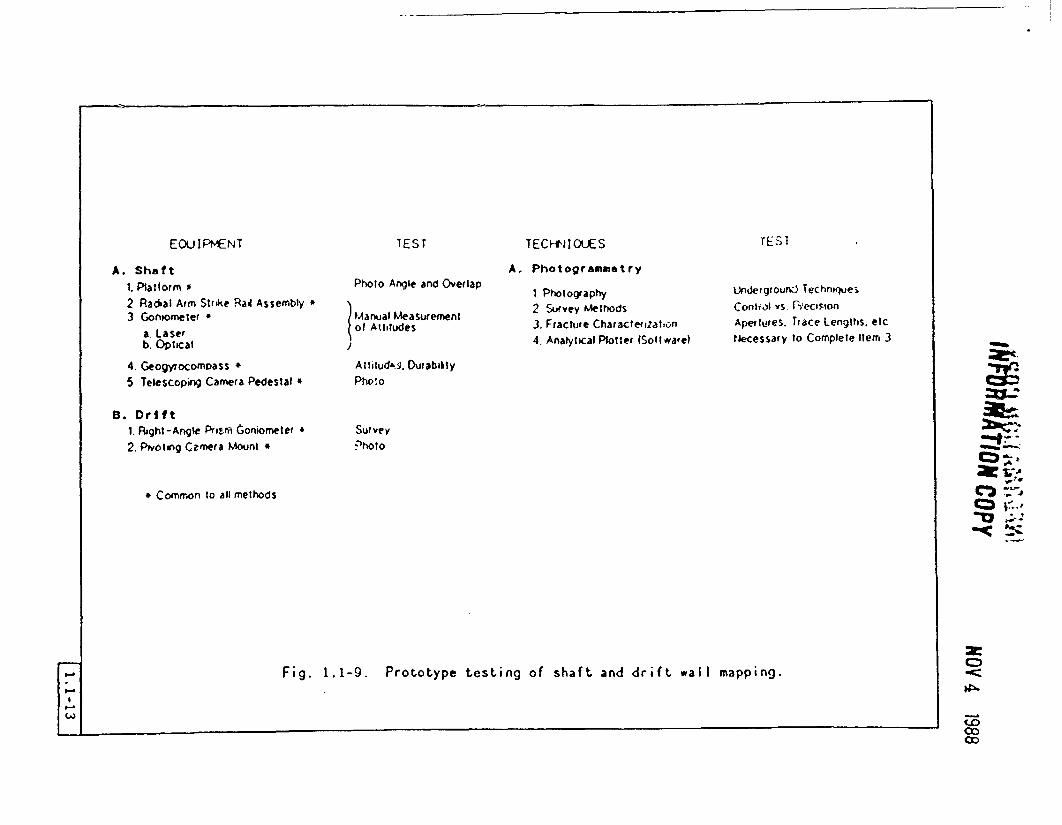
Several pieces of equipment have been fabricated to facilitate themapping of the shaft and drifts. The emphasis on the equipment has beenspeed and accuracy. Figure 1.1-9 summarizes this equipment testing. Thefollowing describes each piece of equipment; the testing involved,including the anticipated results; and the deliverables.
2.1.1 Items Common to Shaft and Drift Mapping.
Strike Rail Coniometer
Because of the natural magnetism of the rock and the proximity ofsupport steel, measurement of geologic structures using magnetic
1.1-12
INFORMAT\Q C P Nov ,
compasses is not possible. This problem is overcome by referencing eangular aspects of the geologic structures to a known bearing obtained bysurveying. The goniometer relates the structure angles to a reference orstrike rail.
Testing of the device will include field measurement of actualgeologic structures with the goniometer and comparing the resultsobtained with other methods. An instrument accuracy of ±10 or better isexpected.
The deliverable of this test will be a goniometer of sufficientaccuracy to measure angular relationships for geologic mapping in the ES.If the photogrammetric technique performs as expected, this instrumentwill be used only for backup procedures.
Ceogyrocompass
Certain situations, such as behind the platform supports andcertain orientations and locations of geologic structures, make using thegoniometer difficult or impossible. A hand-held device such as agyrocompass must be available for use in these instances.
Testing of the device will include feld measurement of actualgeologic structures with the geogyrocompass and comparison of the resultsobtained with those obtained using othcr methods. Compass drift ratesand resetting times will also be determined. An accuracy of 2' and areset interval of 10 min is expected.
The deliverable of this test will be a gyrocompass (Bruntoncompass equivalent) with sufficient accuracy to measure angularrelationships for geologic mapping in the ES.
2.1.2 Items That Apply to Shaft Mapping Only.
Radial Arin Strike Rail
A reference rail is necessary to use a goniomcter for angularmeasurement. An accurate, movable, and easily transportable rail isnecessary for use on the lower deck of the Calloway during shaft sinking.
Testing of the device will include field measurement of actualgeologic structures with the radial arm strike rail assembly (andgoniometer) and comparing the results obtained with other methods. Anaccuracy f 2° or better is expected.
The deliverable of this test will be (in conjunction with thegoniometer) a rapid, accurate, and easily transportable strike rail withsufficient accuracy to measure angular relationships for geologic mappingin the ES. As with the strike rail goniometer, if the photogrammetricmethod performs as expected, this item will serve only in a back-upcapacity.
1.1-14
EOU I PVE4T IEST TECI-tJIOUE S TES--T
A. Shaft1. Platform S
2 Radial Arm Strike Rai Assembly *3 Gonometer
a. Laserb. Optical
4. Geogyrocomoass *
5 Telescoping Canera Pedestal *
B. Drift1. Pght-Angle Prismni onioreter a2 Pvoting Cnera Mount *
Photo Angle and Overlap
M Manual Measurementol Attitudes
J
AtlitudAA. DurabiklyPhoto
Survey
phoIo
A, Photogrammetry
1 Photography2 Survey Methods3. Fracture Characterization4. Analytical Plotter (Sottw'are)
Undeigtrou) Technsques
Conlfol vs. PVeci5ion
Apertures. Trace Lenglhs. etcNJecessafy to Complete Item 3
O;WM-&11
2CV
_t_-'o
__.
'U ,,4 C -k'
* Common to all methods
IiI-.
_ Fig. 1.1-9. Prototype testing of shaft and drift wall mapping.
I I C-

Y*iE NOV4 1988
Y~lt' 2" 'i |r ^ t' 8 'i ataNOV 4 19INFORMATION cOPY
Telescoping Camera Pedestal
A means of mounting, spatially locating, and indexing a camera forstereophotography is necessary for geologic mapping in the shaft. Themount must be transportable, accurate, and fast and must utilize as muchof the radial arm strike rail assembly as possible. The radial armstrike rail assembly should share as much structure as possible forconvenience and because the shared structure pedestal needs to besurveyed only once. The pedestal must index the camera every 600horizontally and raise and lower the camera vertically to get thenecessary overlap for stereo coverage.
The testing of the device will include photography of geologicfeatures, utilizing all capabilities of the telescoping camera pedestaland using these photographs with the analytical plotter to construct mapsand photomosaics. The criteria for evaluation will be whether thepedestal is durable, accurately holds and locates the camera, is stable,operates quickly, and is compatible with the radial arm strike railassembly. Photograph quality will be a major evaluation item.
The deliverable of this test will be a rapid, accurate, and easilytransportable camera mount with sufficient accuracy and stability forstereophotography for geologic mapping in the ES.
Shaft Mapping Platform
Evaluation and testing of the above-described equipment, alone andas a system, requires a stable platform similar to the lower deck of aCalloway located in a geologic environment similar to that of the ES.The prototype shaft-mapping platform is not intended to be used in theES. The platform is designed and intended to be a mockup or simulatedlower deck of a Calloway.
Testing of the platform will include placing the platform in theFran Ridge test pits and performing the four tests described above. Inadditior., the camera pedestal centering and leveling capabilities andplatform photographic aperture will be tested. Centering should easilybe attainable within 1 cm, leveling within 1, and the platform apertureshould allow sufficient photograph overlap between rounds.
The deliverable of this test will be (in conjunction with the fouritems described above) a rapid, accurate, and stable mapping unit forgeologic mapping in the ES. In addition, the test should demonstrateequipment compatibility with the contractor's lower deck operations.
2.1.3 Items That Apply to Drift Mapping Only.
Right-Angle Prism oniometer (Laser Deflectometer)
A rapid, accurate means of locating survey points in the drifts isnecessary for accurate geologic mapping and for keeping the mapping timeto a minimum. The instrument will sit on the previously surveyed camera
INFORMATION COPY NOV 4 1988
rail and, using the beam from the laser theodolite, will locate any pointon the drift walls in three dimensions.
Testing of the right-angle prism goniometer will include surveyingvarious points in various locations in C-tunnel and comparing the resultswith those of other survey methods. Accuracy should be easily within1 cm.
The deliverable of this test will be an instrument for surveyingpoints for geologic mapping rapidly and with sufficient accuracy for usein the ES.
Pivoting Camera Mount
A means of mounting, spatially locating, and indexing a camera forstereophotography is necessary for geologic mapping in the drifts. Themount must be transportable, accurate, and fast and must use the strikerail for location and support. The mount must index the camera every 60°vertically and move along the strike rail to get the necessary overlapfor stereo coverage.
Testing of the device will include photography of geologicfeatures using all capabilities of the pivoting camera mount and usingthese photographs with the analytical plotter to construct maps andphotomosaics. The criteria for evaluation will be whether the mount isdurable, accurately holds and locates the camera, is stable and fast, andis compatible with the strike rail assembly. Photograph quality will bea major evaluation item.
Camera Rail
The camera rail is a hrizontal, graduated, aluminum rail on whichthe pivoting camera and right-angle laser goniometer are mounted. Therail will be mounted on a pair of tripods and will be oriented using thebeam from a laser theodolite. It will be oriented parallel to the driftcenterline at a height of approximately 1.46 m. The camera mount andright-angle laser goniometer will then slide along the rail during use.
The deliverable of this test il be a rapid, accurate, and easilytransportable camera rail with sufficient accuracy and stability forstereophotography for geologic mapping in the ES.
2.2 Secondary
Secondary deliverables consist of geologic mapping for theprototype controlled blasting investigation (previously known as themining demonstration test), WBS 1.2.6.9.4.3.1, and the prototype bulkpermeability test, WBS 1.2.6.9.4.2.10.
1.1-16l
NOV 4 1988
3.0 DESCRIPTION OF WORK
3.1 Management
Prototype testing for the underground geologic mapping methods isbeing done by personnel from two organizations: the USGS (E. Click, C.C. Barton, C. M. Fairer, and R. A. Thompson) and the USBR (M. H. McKeownand S. C. Beason). E. Glick is the Project Chief for the USGS geologyproject in the ESF. M. H. McKeown is the principal investigator for thegeologic tests for the ESF for the NNWSI. S. C. Beason, E. Click, and C.C. Barton are assigned to shaft prototype mapping methods. M. H. McKeownand C. M. Fairer are assigned to drift prototype mapping methods. R. A.Thompson manages the computer hardware and software for the project.
3.2 Experimental Configuration
The concept of close-range photogrammetric mapping underground inthe ESF has evolved during the course of ongoing work by the USGS andUSBR. At the present stage, shaft and drift mapping will use close-rangephotogrammetry to collect the bulk of geologic data. Conventionalunderground mapping methods will be used as a back-up system for thephotogrammetric mapping to avoid loss of data only in the event offailure of surveying or photographic equipment.
The photogrammetric geologic mapping method has the followingmajor advantages over conventional and/or photomosaic methods.
* The time required for mapping is significantly reduced usingphotogrammetry. Approximately 2 hr/round will be needed to domanual data gathering and stereophotography. Conventional mappingis estimated to require up to 8 hr/round, and the photomos.aicmethod would require approximately 4 hr/round.
* The accuracy of the photgrammetric method is inherently greaterthan that of conventional (sketch) mapping. With photogrammetry,accuracy is a function of survey accuracy and control pointquantity and not of artistic ability. The accuracy of thephotogrammetric method easily will be within 1 cm as compared withconventional mapping accuracy of approximately 15 cm.
* Reproducibility is much better using photogrammetry. A majorproblem with conventional mapping is consistency of resultsbetween geologists and over long time periods.
* An expandable data base is developed in the form of thestereophotographs acquired for photogrammetry. Analysis of thestereophotographs can be expanded after the shaft has been lined,whereas conventional mapping cannot be expanded or checked afterlining is complete (or the forms are set).
LLŽ3U
NOV 4 1988
* Personnel requirements using photogrammetry are significantly lessthan those for other methods. Not only are costs less butpersonnel problems are reduced.
* The cost of photogrammetric geologic mapping is significantly lessthan that of the other methods. A cost/benefit analysis indicatesa savings of up to approximately 5 million, mostly as a result ofthe reduction of contractor down time.
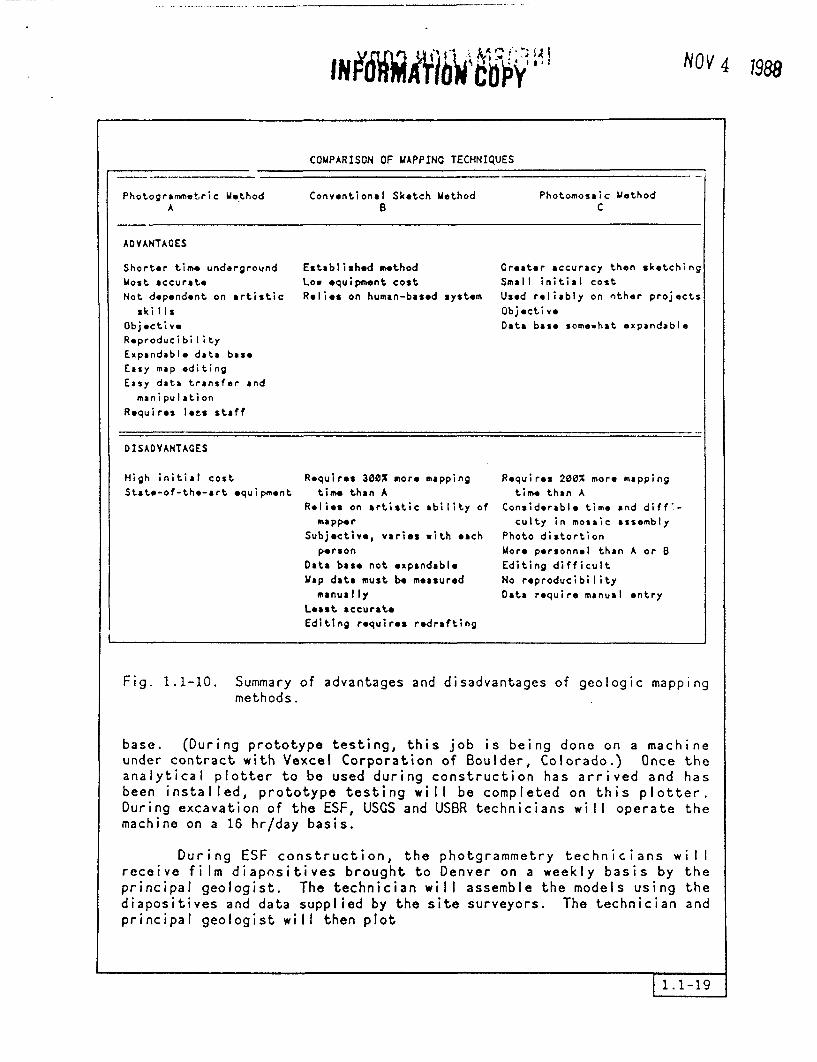
The above points summarize the major reasons why the USGS and USBR havechosen to concentrate on photogrammetric geologic mapping. Figure 1.1-10summarizes the advantages and disadvantages of the three methods. Athorough discussion of the different methods i described by Scott(1987).
Mapping n both the shaft and drifts will proceed at 2-mintervals. If excavation schedules make it more reasonable to mapseveral intervals during one underground period, such a schedule can beadopted.
Analytical Plotter
The photogrammetric mapping will utilize a computerized Kern DSR-11 analytical plotter (the Appendix provides an equipment list) . Theplotter will use 2-1/4- by 2-1/4-in. film diapositives of the shaft anddrift walls. The operator will trace fractures and stratigraphiccontacts directly from the photos. The analytical plotter uses adedicated Micro-VAX computer to determine the strike and dip ofstructural and stratigraphic features. For example, when a fracturesurface is traced by the cursor, the computer automatically digitizes thetrace in three-dimensional space. This set of digitized points is thenprocessed by the computer to determine strike and dip, fracture tracelength, and the location of the fracture in three-dimensional space.
After all fractures greater than 30 cm in length have been traced,the information can be developed by the computer into a full-peripherymap of the excavations at approximately 1:125 scale. Because the dataare stored digitally, map scale can-be changed easily and the map can bereplotted at any scale from 1:50 to 1:1000. The location of fracturessampled for aperture, roughness, and slickenside lineation pitch will bedigitized, along with locations of hand samples, fracture-fillingsamples, seeps (if present), and rock bolts.
In addition to full-periphery maps, the analytical plotter/computer system will be able to produce statistical compilations offracture data, such as stereonets, histograms, joint roses, and linegraphs.
One photogrammetry technician is needed to assemble models (aseries of photos tied together in three-dimensional space with correctionfor any photo distortion) and to trace geologic features onto the data
1.1-18
INMQAb a M"^ NOV 4 1988
COUPARISON OF MAPPING TECHNIQUES
Photogrammetric Method Conventional Sketch ethod Photomosaic MethodA B C
ADVANTAGES
Shorter time underground Established method Greater accuracy then sketchingMost accurate Low quipment cost Small initial cost
Not dependent on artistic Relies on human-based system Used reliably on ther projects
skil 1 s Objective
Objective Data base somewhat expandableReproducibility
Expandable data baseEasy map editing
Easy data transfer andmanipulation
Requires lets staff
DISADVANTAGES
High initial cost
State-of-the-art equipment
Requires 300X more mapping
time than A
Relies on artistic ability of
mapperSubjective, varies with each
person
Data base not expandable
Map data must be measured
manually
Least accurate
Editing requires redrafting
Requires 200x more mappingtime than A
Considerable time and dff7
culty in mosaic assembly
Photo distortion
More personnel than A or B
Editing difficult
No reproducibility
Data require manual entry
Fig. 1.1-10. Summary of advantages and disadvantages of geologic mappingmethods.
base. (During prototype testing, this job is being done on a machineunder contract with Vexcel Corporation of Boulder, Colorado.) Once theanalytical plotter to be used during construction has arrived and hasbeen installed, prototype testing will be completed on this plotter.During excavation of the ESF, USCS and USBR technicians will operate themachine on a 16 hr/day basis.
During ESF construction, the photgrammetry technicians willreceive film diapositives brought to Denver on a weekly basis by theprincipal geologist. The technician will assemble the models using thediapositives and data supplied by the site surveyors. The technician andprincipal geologist will then plot
INF9A~m^Wyv$9,&0 , P *,t1 fl} NoV4 1988
* all fracture traces longer than 30 cm,
* bedding or stratigraphic contacts (where visible),
* breccia zones,
* unique geologic features,
* hand sample locations,
* rock bolt locations, and
* photographic control point (survey target) locations.
The principal geologist, has been at raze site while the week'smapping has been done, will then edit the map. In addition, thegeologist will add whatever notes were taken in the field, such asstratigraphic or petrographic items, information regarding offset offaults, and character of fault breccias and gouge. When the geologist issatisfied with the map, the map data will be sent to the plotter toproduce a hard copy.
Camera
Pan Am will take stereophotographs for photogrammetry with aRollei 6006 camera equipped with a 40 mm calibrated lens and a graduatedReseau at in the focal plane. Under the supervision of the geologists,the camera will be used to photograph exposed rock surfaces in both theshaft and drifts.
In the shaft, the camera will be mounted on a telescoping camerapedestal. The pedestal will allow the camera to rotate 3600 around avertical axis with click stops every 60°. The calibrated lens has adiagonal field of view of approximately 90°. Vertical overlap to producea stereoscopic image is accomplished by raising the camera mount, takinga series of six photos, then lowering the mount and taking a second setof photos. Vertical overlap is used to avoid the distortion caused byhorizontal overlap on a curved surface.
In the drifts, the camera will be positioned on a horizontal raillocated in the center of the drift. The rail will be located using asurveying laser. The camera will be mounted on a pivoting camera mount,allowing the camera to rotate about a horizontal axis. Longitudinaloverlap will be used in the drifts to avoid the distortion that would becaused by the curved surfaces in the crown. The distance between ringsof photos (and consequently the amount of overlap) will be determinedduring prototype testing.
Electronic strobes will be used for lighting during photography.The specifications and configurations of the strobes will be determinedduring prototype testing.
1.1-20
IRRMM~W6 ^ to Stun NOV4 1988
Coniometer
USBR has constructed an instrument for obtaining the strike anddip of a geologic feature nonmagnetically. The goniometer is designed tobe used in conjunction with a radial arm strike rail assembly or strikerail. The base of the goniometer can be indexed to the azimuth of thestrike rail, and then the instrument is aligned with the geologicfeature. The strike and dip of the feature can then be read directlyfrom the instrument. The goniometer can be used to measure any planargeologic feature (with some exceptions) exposed in the excavation walls.The goniometer will be used only in the back-up technique if thephotogrammetry system performs as expected.
Laser Theodolite
Surveyors (H&N) will use a laser theodolite to locate threedimensionally photogrammetry control targets. The target locations willbe confirmed by a second survey done at the same time as the first toensure that coordinates are correct. This procedure is necessary toguarantee that no lss of data occurs after the shaft has been lined.
3.2.1 Shaft-Mapping Configuration
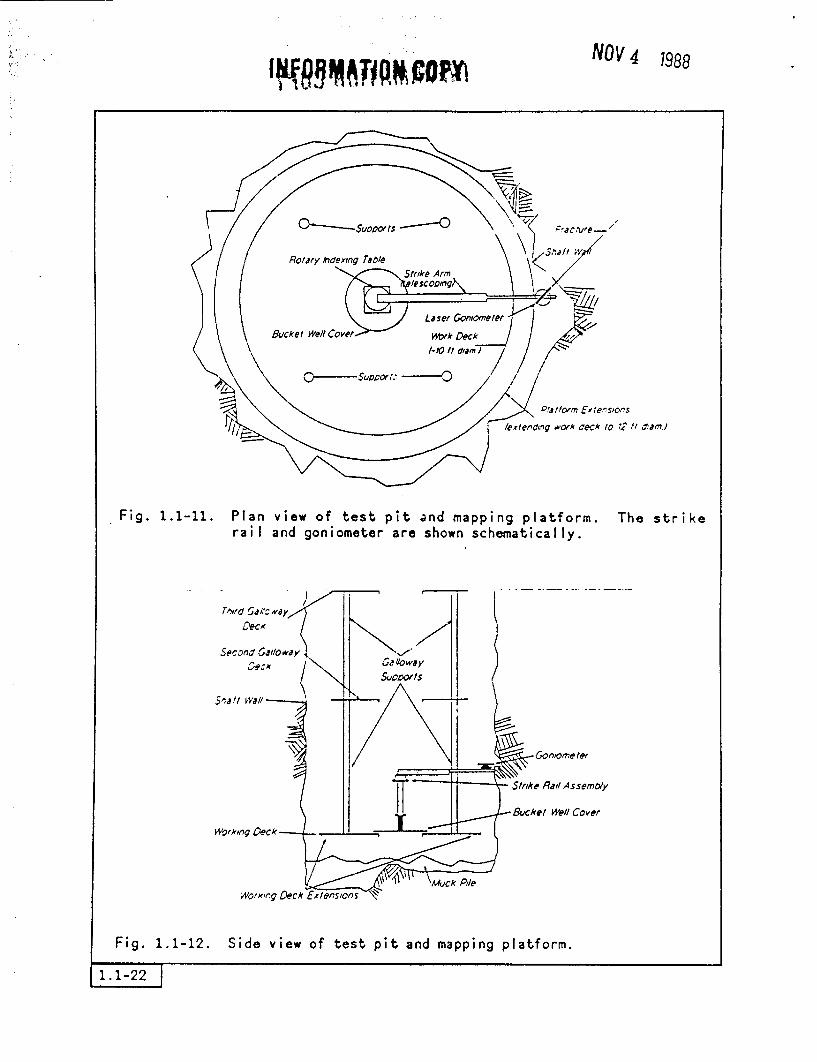
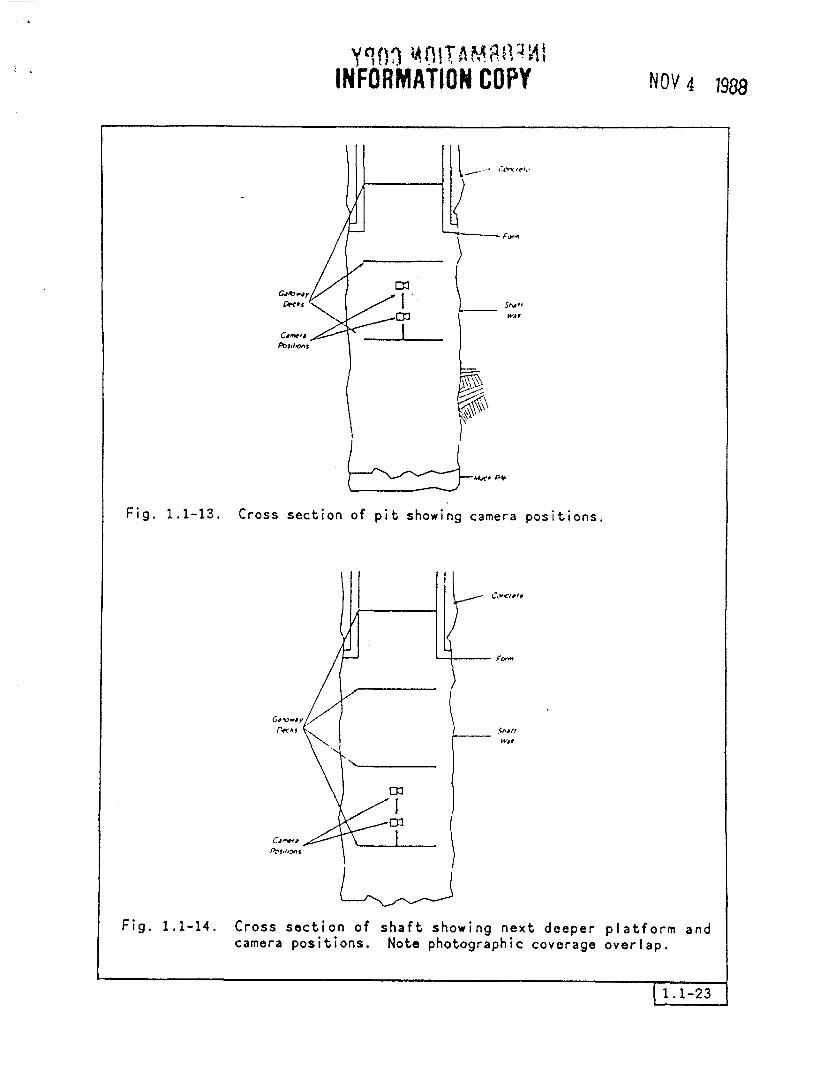
Full periphery, close-range photogrammetric geologic mapping isplanned as the primary method for mapping the shaft. The lower workingdeck of the Calloway will be used as a mapping platform. Thephotogrammetric method planned for shaft mapping uses the metric cameramounted on a vertical pedestal in the center of the mapping platform(Figs. 1.1-11 and 1.1-12). Primary photographic data will be taken bythe same type of camera as that used in the drifts: a camera with a2.25- x 2.25-in. format and a Rouseau plate. Three-dimensional controlfor the photogrammetric modeling will be established by survey targetsaffixed to the wall, which will appear in the photographs. Photographsof the entire shaft wall will be made in a clockwise direction, startingfrom the north. Overlap of the photographs will be about 10%horizontally. Vertical overlap of at least 60% will achievestereographic coverage. Contact color diapositives and color prints (9 x9 in.) will be made of each photograph. Figures 1.1-13 and 1.1-14 showphoto coverage and round overlap.
Structural data, such as slickenside lineations on faults, will bemeasured and recorded manually. Fracture coatings that can be datedisotopically will be collected underground. Representative lithologicsamples will also be collected underground. The locations of structuraldata points and samples will be identified by markers affixed to the walland recorded on the photographs.
The technique will use recommended international standards forrecording geologic features and characteristics (Brown, 1981).
Using the diapositives on a Kern DSR-11 analytical plotter, ageologist and a photogrammetry technician will produce a data base and a
11.1-21
I.
.: I
I{R!M~tyQG NO 41988
Xe>e Ptafform SEx1s0 2 is .
textepL14,79 or* oeckA to to tSa.
Fig. 1.1-11. Plan view of test pit and mapping platform.rail and goniometer are shown schematically.
The strike
Fig. 1.1-12. Side view of test pit and mapping platform.
yOf) tA,(TAMi
INFORMATION COPY NOV4 1988
SV ,,wit
Fig. 1.1-13. Cross section of pit showing camera positions.
(0,',
I
L"-��Fig. 1.1-14. Cross section of shaft showing next deeper platform and
camera positions. Note photographic coverage overlap.
1.1-23
INFORMATtON coPY NOV(I ?P ) -- } :ai- NOVI' 4 1988
map. These data will be stored on magnetic tape or disks. 'laps of thestructural and stratigraphic features and sample locations will beplotted by computer at desired scales. Statistical fracture data will becompiled by computer.
The conventional mapping (back-up) method wi I consist essental lyof the same survey and photographic steps as those used ir thephotogrammetric method. However, most of the geological data will becollected by measurements made at the shaft wall. Maps of the fractureswill be drawn by hand and/or from a mosaic of the photographs.
Equipment
Shaft Mapping Platform
A platform built to simulate the lower working floor of thecontractor's shaft-sinking Galloway will be used during prototype testingto test techniques and equipment. The platform is a mockup of the lowerCalloway floor, complete with bucket well and platform supports intendedto reproduce the configuration of obstructions that will be presentduring ESF shaft mapping. The platform is 12 ft in diameter,approximately 13 ft high, and weighs approximately 2700 lb. The platformis designed to be used in the circular test pits at Fran Ridge. Theplatform has been designed so that, with minor modification, it could besafely used during the collaring operation of the ESF to allow standardgeologic mapping before the contractor's Calloway is in place. Theprototype platform will not be used in ES-1 during standard shaft-sinkingoperations. All standard shaft-mapping' operations in the ESF will beperformed from the contractor's lower Calloway floor. The prototypeplatform permits testing and refinement of shaft-mapping equipment duringprototype testing.
Radial Arm Strike Rail Assembly
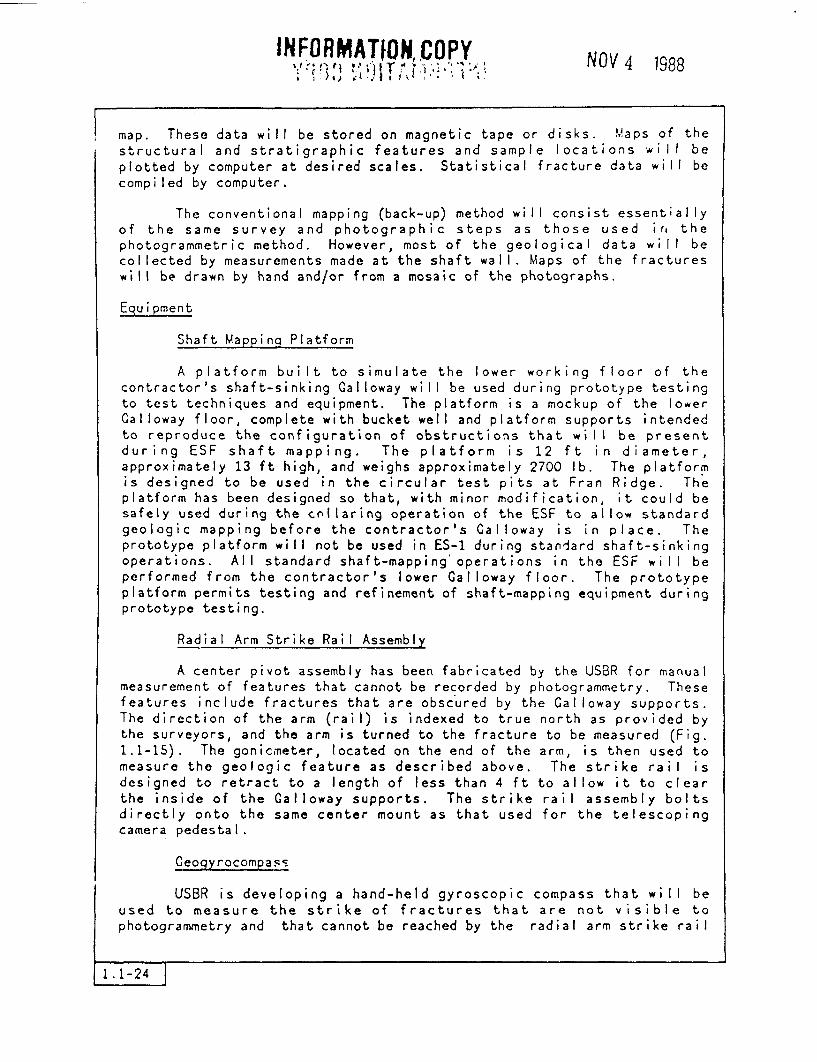
A center pivot assembly has been fabricated by the USSR for manualmeasurement of features that cannot be recorded by photogrammetry. Thesefeatures include fractures that are obsc'ured by the Galloway supports.The direction of the arm (rail) is indexed to true north as provided bythe surveyors, and the arm is turned to the fracture to be measured (Fig.1.1-15). The gonicmeter, located on the end of the arm, is then used tomeasure the geologic feature as described above. The strike rail isdesigned to retract to a length of less than 4 ft to allow it to clearthe inside of the Calloway supports. The strike rail assembly boltsdirectly onto the same center mount as that used for the telescopingcamera pedestal.
Ceogyrocompass
USBR is developing a hand-held gyroscopic compass that will beused to measure the strike of fractures that are not visible tophotogrammetry and that cannot be reached by the radial arm strike rail
1 .1-24
WNf0MATTItpN WPtY, NOV 4 1988
I .
/, I I\ ,
. ~~~ ~~ ,
0
'A;e JrM u3se.11?:i 'O ,'./,,r "
A, -
i'I I
/ /I
, -7 . -~~~~~~~~~~~~~~~~~
/ I X ' X I
Fig. 1.1-15. Angular relationship among the radial arm strike rail,goniometer, and fracture.
assembly. The gyrocompass may supplant the primary function of theradial arm strike rail assembly if the gyrocompass proves to be accurateand durable enough for underground use. The gyrocompass is an aircraftdirectional gyroscope mounted in a shock-absorbent case with an orientingsight on the top of the case. The gyrocompass is also equipped with asmall portable battery pack and coil cord for maximum versatilityunderground. It is expected to be accurate to ±20, with a drift of1-2°/hr of use. This unit can be used both for shaft and drift mapping.
3.2.2 Dri ft-Mapping Configuration
Plans for drift mapping are similar to those for shaft mappir.g;only differences in the configuration will be described here.
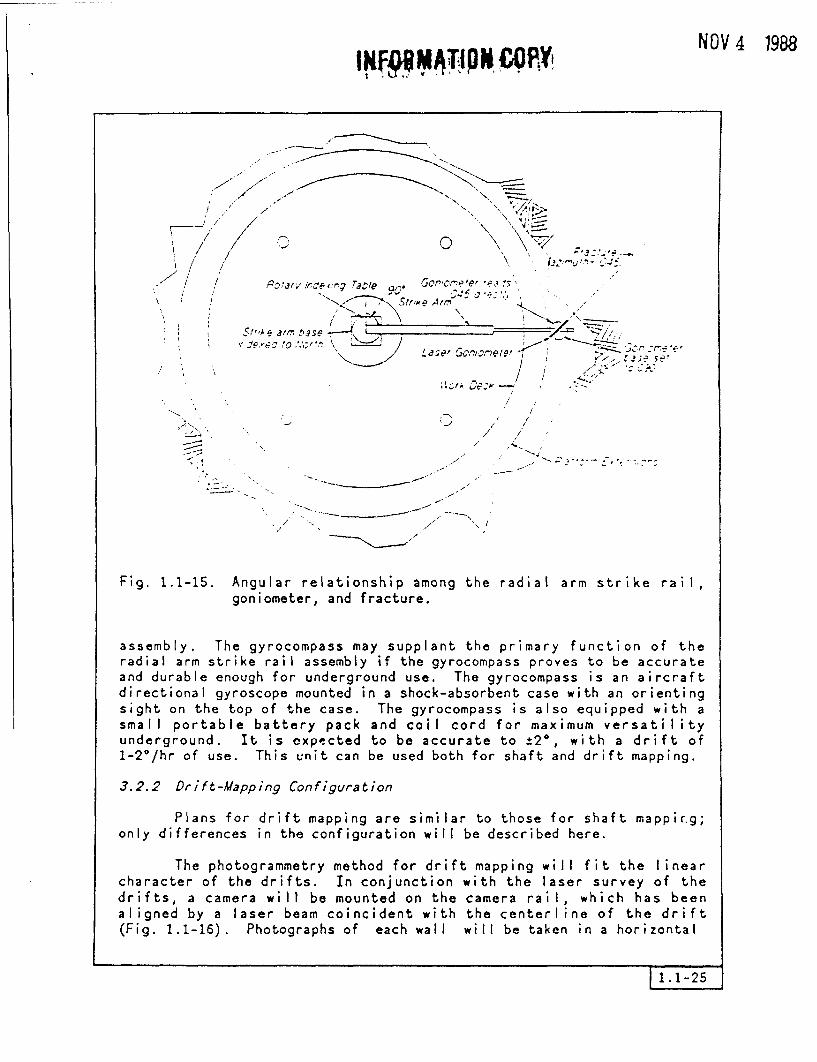
The photogrammetry method for drift mapping will fit the linearcharacter of the drifts. In conjunction with the laser survey of thedrifts, a camera will be mounted on the camera rail, which has beenaligned by a laser beam coincident with the centerline of the drift(Fig. 1.1-16). Photographs of each wall will be taken in a horizontal
1.1-25
MM MMA 6# NOV 4 1988
Fig. 1.1-16. Configuration of drift prototype test showing the cameramount on the camera rail. Horizontal stereoscopic overlapon a series of exposures will provide coverage for the 2-minterval mapped. Rotation of the camera in a verticalplane at 600 intervals will provide coverage of the roofand both walls.
direction, and photographs of the crown will be taken at 60° angles tocover each half of the crown.
As in the case of shaft mapping, the conventional mapping (back-up) method will consist essentially of the same survey and photographicsteps as those used in the photogrammetric method. However, most of thegeological data will be collected by measurements made at the drift wall.Maps of the fractures will be drawn by hand or from a mosaic of thephotographs.
M F6h 3- ffa tMrOPY NOV 4 1983
Equipment
Right-Angle Prism oniometer (Laser Deflectometer)
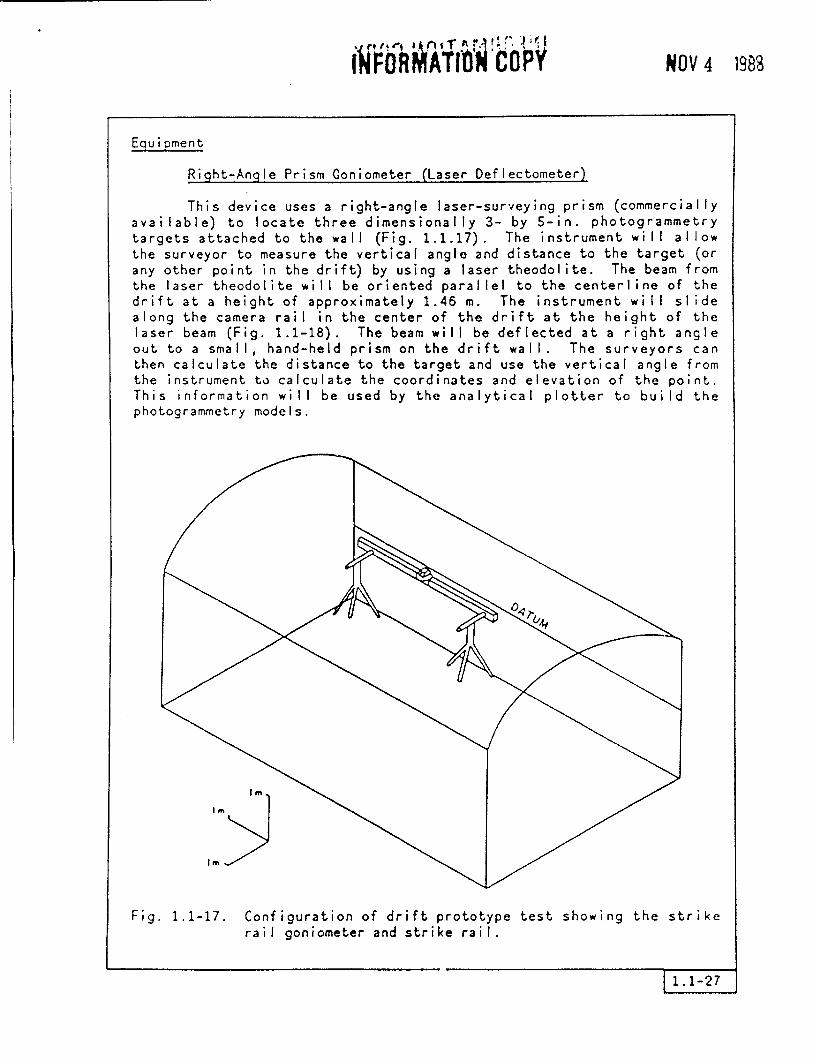
This device uses a right-angle laser-surveying prism (commerciallyavailable) to locate three dimensionally 3- by 5-in. photogrammetrytargets attached to the wall (Fig. 1.1.17). The instrument will allowthe surveyor to measure the vertical angle and distance to the target (orany other point in the drift) by using a laser theodolite. The beam fromthe laser theodolite will be oriented parallel to the centerline of thedrift at a height of approximately 1.46 m. The instrument will slidealong the camera rail in the center of the drift at the height of thelaser beam (Fig. 1.1-18). The beam will be deflected at a right angleout to a small, hand-held prism on the drift wall. The surveyors canthen calculate the distance to the target and use the vertical angle fromthe instrument to calculate the coordinates and elevation of the point.This information will be used by the analytical plotter to build thephotogrammetry models.
Fig. 1.1-17. Configuration of drift prototype test showing the strikerail goniometer and strike rail.
(I Wtt JTFIP iR P, Y1 NOV 4 1988
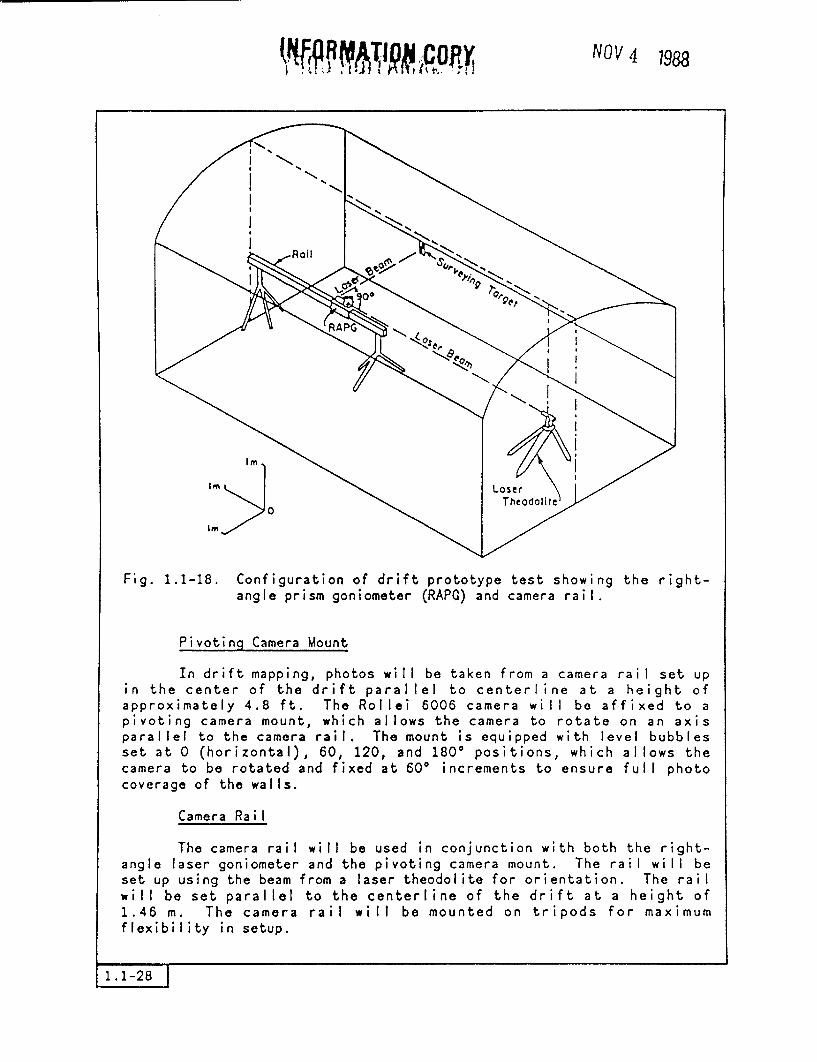
Fig. 1.1-18. Configuration of drift prototype test showing the right-angle prism goniometer (RAPG) and camera rail.
Pivoting Camera Mount
In drift mapping, photos will be taken from a camera rail set upin the center of the drift parallel to centerline at a height ofapproximately 4.8 ft. The Rollei 6006 camera will be affixed to apivoting camera mount, which allows the camera to rotate on an axisparallel to the camera rail. The mount is equipped with level bubblesset at 0 (horizontal), 60, 120, and 180° positions, which allows thecamera to be rotated and fixed at 600 increments to ensure full photocoverage of the walls.
Camera Rail
The camera rail will be used in conjunction with both the right-angle laser goniometer and the pivoting camera mount. The rail will beset up using the beam from a laser theodolite for orientation. The railwill be set parallel to the centerline of the drift at a height of1.46 m. The camera rail will be mounted on tripods for maximumflexibility in setup.
1.1-28
ANFRM^10X~b~ YNOV4 1988
3. 3 Unde-rground Test Methods
3.3.1 Shaft-Uapping /,ethods
Prototype testing that will involve coordination of activities ofsupport organizations with those of the USGS and USBR geologists aredescribed below. These activities include mapping platform testing,surveying and photographic prototype testing, prototype photogrammetricshaft mapping, prototype conventional shaft mapping, and test pitmapping.
Mapping Platform
A prototype model of the mapping platform has been designed byUSBR to meet the requirements of both the geologist and the shaftconstruction subcontractor. Meetings have been held with personnel ofthe USGS, USBR, HN, Fenix & Scisson (F&S), Pan Am, and REECo in aneffort to include all platform design needs.
Mapping Platform Construction
A prototype of the mapping platform has been constructed by USBRfor use in the ran Ridge test pits.
Mapping Platform Testing
Testing the platform will consist of several stages. First, theplatform must be lowered into position in the test pits and suspendedjust off the floor of the pit by REECo. Second, the platform must befixed against the walls of the shaft. Third, HN surveyors must surveythe azimuthal position of the platform. Fourth, the Pan Am photographersmust test the platform and appurtenances to be certain the design iscompatible with their needs. Finally, the USGS and USBR geologists musttest their mapping methods to be certain that platform design iscompatible with those methods. Procedures for cleaning the shaft wallswill not be tested in these pits. This test will be performed in theC-tunnel drifts, where better facilities exist.
Surveying and Photographic Prototype Testing
HAN will test the surveying equipment and techniques for locatingthe position of survey targets on the test pit walls. HN willdemonstrate the ability to locate and confirm the shaft working platformelevation, horizontal azimuth, and horizontal coordinates. USGS and USBRwill test camera mounts on the working platform in conjunction with PanAm; Pan Am also will test camera and film types and develop a plan forprocessing film. Pan Am must ensure that photos have been successfullyprocessed before shaft lining of each mined round occurs. This step isnecessary to prevent any loss of photogrammetry data. Pan Am is alsoresponsible for archive storage of the photographs.
1.1-29
INFORMATiOWCOPYb NOV 4 9S
PrototvDe Photoqrammetric Shaft Mapping
The method will consist of using vertically aligned pairs ofstereoscopic photographs taken at 2-m intervals in the pit. Close-rangegeologic photogrammetry and an analytical plotter will be used to map theintervals from the photographs. All attitudes of planar features will bedetermined in this fashion. Also, the ability of the analytical plotterto determine apertures and roughnesses of fractures will be tested.Geologists will test methods of measuring the attitudes of slickensidelineations using a portable gyroscopic compass and clinometer. They willalso collect pertinent notes to augment the photographic record and wi IIcollect samples of lithology and fracture-coating minerals.
Prototype Conventional Shaft Mapping
The back-up method will consist of the conventional full-peripherymethod of mapping by the USBR and USGS. Specifically, the geologistswill perform all the measuring tasks in the test pits. Photographs willbe taken by Pan Am to provide a mosaic to construct the map base. The onsite methods for measuring fracture roughness will necessitate thefabrication of a profilometer longer than the 15-cm-long shape copierpresently used to calibrate roughness. Several instruments will betested for measurement of apertures.
Test Pit Mapping
When the mapping techniques have been tested, all three of thetest pits will be mapped by USBR, F&S, and USGS geologists. A reportwill be prepared similar to those reports ultimately planned for the ESwork.
Areas of approximately 300 m2 (excluding the muck piles) will becleared with a fire hose or a blow pipe by FS geologists around each ofthe test pits to provide complete exposure of the rock surface. Thesesurfaces will be photographed and mapped. Maps will be horizontallycontinuous with the vertical maps of the pit walls. These maps willprovide valuable information on the relationship between vertical andhorizontal fractures and techniques for mapping excavation intersections.These relationships need to be tested to determine whether similarclearing and mapping should be done at the ES site.
3.3.2 Drift-Mapping Methods
Several aspects of prototype testing that involve coordination ofactivities of support organizations with those of the USGS and USBRgeologists are described below. These activities include wall-cleaningphotographic prototype testing, surveying prototype testing, photographicprototype testing, prototype photogrammetric drift mapping, and mappingof test drifts.
1.1-30
INFOIRM4TIOM CPpy NOV 4 1988
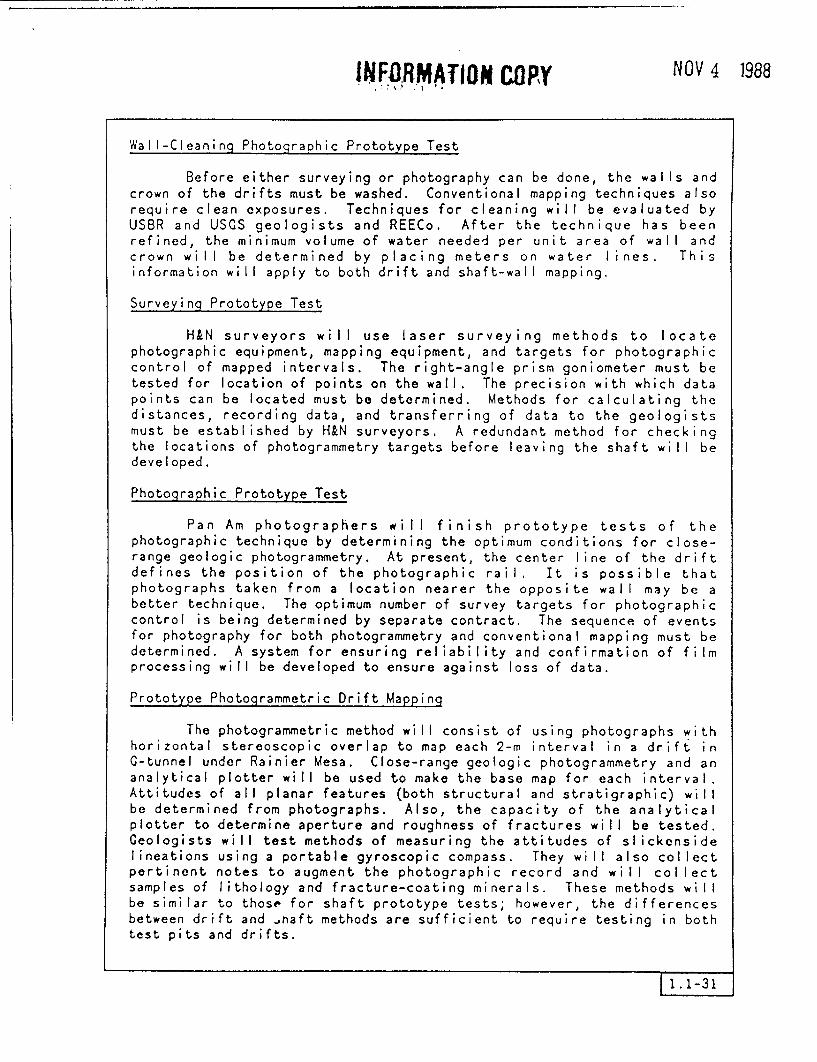
Wall-Cleaning Photographic Prototype Test
Before either surveying or photography can be done, the walls andcrown of the drifts must be washed. Conventional mapping techniques alsorequire clean xposures. Techniques for cleaning will be evaluated byUSBR and USGS geologists and REECo. After the technique has beenrefined, the minimum volume of water needed per unit area of wall andcrown will be determined by placing meters on water lines. Thisinformation will apply to both drift and shaft-wall mapping.
Surveying Prototype Test
HEN surveyors will use laser surveying methods to locatephotographic equipment, mapping equipment, and targets for photographiccontrol of mapped intervals. The right-angle prism goniometer must betested for location of points on the wall. The precision with which datapoints can be located must be determined. Methods for calculating thedistances, recording data, and transferring of data to the geologistsmust be established by HN surveyors. A redundant method for checkingthe locations of photogrammetry targets before leaving the shaft will bedeveloped.
Photographic Prototype Test
Pan Am photographers will finish prototype tests of thephotographic technique by determining the optimum conditions for close-range geologic photogrammetry. At present, the center line of the driftdefines the position of the photographic rail. It is possible thatphotographs taken from a location nearer the opposite wall may be abetter technique. The optimum number of survey targets for photographiccontrol is being determined by separate contract. The sequence of eventsfor photography for both photogrammetry and conventional mapping must bedetermined. A system for ensuring reliability and confirmation of filmprocessing will be developed to ensure against loss of data.
Prototype Photogrammetric Drift Mapping
The photogrammetric method will consist of using photographs withhorizontal stereoscopic overlap to map each 2-m interval in a drift inC-tunnel under Rainier Mesa. Close-range geologic photogrammetry and ananalytical plotter will be used to make the base map for each interval.Attitudes of all planar features (both structural and stratigraphic) willbe determined from photographs. Also, the capacity of the analyticalplotter to determine aperture and roughness of fractures will be tested.Geologists will test methods of measuring the attitudes of slickensidelineations using a portable gyroscopic compass. They will also collectpertinent notes to augment the photographic record and will collectsamples of lithology and fracture-coating minerals. These methods willbe similar to those for shaft prototype tests; however, the differencesbetween drift and naft methods are sufficient to require testing in bothtest pits and drifts.
fNFORMAtt10 Ski NOV 4 1988
Test Drift Mappinq
When the mapping techniques have been tested, the entire sectionof drift will be mapped and a report will be prepared similar to thosereports ultimately planned for the exploratory drift work in the ESF.Also, USBR, USGS, and FS geologists will map the controlled blastingexcavation and bulk permeability room in -tunnel.
3.4 Data Analjysis
Several facets of data analysis are being tested. These facetsinclude analysis of fracture data to produce maps, graphs, stereographicplots, and histograms. At the heart of data analysis is the creation ofthe software to produce these graphical displays at the scales andformats that will be most useful to present the results of geologicalmapping. Statistical analysis of data is important because of the need toevaluate very large quantities of data in a meaningful way.
The following data analysis tasks need to be accomplished:
* determine how fracture trace lengths should be calculated,
* determine how the abundance and types of fracture intersectionsshould be expressed,
* solve the remaining problems in the expression of fractureroughness,
* solve the remaining problems in the expression of fractureaperture,
* determine how structural domain data will be defined andexpressed,
* determine how fracture analysis will be done and expressed,
* develop a method to integrate existing software and software underdevelopment with the DSR-11 analytical plotter, -
* develop a data base management system for geographic informationobtained from the DSR-11 and a method for integration with adescriptive information data base,
* determine what map scales will be used, and
* determine what publication and reproduction problems exist formaps and statistical displays and what solutions will be used.
1.1-32
NFORMATIA 'y NOV 4 988
4.0 QUALITY ASSURANCE LEVEL
This work has been approved as QA Level III in accordance withNNWSI-QALA-6941G-01 (Scott et al., 1986).
5.0 OPERATIONS
5. 1 List of Act ivities
5.1.1 Underground Tests
Installing Work Platform in Test PitsPrototype Test of Surveying TechniquesDesign and Construction of Specialized
Surveying Apparatus for Shaft and DriftMapping
Prototype Tests of Photogrammetric Mappingfor Shaft and Drift Mapping
Prototype Tests of Conventional Mapping forShaft and Drift Mapping
Clearing of Area Surrounding Test PitsMapping of Areas Surrounding Test PitsMapping Test Pits, Test Drifts, and
Prototype Test Areas for Other TestsSurvey Targets on Test Pit Walls from
Platform and Within Test DriftsPhotographing of Test Pit Walls from Platform
and Test Drift Walls
REECoH&N
USGS, USBR
USSR, USGS
USSR,USBR,USGS,
USGSUSGS,USBR,
F&SF&S
USBR, USGS, FS
H&N
Pan Am
5.1.2 Data Analysis
Making Map Using Analytical PlotterMeasurement of Orientation; Aperture, and
Roughness of Fractures Using AnalyticalPlotter
Development of Computerized Data Base SystemDevelopment of Computer Programs for Data
Analysis Including Stereonets, Histograms,Curve Fitting, and Fracture Analysis
USGS, USBR
USGS,USCS
USSR
USGS
5.2 Changes in Experimenta l Procedures
Changes in experimental procedures occur as the result ofprototype testing. After the results of a step have been studied,further experimental procedures can be defined for the subsequent step.Changes are expected to occur until the geologists performing prototypetesting have determined that the mapping techniques have beensuccessfully defined.
1.1-33
INFORMATION COPY NOV 4 1988
6.0 DATA ACQUISITION SYSTEM
Geologic data will be collected in the ESF using several methods,including laser surveys, photography, on site measurement by geologists,and geological measurements from photographs. The primary method to beused will be close-range geologic photogrammetry. The degree ofdependence on measurements from photographs will be a function of thesuccess of photogrammetry. Conventional mapping methods, with dependenceon on site measurements, are intended to be a back-up method.
6.1 Shaft Mapping
Most of the mapping in the shaft will be done from a mappingplatform either consisting of or suspended from the contractor's workingdeck, The location system for the shaft will be an azimuthal system.This coordinate system will be established by HN laser survey.Stereographic photographs will be taken from the platform for each round,maintaining 60% vertical overlap at all times. The negatives will beimmediately processed aboveground to ensure both quality production andarchival records.
Detailed fracture maps will then be made from the photographsusing a Kern DSR-11 analytical plotter. The plotter allows the operatornot only to plot the trace of the fracture but also to determine strike,dip, and possibly aperture and roughness. The analytical plotter willutilize a dedicated Micro-VAX computer and flatbed plotter. The exactmodels of these and other peripherals are described in the appendix.
A back-up data acquisition system will be developed duringprototype testing to be used in case of temporary failure of the primarysystem. This system will consist of a photographic mosaic utilizing manyof the same procedures used for the photogrammetry, with the fracturesurfaces being manually traced from the photos by a geologist ortechnician.
In addition to geologic data collected by conventional mappingmethods and data processed by the analytical plotter, samples ofrepresentative lithologies and fracture coatings will be collected by thegeologist for each mapped blast round. Sample localities will be shownon the photographs by location cards and will be shown on the fracturetrace maps.
6.2 Drift Mapping
Data acquisition in the drifts will be essentially identical tothat of the shaft, with only minor procedural differences caused by thehorizontal orientation of the drifts and linear coordinate systems.Photographs will be taken in a manner similar to that of the shaft, using60% horizontal overlap to allow sterographic photogrammetry. As in theshaft, the geologist will also manually collect some geologic data, withthe fracture tracing done on the Kern SR-11 analytical plotter. Drift
1. 1-34
NOV 4 1988
IN'sOR'9ATION' C'OPY"
mapping will also have a back-up technique consisting of a photographicmosaic method.
7.0 PERSONNEL QUALIFICATIONS
Quality Assurance Level III does not require formal certificationof project personnel; however, personnel involved in this testing arecertified.
8.0 NONCONFORMANCE ACTIONS
Nonconformance of QA Level III items or processes will bedocumented, and corrective action will be documented in compliance withQMP 16.01 of the NNWSI-USGS-QA Manual.
9.0 DOCUMENTATION
9.1 Field Notebooks
All data collected in written form will be kept in approvednotebooks in accordance with standard practice. Data acquisition formswill be used for easier and more efficient recording of information andQA.
9.2 Analysis Notebooks
All data analysis will be documented in notebooks in accordancewith standard practice.
9.3 Photographs
All photographs will be kept in indexed photo albums.
9.4 Data Storage
All data produced by the analytical plotter and entered manuallyfrom field sheets will be stored on magnetic tape or disk for permanentstorage. The possibility of using a compact disc format for archivalstorage of data will be investigated during prototype testing.
10.0 SAFETY
There are no special safety problems associated with theperformance of tasks performed during geologic studies. All work will becarried out in accordance with applicable site requirements.
11.1-35
INFORMATIONCO~Y NO/ 4 98
11.0 MILESTONES AND REPORTS
The results of prototype testing will be presented in reports onthe following subjects:
* photogrammetry decision (Appendix),
* methods for photogrammetric mapping,
* methods for conventional mapping (back-up method), and
* test shaft and drift report.
These reports or milestones are shown on the testing schedule forprototype geologic investigations (Fig. 1.1-7).
12.0 REFERENCES
Brown, E. T. (ed.), 1981. Rock Characterization Testing and MonitoringISRM Suggested Methods, Pergammon Press, pp. 3-52.
Cregger, D. M., 1986. "Shaft Construction in Crystalline Rock," Bulletinof the Association of Engineering Geologists, Vol . XXIII, pp. 287-295.
Curry, Sean, 1986. Evaluation of the Potential of Close-rangePhotogrammetry for Tunnel Mapping at the Nevada Test Site, VexelTechnical Report 08-04-86, 42 p.
Dueholm, K. S., 1979. "Geologic and Topographic Mapping from AerialPhotographs, eological and Topographic Mapping From Aerial Photographs,"The Institute of Surveying and Photogrammetry, DTH, Meddelesle Nr. 10,pp. 1-146.
Dueholm, K. S., 1981. "Computer-Supported Geological Photointerpreta-tion." Photogrammetria, Vol. 36, pp. 173-181.
Dueholm, K. S., A. K. Pedersen, and F. Ulff-Moller, 1977. "High-Precision Photogrammetric Methods Used in Geological Mapping," Rapp.Cronlands Ceol. Unders. nr. 81, pp. 53-56.
Goodman, R. E., 1976. Methods of eologic Engineering in DiscontinuousRocks, West Publishing Co., pp. 112-121.
Hatheway, A. W., 1982. "Trench, Shaft, and Tunnel Mapping," Bulletin ofthe Association of Engineering Ceologists, Vol . XIX, pp. 173-180.
Pillmore, C. L., 1959. Application of High Order Stereoscopic PlottingInstruments to Photogeologic Studies, Bulletin 1043-b, U.S. GeologicalSurvey, pp. 23-34.
1.1-36 1
INFORMATION COPY NOV 4 1988
Pillmore, C. L., K. S. Dueholm, H. S. Jepson, and C. H."Computer-Assisted Photogrammetric Mapping SystStudies--Progress Report," Photogrammetria, Vol.reprinted from: F. Ackerman (ed.), Internation0Photogrammetry, Vol. 23, pt. B-2, pp. 195-205.
Schuch, 1980.for eologicp. 159-171,
I Archives of
Scott, R. B., 1987. "Comparison of the Benefits of Photogrammetric,Photomosaic, and Conventional Mapping of Underground Geologic Features."
Scott, R. B., C. C. Barton, S. C. Beason, C. M. Fairer, and R. A.Thompson, NNWSI Project, USGS SIP (site investigation plan), 1986.'Prototype Testing of eologic Studies of the Exploratory Shaft Faciliy,USCS-SIP-6941G-01, RO.
U.S. Army, 1970. Geologic Mapping of Tunnels and Shafts, TechnicalLetter No. 1110-1-37, Office of the Chief of Engineers, EngineeringGeologists, Washington, DC.
� i �'; j � -C � pl, '� . , )" :j � �I , I I � f - 1 " r
" I . . � I II , 4�1 i�
I
1.1-38 1
APPENDIX

I
INFORMATION COPY NO 4 1988
I tem
DSR-12
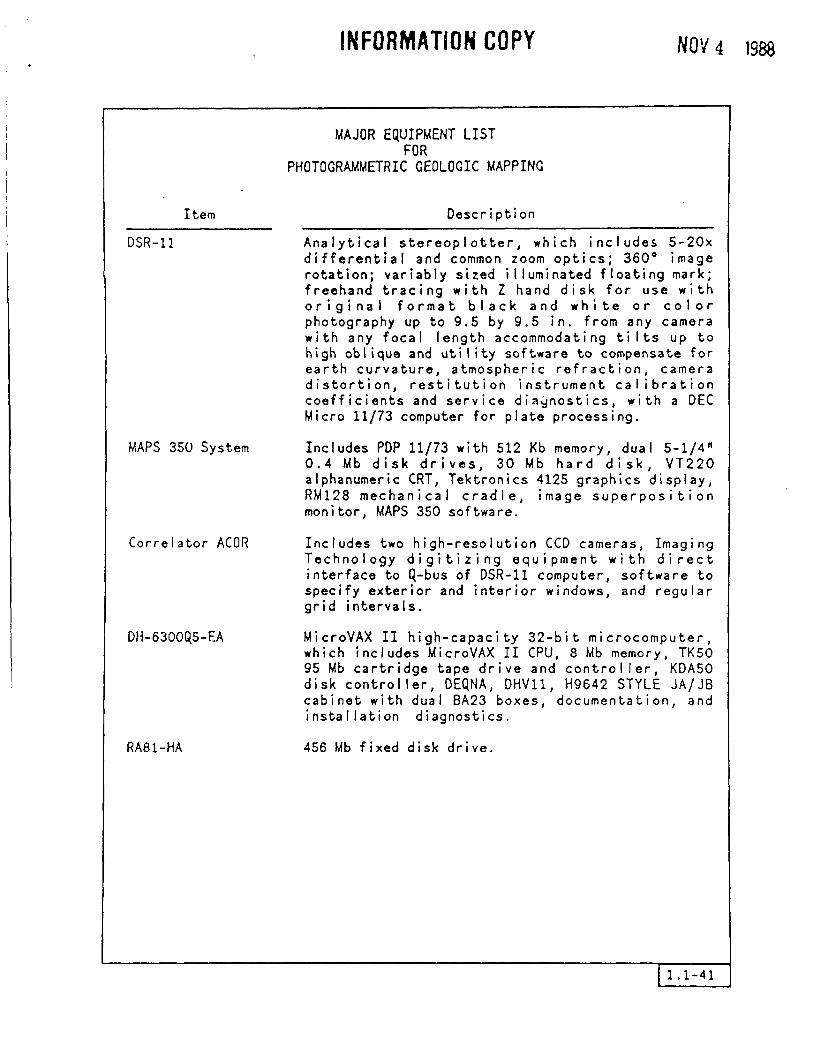
MAJOR EQUIPMENT LISTFOR
PHOTOGRAMMETRIC GEOLOGIC MAPPING
Description
Analytical stereoplotter, which includes -20xdifferential and common zoom optics; 360° imagerotation; variably sized illuminated floating mark;freehand tracing with Z hand disk for use withoriginal format black and white or colorphotography up to 9.5 by 9.5 in. from any camerawith any focal length accommodating tilts up tohigh oblique and utility software to compensate forearth curvature, atmospheric refraction, cameradistortion, restitution instrument calibrationcoefficients and service diagnostics, with a DECMicro 11/73 computer for plate processing.
MAPS 350 System
Correlator ACOR
DH-6300Q5-FA
RA81-HA
Includes PP 11/73 with 512 Kb memory, dual 5-1/4'0.4 Mb disk drives, 30 Mb hard disk, VT220alphanumeric CRT, Tektronics 4125 graphics display,RM128 mechanical cradle, image superpositionmonitor, MAPS 350 software.
Includes two high-resolution CCD cameras, ImagingTechnology digitizing equipment with directinterface to Q-bus of DSR-11 computer, software tospecify exterior and interior windows, and regulargrid intervals.
MicroVAX II high-capacity 32-bit microcomputer,which includes MicroVAX II CPU, 8 Mb memory, TK5095 Mb cartridge tape drive and controller, KDASOdisk controller, DEQNA, DHV11, H9642 STYLE JA/JBcabinet with dual BA23 boxes, documentation, andinstallation diagnostics.
456 Mb fixed disk drive.
1.1-41